View - UNEP/GRID-Sioux Falls
View - UNEP/GRID-Sioux Falls
View - UNEP/GRID-Sioux Falls

Create successful ePaper yourself
Turn your PDF publications into a flip-book with our unique Google optimized e-Paper software.
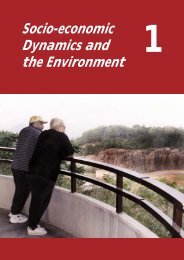
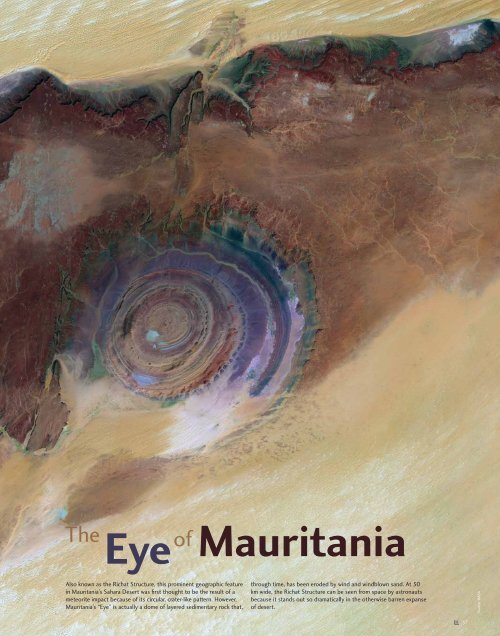
The<br />
Eyeof Mauritania<br />
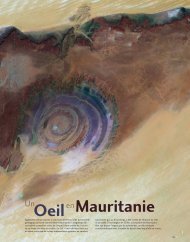
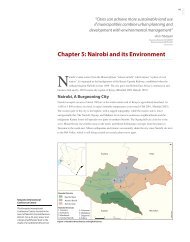
Also known as the Richat Structure, this prominent geographic feature<br />
in Mauritania’s Sahara Desert was fi rst thought to be the result of a<br />
meteorite impact because of its circular, crater-like pattern. However,<br />
Mauritania’s “Eye” is actually a dome of layered sedimentary rock that,<br />
through time, has been eroded by wind and windblown sand. At 50<br />
km wide, the Richat Structure can be seen from space by astronauts<br />
because it stands out so dramatically in the otherwise barren expanse<br />
of desert.<br />
<br />
37<br />
Source: NASA
38 <br />
A man singing by himself on the Jemaa Fna Square, Morocco<br />
Charles Roff ey/Flickr.com
CAPE VERDE<br />
"<br />
Praia<br />
Chapter Transboundary Environmental Issues<br />
2<br />
GAMBIA<br />
Dakar<br />
"<br />
GUINEA-BISSAU<br />
Banjul<br />
"<br />
"<br />
Nouakchott<br />
SENEGAL<br />
Bissau<br />
"<br />
SIERRA LEONE<br />
WESTERN<br />
SAHARA<br />
MAURITANIA<br />
Conakry<br />
"<br />
Freetown<br />
"<br />
GUINEA<br />
Monrovia<br />
"<br />
LIBERIA<br />
Bamako "<br />
"<br />
Rabat<br />
MOROCCO<br />
COTE D’IVORE<br />
"<br />
Yamoussoukro<br />
MALI<br />
Ouagadougou<br />
"<br />
BURKINA FASO<br />
Accra<br />
"<br />
Across Country Borders<br />
BENIN<br />
TOGO<br />
"<br />
Algiers<br />
ALGERIA<br />
Niamey<br />
"<br />
"<br />
"<br />
Lome<br />
Porto Novo<br />
SAO TOME<br />
AND PRINCIPE<br />
EQUATORIAL<br />
GUINEA<br />
NIGERIA<br />
Politically, the African continent is divided into 53 countries<br />
and one “non-self-governing territory.” Ecologically,<br />
Africa is home to eight major biomes— large and distinct<br />
biotic communities— whose characteristic assemblages<br />
of fl ora and fauna are in many cases transboundary in<br />
nature, in that they cross political borders. Most of the<br />
continent’s major rivers and many of its large bodies of<br />
water are also transboundary features of the landscape.<br />
For example, nine countries lie within the Congo River<br />
basin and ten countries share the Nile River Basin (FAO<br />
1997). The transboundary nature of these and many other<br />
ecosystems, together with the natural resources they<br />
contain, is the source of diverse environmental issues and<br />
presents unique management challenges throughout<br />
Africa and, in some cases, beyond the continent itself.<br />
GHANA<br />
"<br />
Tunis<br />
"<br />
Tripoli<br />
Ndjamena<br />
"<br />
Cairo<br />
"<br />
Khartoum<br />
"<br />
"<br />
Asmara<br />
" "<br />
Abuja<br />
Addis Ababa<br />
Malabo Yaounde<br />
"<br />
"<br />
Bangui<br />
"<br />
" " Libreville<br />
Kampala<br />
"<br />
Sao Tome<br />
TUNISIA<br />
NIGER<br />
CAMEROON<br />
GABON<br />
LIBYAN ARAB JAMAHIRIYA<br />
Brazzaville<br />
"<br />
Kinshasa<br />
" Luanda<br />
CONGO<br />
ANGOLA<br />
Windhoek<br />
"<br />
NAMIBIA<br />
CHAD<br />
CENTRAL AFRICAN REPUBLIC<br />
DEMOCRATIC REPUBLIC<br />
OF THE CONGO<br />
BOTSWANA<br />
Gaborone<br />
"<br />
SOUTH AFRICA<br />
RWANDA<br />
BURUNDI<br />
ZAMBIA<br />
Maseru<br />
"<br />
EGYPT<br />
SUDAN<br />
Lusaka<br />
"<br />
Kigali<br />
"<br />
Bujumbura<br />
"<br />
Harare<br />
"<br />
ZIMBABWE<br />
Tswane<br />
"<br />
Mbabane<br />
"<br />
UGANDA<br />
UNITED REPUBLIC<br />
OF TANZANIA<br />
Lilongwe<br />
"<br />
Maputo<br />
"<br />
MALAWI<br />
LESOTHO<br />
Nairobi<br />
"<br />
" Dodoma<br />
SWAZILAND<br />
ERITREA<br />
ETHIOPIA<br />
KENYA<br />
MOZAMBIQUE<br />
Moroni<br />
"<br />
" Djibouti<br />
Mogadishu<br />
"<br />
Antananarivo<br />
"<br />
Political Map of Africa<br />
Elevation<br />
(Metres)<br />
2 000<br />
1 000<br />
600<br />
300<br />
DJIBOUTI<br />
COMOROS<br />
SOMALIA<br />
MADAGASCAR<br />
"<br />
SEYCHELLES<br />
Capital City<br />
River<br />
Lake<br />
National<br />
Boundary<br />
<br />
39<br />
Port Louis<br />
MAURITIUS<br />
<strong>UNEP</strong>/<strong>GRID</strong><br />
0 625 1 250<br />
Kilometre<br />
"
40 <br />
Hippos in the Maasai Mara National Reserve, Kenya<br />
Given that transboundary environmental issues involve more<br />
than one nation, they are often addressed using varying political<br />
and management approaches that employ different laws and<br />
regulations (Gauthier and others 2003). The sustainable use of<br />
natural resources such as those derived from forest ecosystems<br />
and the monitoring, management, and conservation of fl ora and<br />
fauna shared by various countries, are problems of major concern<br />
in Africa. Efforts have been made to introduce management<br />
mechanisms that involve some international cooperation,<br />
especially in regard to transboundary waterways. But there are<br />
inadequacies in such mechanisms when it comes to dealing with<br />
many of Africa’s other shared resources, such as forest belts and<br />
protected areas.<br />
Environmental problems and the impact they have on people<br />
and their livelihoods are often similar among neighbouring<br />
African landscape<br />
countries. In many cases, regional approaches to these problems<br />
are advantageous. In some cases, cooperation across country<br />
borders is essential to solve specifi c problems. Examples of<br />
problems where a cooperative regional approach is vital and<br />
can benefi t all parties include: the protection of crucial habitats<br />
shared by two or more countries; the protection and management<br />
of water resources that lie or fl ow across borders; and the<br />
integrated management of invasive, non-native species.<br />
This chapter presents examples of four transboundary issues of<br />
importance to Africa:<br />
1. Transboundary ecosystems and protected areas;<br />
2. Transboundary water resources;<br />
3. Transboundary movement of people; and<br />
4. Transboundary movement of pollutants.<br />
Christian Lambrechts/<strong>UNEP</strong><br />
Christian Lambrecht/<strong>UNEP</strong>
CAPE VERDE<br />
GAMBIA<br />
GUINEA-BISSAU<br />
SENEGAL<br />
SIERRA LEONE<br />
WESTERN<br />
SAHARA<br />
MAURITANIA<br />
GUINEA<br />
LIBERIA<br />
MOROCCO<br />
COTE D’IVORE<br />
MALI<br />
BURKINA FASO<br />
GHANA<br />
ALGERIA<br />
TOGO<br />
BENIN<br />
SAO TOME<br />
AND PRINCIPE<br />
2.1 Transboundary Ecosystems and Protected Areas<br />
EQUATORIAL<br />
GUINEA<br />
NIGERIA<br />
TUNISIA<br />
CAMEROON<br />
GABON<br />
Ecosystems and<br />
Protected Areas<br />
A transboundary ecosystem is an area of land and/or<br />
sea that straddles one or more boundaries between<br />
states, sub-national units such as provinces and regions,<br />
autonomous areas and/or areas beyond the limits of<br />
national sovereignty or jurisdiction. The Congo Basin forests<br />
ecosystem, shared by six countries, is a striking example of a<br />
transboundary ecosystem on the African continent.<br />
When the constituent parts of transboundary<br />
ecosystems are especially dedicated to the protection<br />
and maintenance of biological diversity, natural and<br />
associated cultural resources, and are managed cooperatively<br />
through legal or other effective means, they<br />
are called transboundary protected areas (<strong>UNEP</strong>-WCMC<br />
2007; Sandwith and others 2001). In the absence of shared<br />
management, they are called internationally adjoining<br />
protected areas. Africa has several large transboundary<br />
protected areas where two or more countries participate<br />
in managing the areas’ valuable resources. Conserving<br />
shared resources in such settings requires characterizing<br />
and quantifying threats to those resources and devising<br />
strategies to address concerns that transcend political and<br />
cultural differences (Gauthier and others 2003). Examples of<br />
transboundary protected areas in Africa include Nyungwe Forest<br />
(Rwanda)/Kibira National Park (Burundi); Great Limpopo<br />
Transfrontier Park (South Africa, Zimbabwe, and Mozabique);<br />
and The W-Arly-Pendjari complex in Benin, Burkina Faso, and<br />
Niger.<br />
NIGER<br />
LIBYAN ARAB JAMAHIRIYA<br />
CONGO<br />
ANGOLA<br />
CHAD<br />
CENTRAL AFRICAN REPUBLIC<br />
NAMIBIA<br />
DEMOCRATIC REPUBLIC<br />
OF THE CONGO<br />
BOTSWANA<br />
SOUTH AFRICA<br />
EGYPT<br />
RWANDA<br />
ZAMBIA<br />
SUDAN<br />
BURUNDI<br />
ZIMBABWE<br />
UGANDA<br />
UNITED REPUBLIC<br />
OF TANZANIA<br />
LESOTHO<br />
MALAWI<br />
MOZAMBIQUE<br />
SWAZILAND<br />
ERITREA<br />
ETHIOPIA<br />
KENYA<br />
DJIBOUTI<br />
SOMALIA<br />
COMOROS<br />
Elevation<br />
(Metres)<br />
MADAGASCAR<br />
600<br />
300<br />
SEYCHELLES<br />
Transboundary<br />
Protected Area<br />
2000<br />
1000<br />
<br />
41<br />
MAURITIUS<br />
Transboundary or<br />
Internationally Adjoining<br />
Protected Areas<br />
0 625 1 250<br />
Kilometres<br />
N<br />
<strong>UNEP</strong>/<strong>GRID</strong> - Modifi ed from <strong>UNEP</strong>-WCMC 2001
42 <br />
Transboundary Ecosystems<br />
The Congo Basin Forests<br />
After the Amazonian forests of South America,<br />
the forests of Africa’s Congo Basin constitute<br />
the second largest area of dense tropical<br />
rain forest in the world. Congo Basin forests<br />
form a transboundary ecosystem shared by<br />
Cameroon, Central African Republic, Republic<br />
of Congo, Equatorial Guinea, Gabon, and<br />
Democratic Republic of the Congo. This<br />
immense, biologically diverse ecosystem<br />
ranges from the Gulf of Guinea in the west<br />
to the mountains of the Albertine Rift near<br />
the eastern border of Democratic Republic of<br />
the Congo and spans about seven degrees of<br />
latitude on either side of the equator. Congo<br />
Basin forests constitute over 80 per cent of<br />
the total area of the Guinea-Congo forest<br />
structure and include the Afromontane forests<br />
in western Cameroon and eastern Democratic<br />
Republic of the Congo (CARPE 2006). Table 2.1 compares forest<br />
area in each of the six countries that share the Congo Basin<br />
forests transboundary ecosystem.<br />
The dense rain forests of the Congo Basin were once among<br />
the most pristine on Earth. However, the relatively recent<br />
expansion of industrial logging and the networks of roads that<br />
accompany it are now threatening the future of this important<br />
and unique ecosystem.<br />
About 60 per cent of the total forest area in the Congo Basin<br />
is considered to be industrially exploitable. The area allocated<br />
to logging has increased signifi cantly in the last few years. In<br />
2004, for example, the area allocated to logging throughout the<br />
Congo Basin forest ecosystem was 494 000 km² (CARPE 2006).<br />
By contrast, in 2007, more than 600 000 km² were under logging<br />
concessions (Laporte and others 2007).<br />
Important impacts of logging in this transboundary ecosystem<br />
include alteration of ecosystem composition and biodiversity, the<br />
opening up of remote areas to poaching, and the modifi cation of<br />
many other functional ecosystem attributes (Laporte and<br />
others 2007).<br />
In addition to industrial timber harvesting, other activities or<br />
events are negatively impacting the Congo Basin forest ecosystem.<br />
These include the production of palm oil, immigration,<br />
population growth, commercial hunting, growing access to<br />
distant markets, and road construction. Together with logging,<br />
these activities have overwhelmed traditional systems of natural<br />
resource management (CARPE 2006).<br />
Furthermore, the construction of railways and road networks<br />
for the extraction and removal of natural resources has strongly<br />
infl uenced the distribution of human populations within and<br />
around the Congo Basin forests. In many places, intensive<br />
permanent agriculture has replaced the forest ecosystem.<br />
Vast expanse of jungle, Democratic Republic of the Congo<br />
Nigeria<br />
Equatorial<br />
Guinea<br />
Gabon<br />
2<br />
Intact Forest (>500km )<br />
2<br />
Intact Forest (
Nyungwe Forest, Rwanda<br />
Transboundary Protected Areas<br />
In total, Africa contains 3 044 protected areas (<strong>UNEP</strong>-WCMC<br />
2007), including 198 Marine Protected Areas, 50 Biosphere<br />
Reserves, and 80 Wetlands of International Importance. For the<br />
purpose of this Atlas, the term transboundary protected areas<br />
describes protected areas shared by two or more countries,<br />
irrespective of the nature of collaboration.<br />
The African continent is home to some of the richest and most<br />
biologically diverse habitats in the world. Africa’s amazing animal<br />
populations are truly among the wonders of the world and from an<br />
ecological standpoint, endow the continent with special distinction.<br />
Yet these enormously rich natural resources are in jeopardy due<br />
to habitat destruction, poaching, burgeoning rural populations,<br />
urbanisation, and changes in land use. Thus, protected areas are<br />
extremely important for the safe-guarding and preservation of<br />
Africa’s wildlife and the biodiversity of its ecosystems.<br />
The importance of transboundary protected areas is especially<br />
obvious for migratory species. For example, thousands of bird<br />
species migrate across Africa performing a north-south, often<br />
cross-equatorial, seasonal migration between northern subtropical<br />
breeding grounds and southern homes. Thus, distinct and separate<br />
ecosystems can be linked by the migratory species that travel back<br />
and forth between them (<strong>UNEP</strong> 2006b).<br />
Major migratory bird routes of the world<br />
Major Migratory Bird Routes<br />
Kilometres<br />
0 2 500 5 000<br />
Nyungwe Forest in Rwanda<br />
contains 980 km2 of tropical<br />
montane forest, and is<br />
contiguous with the Kibira<br />
National Park in Burundi.<br />
Combined, these two<br />
protected areas form the<br />
largest block of forest in East<br />
Africa. It lies at an altitude<br />
between 1 500 and 2 300 m.<br />
N<br />
DEMOCRATIC REPUBLIC<br />
OF THE CONGO<br />
0 10 20 Kilometres<br />
Other Protected Areas<br />
RWANDA<br />
Country Boundary<br />
Kibira and Nyungwe Forests<br />
Nyungwe<br />
BURUNDI<br />
Migratory birds and other migratory animals are a signifi cant<br />
component of transboundary environmental resources. The<br />
destruction or degradation of one or more of the ecosystems along<br />
a migration route can threaten the survival of migrating species.<br />
The map below illustrates global migratory bird routes and shows<br />
that Africa has the highest concentration of such routes. Where<br />
ecosystems along migration routes are formally protected, Africa’s<br />
migratory birds have the greatest chance for survival.<br />
Kibira<br />
Rusizi<br />
<strong>UNEP</strong>/<strong>GRID</strong><br />
<strong>UNEP</strong>/<strong>GRID</strong> – Data Source: Perrins and Elphick 2003<br />
43<br />
Jon and Melanie Kots/Flickr.com
44 <br />
Migrating wildebeest crossing a river, Kenya<br />
Maasai Mara – Serengeti Protected Areas in East Africa<br />
Kenya’s Maasai Mara Game Reserve and United Republic<br />
Map of the study area<br />
of Tanzania’s Serengeti National Park are two neighboring<br />
transboundary protected areas endowed with diverse fauna and<br />
AFRICA<br />
fl ora, including vast herds of seasonally migrating wildebeest<br />
Lake Victoria<br />
UGANDA<br />
KENYA<br />
(Connochaetes taurinus). As the seasons progress in this East<br />
African savannah ecosystem, thousands of wildebeest, as well as<br />
Lake Victoria<br />
other herbivores such as zebras (Equus burchelli), progressively<br />
migrate to greener pastures throughout the ecosystem. Predators<br />
follow the wildebeest migration closely, as the herds make their<br />
way into different territories. Timing of the wildebeest migration<br />
is linked to rainfall and other seasonal changes and is therefore<br />
slightly different from year to year (Douglas and others 2004).<br />
Generally, calving takes place in the eastern Serengeti between<br />
January and mid-March; by June the herds begin heading toward<br />
the western Serengeti and ultimately northward, toward Maasai<br />
UNITED REPUBLIC<br />
OF TANZANIA<br />
Mara (Go2Africa 2003).<br />
UNITED REPUBLIC<br />
In January 2006, widespread drought in East Africa due to<br />
the late arrival of seasonal rains severely affected wildlife in<br />
the Serengeti and Maasai Mara protected areas. The drought<br />
partially disrupted the migration of more than 1.5 million<br />
OF TANZANIA<br />
wildebeest, zebras, and other herbivores from Maasai Mara to<br />
Game Reserve<br />
Serengeti (Ngowi 2006). In the pair of satellite images below,<br />
National Park<br />
the contrast between the relatively lush vegetation of January<br />
2005 and the barren, parched landscape of January 2006 reveals<br />
Country Boundary<br />
Park/Reserve Boundary<br />
Kilometres<br />
the intensity and extent of the drought. Lake Eyasi and Lake<br />
Manyara, visible in the lower right-hand corner of each image,<br />
were almost completely dry in 2006. The East African drought<br />
of 2006 underscored the need for cooperative natural resource<br />
management strategies between countries sharing transboundaryprotected<br />
areas, which are home to migratory species.<br />
0 10 20<br />
Lake<br />
Victoria<br />
Kilometres<br />
0 20 40<br />
Maasai Mara<br />
Game Reserve<br />
Serengeti<br />
National Park<br />
United Republic<br />
of Tanzania<br />
Lake<br />
Eyasi<br />
Kenya<br />
Lake<br />
Manyara<br />
12 Jan 2005<br />
N<br />
NASA<br />
June<br />
July<br />
KENYA<br />
August - October<br />
Serengeti<br />
National Park<br />
December - May<br />
Maasai Mara<br />
Game Reserve<br />
November<br />
Every year, herds of wildebeest, zebra, and other herbivores migrate in a<br />
clockwise fashion along a migratory route between the Serengeti National Park<br />
in United Republic of Tanzania and the Maasai Mara Game Reserve in Kenya.<br />
A pair of images comparing green vegetation in 2005 to the parched, brown<br />
landscape in 2006 (NASA 2006a)<br />
Lake<br />
Victoria<br />
0 20 40 Kilometres<br />
Maasai Mara<br />
Game Reserve<br />
Serengeti<br />
National Park<br />
Kenya<br />
United Republic<br />
of Tanzania<br />
Lake<br />
Eyasi<br />
Lake<br />
Manyara<br />
09 Jan 2006<br />
N<br />
N<br />
<strong>UNEP</strong>/<strong>GRID</strong><br />
NASA<br />
Flickr.com
W-Arly-Pendjari Parks Complex<br />
The W-Arly-Pendjari (WAP) Parks Complex straddles the countries<br />
of Benin, Burkina Faso, and Niger, and is one of the largest<br />
contiguous protected areas in Africa. The “W” portion of the<br />
Complex’s name comes from the angular “W” path followed by the<br />
Niger River as it fl ows through the northern foothills of Benin’s<br />
Atakora Mountains. The WAP Parks Complex is a mix of terrestrial,<br />
semi-aquatic, and aquatic ecosystems and home to more than half<br />
of West Africa’s elephant population. Furthermore, WAP is the<br />
only natural refuge remaining for most of the vulnerable and/or<br />
threatened animal species in Benin, Burkina Faso, and Niger.<br />
Land cover changes around the W-Arly-Pendjari Complex<br />
Areas surrounding parts of the WAP Complex are undergoing<br />
signifi cant land-use and land-cover change. One of the most<br />
striking examples of change is in northern Benin, where the<br />
growth of the so-called “cotton belt” has markedly altered the<br />
natural vegetation over the last 20 years. During this time,<br />
protected lands of the Complex have become almost completely<br />
Table 2.2 – Land use/ land cover changes in the areas surrounding<br />
the parks (1975-2002)<br />
1975 2002 Increases<br />
(km2 ) (km2 ) (%)<br />
Agriculture - Intensive 2 813 4 997 78<br />
Agriculture - Mosaic 3 600 5 644 57<br />
Degraded savannahs 3 281 4 264 30<br />
Savannahs 10 059 4 924 -51<br />
Source: Eva and others 2006<br />
Zebra and wildebeest in Great Limpopo Park<br />
The Great Limpopo Transfrontier Park<br />
The Great Limpopo Transfrontier Park (GLTP) is Africa’s largest<br />
transboundary protected area. The GLTP is formed by South<br />
Africa’s Kruger National Park, Mozambique’s Limpopo National<br />
Park, and Zimbabwe’s Gonarezhou National Park and is jointly<br />
managed by all three countries (AWF 2003). The GLTP covers<br />
35 000 km² and is centred on the point where its three<br />
components meet along the Limpopo River.<br />
Geographically, the main landscapes in the GLTP are: a<br />
lowland plains savannah ecosystem with a somewhat hilly granite<br />
plateau in the western portions; the Lebombo Mountains that rise<br />
to an average of only 500 m above sea level and follow the border<br />
between South Africa and Zimbabwe; and fl oodplains along the<br />
Save, Changane, Limpopo, Olifants, Shingwedzi, and Komati<br />
Rivers (SANParks 2007).<br />
The GLTP brings together some of the best and most<br />
established protected areas for wildlife in southern Africa. It<br />
is home to important populations of endangered elephants,<br />
black rhinoceroses, and wild dogs, as well as vulnerable species<br />
such as lions, leopards, giraffes, buffaloes, and numerous types<br />
© Kim Wolhuter/Wildcast.net<br />
Map of the study area<br />
0<br />
AFRICA<br />
Burkina Faso<br />
Togo<br />
Singou<br />
Pama Arly<br />
Kilometres<br />
20 40<br />
Niger<br />
Benin<br />
Madjoari<br />
Pendjari<br />
BURKINA FASO<br />
Arly<br />
Pendjari<br />
National Park<br />
Kourtiagou<br />
Atakora<br />
Tamou<br />
W (Niger)<br />
NIGER<br />
W<br />
(Burkina Faso) W (Benin)<br />
BENIN<br />
Partial Reserve<br />
National Park<br />
Country Boundary<br />
Park/Reserve Boundary<br />
Djona<br />
surrounded by agricultural lands, reducing biodiversity and<br />
increasing potential contact between humans and wildlife. As the<br />
availability of natural resources in non-protected areas dwindles,<br />
the protected areas, as the sole remaining repositories of fuelwood,<br />
forage, and bush meat in the region, increasingly are becoming<br />
a focus for poaching, illegal cattle grazing, and other human<br />
activities that impact the sustainability of this part of the WAP<br />
Complex (Eva and others 2006).<br />
Map of the study area<br />
Zimbabwe<br />
Botswana<br />
Mozambique<br />
0<br />
South<br />
Africa<br />
Swaziland<br />
SOUTH AFRICA<br />
Kilometres<br />
25 50<br />
AFRICA<br />
ZIMBABWE<br />
Sengwe<br />
Corridor<br />
Kruger<br />
National Park<br />
Gonarezhou<br />
National Park<br />
Limpopo<br />
National Park<br />
MOZAMBIQUE<br />
Country Boundary<br />
Great Limpopo<br />
Transfrontier park<br />
Other Protected Areas<br />
Indian<br />
Ocean<br />
of antelope (MSN Encarta 2007). GLTP’s wildlife population<br />
includes at least 147 mammal species, 116 reptile species, 49<br />
species of fi sh, 34 frog species, and an extraordinary 500 or more<br />
species of birds. In addition, at least 2 000 plant species have been<br />
identifi ed (SANParks 2007). The GLTP is an example of a recent<br />
success in establishing transboundary conservation and peace<br />
parks, and is characterized by a diverse array of natural resource<br />
management approaches (Rogers 2005).<br />
N<br />
<strong>UNEP</strong>/<strong>GRID</strong><br />
N<br />
<strong>UNEP</strong>/<strong>GRID</strong><br />
45
46 <br />
Gorilla in Volcanoes National Park, Rwanda<br />
Mountain Gorilla Conservation in the<br />
Virunga Heartland<br />
The Virunga Heartland in the central Albertine Rift region of<br />
east-central Africa spans the borders of Democratic Republic of<br />
the Congo, Rwanda, and Uganda. It includes the World Heritage<br />
site of Virunga National Park (Africa’s oldest National Park)<br />
and supports lush Afromontane forests. Here, volcanic highland<br />
mountains shelter the last of the world’s mountain gorillas<br />
(Gorilla beringei beringei). Chimpanzees, golden monkeys, forest<br />
elephants, and a rich variety of birds, reptiles, and amphibians<br />
also share this incredibly biodiverse ecosystem. Because Virunga<br />
Heartland encompasses parts of three countries, transboundary<br />
natural resource management is critical to maintaining landscape<br />
integrity. However, joint management efforts have suffered since<br />
1990 due to war and political unrest in the region.<br />
Historically, poaching, the spread of disease, and habitat<br />
loss from population pressures and civil unrest have threatened<br />
mountain gorillas in Virunga’s forests. However, due to antipoaching<br />
efforts and a unique gorilla-based ecotourism scheme,<br />
Gazelle, kob, and tiang<br />
Southern Sudan: A Survival Surprise<br />
Southern Sudan covers an area of 582 759 km2 and sits between<br />
the Sahara Desert and Africa’s belt of tropical forests. Wildlife<br />
biologists have long recognized that grasslands, woodlands, and<br />
swamps in southern Sudan are home to elephants, zebras, giraffes,<br />
and other animals.<br />
Before the civil war (1983-2005), a 1982 survey showed<br />
an estimated 900 000 white-eared kob (Kobus kob)—a kind of<br />
antelope—migrating to southern Sudan from bordering areas.<br />
Recently, the fi rst aerial survey of southern Sudan in 25 years<br />
revealed that vast migrating herds have managed to survive over<br />
20 years of civil war. In this new survey, biologists estimated 1.3<br />
million kob, tiang, and gazelle in their research area, a number<br />
that may even surpass the Serengeti’s herds of wildebeest, long<br />
considered to be the world’s biggest migration of mammals.<br />
Estimates include 250 000 Mongalla gazelle, 160 000 tiang,<br />
13 000 reedbuck, 8 900 buffalo, and 2 800 ostrich. Other animals<br />
such as elephants, ostriches, lions, leopards, hippos, and buffalo<br />
are also thriving in parts of southern Sudan. In addition several<br />
East African oryx (Oryx beisa), a species thought to be extinct in<br />
Darren Kumasawa/Flickr.com<br />
Paul Elkan and J. Michael Fay/National Geographic<br />
Map of the study area<br />
the Virunga gorilla population increased by 17 per cent between<br />
1988 and 2003. Together with the 320 gorillas living in the Bwindi<br />
Impenetrable National Park in Uganda, the total number of<br />
mountain gorillas is now approximately 700.<br />
Nevertheless, despite reasons for optimism, death and<br />
extinction are constant threats to the mountain gorillas. In 2007,<br />
seven mountain gorillas were killed; four of these deaths occurred<br />
in the Virunga region. The continued slaughter of these critically<br />
endangered primates demonstrates the challenges faced by<br />
gorilla preservation programmes and the urgent need to improve<br />
transboundary park management in this region of Africa.<br />
Sources: McCrummen 2007, MSNBC 2007, WWF 2007<br />
0<br />
<br />
<br />
Legend<br />
Lakes<br />
Protected Area<br />
NP National Park<br />
Kilometres<br />
0 10 20<br />
<br />
<br />
<br />
150<br />
<br />
<br />
Kilometres<br />
300<br />
Lake Kivu<br />
Map of the study area<br />
<br />
<br />
Lake Rutanzige<br />
<br />
<br />
<br />
<br />
<br />
<br />
this region, were seen here. On the other hand, some species<br />
in southern Sudan are faring badly. For example, the recent<br />
survey revealed no zebras in Boma National Park and only a few<br />
elsewhere in the region, compared to the estimated 20 000 in<br />
Boma tallied during the 1982 survey.<br />
<br />
<br />
<br />
Source: WCS 2007, Pilkington 2007, Mongabay 2007<br />
<br />
<br />
<br />
<br />
Kigezi<br />
<br />
<br />
<br />
¯<br />
<br />
<strong>UNEP</strong>/<strong>GRID</strong><br />
<strong>UNEP</strong>/<strong>GRID</strong><br />
¯
7<br />
1<br />
9, 10, 11<br />
12, 13<br />
14, 15<br />
59<br />
16, 17, 18<br />
58<br />
19<br />
57<br />
Transboundary River Basins 30<br />
Worldwide, there are 263 transboundary<br />
31<br />
river basins, which can be defi ned as river<br />
basins shared by two or more riparian states.<br />
Approximately 60 per cent of the world’s<br />
population depends on these international water<br />
systems (UNU 2006). Transboundary river basins<br />
are also important because of the complex natural<br />
ecosystems they support. But the potential increase<br />
33<br />
in confl icts over shared water resources and the<br />
effects of climate change represent signifi cant social,<br />
34<br />
economic, and environmental threats. In addition,<br />
there is a growing danger to human health from<br />
inadequate or unsafe water supplies(<strong>UNEP</strong> 2006a).<br />
Africa’s 59 international transboundary river basins<br />
cover about 64 per cent of the continent’s land area and<br />
contain 93 per cent of its total surface water resources. They<br />
are also home to some 77 per cent of the African population.<br />
The Nile River Basin is the most densely populated river basin<br />
in all of Africa. Fifteen principal lakes and 24 main watersheds<br />
also cross the political boundaries of two or more countries in<br />
Africa (<strong>UNEP</strong> 2006b). The catchment areas of the 17 largest<br />
river and lake basins on the continent exceed 100 000 km2 in size<br />
(UNU 2006). Africa also has 38 transboundary aquifer systems,<br />
about which little is known.<br />
Most Africans live in rural areas and are still heavily dependent<br />
on agriculture for their livelihoods, making water a vital economic<br />
and social commodity. Along with a growing population, the<br />
extreme variability of rainfall on Africa’s landscapes—from arid<br />
20, 21<br />
55, 56<br />
22<br />
27, 28<br />
25<br />
23<br />
54<br />
26<br />
29<br />
24<br />
2.2 Transboundary Water Resources<br />
32<br />
35<br />
36<br />
43<br />
37<br />
50<br />
41<br />
52 53<br />
49<br />
38, 39<br />
42<br />
48<br />
46<br />
47<br />
45<br />
1. Atui<br />
2. Senegal<br />
3. Gambia<br />
4. Geba<br />
5. Corubal<br />
6. Great Scarcies<br />
7. Little Scarcies<br />
8. Moa<br />
9. Mana-Morro<br />
10. Loffa<br />
11. St. Paul<br />
12. St. John<br />
13. Cestos<br />
14. Cavally<br />
15. Sassandra<br />
16. Komoe<br />
17. Bia<br />
18. Tano<br />
19. Volta<br />
20. Mono<br />
21. Oueme<br />
22. Niger<br />
23. Cross<br />
24. Lake Chad<br />
25. Akpa<br />
26. Benito-Ntem<br />
27. Utamboni<br />
28. Mbe<br />
29. Ogooue<br />
30. Nyanga<br />
Transboundary River Basin<br />
31. Chiloango<br />
32. Congo<br />
33. Kunene<br />
34. Cuvelai/Etosha<br />
35. Okavango<br />
36. Orange<br />
37. Limpompo<br />
38. Maputo<br />
39. Umbeluzi<br />
40. Incomati<br />
41. Sabi<br />
42. Buzi<br />
43. Zambezi<br />
44. Ruvuma<br />
45. Umba<br />
46. lake Natron<br />
47. Juba-Shibeli<br />
48. Lake Turkana<br />
49. Lotagipi Swamp<br />
50. Nile<br />
51. Awash<br />
52. Gash<br />
53. Baraka<br />
54. Medjerda<br />
55. Tafna<br />
56. Oued Bon Naima<br />
57. Guir<br />
58. Daoura<br />
59. Dra<br />
Transboundary River Basin Shared by More Than Six Countries<br />
Country Boundary<br />
0 625 1 250<br />
Kilometres<br />
northern and southern regions to the continent’s belt of tropical<br />
forests—poses many challenges to providing safe drinking<br />
water and sanitation for millions of people. Consequently,<br />
transboundary water resource management requires an enabling<br />
environment that encourages cooperation on numerous fronts.<br />
<br />
47<br />
<strong>UNEP</strong>/<strong>GRID</strong> Data Source: USGS 1998
48 <br />
Water hyacinth growing near a dock, Lake Victoria, Kenya<br />
Lake Victoria: Africa’s Largest Freshwater Lake<br />
Lake Victoria is Africa’s largest, and the world’s second-largest,<br />
freshwater lake. It has a total catchment of about 250 000 km², of<br />
which 68 870 km² is the actual lake surface (URT 2001). Located<br />
in the upper reaches of the Nile River Basin in East Africa, the<br />
waters of Lake Victoria are shared by Kenya, Uganda, and United<br />
Republic of Tanzania. Lake Victoria faces myriad environmental<br />
problems, including invasive species, water quality, and fl uctuating<br />
water levels.<br />
In the 105-year history of accurate water-level measurements<br />
on Lake Victoria (measured at Jinja, Uganda), levels have<br />
fl uctuated widely. In 1961 and 1962, for example, heavy rains<br />
drove water levels up by an astounding two metres. Since then,<br />
levels have been generally declining over time. In December<br />
Historical water level elevations of Lake Victoria<br />
High population growth around Lake Victoria<br />
In a 100-km radius around Lake Victoria,<br />
population is increasing at a higher rate than<br />
the continental average. At the same time, there<br />
has been a long-term decline in the Lake’s water<br />
levels (<strong>UNEP</strong> 2006b). This pattern of increasing<br />
population and decreasing water resources is<br />
a source of concern for East African countries<br />
bordering Lake Victoria, as well as those in the<br />
Nile River Basin.<br />
USDA 2005<br />
<br />
<br />
2005, water levels dropped to an all-time low of 10.89 m (NASA<br />
2006a), a fi gure confi rmed by satellite measurements of the lake’s<br />
elevation. In the past few years, water levels have increased slightly.<br />
Height variations in Lake Victoria<br />
<br />
<br />
Lake Victoria<br />
<br />
<br />
Kilometres<br />
0 70 140<br />
<br />
2005<br />
<br />
<br />
Population Density<br />
(people/km 2)<br />
High (>100)<br />
Medium (25–100)<br />
Low (
Images showing increased siltation and suspended sediments<br />
Lake Victoria’s Winam Gulf<br />
Winam Gulf is a large arm of Lake Victoria that extends east into<br />
Kenya. The Gulf is roughly 100 km from east to west and 50 km<br />
from north to south, with a shoreline measuring about 550 km.<br />
The Gulf is relatively shallow, with a recorded average depth of six<br />
metres (Osumo 2001).<br />
Like Lake Victoria of which it is part, Winam Gulf faces<br />
numerous environmental challenges. These include, but are<br />
not limited to, siltation, sedimentation, toxic contamination,<br />
and eutrophication. The underlying force of change is explosive<br />
population growth in the lake’s basin, along with associated<br />
farming practices and urbanisation. Four major rivers—Sondu-<br />
Miriu, Kibos, Nyando, and Kisat—discharge an average of<br />
231 m3 of water per second into the Gulf (Osumo 2001).<br />
Untreated sewage and wastewater from surrounding towns and<br />
organic and inorganic nutrients washed down from cultivated<br />
areas fl ow fi rst into these rivers, and then into the Gulf. In<br />
addition, excessive soil erosion in parts of the lake’s catchment<br />
has led to heavy siltation and sedimentation in certain areas,<br />
especially in the Winam Gulf. The above images show increased<br />
siltation and suspended sediments in the Winam Gulf waters<br />
between 8 March 1986 (upper left) and 5 February 2001 (upper<br />
right). Highly affected areas appear in red while least affected<br />
areas are blue.<br />
When water hyacinth (Eichhornia crassipes) invaded Lake<br />
Victoria in the 1990s, Winam Gulf was one of the most severely<br />
affected regions. As much as 17 231 hectares of the Gulf’s surface<br />
were covered by the plant. By 2000, however, the area invaded by<br />
water hyacinth had been reduced by control measures to about<br />
500 hectares. Five years later, as the December 2005 satellite image<br />
(below left) shows, the Gulf appeared to be essentially free of the<br />
17 Dec 2005<br />
08 Mar 1986<br />
Images showing water hyacinth choked bays<br />
Winam Gulf<br />
Kisumu<br />
Suspended Sediments<br />
and Siltation<br />
High<br />
Low<br />
Kilometres<br />
0 7.5<br />
Eugene Apindi/<strong>UNEP</strong>/<strong>GRID</strong>-<strong>Sioux</strong> <strong>Falls</strong><br />
Map of the study area<br />
UGANDA<br />
<br />
<br />
plant. Approximately one year later, however, unusually heavy<br />
rains fl ooded the rivers that fl ow into the Gulf, which in turn<br />
raised Gulf water levels and contributed nutrient-rich sediment<br />
to the aquatic environment. As a result, water hyacinth quickly<br />
reinvaded the Gulf, as the 2006 satellite image (below<br />
right) shows.<br />
18 Dec 2006<br />
Musoma<br />
Mbale<br />
UNITED REPUBLIC<br />
OF TANZANIA<br />
<br />
Winam Gulf<br />
N N<br />
05 Feb 2001<br />
Kisumu<br />
Water Hyacinth<br />
KENYA<br />
Kisumu<br />
Suspended Sediments<br />
and Siltation<br />
High<br />
Low<br />
Kilometres<br />
0 7.5<br />
¯<br />
0 30 60 Kilometres<br />
Eugene Apindi/<strong>UNEP</strong>/<strong>GRID</strong>-<strong>Sioux</strong> <strong>Falls</strong><br />
<br />
49
50 <br />
Water Hyacinth in Lake Victoria, 1995-2001<br />
In the 1990s, Lake Victoria suffered an infestation of water<br />
hyacinth (yellow arrows), an introduced species that thrives on<br />
the nutrients running into the lake from increased fertilizer<br />
applications on adjacent agricultural lands. The plants disrupted<br />
transportation and fi shing, clogged water intake pipes for<br />
municipal water, and created habitat for disease-causing<br />
mosquitoes and other insects. To address the problem, a Lake<br />
Victoria Environmental Management Project began in 1994. The<br />
Project’s focus was to combat water hyacinth infestations on the<br />
Lake, particularly in the region bordered by Uganda, which was<br />
one of the most severely affected areas.
The 1995 satellite image shows water hyacinth infestations in<br />
or near Murchison, Wazimenya, Gobero, and Buka bays (yellow<br />
arrows). Initially, the plants were manually removed from the<br />
Lake, but they quickly re-grew. Later, natural insect predators of<br />
water hyacinth were introduced as a control measure, with better<br />
results. By late 2001, essentially all of the fl oating weeds had<br />
disappeared from the aforementioned locations.<br />
51
52 <br />
Vendor selling wares, Chad<br />
Lake Chad: Africa’s Shrinking Lake<br />
Located at the southern edge of the Sahara Desert, Lake Chad<br />
is bordered by Nigeria, Niger, Chad, and Cameroon. The lake<br />
was once the second-largest wetland in Africa, supporting a rich<br />
diversity of endemic animals and plant life.<br />
The Lake Chad drainage basin, a 2 500 000 km² hydrologically<br />
closed catchment, extends to eight countries: Algeria, Libyan<br />
Arab Jamahiriya, Niger, Chad, Sudan, Central African Republic,<br />
Cameroon, and Nigeria. It is home to over 20 million people<br />
who derive direct or indirect livelihoods from the lake. Most of<br />
the region’s rainfall occurs in the southern one-third of the Lake<br />
Chad drainage basin, contributing about 90 per cent of the basin’s<br />
Lake Chad drainage basin<br />
<br />
<br />
<br />
<br />
<br />
<br />
<br />
<br />
<br />
<br />
¯<br />
<strong>UNEP</strong>/<strong>GRID</strong><br />
0 180 360 Kilometres<br />
runoff. The northern two-thirds, however, are dominated by arid<br />
conditions (Coe and Foley 2001).<br />
Climate variability and increased water consumption by the<br />
area’s inhabitants have changed the water balance within the Lake<br />
Chad drainage basin, and continue to do so. Since the early 1960’s,<br />
rainfall over the basin decreased signifi cantly while irrigation<br />
increased dramatically over the same period (Coe and Foley 2001).<br />
The lake is especially susceptible to climatic variability as it is<br />
rather shallow, with an average depth of 4.11 m (NASA 2001a). As<br />
a result of decreased rainfall and increased water usage, the extent<br />
of Lake Chad decreased by 95 per cent over roughly 35 years.<br />
More recently, water levels in Lake Chad have increased slightly.<br />
But the lake still remains a remnant of its former self.<br />
Shrinking of Lake Chad<br />
NIGER<br />
NIGERIA<br />
0 25 50 Kilometres<br />
CHAD<br />
CAMEROON<br />
Lake Chad<br />
1963<br />
1973<br />
1987<br />
1997<br />
2007<br />
<strong>UNEP</strong>/<strong>GRID</strong><br />
Permission Pending/Flickr.com
!(<br />
<br />
<br />
<br />
<br />
0 25 50 Kilometres ¯<br />
Declining Water Levels in Lake Chad, 1972-2007<br />
Lake Chad, located at the junction of Nigeria,<br />
Niger, Chad, and Cameroon, was once the sixthlargest<br />
lake in the world and the second-largest<br />
wetland in Africa. The lake was highly productive,<br />
and supported a great diversity of wildlife.<br />
!(<br />
<br />
<br />
<br />
1972<br />
!(<br />
Persistent droughts and increased agricultural<br />
irrigation have reduced the lake’s extent in the<br />
past 35 years to one-tenth of its former size.<br />
Despite the lake’s large drainage basin, almost no<br />
water fl ows in from the dry north. Ninety per cent<br />
of the lake’s water fl ows in from the Chari River.<br />
!(<br />
<br />
53
!(<br />
<br />
0 25 50 Kilometres ¯<br />
54 <br />
<br />
<br />
<br />
<br />
0 30 60<br />
Kilometers ¯<br />
<br />
<br />
<br />
2004<br />
!(<br />
<br />
<br />
<br />
1987<br />
!(<br />
With a fl at and shallow lakebed, Lake Chad is very responsive to<br />
changes in rainfall. When rainfall decreases, water levels in the lake drop<br />
rapidly. Diversion of water by human activities from the lake and from<br />
the Chari River may be signifi cant at times of low fl ow, but rainfall is still<br />
the determining factor in water levels and the lake’s extent. As these<br />
!(
!(<br />
<br />
<br />
<br />
<br />
0 25 50 Kilometres ¯<br />
satellite images from 1972, 1987, and 2007 show, the surface area of<br />
the lake has declined dramatically over time. The 2007 image shows<br />
signifi cant improvement over previous years, but the extent of Lake<br />
Chad is still far smaller than it was three to four decades ago.<br />
!(<br />
<br />
<br />
<br />
2007<br />
!(<br />
Mark Knobil/Flickr.com<br />
!(<br />
55
Aerial view of the Okavango Delta Justin Hall/Flickr.com<br />
Okavango: The World’s Largest Inland Delta<br />
The Okavango Delta (or Okavango Swamp), a globally renowned<br />
Ramsar Wetland Site, is the world’s largest inland delta. Angola,<br />
Namibia, and Botswana share the Okavango River catchment area<br />
that feeds the Okavango Delta. Spanning approximately<br />
15 000 km², the Delta is a rich and varied freshwater habitat<br />
for diverse fl ora and fauna. It is home to 2 000 to 3 000 plant<br />
species, over 162 arachnid species, more than 20 species of<br />
large herbivores, over 450 bird species (Monna 1999), and<br />
approximately 70 species of fi sh (Kolding 1996). The area was once<br />
a part of Lake Makgadikgadi, an ancient lake that dried up some<br />
10 000 years ago. Today, the Okavango River has no outlet to the<br />
sea. Instead, it fl ows out onto the sands of the Kalahari (Kgalagadi)<br />
Desert, watering 15 000 km² of that arid landscape. Each year some<br />
11 km3 of water reach and sustain the Okavango Delta.<br />
The inundated area of the Okavango Delta changes annually<br />
and seasonally, depending on the regional precipitation over<br />
the catchment area in the Angolan highlands (McCarthy and<br />
Map of the catchment area of the Okavango Delta<br />
0<br />
11<br />
10<br />
9<br />
NAMIBIA<br />
Kilometres<br />
75 150<br />
Okavango Delta’s catchment area<br />
56 <br />
8<br />
7<br />
6<br />
5<br />
3<br />
1<br />
2<br />
4<br />
ANGOLA<br />
Okavango Delta<br />
Catchment<br />
(Sub-basins)<br />
1. Cuanavale<br />
2. Cuito<br />
3. Longa<br />
4. Cubango<br />
5. Cuatir<br />
6. Cueio<br />
7. Cwebe<br />
8. Cuelei<br />
9. Cuchi<br />
10. Cacuchi<br />
11. Cutato<br />
Okavango<br />
Delta<br />
ZAMBIA<br />
BOTSWANA<br />
¯<br />
others 2003). The Delta’s fl ooding begins about mid-summer<br />
in the north and six months later in the south. Water entering<br />
the Delta passes through the sand aquifers of numerous islands<br />
and evaporates, leaving behind enormous quantities of salt. The<br />
vegetation disappears in the centre of the islands and thick salt<br />
crusts form around their edges. Islands can disappear completely<br />
during the times of peak fl ooding, and reappear at the end of<br />
the season as waters recede. Constantly changing water levels<br />
have huge environmental and social implications since the Delta<br />
enjoys rich biodiversity and is a major source of livelihoods for<br />
local communities. The map below shows the percentage of time<br />
between 1985 and 2000 that areas of the delta were inundated.<br />
Dark blue areas indicate permanently inundated regions while<br />
lighter blue to white areas represent less inundation time<br />
(McCarthy and others 2003). The Delta’s inundation has always<br />
varied from year to year. A study by McCarthy and others (2003)<br />
showed that the wetland area varied in extent from 2 450 km² to<br />
11 400 km² between 1972 and 2000.<br />
<strong>UNEP</strong>/<strong>GRID</strong><br />
Some parts of Okavango Delta remain inundated year round even in<br />
dry years, however, much of the delta is inundated only seasonally or in<br />
wet years. This image shows the percentage of time various areas of the<br />
delta were inundated between 1985 and 2000.<br />
McCarthy and others 2003
Côte d’Ivoire<br />
Confl icts and Refugees<br />
Political confl icts tragically destroy lives and livelihoods.<br />
They also have adverse impacts on surrounding<br />
environments and signifi cant transboundary<br />
implications. Wars can destroy croplands, forests,<br />
waterways and their sources, and other natural resources,<br />
while refugees searching for safe havens can burden<br />
ecosystems and complicate environmental decision-making<br />
(Vanasselt 2003). The United Nations High Commissioner<br />
for Refugees (UNHCR) estimates that there were 2.4 million<br />
refugees in Africa at the end of 2006 (UNHCR 2006a).<br />
Environmental degradation can exacerbate confl ict,<br />
which causes further environmental degradation, creating a<br />
vicious cycle of environmental decline, tense competition for<br />
diminishing resources, increased hostility, inter-communal<br />
fi ghting, and ultimately social and political breakdown.<br />
Ecological warning signs related to confl ict and its impacts<br />
include limited habitable space, decrease in production of<br />
goods, and a heavy human “footprint” (Wolf 2007).<br />
2.3 Transboundary Movement of People<br />
Major Refugee Camps in Africa<br />
Refugee camps<br />
0 625 1 250<br />
Kilometres<br />
<br />
57<br />
<strong>UNEP</strong>/<strong>GRID</strong> – Data Source: UNHCR
58 <br />
Changes to the landscape in and around the Dadaab Refugee Camp<br />
between 1987 and 2000<br />
Kilometres<br />
0 4 8<br />
Dadaab Refugee Camp<br />
N<br />
26 January 1987<br />
Ifo, Dagahaley, and Hagadera refugee camps are located in<br />
Dadaab town in the North Eastern Province of Kenya, near the<br />
border with Somalia. The camps date back to 1991 when civil<br />
wars erupted on a large scale in Somalia. The confl icts, along<br />
with prolonged drought, forced more than 400 000 people<br />
from Somalia to fl ee to Kenya and another 500 000 to other<br />
neighbouring countries.<br />
The 1987 satellite image above shows a fairly intact landscape<br />
dominated by shrub vegetation that is characteristic of the semiarid<br />
area. In the 2000 image, the Ifo, Dagahaley, and Hagadera<br />
refugee camps stand out distinctly, revealing the presence and<br />
impact of a high concentration of over 100 000 refugees on the<br />
environment. Shrublands have been reduced largely to bare<br />
spots with sparse and stunted shrubs and grasses while riverine<br />
vegetation has also suffered loss and degradation.<br />
In the refugee camps, most households have several buildings—sleeping<br />
rooms, a kitchen, maybe a storage area—and lots of outside communal<br />
space where families can cook, socialize, clean, do laundry and other<br />
activities. It is not uncommon for families to keep goats, donkeys, or<br />
chickens within the household area.<br />
Flickr.com<br />
N<br />
Eastern<br />
Dagahaley<br />
Camp<br />
Kilometres<br />
0 4 8<br />
Map of study area<br />
KENYA<br />
Coast<br />
N<br />
Ifo<br />
Camp<br />
North<br />
Eastern<br />
Dadaab<br />
Refugee Camp<br />
Flickr.com<br />
Hagadera<br />
Camp<br />
Gedo<br />
Jubbada<br />
Dhexe<br />
Jubbada<br />
Hoose<br />
Bay<br />
SOMALIA<br />
INDIAN<br />
OCEAN<br />
0 50<br />
Kilometres<br />
100<br />
23 February 2000<br />
N<br />
<strong>UNEP</strong>/<strong>GRID</strong><br />
N<br />
Flickr.com
A street scene in Guinea Courtney/Flickr.com<br />
The Parrot’s Beak Region<br />
“Parrot’s Beak” is a small strip of land belonging to Guinea,<br />
situated between Sierra Leone and Liberia. In the 1990s, civil<br />
wars in Sierra Leone and Liberia forced hundreds of thousands<br />
of people to seek the relative safety of Guinea. Many of these<br />
refugees settled in the Parrot’s Beak region. The impact on<br />
the region can be seen in the two satellite images below. In the<br />
1974 image, prior to the infl ux of refugees, small fl ecks of light<br />
green scattered throughout the deep-green forest of the Parrot’s<br />
Beak region represent compounds of villages surrounded by<br />
Changes in the Parrot’s Beak region between 1974 and 2002<br />
Jagbwema Jag Ja Jag Ja Jag agbwe bwe bw bwe bbwwe we<br />
ma m<br />
S I E R R A<br />
Manowa Man an anowa owa ow<br />
0<br />
L E O N E<br />
10 20<br />
Koardu Koa Ko Koa ooa<br />
o rdu rd rdu r d ddu<br />
d<br />
Kailahun Kai Ka Kai Ka Kai Ka K lah ahun un<br />
Koundou Kou Ko Kou Koundo u ndo nd ndo ndou do d u<br />
G U I N E A<br />
N<br />
Refugee Occupation<br />
Area<br />
LIBERIA<br />
Foya Foy Foya ooy<br />
o oy a<br />
Kilometres 24 Jan 1974<br />
<strong>UNEP</strong><br />
agricultural plots. Contrast this with the light green colour of the<br />
2002 image. This is the result of deforestation where refugees<br />
have settled. Many of the refugees integrated into local villages,<br />
converting forest into family agricultural plots to such an extent<br />
that the Parrot’s Beak was largely denuded of trees. In early 2003,<br />
the United Nations High Commissioner for Refugees (UNHCR)<br />
helped 16 500 Sierra Leonean refugees living in Guinea return to<br />
their homeland; roughly half of these returning refugees traveled<br />
through the Parrot’s Beak region.<br />
Jagbwema Jag Ja Jag Jagbwe a bwe bw bwe we wema ma<br />
S I E R R A<br />
Manowa Man an anowa owa o a<br />
0<br />
L E O N E<br />
10 20<br />
Koardu Koa Ko Koa Ko Koa Ko Koa o rdu rd rdu rd rdu d du duu<br />
Kailahun Kai Ka Kai Ka K lah la lah ah a un<br />
Koundou Kou Ko Kou KKoundo ouu<br />
ndo nd ndo do dou u<br />
G U I N E A<br />
N<br />
Refugee Occupation<br />
Area<br />
LIBERIA<br />
Foya Fo Foy Fo Foy Fo Foy Fo Foya a<br />
Kilometres 25 Jan 2002<br />
<strong>UNEP</strong><br />
59
60 <br />
Darfur Confl ict<br />
The Darfur confl ict is a complex crisis in the Darfur region<br />
of western Sudan. The combination of decades of drought,<br />
desertifi cation, and overpopulation are among the contributing<br />
factors that led nomads searching for water to drive their livestock<br />
south into regions mainly occupied by farming communities.<br />
Eventually, tensions between the two groups escalated into confl ict.<br />
The United Nations estimates that as many as 450 000 people have<br />
died from violence and disease and about 2.5 million are thought<br />
to have been displaced as of October 2006 (UNHCR 2006b).<br />
On 16 June 2007, United Nations Secretary General Ban<br />
Ki-moon released a statement in which he proposed that the<br />
impact of climate change is directly related to the Darfur<br />
confl ict, as desertifi cation has added signifi cantly to the stress<br />
on the livelihoods of pastoralist societies, forcing them to move<br />
south to fi nd pasture (Ban Ki-moon 2007). Apart from the<br />
millions internally displaced, more than 200 000 refugees are<br />
currently hosted in 12 UNHCR-run camps across the border<br />
in Chad (UNHCR 2006b). Their presence is a transboundary<br />
environmental problem, since the need for fuelwood has led<br />
refugees to destroy forests around the camps and dig new bore<br />
holes for water, which are depleting aquifers.<br />
Bir Kedouas is a two square kilometre settlement within Chad,<br />
just west of Sudan’s Darfur region (see below). On 16 December<br />
2005, Janjawid nomadic fi ghters attacked the village settlement,<br />
burning at least 60 homes and causing widespread destruction<br />
(Amnesty International 2006).<br />
Changes in Bir Kedouas, Chad, between 2004 and 2006<br />
24 Oct 2004 07 Jan 2006<br />
Before and after the 2005 attack (images from Quickbird/Digital Globe)<br />
<strong>UNEP</strong><br />
QuickBird/DigitalGlobe<br />
Map of study area<br />
Batha<br />
Borkou-Ennedi-Tibesti<br />
Ouaddai<br />
Salamat<br />
Biltine<br />
CHAD<br />
Kilometres<br />
0 150 300<br />
<strong>UNEP</strong><br />
Darfur<br />
Bahr al Ghazal<br />
SUDAN<br />
Ash Shamaliyah<br />
Kurdufan<br />
N<br />
QuickBird/DigitalGlobe<br />
<strong>UNEP</strong>/<strong>GRID</strong><br />
<strong>UNEP</strong>
Dust Storms and Fires<br />
Dust storms and biomass burning are two signifi cant<br />
sources of transboundary air pollution in Africa.<br />
Desertifi cation—a major environmental issue—<br />
contributes to dust storms, while biomass burning<br />
releases unhealthy particulates into the air, causing<br />
air pollution that in turn leads to respiratory illnesses,<br />
allergies, and other health problems.<br />
2.4 Transboundary Movement of Pollutants<br />
Dust storm in Cairo, Egypt<br />
<br />
61<br />
Keith and Gabriela Fultonne/Flickr.com
62 <br />
Dust Storms<br />
Dust storms are severe weather hazards. They are characterized<br />
by strong winds and dust-fi lled air over an extensive area, often<br />
drifting from one country to another. They are common in arid<br />
and semi-arid regions. The dust in such storms is either natural<br />
in origin, from volcanic eruptions or from soil eroded by<br />
wind, or the result of human activities, such as mining and<br />
various industries.<br />
Africa is one of the largest dust-producing regions in the<br />
world (Washington and others 2006a). Niger, Chad, Mauritania,<br />
northern Nigeria, and Burkina Faso are among the countries<br />
most affected by the loss of top soil by wind erosion. Saharan<br />
dust storms were once relatively rare, but in the past half-century<br />
they have increased ten-fold. In Mauritania, the number of dust<br />
Dust Storm in the Bodele Depression<br />
The Bodele Depression, located at the<br />
southern edge of the Sahara Desert in<br />
north-central Africa, is one of the largest<br />
sources of airborne dust in the world.<br />
Nested between two mountain ranges in<br />
Chad and downwind from a natural wind<br />
tunnel, the Bodele Depression provides<br />
a steady supply of Saharan dust plumes.<br />
This January 2007 satellite image (right),<br />
shows a dust storm brewing in the Bodele<br />
Depression. Clearly visible is a bright<br />
streak of dust that arcs southwest across<br />
the Depression toward Lake Chad. During<br />
winter in the Northern Hemisphere,<br />
northeasterly winds routinely blow across<br />
this part of northern Africa. The dust<br />
spreads westward across the Atlantic Ocean<br />
on the easterly trade winds. Eventually,<br />
the dust reaches the Amazon River Basin<br />
in South America, where it replenishes<br />
mineral nutrients that are continually<br />
depleted from the soil by heavy, tropical<br />
rains. About half of the 40 million metric<br />
tonnes of dust that are swept across<br />
the Atlantic from the Sahara to the<br />
Amazon each year come from the Bodele<br />
Depression, an area that accounts for only<br />
0.2 per cent of the Sahara (NASA 2007a).<br />
Based on satellite data and computer models, scientists<br />
estimate that Saharan dust storms generate an<br />
average of about 0.7 million metric tonnes of dust<br />
during winter days.<br />
Dust storm, Bodele Depression<br />
N<br />
Jos Plateau<br />
storms rose from two per year in the early 1960s to 80 per year in<br />
more recent times (Brown 2007).<br />
Transboundary transport of African dust-—across continents<br />
and even oceans—can result in a number of environmental<br />
hazards such as eutrophication (decreased oxygen) in estuaries<br />
and lung infections in humans. The loss of fi ne soil particles<br />
through erosion and dust storms deprives the land of fertility<br />
as well as biological productivity (Brown 2007), and can affect<br />
the weather by refl ecting the sun’s rays back into space (NASA<br />
2004a). Dust storms are thus increasingly viewed as a key<br />
component of change in some terrestrial and marine ecosystems<br />
and as a potentially signifi cant source of pathogens and<br />
contaminants (Ila 2006).<br />
0 325<br />
Kilometres<br />
650<br />
Bodele Depression<br />
dust<br />
Lake Chad<br />
Adamaoua Mountains<br />
Tibesti<br />
Mountains<br />
natural wind tunnel<br />
02 Jan 2007<br />
NASA 2007a<br />
Richard Washingtonne/BodEx
This April 2000 image of<br />
Africa shows dust blowing<br />
from the Sahara Desert<br />
into the Atlantic Ocean,<br />
represented as areas<br />
where aerosols absorb<br />
ultraviolet radiation. High<br />
concentrations of aerosols<br />
are indicated in brown and<br />
lower concentrations in<br />
yellow (NASA 2000).<br />
Aerosols<br />
Smoke Spreading From Greece to Africa<br />
Aerosols are tiny particles suspended<br />
in the air. They tend to have a<br />
cooling effect on the Earth’s surface<br />
by refl ecting some of the sun’s rays<br />
back into space. Aerosols also absorb<br />
ultraviolet radiation.<br />
Aerosols can originate from<br />
natural sources such as volcanoes,<br />
forest fi res, and dust storms, or from<br />
anthropogenic sources such as the<br />
burning of fossil fuels. Averaged over<br />
the globe, aerosols resulting from<br />
human activities currently account for<br />
about 10 per cent of the total amount<br />
of aerosols in the atmosphere (Hardin<br />
and Kahn n.d.). Most of that 10 per<br />
cent is concentrated in the Northern<br />
Hemisphere, especially over industrial<br />
sites, agricultural regions, areas where<br />
slash-and-burn agriculture is practised,<br />
and overgrazed grasslands.<br />
Fires burning in southwestern Greece in August 2007 released<br />
aerosols that winds carried to Africa. On 26 August 2007, aerosols<br />
from the fi res took a fairly direct route across the Mediterranean<br />
Sea to collect on the western part of the Libyan Arab Jamahiriya<br />
coast. On 27 August 2007, the aerosols took a different path,<br />
26 Aug 2007 27 Aug 2007<br />
This image shows the annual<br />
mean aerosol optical depth<br />
for 2006. Optical depth is the<br />
degree to which aerosols prevent<br />
incoming sunlight from reaching<br />
the Earth’s surface. High aerosol<br />
concentrations were observed<br />
over western and central Africa<br />
due to dust from the Sahara and<br />
smoke from biomass burning.<br />
Gray zones on the map represent<br />
areas were aerosol data could not<br />
be collected (NASA 2006c).<br />
26 Aug 2007<br />
This 2007 image shows actively burning fi res in red—a line of fi res stretches along<br />
the western coast of Greece’s Peloponnesus Peninsula. To the northeast, a single fi re<br />
casts a plume of smoke over the Greek capital of Athens.<br />
spreading southward in a clockwise direction from Greece, across<br />
the island of Crete, and ultimately concentrating over eastern<br />
Libyan Arab Jamahiriya. In these images, the highest aerosol<br />
concentrations are represented in pink, with lower concentrations<br />
in yellow and green; relatively clear air is transparent (NASA 2007c).<br />
63
64 <br />
This image shows the global distribution of fi res, represented by red dots. Fire<br />
distribution in Africa indicates the highest biomass burning in the world (images<br />
based on night-time measurements).<br />
Fires<br />
The frequent and large-scale burning of grasslands in Africa<br />
contributes to transboundary air pollution through the release<br />
of airborne particles (aerosols) and gases into the atmosphere,<br />
many of which can have an impact on climate and human health.<br />
For example, fi res also release carbon monoxide, hydrocarbons,<br />
and nitrogen oxides. When exposed to sunlight, some of these<br />
substances react chemically to create ground-level ozone. Unlike<br />
the ozone in the stratosphere, which absorbs dangerous ultraviolet<br />
light, ozone near the Earth’s surface is a harmful air pollutant<br />
that can lead to respiratory illnesses and allergies in people. While<br />
urban and industrial contributions to pollution go on year round,<br />
wildfi res can add to global pollution levels in intense seasonal<br />
bursts. Fires contribute as much as 35 per cent of ground-level<br />
ozone formation in Africa.<br />
Burning brush in Kenya<br />
12 Apr 2008<br />
Image Credit: NASA n.d.b; Data Source: GLCF<br />
Biomass Burning in Africa<br />
Biomass burning is the burning of living and dead vegetation<br />
and includes the burning of forests, savannahs, and agricultural<br />
lands. Wildfi res are responsible for half of the biomass burning<br />
that occurs in Africa, while shifting cultivation accounts for 24<br />
per cent, deforestation for ten per cent, domestic burning for 11<br />
per cent, and the burning of agricultural waste for fi ve per cent<br />
(<strong>UNEP</strong> 2005b). Studies show that biomass burning has increased<br />
on a global scale over the last 100 years. Savannahs in Africa<br />
experience the most extensive biomass burning in the world<br />
(NASA 2001b). Because two-thirds of the Earth’s savannahs are<br />
located in Africa, the continent is now recognized as the “burn<br />
centre” of the planet (Levine and others 1995).<br />
Christian Lambrechts/<strong>UNEP</strong>
01-10 Jan<br />
02-11 Mar<br />
21-30 Jan<br />
22-31 Mar<br />
Seasonal Pattern of Wildland Fires<br />
This series of images shows the seasonal pattern of wildland fi res in Africa during<br />
2005. Fires appear as red, orange, or yellow dots, with yellow indicating the greatest<br />
number of fi res. Some of the highest levels of biomass burning in the world occur<br />
in southern Africa. For thousands of years farmers and herders south of the Sahara<br />
Desert have used fi re to clear land for farming or renew grazing land. Fire locations<br />
10-19 Feb<br />
11-20 Apr<br />
01-10 May 21-30 May 10-19 Jun<br />
30 Jun - 9 Jul 20-29 Jul 09-18 Aug<br />
shift with the seasons. The burning of tropical savannahs is estimated to release nearly<br />
three times as much carbon (as carbon dioxide) into the atmosphere as the burning of<br />
tropical forests. Extensive biomass burning in Africa not only releases carbon dioxide,<br />
the principle greenhouse gas, into the atmosphere but also contributes carbon<br />
monoxide. Furthermore, if burned vegetation does not regenerate, it can no longer<br />
act as a carbon sink. Denuded landscapes also hasten desertifi cation.<br />
<br />
65<br />
NASA 2005
66 <br />
Biomass burning results in carbon monoxide pollution<br />
Carbon Monoxide Pollution:<br />
A Result of Biomass Burning<br />
A colourless, odourless, and poisonous gas, carbon monoxide<br />
(CO) is a by-product of the burning of fossil fuels in industry<br />
and automobiles, as well as the burning of forests and grasslands.<br />
A major air pollutant, carbon monoxide is created when<br />
carbon-based fuels—like fossil fuels or fuelwoods—do not burn<br />
completely or effi ciently. High levels of CO pollution are found<br />
in many parts of the world, and they result from different types<br />
of burning in different locations. In central Africa, high levels<br />
of atmospheric CO are linked to widespread fi re activity from<br />
agricultural burning and wildfi res. Carbon monoxide molecules<br />
can last from a few weeks to several months in the atmosphere<br />
and can travel across national boundaries. Because of its<br />
transboundary movement, CO can affect air quality in regions far<br />
from its original source (NASA 2000-2004).<br />
Widespread fi res release high levels of CO<br />
This vertical series of images (right) shows a record of global<br />
CO production from March 2000 through February 2004. Blue<br />
areas have little or no atmospheric CO, while progressively<br />
higher CO levels are shown in green, yellow, orange, and red. In<br />
January through March, carbon monoxide levels are in the “red<br />
zone”—more than 200 parts per 1 000 million—across much of<br />
the Northern Hemisphere. They are even present as far north as<br />
the Arctic and extending out over the Atlantic and Pacifi c Oceans<br />
because of transboundary movement (NASA 2000-2004). CO<br />
levels are especially high over central Africa for much of the year.<br />
In this June 2004 image, red and yellow indicate high carbon monoxide levels,<br />
while light- and dark-blue hues represent low values (NASA 2004b). A vast plume of<br />
carbon monoxide extends from Africa over the Atlantic Ocean.<br />
Carbon Monoxide Column Density (10 18 molecules/cm 2 )<br />
0.0 2.0 4.0<br />
Carbon Monoxide Concentration (ppbv)<br />
Jan, Feb, Mar (2000-2004)<br />
Apr, May, Jun (2000-2004)<br />
Jul, Aug, Sep (2000-2004)<br />
Oct, Nov, Dec (2000-2004)<br />
0 50 100 150 200 >250 no data<br />
Christian Lambrechts/<strong>UNEP</strong>
Southern Africa: Hotspot for Nitrogen Dioxide (NO 2 )<br />
Nitrogen oxides are created from lightning, soil microbial activity,<br />
both natural and anthropogenic fi res, automobile exhaust, the<br />
burning of fossil fuels and biomass, and the photo-degradation<br />
of nitrous oxide (N 2 O) in the stratosphere. Nitrogen oxides in<br />
the atmosphere eventually form acid rain that damages plants<br />
and agricultural crops (EPA 2002). Nitrogen dioxide can impact<br />
human health, causing lung damage and respiratory problems.<br />
It also contributes to urban pollution, since it is a reactant in the<br />
production of ground-level ozone.<br />
2.5 Conclusion<br />
The illustrated case studies and examples in this chapter have<br />
underscored how Africa’s ecosystems and their plant and animal<br />
inhabitants are not confi ned by political jurisdictions, but are<br />
often shared by many countries. Furthermore, the impact<br />
Taking wood to market<br />
NO 2 (10 15 molecules/cm 3 )<br />
0 5 10 15 20<br />
A global map of nitrogen dioxide (NO ) in the troposphere in 2003<br />
2<br />
This 2003 image shows the locations of high levels of nitrogen dioxide worldwide.<br />
High concentrations of NO tend to be associated with large urban or industrial<br />
2<br />
areas. In Africa, NO concentrations are particularly high over coal-fi red power<br />
2<br />
stations in South Africa. Lower, but widespread, concentrations of the gas—<br />
produced by biomass burning—are visible across much of the African continent<br />
(NASA 2003).<br />
of human activities can often be felt far beyond the borders<br />
of the countries in which the activities take place. For these<br />
reasons, common approaches and complementary actions<br />
by neighbouring countries and entire regions are needed to<br />
effectively conserve Africa’s biodiversity and the natural resources<br />
its people depend upon for their livelihoods.<br />
<br />
67<br />
Christian Lambrechts/<strong>UNEP</strong>
68 <br />
References<br />
AWF (2003). African Wildlife Foundation, Africa launches the Great Limpopo Transfrontier Park, 13<br />
January 2003, Available at: http://www.awf.org/content/headline/detail/1174 [Accessed 13<br />
September 2007]<br />
Ban Ki-moon (2007). A climate culprit in Darfur, The Washington Post, 16 June 2007, pp. A15. Available<br />
at: http://www.washingtonpost.com/wp-dyn/content/article/2007/06/15/AR2007061501857.<br />
html [Accessed 16 June 2007]<br />
Brown, L. R. (2007). Losing soil. Adapted from Chapter 5, “Natural Systems Under Stress,” in Plan B<br />
2.0: Rescuing a Planet Under Stress and a Civilization in Trouble, New York: W.W. Norton & Company,<br />
2006. Earth Policy Institute, New York, Available at: http://www.earth-policy.org/Books/<br />
Seg/PB2ch05_ss3.htm [Accessed 04 July 2007]<br />
CARPE (2006). Central African Regional Project for the Environment, The Forests of the Congo Basin:<br />
State of the Forest 2006. The Congo Basin Forest Partnership (CBFP), http://carpe.umd.edu/<br />
resources/Documents/THE_FORESTS_OF_THE_CONGO_BASIN_State_of_the_Forest_2006.<br />
pdf/view [Accessed 21 July 2007]<br />
Coe, M. T. and Foley, J. A. (2001). Human and natural impacts on the water research of the Lake Chad<br />
Basin. Journal of Geophysical Research, 106 (D4) pp. 3349-3356.<br />
Douglas E. M., Sanga-Ngoie K. (2004). Simulating the East African wildebeest migration patterns using<br />
GIS and remote sensing, African Journal of Ecology, v. 42, n.4, pp. 355–362.<br />
EPA (2002). Greenhouse Gases and Global Warming Potential Values. Excerpt from the inventory of<br />
U.S. greenhouse emissions and sinks: 1990-2000, United States Environmental Protection Agency,<br />
Available at: http://www.epa.gov/climatechange/emissions/downloads/ghg_gwp.pdf [Accessed<br />
13 May 2007]<br />
Eva, H. D., Brink, A. and Simonetti, D. (2006). Monitoring land cover dynamics in Sub-Saharan Africa.<br />
EUR 22498 EN. Institute for Environment and Sustainability, Joint Research Centre European<br />
Commission, Luxembourg. Available at: http://ies.jrc.cec.eu.int/fi leadmin/Documentation/<br />
Reports/Global_Vegetation_Monitoring/EUR_2006-2007/EUR_22498_EN.pdf [Accessed 11<br />
October 2007]<br />
FAO (1997). Irrigation potential in Africa: A basin approach – The Nile Basin and The Congo/Zaire<br />
River basin. Available at: http://www.fao.org/docrep/W4347E/w4347e0k.<br />
htm#the%20nile%20basin and http://www.fao.org/docrep/W4347E/w4347e0n.htm#the%20co<br />
ngozaire%20river%20basin [Accessed 23 January 2007]<br />
FAO (2005). State of the World’s Forests 2005. Food and Agriculture Organization of the United Nations,<br />
Rome, ftp://ftp.fao.org/docrep/fao/007/y5574e/y5574e00.pdf [Accessed 28 April 2007]<br />
Gauthier, D. A., Lafon, A., Tooms, T. P., Hoth, J. and Wiken, E. (2003). Grasslands: Toward a North<br />
American Conservation Strategy. Commission for Environmental Cooperation, Montreal and<br />
Canadian Plains Research Center, University of Regina, Canada,<br />
Go2Africa (2003). The Wildebeest Migration, http://www.safari.go2africa.com/africa-features/wildebeest-migration.asp<br />
[Accessed 25 September 2007]<br />
Hansen, M.C.,Roy, D., Lindquist, E., Adusei, B., Justice, C.O., and Altstatt, A. (n.d.). A method for<br />
integrating MODIS and Landsat data for systematic monitoring of forest cover and change in the<br />
Congo Basin, Remote Sensing of Environment, in press.<br />
Hardin, M. and Kahn, R. (n.d.). Aerosols and climate change. Available at: http://earthobservatory.<br />
nasa.gov/Library/Aerosols/aerosol.html [Accessed 24 September 2007]<br />
Ila, P. (2006). Medical geology/geochemistry: an exposure. Massachusetts Institute of Technology,<br />
Cambridge MA, USA. Available at: http://ocw.mit.edu/NR/rdonlyres/Earth--Atmospheric--and-<br />
Planetary-Sciences/12-091January--IAP--2006/B8E16620-F020-48EC-A11D-0BC2EB06246D/0/session5.pdf<br />
[Accessed 18 June 2007]<br />
Kolding, J. (1996). Feasibility Study and Appraisal of Fish Stock Management Plan in Okavango,<br />
University of Bergen, Norway<br />
Levine, J. S., Cofer, W. R., Cahoon, D. R. and Winstead, E. L. (1995). Biomass burning: a driver for<br />
global change, Environmental Science and Technology, 29 (3) 120A-125A, Available at: http://<br />
science.larc.nasa.gov/biomass_burn/pdfdocs/BioMassBurning--Factsheet.pdf [Accessed 24<br />
September 2007]<br />
Laporte, N. T., Stabach, J. A., Grosch, R., Lin, T. S. and Goetz, S. J. (2007). Expansion of industrial logging<br />
in Central Africa, Science, 316 (5830) 1451.<br />
McCarthy, J. M., Gumbricht, T., McCarthy, T., Frost, P., Wessels, K. and Seidel, F. (2003). Flooding patterns<br />
of the Okavango Wetland in Botswana between 1972-2000. Ambio, 32 (7) 453-457,<br />
Available at: http://www.bioone.org/archive/0044-7447/32/7/pdf/i0044-7447-32-7-453.pdf [Accessed<br />
24 September 2007]<br />
McCrummen, S. (2007). In an Eastern Congo oasis, blood amid the greenery. The Washington Post, 22<br />
July 2007, 130 (229) pp. A1, A10 [Accessed 22 July 2007]<br />
Miller, R. L. and Tegen, I. (1998). Climate response to soil dust aerosols. Journal of Climate. 11: pp 3247<br />
– 3267.<br />
Mongabay (2007). Massive wildlife population discovered in Southern Sudan, 12 June 2007, Available at:<br />
http://news.mongabay.com/2007/0612-sudan.html [Accessed 24 September 2007]<br />
Monna, S. C. (1999). A Framework for International Cooperation for the Management of the Okavango<br />
Basin and Delta. Ramsar COP7 DOC.205. The Ramsar Convention on Wetlands.<br />
MSNBC (2007). Four endangered gorillas found shot dead, MSNBC News, 26 July 2007. Available at:<br />
http://www.msnbc.msn.com/id/19974474/ [Accessed 26 July 2007]<br />
MSN Encarta (2007). Great Limpopo Transfrontier Park. MSN Encarta Enciclopedia, Available at:<br />
http://encarta.msn-ppe.com:443/encyclopedia_701639180/Great_Limpopo_Transfrontier_<br />
Park.html [Accessed 24 September 2007]<br />
Musiega, D. E., and Kazadi, S-N (2004). Simulating the East African wildebeest migration patterns using<br />
GIS and remote sensing. African Journal of Ecology 42 (4) 355–362, Available at: http://www.<br />
blackwell-synergy.com/doi/abs/10.1111/j.1365-2028.2004.00538.x?journalCode=aje [Accessed<br />
24 September 2007]<br />
NASA (2000). TOMS Aerosol Index, Earth Observatory News, 2000, Available at: http://earthobservatory.nasa.gov/Newsroom/NewImages/images.php3?img_id=4540<br />
[Accessed 24 September<br />
2007]<br />
NASA (2000-2004). Seasonal carbon monoxide measurements, Earth Observatory News. Available at:<br />
http://earthobservatory.nasa.gov/Newsroom/NewImages/images.php3?img_id=16550 [Accessed<br />
26 September 2007]<br />
NASA (2001a). Africa’s Lake Chad shrinks by 20 times due to irrigation demands, climate change, Goddard<br />
Space Flight Center, Release No: 01-17, 27, February 2001, Available at: http://www.gsfc.<br />
nasa.gov/news-release/releases/2001/01-17.htm [Accessed 8 June 2007]<br />
NASA (2001b). Biomass burning: a hot issue in global change, Fact Sheet, Langley Research Center,<br />
Available at: http://science.larc.nasa.gov/biomass_burn/pdfdocs/BioMassBurning--Factsheet.<br />
pdf [Accessed 24 September 2007]<br />
NASA (2003). 2003 Global NO2, Earth Observatory News, 2003. Available at: http://earthobservatory.<br />
nasa.gov/Newsroom/NewImages/images.php3?img_id=16654 [Accessed 24 September 2007]<br />
NASA (2004a). 2004 Earth Feature Story – Special: Africa to Atlantic, Dust to Dust, Goddard Space<br />
Flight Center, 10 February 2004, Available at: http://www.gsfc.nasa.gov/feature/2004/0116dust.<br />
html [Accessed 24 September 2007]<br />
NASA (2004b). Carbon monoxide from African fi res, Earth Observatory News, June 2004, Available at:<br />
http://earthobservatory.nasa.gov/Newsroom/NewImages/images.php3?img_id=16598 [Accessed<br />
24 September 2007]<br />
NASA (2005). 2005 Fire patterns across Africa, Earth Observatory News, 2005, Available at: http://<br />
earthobservatory.nasa.gov/Newsroom/NewImages/images.php3?img_id=17016 [Accessed 24<br />
September 2007]<br />
NASA (2006a). Drought on the Serengeti Plain. Available at: http://earthobservatory.nasa.gov/Newsroom/NewImages/images.php3?img_id=17163<br />
[Accessed 14 September 2007]<br />
NASA (2006b). Lake Victoria’s falling waters. Available at: http://earthobservatory.nasa.gov/Study/<br />
Victoria/victoria.html [Accessed 09 June 2007]<br />
NASA (2006c). Water Hyacinth Re-invades Lake Victoria. Available at: http://earthobservatory.nasa.<br />
gov/Newsroom/NewImages/images.php3?img_id=17560 [Accessed 09 June 2007]
NASA (2006d). Aerosol optical depth in 2006, Earth Observatory News, 2006. Available at: http://<br />
earthobservatory.nasa.gov/Newsroom/NewImages/images.php3?img_id=17575 [Accessed 09<br />
June 2007]<br />
NASA (2007a). Bodele Depression dust storm, Earth Observatory and Natural Hazards, January 2007,<br />
Available at: http://earthobservatory.nasa.gov/NaturalHazards/natural_hazards_v2.php3?img_<br />
id=14061 [Accessed 24 September 2007]<br />
NASA (2007b). Deadly fi res in Greece, Earth Observatory News, August 2007, Available at: http://<br />
earthobservatory.nasa.gov/Newsroom/NewImages/images.php3?img_id=17753 [Accessed 24<br />
September 2007]<br />
NASA (2007c). Smoke spreading from Greece to Africa, Earth Observatory News, August 2007, Available<br />
at: http://earthobservatory.nasa.gov/Newsroom/NewImages/images.php3?img_id=17755 [Accessed<br />
24 September 2007]<br />
NASA (2007d). Hurricanes: Did Dust Bust the 2006 Hurricane Season Forecasts? 28 March 2007. Available<br />
at: http://www.nasa.gov/mission_pages/hurricanes/archives/2007/hurricane_dust.html<br />
[Accessed on 27 December 2007<br />
Ngowi, R. (2006). Drought threatens East Africa’s wildlife. Mail and Guardian Online, 19 February 2007,<br />
http://www.mg.co.za/articlePage.aspx?articleid=264684&area=/breaking_news/breaking_news_<br />
_africa/ [Accessed 25 September 2007]<br />
Osumo, W. M. (2001). Effects of Water Hyacinth on Water Quality of Winam Gulf, Lake Victoria. The<br />
United Nations University, Reykjavik, Iceland, Available at: http://www.unuftp.is/proj01/Osumo-<br />
PRF.pdf [Accessed 9 October 2007]<br />
Perrins, C. M., and Elphick, J. (2003). The Complete Encyclopedia of Birds and Bird Migration, Chartwell<br />
Books, Edison, New Jersey, USA<br />
Pilkington, E. (2007). Sudan’s breathtaking migration. Guardian Unlimited, 13 June 2007, Available at:<br />
http://www.guardian.co.uk/environment/gallery/2007/jun/13/sudan.internationalnews?pictur<br />
e=330018155 [Accessed 25 September 2007]<br />
Rogers, P. J. (2005). The Great Limpopo Transfrontier Conservation Area as governance mosaic, Paper<br />
presented at the annual meeting of the International Studies Association, Hilton Hawaiian Village,<br />
Honolulu, Hawaii, http://www.allacademic.com/meta/p69557_index.html [Accessed 12<br />
October 2007]<br />
SANParks (2007). South African National Parks, Conservation: Great Limpopo Frontier Park, 2001-<br />
2007, Available at: http://www.sanparks.org/conservation/transfrontier/great_limpopo.php<br />
[Accessed 14 September 2007]<br />
Sandwith, T., Shine, C., Hamilton, L. and Sheppard, D. (2001). Introduction and defi nitions. In Transboundary<br />
Protected Areas for Peace and Co-operation. IUCN - The World Conservation Union<br />
and World Commission on Protected Areas (WCPA), http://www.iucn.org/bookstore/HTMLbooks/BP7-transboundary_protected_areas/cover.html<br />
[Accessed 17 September 2007]<br />
Schollaert, S.E. and Merrill, J.T. (1998). Cooler sea surface west of the Sahara desert Correlated to dust<br />
events. Geophysical research letters: 25 - 18, pp. 3529-3532.<br />
UNDP-GEF (2005). Project Executive Summary: GEF Council Intersessional Work Program Submission.<br />
Available at: http://www.gefweb.org/Documents/work_programs/IWP%20July05/1%20-<br />
%20BD%20-%20Regional-Enhancing%20Effectiveness-W-Arly-Pendjari-ExecSumm.pdf [Accessed<br />
21 January 2007]<br />
<strong>UNEP</strong> (2005a). One Planet Many People: Atlas of Our Changing Environment, United Nations Environment<br />
Programme, Nairobi, Kenya, pp. 14-15,<br />
<strong>UNEP</strong> (2005b). Report on atmosphere and air pollution. In African Regional Implementation Review<br />
for the 14th Session of the Commission on Sustainable Development (CSD-14), United Nations<br />
Environment Programme, Nairobi, Kenya, http://www.uneca.org/csd/CSD4_Report_of_African_Atmosphere_and_Air_Pollution.htm<br />
[Accessed 10 July 2007]<br />
<strong>UNEP</strong> (2006a). Global Deserts Outlook, United Nations Environment Programme, Nairobi, Kenya<br />
<strong>UNEP</strong> (2006b). Africa’s Lakes: Atlas of Our Changing Environment, United Nations Environment<br />
Programme, Nairobi, Kenya, pp. 28-29, http://www.na.unep.net/AfricaLakes/ [Accessed 25<br />
September 2007]<br />
<strong>UNEP</strong> (2007). Sudan Post-Confl ict Environmental Assessment: Synthesis Report, United Nations<br />
Environment Programme, Nairobi, Kenya, Available at: http://sudanreport.unep.ch/<strong>UNEP</strong>_Sudan_synthesis_E.pdf<br />
[Accessed 4 July 2007]<br />
<strong>UNEP</strong>-WCMC (2007). Protected Areas and World Heritage, United Nations Environment Programme<br />
and World Conservation Monitoring Centre, Available at: http://www.unep-wcmc.org/protected_areas/index.html<br />
[Accessed 17 September 2007]<br />
UNHCR (2006a). UNHCR Global Report 2006, UNHCR, The UN Refugee Agency, Available at: http://<br />
www.unhcr.org/gr06/index.html [Accessed 07 September 2007]<br />
UNHCR (2006b). Worsening Darfur crisis threatens entire region, Guterres warns, UNHCR Press<br />
Releases, 8 September 2006, Available at: http://www.unhcr.org/news/NEWS/45012ab52.html<br />
[Accessed 24 September 2007]<br />
UNU (2006). International Rivers and Lake Basin Management, United Nations University, Available at:<br />
http://www.unu.edu/env/water/transboundary-water.html [Accessed 24 September 2007]<br />
URT (2001). United Republic of Tanzania, Statistics 2001<br />
Vanasselt, W. (2003). EarthTrends Featured Topic: Armed Confl ict, Refugees, and the Environment,<br />
Available at: http://earthtrends.wri.org/pdf_library/feature/gov_fea_confl ict.pdf [Accessed 07<br />
September 2007]<br />
USDA (2005). United States Department of Agriculture, Production Estimates and Crop Assessment Division,<br />
Low Water Levels Observed on Lake Victoria, Foreign Agriculture Service, 26 September<br />
2005, Available at: http://www.fas.usda.gov/pecad/highlights/2005/09/uganda_26sep2005/<br />
[Accessed 26 September 2007]<br />
USDA (2007). United States Department of Agriculture, Crop Explorer, Lake Victoria (0314) Height<br />
Variations from TOPEX/POSEIDON and Jason-1 Altimetry, Foreign Agriculture Service, 3 September<br />
2007, Available at: http://www.pecad.fas.usda.gov/cropexplorer/global_reservoir/gr_regional_chart.cfm?regionid=eafrica®ion=&reservoir_name=Victoria&gfo_data=1<br />
[Accessed 26<br />
September 2007]<br />
USGS (1998). United States Geological Survery, HYDRO1k Elevation Derivative Database, USGS EROS<br />
Data Center, <strong>Sioux</strong> <strong>Falls</strong>, South Dakota, USA. Available at: http://eros.usgs.gov/products/elevation/gtopo30/hydro/index.html<br />
[Accessed 26 November 2007]<br />
WCS (2007). Wildlife Conservation Society, Southern Sudan Program, 2007, Available at: http://www.<br />
wcs.org/international/Africa/sudanprogram?preview=&psid=&ph=class%2525252525252525253<br />
DAWC-14877272 [Accessed 25 September 2007]<br />
Washington, R., Todd, M. C., Lizcano, G., Tegen, I., Flamant, C., Koren, I., Ginoux, P., Engelstaedter,<br />
S., Goudie, A. S., Zender, C. S., Bristow, C. and Prospero, J. (2006). Links between topography,<br />
wind, defl ation, lakes and dust: The case of the Bodélé depression, Chad, Geophys. Res. Lett., 33,<br />
(L09401)<br />
Wolf, R. (2007). Environment, globalization, and genocide. Thomas Paine’s Corner, 24 April, Available<br />
at: http://civillibertarian.blogspot.com/2007/04/environment-globalization-and-genocide.html<br />
[Accessed 24 September 2007]<br />
WWF (2007). Endangered mountain gorillas killed in Congo; population at risk, WWF Newsroom, 26<br />
July, Available at: http://www.panda.org/news_facts/newsroom/index.cfm?uNewsID=109801<br />
[Accessed 24 September 2007}.<br />
<br />
69<br />
Christian Lambercht/<strong>UNEP</strong>
70 70