

City Corporate & Business Plan - Municipal
City Corporate & Business Plan - Municipal
City Corporate & Business Plan - Municipal

Create successful ePaper yourself
Turn your PDF publications into a flip-book with our unique Google optimized e-Paper software.
Chapter ñ 9 Final Report: Ambur <strong>Municipal</strong>ity<br />
Increase in Expenditure<br />
The <strong>Municipal</strong>ity is incurring a huge sum of money towards hire charge for<br />
supply of water. The hire charges for water works out to Rs. 100-150 lacs per<br />
annum and the same has been incurred between 2003-04 to 2005-06.<br />
The <strong>Municipal</strong>ity has also privatized its sanitation services and a sum of<br />
around Rs. 20 lacs is incurred towards the same from 2003-04 onwards.<br />
Reduction in Expenditure<br />
Depreciation and Finance Charges have not been provided for the years<br />
2005-06 & 2006-07.<br />
No provision for doubtful collection has been made for the years 2005-06 and<br />
2006-07. Based on past financials, the same works out to around Rs. 30 lacs<br />
per annum.<br />
9.6 KEY FINANCIAL INDICATORS<br />
A set of key financial indicators has been derived using the financial data procured<br />
from the <strong>Municipal</strong>ity for the assessment period. These indicators are used to assess<br />
the municipal performance with regards to resource mobilization, fund utilization,<br />
financial performance and collection efficiencies.<br />
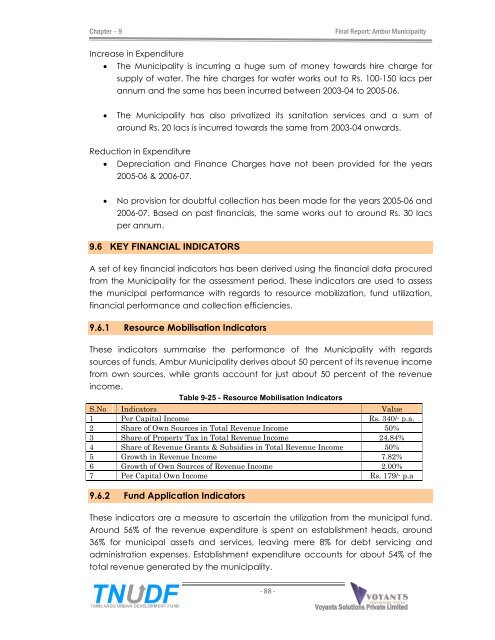
9.6.1 Resource Mobilisation Indicators<br />
These indicators summarise the performance of the <strong>Municipal</strong>ity with regards<br />
sources of funds. Ambur <strong>Municipal</strong>ity derives about 50 percent of its revenue income<br />
from own sources, while grants account for just about 50 percent of the revenue<br />
income.<br />
Table 9-25 - Resource Mobilisation Indicators<br />
S.No Indicators Value<br />
1 Per Capital Income Rs. 340/- p.a.<br />
2 Share of Own Sources in Total Revenue Income 50%<br />
3 Share of Property Tax in Total Revenue Income 24.84%<br />
4 Share of Revenue Grants & Subsidies in Total Revenue Income 50%<br />
5 Growth in Revenue Income 7.82%<br />
6 Growth of Own Sources of Revenue Income 2.00%<br />
7 Per Capital Own Income Rs. 179/- p.a<br />
9.6.2 Fund Application Indicators<br />
These indicators are a measure to ascertain the utilization from the municipal fund.<br />
Around 56% of the revenue expenditure is spent on establishment heads, around<br />
36% for municipal assets and services, leaving mere 8% for debt servicing and<br />
administration expenses. Establishment expenditure accounts for about 54% of the<br />
total revenue generated by the municipality.<br />
- 88 -<br />
Voyants Solutions Private Limited


