

City Corporate & Business Plan - Municipal
City Corporate & Business Plan - Municipal
City Corporate & Business Plan - Municipal

You also want an ePaper? Increase the reach of your titles
YUMPU automatically turns print PDFs into web optimized ePapers that Google loves.
Chapter ñ 9 Final Report: Ambur <strong>Municipal</strong>ity<br />
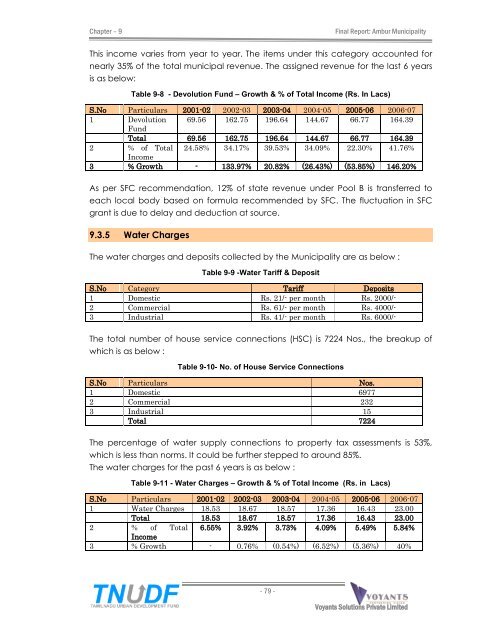
This income varies from year to year. The items under this category accounted for<br />
nearly 35% of the total municipal revenue. The assigned revenue for the last 6 years<br />
is as below:<br />
Table 9-8 - Devolution Fund ñ Growth & % of Total Income (Rs. In Lacs)<br />
S.No Particulars 2001-02 2002-03 2003-04 2004-05 2005-06 2006-07<br />
1 Devolution<br />
Fund<br />
69.56 162.75 196.64 144.67 66.77 164.39<br />
Total 69.56 162.75 196.64 144.67 66.77 164.39<br />
2 % of Total<br />
Income<br />
24.58% 34.17% 39.53% 34.09% 22.30% 41.76%<br />
3 % Growth - 133.97% 20.82% (26.43%) (53.85%) 146.20%<br />
As per SFC recommendation, 12% of state revenue under Pool B is transferred to<br />
each local body based on formula recommended by SFC. The fluctuation in SFC<br />
grant is due to delay and deduction at source.<br />
9.3.5 Water Charges<br />
The water charges and deposits collected by the <strong>Municipal</strong>ity are as below :<br />
Table 9-9 -Water Tariff & Deposit<br />
S.No Category Tariff Deposits<br />
1 Domestic Rs. 21/- per month Rs. 2000/-<br />
2 Commercial Rs. 61/- per month Rs. 4000/-<br />
3 Industrial Rs. 41/- per month Rs. 6000/-<br />
The total number of house service connections (HSC) is 7224 Nos., the breakup of<br />
which is as below :<br />
Table 9-10- No. of House Service Connections<br />
S.No Particulars Nos.<br />
1 Domestic 6977<br />
2 Commercial 232<br />
3 Industrial 15<br />
Total 7224<br />
The percentage of water supply connections to property tax assessments is 53%,<br />
which is less than norms. It could be further stepped to around 85%.<br />
The water charges for the past 6 years is as below :<br />
Table 9-11 - Water Charges ñ Growth & % of Total Income (Rs. in Lacs)<br />
S.No Particulars 2001-02 2002-03 2003-04 2004-05 2005-06 2006-07<br />
1 Water Charges 18.53 18.67 18.57 17.36 16.43 23.00<br />
Total 18.53 18.67 18.57 17.36 16.43 23.00<br />
2 % of Total 6.55% 3.92% 3.73% 4.09% 5.49% 5.84%<br />
3<br />
Income<br />
% Growth - 0.76% (0.54%) (6.52%) (5.36%) 40%<br />
- 79 -<br />
Voyants Solutions Private Limited


