City Corporate & Business Plan - Municipal
City Corporate & Business Plan - Municipal
City Corporate & Business Plan - Municipal
Create successful ePaper yourself
Turn your PDF publications into a flip-book with our unique Google optimized e-Paper software.
Annexure Final Report: Ambur <strong>Municipal</strong>ity<br />
S.No Particulars<br />
I<br />
Income (% of Total<br />
Income)<br />
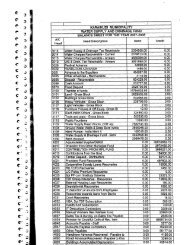
Annexure IX - f : Summary of Income and Expenditure Accounts in Percentage<br />
Audited Un-audited<br />
2001-02 2002-03 2003-04 2004-05 2005-06 2006-07<br />
Rev & Water Elem'tary Total Rev & Water Elem'tary Total Rev & Water Elem'tary Total Rev & Water Elem'tary Total Rev & Water Elem'tary Total Rev & Water Elem'tary Total<br />
Capital Supply Education Capital Supply Education Capital Supply Education Capital Supply Education Capital Supply Education Capital Supply Education<br />
a) Property Tax 24% 63% 91% 36% 13% 60% 93% 22% 14% 40% 95% 22% 17% 50% 97% 28% 24% 73% 100% 38% 17% 64% 99% 28%<br />
b) Other Taxes 5% - - 4% 3% - - 2% 3% - - 3% 5% - - 3% 7% - - 5% 5% - - 4%<br />
c) Assigned Revenue 17% - - 12% 30% - - 25% 15% - - 11% 17% - - 13% 21% - - 15% 10% - - 8%<br />
d) Devolution Fund 34% 0% - 25% 42% 0% - 34% 53% 33% - 47% 45% 29% - 40% 30% 0% - 22% 51% 0% - 40%<br />
e)<br />
f)<br />
Service Charges &<br />
Fees<br />
Grants &<br />
Contribution<br />
6% 32% 0% 11% 5% 29% 0% 8% 5% 18% 0% 7% 6% 20% 0% 9% 9% 27% 0% 13% 7% 36% 0% 11%<br />
0% 0% - 0% 0% 10% - 1% 0% 6% - 1% 0% 0% - 0% 0% 0% - 0% 0% 0% - 0%<br />
g) Sale & Hire Charges 0% - - 0% 0% - - 0% 0% - - 0% 0% - - 0% 0% - - 0% 0% - - 0%<br />
h) Other Income 14% 5% 9% 12% 8% 1% 7% 7% 11% 4% 5% 9% 9% 1% 3% 7% 8% 0% 0% 6% 11% 0% 1% 9%<br />
II<br />
a)<br />
b)<br />
c)<br />
Total Income 100% 100% 100% 100% 100% 100% 100% 100% 100% 100% 100% 100% 100% 100% 100% 100% 100% 100% 100% 100% 100% 100% 100% 100%<br />
Expenditure (% of<br />
Total Expt)<br />
Personnel Cost -<br />
Salaries<br />
Personnel Cost -<br />
Others<br />
Terminal &<br />
Retirement Benefits<br />
44% 11% - 36% 39% 6% - 29% 35% 3% - 22% 40% 4% - 26% 50% 5% - 31% 55% 16% - 48%<br />
1% 0% - 0% 1% 0% - 0% 1% 0% - 0% 1% 0% - 0% 1% 0% - 1% 0% 0% - 0%<br />
9% 2% 11% 8% 10% 2% 5% 8% 6% 0% 6% 4% 5% 0% 11% 3% 10% 0% 0% 6% 11% 0% 0% 9%<br />
d) Operative Expenses 6% 40% 2% 13% 9% 46% 2% 18% 17% 61% 4% 34% 19% 71% 20% 38% 22% 90% 76% 50% 22% 62% 76% 29%<br />
e)<br />
Repairs &<br />
Maintenance<br />
1% 5% 2% 2% 3% 4% 3% 3% 2% 2% 0% 2% 3% 3% 4% 3% 5% 5% 0% 5% 4% 21% 96% 7%<br />
f) Programme Expenses 1% - - 1% 0% - - 0% 1% - - 1% 1% - - 0% 6% - - 4% 2% - - 1%<br />
g)<br />
Admnistrative<br />
Expenses<br />
3% 13% 53% 6% 9% 1% 62% 9% 13% 9% 53% 12% 7% 0% 10% 5% 7% 0% 24% 4% 6% 1% 60% 5%<br />
h) Finance Expenses 12% 20% 3% 13% 8% 33% 10% 14% 5% 20% 10% 11% 5% 16% 55% 9% 0% 0% 0% 0% 1% 0% 0% 1%<br />
I) Depreciation 23% 9% 30% 20% 21% 7% 19% 17% 20% 5% 27% 14% 19% 6% 0% 14% 0% 0% 0% 0% 0% 0% 0% 0%<br />
Total Expenditure 100% 100% 100% 100% 100% 100% 100% 100% 100% 100% 100% 100% 100% 100% 100% 100% 100% 100% 100% 100% 100% 100% 100% 100%<br />
Surplus / (Deficit) (%<br />
of Total Income)<br />
-38% -17% 53% -28% 20% -62% 10% 8% 5% -123% 41% -21% 0% -119% 88% -21% -14% -186% 97% -42% 7% -2% 92% 9%<br />
. - 192 -<br />
Voyants Solutions Private Limited


