Planetary population synthesis
Planetary population synthesis Planetary population synthesis
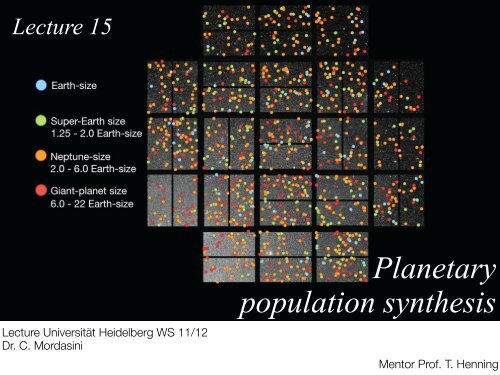
Lecture 15 Lecture Universität Heidelberg WS 11/12 Dr. C. Mordasini Planetary population synthesis Mentor Prof. T. Henning
- Page 2 and 3: Lecture 15 overview 1. Motivation f
- Page 4 and 5: Deal with (a lot of) statistical da
- Page 6 and 7: 2. Method
- Page 8 and 9: Extended core accretion model Forma
- Page 10 and 11: 1 Metallicity assume same in star a
- Page 12 and 13: Edge of comp. disk Formation of the
- Page 14 and 15: 4. The planetary mass distribution
- Page 16 and 17: Mordasini et al. 2012 PIMF: Depende
- Page 18 and 19: Observation ? Towards the underlyin
- Page 20 and 21: Mass distribution II: high RV preci
- Page 22 and 23: 5. The semimajor axis distribution
- Page 24 and 25: Synth. semimajor axis distribution
- Page 26 and 27: 6. Stopping distances
- Page 28 and 29: Gas surface density [g/cm 2 ] MMSN,
- Page 30 and 31: ,-$.&//$01$23&,-$ Formation of M-R
- Page 32 and 33: M-R diagram: effect of opacity Zero
- Page 34 and 35: Number planets per star is reduced
- Page 36 and 37: 8. The metallicity distribution
- Page 38 and 39: Mordasini et al. 2009b Synthetic po
- Page 40 and 41: Mordasini et al 2012 Metallicity of
Lecture 15<br />
Lecture Universität Heidelberg WS 11/12<br />
Dr. C. Mordasini<br />
<strong>Planetary</strong><br />
<strong>population</strong> <strong>synthesis</strong><br />
Mentor Prof. T. Henning
Lecture 15 overview<br />
1. Motivation for <strong>population</strong> <strong>synthesis</strong><br />
2. Method<br />
3. Formation tracks and a-M distribution<br />
4. Mass distribution<br />
5. Semimajor axis distribution<br />
6. Stopping distance of close-in planets<br />
7. Radius distribution<br />
8. Metallicity distribution
1. Motivation for planetary<br />
<strong>population</strong> <strong>synthesis</strong>
Deal with (a lot of) statistical data<br />
The last years of observational exoplanet research was characterized by a tremendous increase in<br />
data, i.e. in large number of detections. Of particular importance are the discoveries by high precision<br />
radial velocity observations, and by the KEPLER satellite (transit photometry). But also ground based<br />
transit observations, microlensing and direct imaging observations contribute to the very large data<br />
set.<br />
More, even bigger data sets are expected to come in the future (e.g. the GAIA satellite, an astrometric<br />
mission), or WFIRST (a microlensing satellite).<br />
Due to the different observational techniques, the different data sets contain different constraints which can in<br />
the end help to increase our understanding of the physics of planet formation. But it is often difficult to unite the<br />
different constraints into one coherent picture.
surements<br />
fraction of<br />
derstandiondistriauer<br />
et al.<br />
.<br />
error and<br />
he largest<br />
ncertainty<br />
ly to 35%<br />
ansit over<br />
randomly<br />
e duration<br />
al transit.<br />
ion (1) by<br />
tio threshnservative<br />
does not<br />
are grazed<br />
perfect<br />
intervals.<br />
erval (apransit)<br />
by<br />
ct the nuly<br />
equally.<br />
adius<br />
agnitude<br />
te the dered<br />
planet<br />
rginalizing<br />
puted ocranges<br />
of<br />
50 days.<br />
values in<br />
rrence for<br />
ays. The<br />
) increases<br />
rence with<br />
(4)<br />
anets havervalcenstant,<br />
and<br />
se param-<br />
R⊕ bins<br />
a lack of<br />
ng a max-<br />
. Each rat<br />
fraction,<br />
planet der<br />
of target<br />
by the bi-<br />
(5)<br />
in a spec-<br />
Number of Planets per Star with P < 5<br />
Number of Planets per Star with P < 50 days<br />
0.100<br />
0.010<br />
0.001<br />
0.12<br />
0.10<br />
0.08<br />
0.06<br />
0.04<br />
0.02<br />
Deal with (a lot of) statistical data<br />
1.0 1.4 2.0 2.8 4.0 5.7 8.0 11.3 16.0 22.6<br />
Planet Radius (RE) 0.00<br />
1.0 1.4 2.0 2.8 4.0 5.7 8.0 11.3 16.0 22.6<br />
Planet Radius (RE) Fig. 5.— Planet occurrence as a function of planet radius for<br />
planets with P
2. Method
specialized<br />
models<br />
The essence of <strong>population</strong> <strong>synthesis</strong><br />
Ida & Lin 2004++<br />
Thomes et al. 2008<br />
Mordasini et al. 2009++<br />
Miguel et al. 2008,2009<br />
extraction process<br />
Towards a “Standard model of planet formation and<br />
evolution” or “Super-Montecarlo”....<br />
- you need specialized models to<br />
know what is important<br />
- while you get the essence, you<br />
have lost the subtlety of the original<br />
- but what is left is a concentrate<br />
of many effects<br />
- and lets you see the big<br />
picture (hopefully)<br />
<strong>population</strong><br />
<strong>synthesis</strong>
Extended core accretion model<br />
Formation model tested in the Solar<br />
System (Alibert, Mordasini, Benz 2004)<br />
rvational motivation for <strong>population</strong> <strong>synthesis</strong> 9<br />
Mordasini et al. 2009a<br />
Mordasini et al. 2009b<br />
Observed<br />
<strong>population</strong><br />
e 1.1: The red line shows the total number of known extrasolar planetary companions as a function<br />
epoch of discovery. Note how the number has grown very quickly in the last years, approximately as<br />
nce 1995 (the green fitting curve goes as t 2.5 ). The data is taken from J. Schneiders extrasolar planet<br />
opedia at exoplanet.eu. Before 1995, four pulsar planets, and a low mass companion of HD 114762<br />
m et al., 1989) were known. Even if the latter object has a projected mass in the planetary mass domain<br />
are indications that this system is seen in a rather face-on configuration, so that the true mass of the<br />
nion could be much larger, maybe even in the low mass M star regime (Hale, 1995).<br />
cations of <strong>population</strong> <strong>synthesis</strong> (Popov & Prokhorov, 2004).<br />
ost of the planets in the plot were discovered by the radial velocity (RV) method, where<br />
easures the wobble of the star around the common center of mass of the star-planet<br />
. A part of the thesis was also the observational search of extrasolar planets with the<br />
ethod using the HARPS spectrometer (Pepe et al., 2004) which yielded a number of<br />
sting discoveries No (Santos match: et al., 2004a; improve,<br />
Lovis et al., 2005, 2006; Udry et al., 2006; Mayor<br />
, 2008; Curto et al., 2006). This observational work within the HARPS consortium (PI:<br />
el Mayor) allowed change to learn andparameters understand the most important observational technique to<br />
t extrasolar planets. It also made possible a very direct access to the latest observational<br />
s, a direct insight in the various biases involved in the detection process, and a direct<br />
oration between the observational approach at the Obsérvatoire de Genève, and the<br />
etical approach of our group in Bern. Therefore, the observational results obtained by<br />
V method form the main observational comparison data that was used in the theoretical<br />
Population Synthesis Principle<br />
Draw and compute<br />
synthetic<br />
planet <strong>population</strong><br />
Apply observational<br />
detection bias<br />
Comparison:<br />
Observable sub-<strong>population</strong><br />
- Distribution of semi-major axis<br />
- Distribution of masses<br />
- Fraction of hot/cold Jupiters<br />
- Metallicity effect<br />
Initial Conditions: Probability<br />
distributions & parameters<br />
Disk gas mass<br />
Disk dust mass<br />
Disk lifetime<br />
Match<br />
From<br />
observations<br />
Cross check<br />
Couple to other detection<br />
methods<br />
Predictions<br />
(going back to the full<br />
synthetic <strong>population</strong>)<br />
Model solution<br />
found!
Formation model<br />
Planet-Planet<br />
1. Disk migration<br />
2. Planet planet interaction<br />
(n-body)<br />
3. Planetesimal-envelope<br />
interaction<br />
4. Gaseous envelope structure<br />
5. Protoplanetary gas disk<br />
6. Disk of planetesimals<br />
Standard components, but coupled
1 Metallicity<br />
assume same in star<br />
and disk<br />
Stellar [Fe/H] from spectroscopy.<br />
Gaussian distribution for [Fe/H]<br />
with µ ~0.0, σ~ 0.2. (e.g. Santos<br />
et al. 2003)<br />
2 Disk (gas) masses<br />
Thermal continuum emission from cold dust at mm<br />
and submm wavelengths (Ophiuchus nebula).<br />
β Pic 12 K6–M4 0 ZS04 JA06<br />
NGC 2353 12 K0–M4 0<br />
Initial conditions<br />
N. C. Santos et al.: Statistical properties of exoplanets 367<br />
+6 K05 this work<br />
Collinder 65 25 K0–M5 0 +7 Tuc-Hor 27 K1–M3 0<br />
K05 this work<br />
+8 NGC 6664 46 K0–M1 0<br />
ZS04 JA06<br />
+4 S82 this work<br />
References. Schmidt (1982, S82),Park et al. (2001, P01),Hartmann et al. (2005, Ha05),Kharchenko et al. (2005, K05),Mohanty et al<br />
(2005, M05),Sicilia-Aguilar et al. (2005, SA05),Carpenter et al. (2006, C06),Lada et al. (2006, L06),Jayawardhana et al. (2006, JA06)<br />
Sicilia-Aguilar et al. (2006, SA06),Dahm & Hillenbrand (2007, D07),Briceño et al. (2007, B07),Jeffries et al. (2007, JE07), Hernández et al<br />
(2007, He07),Sana et al. (2007, S07),Caballero (2008, C08),Flaherty & Muzerolle (2008, FM08),Luhman et al. (2008, L08),Sicilia-Aguila<br />
et al. (2009, S09),Zuckerman & Song (2004, ZS04).<br />
Santos et al. 2003<br />
3 Disk lifetime<br />
L-band (3.4 μm)<br />
photometry:<br />
- excess caused by μsized<br />
dust @ ~900K<br />
... ok to < 10 AU<br />
Fig. 2. Left: metallicity distribution of stars with planets making part of the CORALIE planet search sample (shaded histogram) compared<br />
with the same distribution for the about 1000 non binary stars in the CORALIE volume-limited sample (see text for more details). Right: the<br />
percentage of stars belonging to the CORALIE search sample that have been discovered to harbor planetary mass companions plotted as a<br />
function of the metallicity. The vertical axis represents the percentage of planet hosts with respect to the total CORALIE sample.<br />
Haisch et al. 2001, Fedele et al. 2010<br />
NGC 2024<br />
Trapezium<br />
ANDREWS ET AL.<br />
IC 348<br />
NGC 2362<br />
Fig. 4. facc (dots) versus fIRAC (squares) and exponential fit for facc (dot<br />
suggests that we may be looking at the approximate limit on the<br />
metallicity of the stars in the solar neighborhood.<br />
Here we have repeated the analysis presented in Paper II,<br />
but using only the planet host stars included in the well defined<br />
CORALIE sample7 Fig. 3. Accreting stars-frequencysurvey as a function (Udry et of al. age. 2000). New data The(based metallicities for this latter sam-<br />
on the VIMOS survey) are shownple as were (red) computed dots, literature fromdata a precise as (green) calibration of the CORALIE<br />
squares. Colored version is available<br />
Cross-Correlation<br />
in the electronic<br />
Function<br />
form.<br />
(see Santos et al. 2002a); since the<br />
4 Initial semimajor axis of the seed embryo:<br />
calibrators used were the stars presented in Paper I, Paper II,<br />
. This sub-sample He i 5876 has Åa total in emission of 41 ob- (EW and= this −0.5 paper, Å,–0.6Årespectively).<br />
the final results are in the very same scale.<br />
jects, ∼60% of them having planets The Analytical discovered evidence of in large the work con- (Lissauer & Steward 1992) and<br />
Hα10% together The knowledge with the He of ithe emission metallicity is distribution for stars in<br />
text of the CORALIE survey itself. most Here likely we have due included to ongoing all mass the solar accretion, neighborhood and these (and twoincluded stars<br />
numerical simulations (Kokubo & in Ida the CORALIE 2000): sam- spacing<br />
stars known to have companions with areminimum classifiedmasses as accreting lowerstars.<br />
ple)Weestimateafractionofaccret- permits us to determine the percentage of planet host stars<br />
than ∼18 MJup; changing this limiting to stars e.g. 10 in NGC MJup 6231 does of not 11/75 peror metallicity 15 (±5%). bin. WeThe warn result the reader<br />
between bodies Δ ∝ a<br />
is seen in Fig. 2 (right panel). As<br />
change any of the results presented below. that this might be a lower limit we can to the perfectly actual see, fraction the probability of accret- of finding a planet host is<br />
The fact that planets seem to orbit ingthe stars; most further metal-rich investigation stars a strong is needed function to disentagle of its metallicity. the nature This result confirms former<br />
in the solar neighborhood has led some (accretion groupsvs tobinarity/rapid build planetda<br />
rotation) analysis done ofda the in Paper systems II and with bylarge Reid (2002). For example, here<br />
search samples based on the high metal Hα10% p(a)da content (>300 of kmtheir s host we can see that about = 7% dlog(a) of the stars in the CORALIE const. sample<br />
stars. Examples of these are the stars BD-10 3166 (Butler et al. having metallicity a between 0.3 and 0.4 dex have been discov-<br />
2000), HD 4203 (Vogt et al. 2002), and HD 73526, HD 76700, ered to harbor a planet. On the other hand, less than 1% of the<br />
HD 30177, and HD 2039 (Tinney et al. 2002). Although clearly stars having solar metallicity seem to have a planet. This result<br />
increasing the planet detection rate, these kind of metallicity bi- is thus probably telling us that the probability of forming a giant<br />
ased samples completely spoil any statistical study. Using only planet, or at least a planet of the kind we are finding now, de-<br />
stars being surveyed for planets in the context of the CORALIE pends strongly on the metallicity of the gas that gave origin to<br />
survey (none of these 6 stars is included), a survey that has the star and planetary system. This might be simple explained if<br />
never used the metallicity as a favoring quantity for looking for we consider that the higher the metallicity (i.e. dust density of<br />
planets, has thus the advantage of minimizing this bias. the disk) the higher might be the probability of forming a core<br />
−1 0.8<br />
0.6<br />
0.4<br />
0.2<br />
(a)<br />
ted line) and for fIRAC (dashed line).<br />
Andrews et al. 2010 (b) (c) (d)<br />
NGC 6531<br />
We identified 26 cluster members in NGC 6531 based on the<br />
presence of Hα emission and presence of Li. 13 other sources<br />
show presence of Li 6708 Å, but have Hα in absorption. As in<br />
the case of NGC 6231, these might be cluster members with no<br />
or a reduced chromospheric activity. We measured the EW of L<br />
6708 Å of these 13 sources and compared them with the typi<br />
) but low EW [Hα].<br />
cal EW of the 26 stars in NGC 6531 showing also Hα emission<br />
Page 5 of 7<br />
0.0<br />
4 3 2 1 0<br />
Log M⇤M ⇥<br />
5 Stellar mass
3. Formation tracks<br />
and<br />
mass-distance distribution
Edge of<br />
comp. disk<br />
Formation of the a-M diagram<br />
Dittkrist et al. in prep<br />
One model,<br />
very different<br />
outcomes.<br />
isothermal type I<br />
adiabatic type I<br />
saturated type I<br />
type II<br />
Mstar=1M⊙, alpha=7x10⁻³ Starting mass<br />
Irradiated disk<br />
2% interstellar grain opacity
Inner boundary comp. disk<br />
0.1 AU<br />
Type II Migration<br />
Limit<br />
Synthetic a-M diagram<br />
Giants<br />
<strong>Planetary</strong> Desert<br />
Failed cores<br />
(Proto-terrestrial planets)<br />
Timescale Limit<br />
Iceline<br />
upturn<br />
Mainly icy core<br />
Mainly rocky core<br />
Menv / Mheavy > 10<br />
1< Menv / Mheavy < 10<br />
Menv / Mheavy < 1<br />
Mstar=1 M⊙, alpha=7x10 -3<br />
Irradiated disk. Σ(0.1)=0<br />
non-isothermal migration<br />
0.3% interstellar grain opacity
4. The planetary<br />
mass distribution
Mordasini<br />
et al. 2009b<br />
Model incompleteness<br />
<strong>Planetary</strong> Initial Mass Function PIMF<br />
Peak at low masses<br />
Neptunian Bump<br />
Minimum: <strong>Planetary</strong> desert<br />
Flat Giant’s Plateau<br />
Superjupiter Tail<br />
• Complex structure, dominated by low mass planets<br />
• Consistent w. non-detection of Jupiters around 90% stars.<br />
• Maxima at masses similar to Solar System planets.<br />
MStar=1 MSun<br />
Nominal Model<br />
Type Mass (MEarth) %<br />
(Super)-Earth < 7 58<br />
Neptunian 7-30 17<br />
Intermediate 30-100 6<br />
Jovian 100-1000 14<br />
Super-Jupiter > 1000 4<br />
Model predicts that planets with<br />
M < 30 MEarth account for over<br />
75% of all planets
Mordasini et al. 2012<br />
PIMF: Dependence on disk properties<br />
Metallicity Disk mass Disk lifetime<br />
Fe/H mainly just scales<br />
PIMF for giant planets:<br />
Fe/H: threshold, but final<br />
mass not given by Fe/H<br />
•higher number of giants<br />
•but not more massive<br />
Inverted metallicity<br />
effect for low mass<br />
Weak metallicity<br />
effect for Neptunes<br />
Disk mass changes the MF<br />
shape for giant planets.<br />
High disk mass: giant<br />
planets of higher mass, but<br />
less of lower mass.<br />
Disk lifetime changes both.<br />
Long living disks: giants<br />
• more numerous and<br />
• higher mass<br />
-Correlation with MD
We derive the statistical properties of planets from the 1330 FGKM target stars<br />
for which we have uniform precision of 3 m s −1 and at least 6 years duration of<br />
observations. Detected exoplanets have minimum masses, Msin i, between 6 MEarth<br />
Mass distribution: low RV precision<br />
and ∼15 MJup, with an upper mass limit corresponding to the (vanishing) tail of<br />
the mass distribution. The planet mass distribution is shown in Fig. 1 and follows<br />
a power law, dN/dM ∝ M −1.05 54), 55) affected very little by the unknown sin i. 41)<br />
The paucity of companions with Msin i greater than 12 MJup confirms the presence<br />
of a “brown dwarf desert” 54) for companions with orbital periods up to a decade.<br />
Using a synthetic observational bias for a RV survey of 10 years at 10 m/s precision, find sub-<strong>population</strong><br />
of detectable synthetic planets.<br />
Number of Planets<br />
20<br />
15<br />
10<br />
5<br />
Planet Mass Distribution<br />
dN/dM ∝ M −1.05<br />
104 Planets<br />
Keck, Lick, AAT<br />
Marcy et al. 2005<br />
0<br />
0 2 4 6 8 10 12 14<br />
M sin i (MJUP) Fig. 1. The histogram of 104 planet masses (Msin i) found in the uniform 3 m s −1 Doppler survey<br />
of 1330 stars at Lick, Keck, and the AAT telescopes. The bin size is 0.5 MJup. The distribution<br />
of planet masses rises as M −1.05 from 10 MJup down to Saturn masses, with incompleteness at<br />
lower masses.<br />
The mass distribution is very well reproduced.<br />
Forming really massive planets is hard (insufficient mass & time)
Observation<br />
?<br />
Towards the underlying mass distribution<br />
Udry & Santos 2007<br />
All instruments<br />
HARPS (1 m/s)<br />
Observational<br />
bias<br />
Hints of the Neptunian bump and<br />
the minimum at 30 ME?<br />
Synthetic<br />
Mordasini et al. 2009<br />
10 m/s<br />
1m/s<br />
0.1 m/s<br />
Full Population<br />
Very strong sign of core accretion<br />
(all models - Ida & Lin, Mordasini et al, Miguel et al.)
Depth of the minimum<br />
rch for southern extra-solar planets. XXIII. 9<br />
e<br />
-<br />
to<br />
so<br />
n<br />
a;<br />
en)<br />
er<br />
sa<br />
ly<br />
ns<br />
re<br />
ts<br />
yrre<br />
st<br />
el<br />
Dependence on gas accretion rate in runaway<br />
in Mordasini Fig. 7. Theoretical et al. 2011<br />
mass distribution from Neptunian to Jovian<br />
<strong>Planetary</strong> gas accretion rate<br />
limited to slow viscous disk<br />
accretion rate.<br />
Shallow minimum.<br />
<strong>Planetary</strong> gas accretion rate not<br />
limited to disk accretion rate for<br />
gas already in the planet’s hill<br />
sphere (fast accretion).<br />
Deep minimum.<br />
Detections important for directly<br />
constraining formation theory.
Mass distribution II: high RV precision<br />
uncorrected<br />
for obs. bias<br />
corrected for obs. bias<br />
Mayor et al. 2011<br />
•RV: thanks to 1 m/s precision observations, a new huge <strong>population</strong> of low<br />
mass planets has emerged in the last few years.<br />
•bi (tri?) modal distribution: minimum at about 30 Earth masses, too.<br />
•neptunian bump: strong increase between 30-15 ME.<br />
•overall maximum at small masses.
Synthetic PIMF and rv precision<br />
Observational RV precision 10, 1 and 0.1 m/s<br />
•Bimodal at 1 m/s (Jovian, Neptunian), and trimodal at 0.1 m/s (Jov., Nept., proto-terrestrial)<br />
•At least qualitatively similar as observations.<br />
•At low masses, model incomplete, so direct comparison very difficult,<br />
•but distinction between Jovian (w. gas runaway) and Neptunian (w/o gas runaway)<br />
•and distinction between objects which migrated significantly (Neptunian), and those<br />
formed in situ (proto-terrestrial), could be real.
5. The semimajor axis<br />
distribution
where they have to stop before falling onto the star. Several stopping mechanisms<br />
have been proposed, invoking, e.g., a magnetospheric central cavity of the accretion<br />
disk, tidal interactions with the host stars, Roche-lobe overflow by the young inflated<br />
giant planet, or photoevaporation. The question is, however, still debated. Alternative<br />
points of view invoke in situ formation (Bodenheimer, Hubickyj & Lissauer<br />
2000), possibly triggered through disk instabilities (Boss 1997, Durisen et al. 2007).<br />
Note however that, even in such cases, subsequent disk-planet interactions leading to<br />
N<br />
20<br />
15<br />
10<br />
Semimajor axis distribution: giant planets<br />
5<br />
0<br />
1 2 3<br />
log(Period) (days)<br />
uncorrected for obs. bias<br />
The semimajor axis distribution of giant planets found by RV consists of a<br />
•pile up at a period of about 3 days (0.04 AU). Stopping mechanism for migration?<br />
•maybe this pile up is only tiny, when properly correcting for obs. bias...<br />
•a period valley (10 d < P < 100 d). Timescale effect?<br />
•an upturn at about 1 AU. Reservoir at large distances? Original formation region?<br />
Udry· Santos<br />
Udry & Santos 2007<br />
Msini>0.75 MJ<br />
Msini
Synth. semimajor axis distribution<br />
ig. 8. Starting position relative to the iceline of embryos growing<br />
Preferred starting<br />
ventually to planets with a final mass M ≥ 300M⊕ as a function<br />
f [Fe/H]. Symbols show the disk gas mass: Red filled squares are<br />
ow [MD/MSN] < −0.1. Black triangles are intermediate [MD/MSN]<br />
location (6-7 AU)<br />
-0.1 to 0.4), and green open circles finally are those disk with a large<br />
MD/MSN] > 0.4.<br />
he minimal necessary planetesimal disk mass is reduced at<br />
mall distances, in the second case at large distances while in<br />
he other parts of the plot, the points lie on top of each other.<br />
his shows that at small distances (where the core accretion<br />
imescales are short) the small isolation masses (and the associted<br />
long Kelvin-Helmholtz timescales for gas accretion) limit<br />
iant planet growth. Isolation masses decrease with decreasing<br />
emimajor axis (at least for the chosen solid surface profile),<br />
hich must be canceled out by an increasing ΣS. Faster type<br />
C. Mordasini et al.: Extrasolar planet <strong>population</strong> <strong>synthesis</strong> IV 13<br />
-embryos of giant-planetsto-be<br />
come from outside the<br />
iceline (Ida & Lin 2004). More<br />
solids=>more massive cores.<br />
-high [Fe/H]: start also inside.<br />
Planets inside 0.1 AU excluded Mp>300 MEarth Mstar= 1 Msun<br />
formation, and influences in this way the birth place of giant<br />
planets to be. In the left panel of Fig. 8 we have directly plotted<br />
the position where embryos start to grow astart which later become<br />
planets larger than 300 M⊕, relative to the position of the<br />
iceline aice in the corresponding disk, as a function of [Fe/H].<br />
Additionally, the disk lifetime was color coded. Note that in our<br />
simulation, the location of the iceline is independent of [Fe/H]<br />
(but dependent on Σ0). Possible effects of a modification of the<br />
disk temperature structure and thus the iceline location via a<br />
metallicity dependent disk opacity are thus not included.<br />
The figure shows that at low metallicities [Fe/H] −0.3,<br />
planets can only start to form in a small region with a width<br />
of 2-3 AU just outside the iceline. In this low [Fe/H] disks,<br />
only in this region massive cores can form quickly enough.<br />
With increasing [Fe/H], the zone expands to larger radii, and<br />
Distance migrated [AU]<br />
for [Fe/H] −0.15, giant planets can also form inside the ice-<br />
line. This corresponds, with the highest Σ0 of the distribution<br />
(which is necessary, see next section) to a solid surface density<br />
about 3.5 times as high as ΣS,SN. These results are qualitatively<br />
similar to those of Ida & Lin (2004a), except for a somewhat<br />
Log(Mdisk/MMSN)<br />
lower numerical value (3.5 instead of 5). The absence of red<br />
squares at negative values of astart − aice shows that the disk<br />
masses must always be rather large for the formation of giant<br />
planets Typical inside the iceline, migration<br />
even if [Fe/H] is large. At higher<br />
[Fe/H], giant planets can form at almost all semimajor axes if<br />
concurrently [MD/MSN] is high indicated by green open circles<br />
distance<br />
(about 1 AU to 20 AU), but the preferred formation location is<br />
still beyond the iceline. Finally, at the highest [Fe/H], the loca-<br />
-about 3-5 AU. Not so much...<br />
tion of the iceline becomes less important.<br />
One therefore sees from the figure, that while at low metallicities,<br />
pathways to giant planets are very restricted and in particular<br />
only possible in a small part of the disk, this is not the<br />
case for higher metallicities, where giant planets can form all<br />
over the disk.<br />
There is another important effect for the starting positions,<br />
which cannot be directly seen in Fig. 8 which was already<br />
quickly mentioned in sect. 3.2.3. For giant planet formation<br />
at low [Fe/H], high [MD/MSN] Mordasini et areal. needed 2012<br />
for compensation<br />
18 C. Mordasini et al.: Extrasolar p<br />
Fig. 12. Distribution of final semimajor axes of synthetic planets larger th<br />
for [Fe/H]< −0.2, blue solid lines for −0.2
[Fe/H] - semimajor axis<br />
Observations: No clear correlation of [Fe/H] & semi. axis (giants). Udry & Santos 2007<br />
Somewhat surprising: High [Fe/H] allow giant planet formation inside aice..<br />
•High [Fe/H]: Small starting positions<br />
➡Small disk gas mass sufficient.<br />
➡Drives slow migration.<br />
➡Planet quickly more massive than local gas disk mass: slows down.<br />
➡Migration only over small distance.<br />
•Low [Fe/H]: Large starting positions<br />
➡Mean necessary gas mass high.<br />
➡Drives rapid migration<br />
➡Planets need to migrate over large extent until collected enough planetesimal for runaway<br />
and to eventually slow down.<br />
➡Migration over large distance.<br />
[AU] high [Fe/H] mean [Fe/H] low [Fe/H]<br />
Effects compensate!<br />
Complex interaction of<br />
various processes.<br />
Mfinal>300 Mearth<br />
mean astart 6.2 6.8 7.2<br />
mean a-astart -3.5 -4.0 -4.7<br />
mean a 2.7 2.8 2.6
6. Stopping distances
m Kepler 13<br />
Number of Planets per Star<br />
0.1000<br />
0.0100<br />
0.0010<br />
P 0 = 1.7 days<br />
P 0 = 2.2 days<br />
0.0001<br />
0.68 1.2 2.0 3.4 5.9 10 17 29 50<br />
Orbital Period (days)<br />
Howard et al. 2011<br />
P 0 = 7.0 days<br />
Close-in low mass/radius planets<br />
2−4 R E<br />
4−8 R E<br />
8−32 R E<br />
ig. 7.— Measured planet occurrence (filled circles) as a funcn<br />
of orbital period with best-fit models (solid curves) overlaid.<br />
ese models are power laws with exponential cutoffs belowachareristic<br />
period, P0 (see text and equation 8). P0 increases with<br />
reasing planet radius, suggesting that the migration and parkmechanism<br />
that deposits planets close-in depends on planet<br />
ius. Colors correspond to the same ranges of radii as in Figure<br />
The occurrence measurements (filled circles) are the same as in<br />
ure 6, however for clarity the 2–32 R⊕ measurements and fit<br />
excluded here. As before, only stars in the solar subset (Table<br />
and planets with Rp > 2 R⊕ were used to compute occurrence.<br />
e integrated occurrence to P = 50 days is given in<br />
ble 4.<br />
4. STELLAR EFFECTIVE TEMPERATURE<br />
4.1. Planet Occurrence<br />
n the previous section we considered only GK stars<br />
th properties consistent with those listed in Table 1.<br />
Mayor et al. 2011<br />
particular, only stars with Teff =4100–6100Kwere<br />
Cut off below P0:<br />
-small radii 2-4 Re: P0 = 7 days<br />
-large radii >4 Re : P0 = 2 days.<br />
Neptunian and smaller sized further out than giant planets.<br />
No pile up at 3 days. Different stopping mechanism?<br />
Msini
Gas surface density [g/cm 2 ]<br />
MMSN, irrad., Σ0 ∝ a -0.9,<br />
,alpha=7x10 -3<br />
Gas surface density [g/cm 2 ]
7. Radius distribution
,-$.&//$01$23&,-$<br />
Formation of M-R diagram<br />
Fraction Z of heavy elements<br />
Z 95 %<br />
•Rapid collapse at about 0.2 MJ<br />
•when Z≈ 0.5<br />
•Two groups for R (pre/post<br />
collapse) during formation.<br />
•After disk dispersal (T>10 Myrs),<br />
slow contraction.<br />
•At late times, characteristic<br />
maximum at about 4 MJ (degeneracy).<br />
•Z decreasing with total mass:<br />
imprint of formation (TKH)!
Mordasini et al in prep.<br />
M-R diagram<br />
Synthetic <strong>population</strong> and<br />
all known planets with<br />
known M-R outside 0.1<br />
AU (Solar System &<br />
Exoplanets)<br />
Z = Mcore/M<br />
Orange: Z ≤ 1%<br />
Red: 1 < Z ≤ 5%<br />
Green: 5 < Z ≤ 20%<br />
Blue: 20 < Z ≤ 40%<br />
Cyan: 40 < Z ≤ 60%<br />
Magenta: 60 < Z ≤ 80%<br />
Yellow: 80 < Z ≤ 95%<br />
Brown: 95 < Z ≤ 99%<br />
Black: Z > 99%
M-R diagram: effect of opacity<br />
Zero grain opacity Full interstellar grain opacity<br />
Mordasini et al in prep.<br />
The lower the grain opacity in the envelope, the easier for the planet to accrete gas (reduced<br />
pressure support of the envelope). During evolution: The smaller the opacity, the faster the<br />
cooling (smaller radii).
Planet Radius, R p (R E)<br />
32<br />
16<br />
0.001 0.002 0.004 0.0079 0.016 0.032 0.063 0.13 0.25 0.50 1.0<br />
0.000035 0.00007 0.00014 0.00028 0.00056 0.0011 0.0022 0.0044 0.0088 0.018 0.035<br />
8<br />
4<br />
2<br />
1 (2)<br />
58018<br />
1 (4) 0.0021<br />
4 (45) 0.022 2 (18) 0.0087 4 (60) 0.030 5 (153) 0.076 6 (208) 0.10 5 (198) 0.099<br />
57907over<br />
0.00007 all planets 57808 0.00078 with 57749P<br />
0.00030 < 57653 50 days. 0.0010 57538 We 0.0027 57429 computed 0.0036 57240 oc- 0.0035<br />
1 (5)<br />
52618<br />
It is worth identifying additional sources of error and<br />
simplifying assumptions in our methods. The largest<br />
source of error stems directly from 35% rms uncertainty<br />
Planet Occurrence from Kepler 9<br />
Planet Occurrence − d 2 in R⋆ from the KIC, which propagates directly to 35%<br />
uncertainty in Rp. We assumed a central transit over<br />
the full stellar diameter in equation (2). For randomly<br />
distributed transiting orientations, the average duration<br />
is reduced to π/4 times the duration f/dlogP/dlogR of a central transit.<br />
p<br />
Thus, this correction reduces our SNR in equation (1) by<br />
afactorof 0.001<br />
Howard et al. 2011<br />
0.12<br />
π/4, i.e. a true signal-to-noise ratio thresh-<br />
old of 8.8 instead of 10.0. This is still a very conservative<br />
2 (11) 0.0054 4 (39) 0.019 6 (69) 0.034 1 (15) 0.0071 1 (28) 0.014 1 (25) 0.012 3 (168) 0.082<br />
58031 0.00019 58028 0.00067 58022 0.0012 58017 0.00025 58009 0.00049 58004 0.00043 57997 0.0029<br />
merator and denominator of equation (2) nearly equally.<br />
0.0010 1 (6)<br />
0.00004 58009<br />
0.0029 4 (34)<br />
0.00010 58004<br />
Planet Occurrence − f cell<br />
detection threshold. Additionally, our method does not<br />
account for the small fraction of transits that are grazing<br />
√ and have reduced significance. We assumed perfect<br />
t scaling for σCDPP values computed for 3 hr intervals.<br />
This may underestimate 1 (9) 0.0042 σCDPP for 1 (15) a 60.0075 hr interval 1 (52) (ap- 0.026<br />
58036 0.00015<br />
58030 0.00026<br />
58020 0.00090<br />
proximately the duration of a P = 50 day transit) by<br />
∼10%. These are minor corrections and affect the nu-<br />
3.1. Occurrence as a Function of Planet Radius<br />
0.017 3 (25)<br />
0.00058 57998<br />
Comparison: KEPLER data<br />
0.012 1 (15)<br />
0.00043 57988<br />
0.0076 3 (70)<br />
0.00027 57981<br />
0.034 4 (154)<br />
0.0012 57963<br />
3 (21) 0.011 7 (64) 0.032 21 (269) 0.15 31 (521) 0.30 36 (893) 0.53 34 (1101) 0.79 18 (749) 0.61<br />
56665 0.00037 55966 0.0011 54585 0.0051 52260 0.010 48639 0.019 43318 0.028 36296 0.021<br />
all planets in a radius interval with P < 50 days. The<br />
3 (10)<br />
1 30446<br />
0.68<br />
0.0075 1 (10)<br />
0.00026 22540<br />
1.2<br />
0.011 4 (50)<br />
0.00040 15445<br />
2.0<br />
0.067 6 (59) 0.22 1 (18)<br />
0.0023 9764 0.0077 5784<br />
3.4 3.4df(R) 5.9<br />
0.062 3 (85)<br />
0.0022 3170<br />
10<br />
0.81 2 (41)<br />
0.028 1605<br />
17<br />
0.95<br />
0.033<br />
29 50<br />
Orbital Period, P (days)<br />
Fig. 4.— Planet occurrence as a function of planet radius and orbital period for P 10 are shown Here as blackdf(R)/d dots. The phaselog space is Rdivided is into the a grid mean of logarithmically number spaced cells ofwithin planets which planethav occurrence<br />
is computed. Only stars in the “solar subset” (see selection criteria in Table 1) were used to compute occurrence. Cell color indicates<br />
planet occurrenceing with the P
Number planets per star<br />
is reduced to π/4 times the duration of a central transit.<br />
Thus, this correction reduces our SNR in equation (1) by<br />
afactorof<br />
Radius distribution of KEPLER planets<br />
π/4, i.e. a true signal-to-noise ratio threshold<br />
of 8.8 instead of 10.0. This is still a very conservative<br />
detection threshold. Additionally, our method does not<br />
account for the small fraction of transits that are grazing<br />
√ and have reduced significance. We assumed perfect<br />
t scaling for σCDPP values computed for 3 hr intervals.<br />
This may underestimate σCDPP for a 6 hr interval (ap-<br />
Nominal Model: all a<br />
T=5x10 9 yrs<br />
Nominal Model: P
is reduced to π/4 times the duration of a central transit.<br />
Thus, this correction reduces our SNR in equation (1) by<br />
afactorof<br />
Radius distribution of KEPLER planets II<br />
π/4, i.e. a true signal-to-noise ratio threshold<br />
of 8.8 instead of 10.0. This is still a very conservative<br />
detection threshold. Additionally, our method does not<br />
account for the small fraction of transits that are grazing<br />
√ and have reduced significance. We assumed perfect<br />
t scaling for σCDPP values computed for 3 hr intervals.<br />
Number planets per star<br />
Mordasini et al in prep.<br />
Nearly no type I: all a<br />
T=5x10 9 yrs<br />
Nearly no type I: P
8. The metallicity<br />
distribution
Correlation stellar [Fe/H] & giant planet frequency<br />
N. Santos et al. (2005)<br />
search sample (all stars)<br />
stars with giant planets<br />
•the detection probability for giant planets is a strongly increasing function of<br />
the host star metallicity.<br />
•No hot Jupiters found in globular cluster 47 Tuc ([Fe/H]=-0.76). Expected for<br />
solar neighborhood frequency (~0.5%): seven discoveries.<br />
•Best known star-planet correlation for exoplanets. Important constraint for<br />
formation.
Mordasini et al. 2009b<br />
Synthetic <strong>population</strong> observable at 10 m/s<br />
[Fe/H]<br />
Blue: Observation (Fischer & Valenti 2005)<br />
Red: Observation (Udry & Santos 2007)<br />
Black: Observable synthetic planets<br />
cf. also Santos et al. 2004, 2005<br />
∝ Z 2<br />
∝ Z<br />
Reproduced by the synthetic <strong>population</strong>.<br />
•Dependence not strong enough: Additional<br />
mechanisms? Planetesimal formation<br />
(Johansen et al. 2010) ?<br />
Large metallicity effect on RV detections<br />
• Metal rich systems tend to produce more<br />
massive planets<br />
• Radial velocity method favors massive<br />
objects<br />
Does not mean there are no planets<br />
around low [Fe/H] stars... we just can’t<br />
detect them at 10 m/s...
Mayor et al. 2011<br />
No metallicity effect for low mass planets<br />
•HARPS high precision sample: [Fe/H] distribution for giant planet hosts (black), for hosts with<br />
planets less massive than 30 ME (red), and for the global combined sample (blue).<br />
•No metallicity effect for low mass planets. The dividing line lies at about 30 ME. Same as the<br />
minimum in the mass distribution.<br />
•Even absence of low mass planets at high [Fe/H]? And of Super Jupiters at low [Fe/H]?<br />
?<br />
?
Mordasini et al 2012<br />
Metallicity of synthetic hot planets<br />
C. Mordasini et al.: Extrasolar planet <strong>population</strong> <strong>synthesis</strong> IV 21<br />
C. Mordasini et al.: Extrasolar planet <strong>population</strong> <strong>synthesis</strong> IV 21<br />
Mstar=1 M⊙<br />
Slow type I<br />
migration<br />
Fast type I<br />
migration<br />
a
Questions?


