Part - Maharashtra Pollution Control Board
Part - Maharashtra Pollution Control Board Part - Maharashtra Pollution Control Board
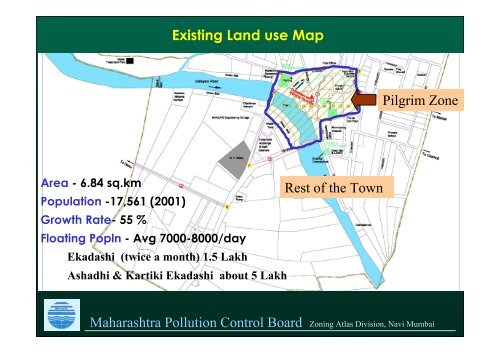
Existing Land use Map Area - 6.84 sq.km Population -17,561 (2001) Growth Rate- 55 % Floating Popln - Avg 7000-8000/day Ekadashi (twice a month) 1.5 Lakh Ashadhi & Kartiki Ekadashi about 5 Lakh Rest of the Town Pilgrim Zone Maharashtra Pollution Control Board Zoning Atlas Division, Navi Mumbai
- Page 2 and 3: Landuse Details of Alandi (1988-98)
- Page 4: Demographic Information Alandi Year
Existing Land use Map<br />
Area - 6.84 sq.km<br />
Population -17,561 (2001)<br />
Growth Rate- 55 %<br />
Floating Popln - Avg 7000-8000/day<br />
Ekadashi (twice a month) 1.5 Lakh<br />
Ashadhi & Kartiki Ekadashi about 5 Lakh<br />
Rest of the Town<br />
Pilgrim Zone<br />
<strong>Maharashtra</strong> <strong>Pollution</strong> <strong>Control</strong> <strong>Board</strong> Zoning Atlas Division, Navi Mumbai
Landuse Details of Alandi (1988-98)<br />
Sl No.<br />
1<br />
2<br />
3<br />
4<br />
5<br />
6<br />
7<br />
8<br />
9<br />
10<br />
11<br />
12<br />
Residential<br />
Commercial<br />
Public, Semi-public<br />
Public utilities<br />
Industrial<br />
Open Spaces<br />
Agricultural<br />
River and Water Bodies<br />
Hilly areas<br />
Vacant<br />
TOTAL<br />
Landuse type<br />
Transport & Communication<br />
Area Ha<br />
16.31<br />
1.15<br />
6.63<br />
1.31<br />
10.89<br />
0.56<br />
0.06<br />
196.79<br />
15.26<br />
13.33<br />
10.86<br />
273.15<br />
5.97%<br />
0.42%<br />
2.43%<br />
0.48%<br />
3.99%<br />
0.21%<br />
0.02%<br />
72.04%<br />
5.59%<br />
4.88%<br />
3.98%<br />
100%<br />
<strong>Maharashtra</strong> <strong>Pollution</strong> <strong>Control</strong> <strong>Board</strong> Zoning Atlas Division, Navi Mumbai<br />
%
Pilgrim Zone<br />
<strong>Maharashtra</strong> <strong>Pollution</strong> <strong>Control</strong> <strong>Board</strong> Zoning Atlas Division, Navi Mumbai
Demographic Information Alandi<br />
Year<br />
1901<br />
1911<br />
1921<br />
1931<br />
1941<br />
1951<br />
1961<br />
1971<br />
1981<br />
1991<br />
2001<br />
Male<br />
-<br />
-<br />
-<br />
-<br />
-<br />
-<br />
-<br />
2546<br />
-<br />
5601<br />
9825<br />
Population Growth in Alandi<br />
Population<br />
Female<br />
-<br />
-<br />
-<br />
-<br />
-<br />
-<br />
-<br />
2272<br />
-<br />
4648<br />
7740<br />
Total<br />
2029<br />
1624<br />
1568<br />
1666<br />
2170<br />
2432<br />
2029<br />
4788<br />
7523<br />
10249<br />
17565<br />
Occupational Pattern Alandi<br />
Sector<br />
Cultivators<br />
Agricultural Labour<br />
Manufacturing and Processing<br />
in Household Industries Labour<br />
Other services<br />
Marginal Workers<br />
Total Main Workers<br />
Non Workers<br />
Percent<br />
- 20.00<br />
+23.22<br />
+12.07<br />
- 16.57<br />
+50.24<br />
+57.12<br />
+36.24<br />
+71.38<br />
<strong>Maharashtra</strong> <strong>Pollution</strong> <strong>Control</strong> <strong>Board</strong> Zoning Atlas Division, Navi Mumbai<br />
Nos.<br />
339<br />
540<br />
179<br />
5113<br />
-<br />
6171<br />
11390<br />
Decadal Growth<br />
-3.44<br />
+ 5.88<br />
Workers<br />
Percent<br />
5%<br />
9%<br />
3%<br />
83%<br />
100%<br />
Households<br />
Nos.<br />
-<br />
-<br />
-<br />
-<br />
-<br />
-<br />
-<br />
1804<br />
2539<br />
4383


