Technical STraTegy Hidden Divergence In The Forex ... - FXstreet.com
Technical STraTegy Hidden Divergence In The Forex ... - FXstreet.com
Technical STraTegy Hidden Divergence In The Forex ... - FXstreet.com
You also want an ePaper? Increase the reach of your titles
YUMPU automatically turns print PDFs into web optimized ePapers that Google loves.
1 SFOmag.<strong>com</strong><br />
<strong>The</strong> Official Advocate for Personal <strong>In</strong>vesting<br />
Originally published June 2010. SFO magazine.<br />
<strong>Technical</strong> sTraTegy<br />
hidden divergence in <strong>The</strong> <strong>Forex</strong> MarkeT<br />
By James Chen, CMT<br />
Price-oscillator divergences represent some of the<br />
most prevalent, high-probability trading opportunities<br />
available in forex and other financial markets.<br />
<strong>The</strong>se regularly occurring chart signals should be<br />
heeded for their capacity to warn of either price<br />
momentum changes or trend continuations.<br />
BackgroUnd<br />
<strong>Divergence</strong>s occur when there is an imbalance<br />
between price action and an oscillator, which is a<br />
mathematical derivative of price. Examples of <strong>com</strong>mon<br />
oscillators include: stochastics, relative strength<br />
index (RSI), moving average convergence divergence<br />
(MACD), MACD histogram, rate of change (ROC),<br />
Commodity Channel <strong>In</strong>dex (CCI) and many others.<br />
Under normal circumstances without divergence, an<br />
oscillator that measures momentum should follow price.<br />
<strong>The</strong> extremes (peaks and valleys) in both price and the<br />
oscillator should be in relative agreement. Higher highs,<br />
higher lows, lower highs and lower lows on the oscillator<br />
should correspond with those of price action.<br />
Once divergence occurs, however, the indication<br />
is that price and the oscillator disagree with regard<br />
to momentum. This temporary aberration can be a<br />
significant indication of events to <strong>com</strong>e.<br />
Every technical trader should be aware of two<br />
types of divergence. Regular divergence indicates<br />
the potential for a reversal in current<br />
momentum, resulting in a possible trend change.<br />
Conversely, hidden divergence indicates the potential<br />
for continuation of the current trend momentum.<br />
higher odds<br />
As regular divergence is more well-known, in this column<br />
I only discuss the lesser-known type: hidden divergence.<br />
Many traders believe that of the two types of<br />
divergences the hidden variety is a higher-probability<br />
potential trading setup. This is due to the fact<br />
that hidden divergence is an indicator of potential<br />
trend continuation as opposed to a potential reversal<br />
indication.<br />
Trading with the trend is considered by many<br />
technical analysts and traders as a higherprobability<br />
type of trading than attempting to pick<br />
tops and bottoms, which is essentially the type of<br />
trading approach encouraged by regular divergence<br />
signals.<br />
Like regular divergence, hidden divergence is<br />
a technical imbalance between price movement<br />
and oscillator movement. But instead of signaling<br />
a potential reversal, hidden divergence is used<br />
primarily to signal a possible continuation in the<br />
prevailing trend.<br />
BUllish and Bearish signals<br />
Two basic manifestations of hidden divergence occur.<br />
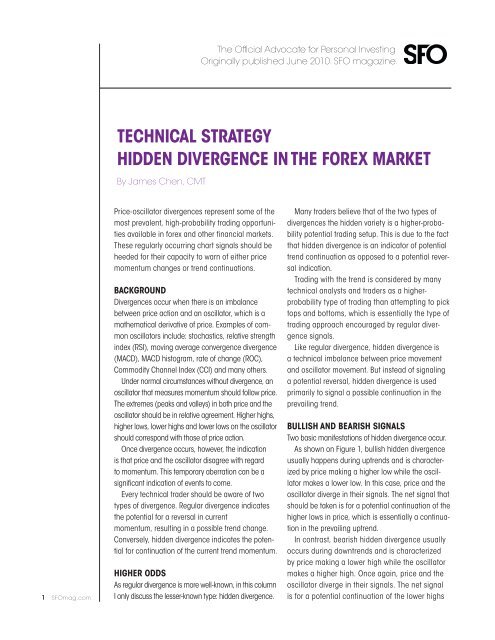
As shown on Figure 1, bullish hidden divergence<br />
usually happens during uptrends and is characterized<br />
by price making a higher low while the oscillator<br />
makes a lower low. <strong>In</strong> this case, price and the<br />
oscillator diverge in their signals. <strong>The</strong> net signal that<br />
should be taken is for a potential continuation of the<br />
higher lows in price, which is essentially a continuation<br />
in the prevailing uptrend.<br />
<strong>In</strong> contrast, bearish hidden divergence usually<br />
occurs during downtrends and is characterized<br />
by price making a lower high while the oscillator<br />
makes a higher high. Once again, price and the<br />
oscillator diverge in their signals. <strong>The</strong> net signal<br />
is for a potential continuation of the lower highs
2 SFOmag.<strong>com</strong><br />
Figure 1: Bullish <strong>Hidden</strong> <strong>Divergence</strong><br />
in price, essentially a continuation of the prevailing<br />
downtrend.<br />
<strong>The</strong> Trade<br />
Once an instance of hidden divergence occurs, cues<br />
can be taken from other technical indicators to enter<br />
a trade in the direction of the trend.<br />
One of the best ways to enter a trade after a<br />
hidden divergence signal involves waiting for<br />
a breakout of a key support or resistance level<br />
or countertrend trendline in the direction of the<br />
prevailing trend. Supported by hidden divergence,<br />
higher low<br />
lower low<br />
Source: FX Solutions—FX AccuCharts<br />
these trend-following breakouts often carry a<br />
higher probability of success than if divergence<br />
were absent.<br />
James Chen, CTA, CMT, is chief technical strategist<br />
at FX Solutions, a leading forex broker. He is also a<br />
registered Commodity Trading Advisor and Chartered<br />
Market Technician. Chen is the author of Essentials of<br />
Foreign Exchange Trading and Essentials of <strong>Technical</strong><br />
Analysis for Financial Markets.<br />
Copyright 2011 by Wasendorf & Associates <strong>In</strong>c. All rights reserved. No part of this publication may be reproduced or transmitted in any form by any means,<br />
electronic or mechanical including posting to another website, photocopying, recording or by any informative storage and retrieval system without the written<br />
permission of Wasendorf & Associates <strong>In</strong>c.’s President.<br />
This article is strictly the opinion and conjecture of its writers and is intended solely for informative and educational purposes and is not to be construed, under<br />
any circumstances, by implication or otherwise, as an offer to sell or a solicitation to buy or trade in any <strong>com</strong>modities or securities herein named. This article<br />
is not meant to re<strong>com</strong>mend, promote or in any way imply the effectiveness of any trading system, strategy or approach. <strong>In</strong>formation is obtained from sources<br />
believed to be reliable, but is in no way guaranteed. Further, there is no guarantee of any kind that is implied or possible where projections of future conditions<br />
are attempted. <strong>The</strong> publisher is not liable for typographical errors.<br />
Commodity futures, securities, options and forex trading involve risk and are not suitable investments for everyone. Any investment should be carefully<br />
considered in light of an investor’s personal financial objectives and risk tolerance.<br />
<strong>The</strong> article contained herein may provide hypothetical or simulated performance results. Hypothetical or simulated performance results have certain<br />
inherent limitations. Unlike an actual performance record, simulated results do not represent actual trading. Also, since the trades have not actually been<br />
executed, the results may have over- or under<strong>com</strong>pensated for the impact, if any, of certain market factors such as the lack of liquidity. Simulated trading<br />
programs are also subject to the fact that they are designed with the benefit of hindsight. No representation is being made that any account will or is likely<br />
to achieve profits or losses similar to those shown. Further, past performance does not guarantee future results.


![Hedge [Modo de compatibilidad] - FXstreet.com](https://img.yumpu.com/17927360/1/190x135/hedge-modo-de-compatibilidad-fxstreetcom.jpg?quality=85)
