3 Peaks and a Domed House. - FXstreet.com
3 Peaks and a Domed House. - FXstreet.com
3 Peaks and a Domed House. - FXstreet.com

Create successful ePaper yourself
Turn your PDF publications into a flip-book with our unique Google optimized e-Paper software.
20<br />
TECHNICAL ANALYSIS<br />
LARRY PESAVENTO<br />
3 <strong>Peaks</strong> <strong>and</strong><br />
a <strong>Domed</strong> <strong>House</strong><br />
Larry Pesavento describes a chart pattern introduced by George<br />
Lindsay in the 1950s called ‘3 <strong>Peaks</strong> <strong>and</strong> a <strong>Domed</strong> <strong>House</strong>.’<br />
NOVEMBER 2007
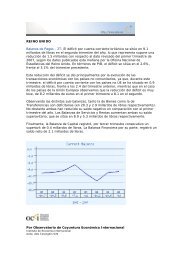
Euro/US Dollar<br />
When the editor of Traders Journal approached me about<br />
writing an article for this supplemental issue, I was<br />
both excited <strong>and</strong> honored. In 2003, he asked me to<br />
write an article when the Nikkei Dow was trading at 7,000. At<br />
that time, it was a universal conclusion that the Japanese stock<br />
market was going lower. Literally, no one was bullish at that<br />
time.<br />
What you are going to read in this article is a reference to a<br />
trading approach known as pattern recognition, which is a type<br />
of technical analysis. Pattern recognition has recently be<strong>com</strong>e<br />
quite popular on Wall Street. The reason for this popularity<br />
<strong>com</strong>es from the work done at the Massachusetts Institute of<br />
Technology (MIT). Dr. Andrew Lo, the chairman of the Applied<br />
Mathematics Department, did a 36-year study of the stock<br />
market <strong>and</strong> came to the following conclusion.<br />
Although there was chaos present in the market, non-r<strong>and</strong>om<br />
patterns were also present that repeated <strong>and</strong> were predictable.<br />
He made 800,000 observations using the traditional technical<br />
patterns that we are all familiar with. The formations included<br />
double tops, double bottoms, head <strong>and</strong> shoulders, pennants,<br />
flags among others. Dr. Lo published a book entitled The Non-<br />
R<strong>and</strong>om Walk Down Wall Street.<br />
One of the reasons that you are seeing more charts in the financial<br />
press is a result of this research <strong>and</strong> this book. It seems<br />
that once academia gives it’s blessing to a financial concept, the<br />
popularity of the concept is increased dramatically.<br />
The pattern that we are going to feature in this article is known as<br />
‘3 <strong>Peaks</strong> <strong>and</strong> a <strong>Domed</strong> <strong>House</strong>.’ This pattern was first introduced<br />
in the 1950s by a flamboyant Wall Street technician known as<br />
George Lindsay. Lindsay defied all of Wall Street protocol in<br />
both his lifestyle <strong>and</strong> his manner of dress. However, the man<br />
knew technical analysis.<br />
Enclosed is the weekly chart of the Euro/US Dollar Forex market.<br />
As you can see from the chart, there are 3 distinct tops or<br />
peaks followed later by a dome, which is actually a fourth top.<br />
1.27 in time bars relates the 3 tops to each other <strong>and</strong> the dome<br />
is 1.618 in time bars from the last top from December of 2005.<br />
The significance of 1.27 in the Fibonacci summation series is the<br />
fact that it is the square root of 1.618, which makes it a very important<br />
ratio to consider. As you can see from the chart enclosed<br />
in this article, the green shaded area describes a pattern referred<br />
to as the Butterfly pattern. The Butterfly pattern is nothing<br />
more than two triangles extending to the 1.27 or 1.618 ratios.<br />
Pattern recognition is different from most technical indicators<br />
because it is a leading indicator rather than a lagging indicator.<br />
By this, we are not waiting for an oscillator, moving average or<br />
relative strength indicator to confirm a buy or sell signal. The<br />
goal is to sell as close as the 1.27 level as possible <strong>and</strong> place a stop<br />
order to protect capital should the trade not work.<br />
As a final caveat, should the Euro exceed 1.4350, this pattern<br />
will probably extend to the 1.4936 level. As with trading in<br />
any speculative market, stop-loss orders should always be used<br />
<strong>and</strong> adequate money management techniques must be included<br />
at all times.<br />
Larry Pesavento is a trading tutor <strong>and</strong> 40-year veteran of the markets.<br />
During his career, he has been a member of the Chicago Mercantile<br />
Exchange, supervised Drexel, Burnham, Lambert’s <strong>com</strong>modity<br />
department in Los Angeles, traded on <strong>and</strong> off the floor <strong>and</strong> has trained<br />
over 800 traders. Larry can be reached at larry@tradingtutor.<strong>com</strong> or via<br />
his website www.tradingtutor.<strong>com</strong>.<br />
NOVEMBER 2007<br />
21
![Hedge [Modo de compatibilidad] - FXstreet.com](https://img.yumpu.com/17927360/1/190x135/hedge-modo-de-compatibilidad-fxstreetcom.jpg?quality=85)