Swing Trading Techniques (pdf) - Forex for Beginners
Swing Trading Techniques (pdf) - Forex for Beginners
Swing Trading Techniques (pdf) - Forex for Beginners

Create successful ePaper yourself
Turn your PDF publications into a flip-book with our unique Google optimized e-Paper software.
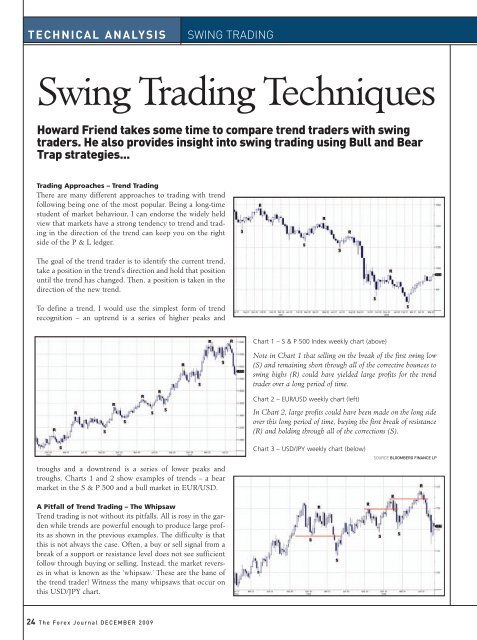
TECHNICAL ANALYSIS SWING TRADING<br />
<strong>Swing</strong> <strong>Trading</strong> <strong>Techniques</strong><br />
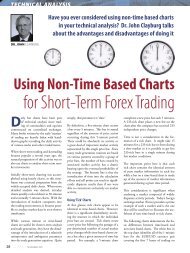
Howard Friend takes some time to compare trend traders with swing<br />
traders. He also provides insight into swing trading using Bull and Bear<br />
Trap strategies...<br />
<strong>Trading</strong> Approaches – Trend <strong>Trading</strong><br />
There are many different approaches to trading with trend<br />
following being one of the most popular. Being a long-time<br />
student of market behaviour, I can endorse the widely held<br />
view that markets have a strong tendency to trend and trading<br />
in the direction of the trend can keep you on the right<br />
side of the P & L ledger.<br />
The goal of the trend trader is to identify the current trend,<br />
take a position in the trend’s direction and hold that position<br />
until the trend has changed. Then, a position is taken in the<br />
direction of the new trend.<br />
To define a trend, I would use the simplest <strong>for</strong>m of trend<br />
recognition – an uptrend is a series of higher peaks and<br />
troughs and a downtrend is a series of lower peaks and<br />
troughs. Charts 1 and 2 show examples of trends – a bear<br />
market in the S & P 500 and a bull market in EUR/USD.<br />
A Pitfall of Trend <strong>Trading</strong> – The Whipsaw<br />
Trend trading is not without its pitfalls. All is rosy in the garden<br />
while trends are powerful enough to produce large profits<br />
as shown in the previous examples. The difficulty is that<br />
this is not always the case. Often, a buy or sell signal from a<br />
break of a support or resistance level does not see sufficient<br />
follow through buying or selling. Instead, the market reverses<br />
in what is known as the ‘whipsaw.’ These are the bane of<br />
the trend trader! Witness the many whipsaws that occur on<br />
this USD/JPY chart.<br />
24 The <strong>Forex</strong> Journal DECEMBER 2009<br />
Chart 1 – S & P 500 Index weekly chart (above)<br />
Note in Chart 1 that selling on the break of the first swing low<br />
(S) and remaining short through all of the corrective bounces to<br />
swing highs (R) could have yielded large profits <strong>for</strong> the trend<br />
trader over a long period of time.<br />
Chart 2 – EUR/USD weekly chart (left)<br />
In Chart 2, large profits could have been made on the long side<br />
over this long period of time, buying the first break of resistance<br />
(R) and holding through all of the corrections (S).<br />
Chart 3 – USD/JPY weekly chart (below)<br />
SOURCE BLOOMBERG FINANCE LP
Another Pitfall of Trend <strong>Trading</strong> – Inefficient Use of<br />
Capital<br />
Another problem that the trend trader faces is the inefficient use of<br />
trading capital. While markets ‘tend to trend,’ there are long periods<br />
when they are stuck in trading ranges effectively going nowhere. By<br />
definition, the trend trader has to sit through these corrections waiting<br />
<strong>for</strong> the trend to resume with trading capital tied up limiting opportunities<br />
that may arise elsewhere.<br />
Solution – Timing Trend Entry and Exit<br />
The solution to this problem is to time the market so that<br />
trading capital is not constantly tied up. In an uptrend, this<br />
would involve buying near a corrective low and exiting near<br />
a swing high, but this strategy can have its own drawbacks.<br />
When a correction begins, no one is sure how far it will go<br />
or how long it will last.<br />
Technicians use percentage retracements (<strong>for</strong> example –<br />
Fibonacci) in an ef<strong>for</strong>t to gauge where a correction should<br />
end, but no hard and fast rules exist except perhaps <strong>for</strong> the<br />
Dow theory rule that retracements should be limited to 2/3<br />
of the previous swing. If the 2/3 level is breached, the trend<br />
has probably changed direction.<br />
<strong>Swing</strong> <strong>Trading</strong> – A More Flexible and Surgical Approach<br />
This brings me to the swing trading approach that I believe<br />
to be more flexible and surgical than trend trading.<br />
The objective of the swing trader is not to jump on a trend<br />
and ride it through all of the corrections as a trend trader. A<br />
swing trader tries to capture those explosive 2 to 4 bar price<br />
swings that are so common. Many of the trades a swing<br />
trader takes will be in the direction of the trend, but some<br />
will be counter-trend. The swing trader is more concerned<br />
with price momentum than trend, looking <strong>for</strong> the path of<br />
least resistance at any given time.<br />
Are there conditions that make an explosive price<br />
move likely?<br />
I believe there are and I aim to demonstrate why I think this<br />
occurs. The trading set-ups I am about to show you are<br />
based on my theory that many of these explosive moves<br />
occur as the result of false breaks of support and/or resistance.<br />
It seems that <strong>for</strong> a market to make a large move in a<br />
given direction, a significant number of traders must be<br />
incorrectly positioned. Bulls and bears need to be fed and<br />
the fresh meat they consume comes from vulnerable<br />
traders!<br />
<strong>Trading</strong> Rules<br />
What trading rules could be employed to benefit from these<br />
market traps? How do we know when a Bull or Bear Trap<br />
has been sprung? Let’s consider the Bear Trap buy signal<br />
and two of the entry triggers I use.<br />
TRAPPED!<br />
Introducing the Bull and Bear Trap!<br />
When a support level such as a swing low is breached, the market often attracts fresh<br />
interest from both buyers and sellers. The ‘buy low’ crowd come in looking <strong>for</strong> value at<br />
previously cheap levels, while the breakout/trend following crowd sell the breakout looking<br />
<strong>for</strong> an extension of the decline. If the downside break fails to see follow-through selling,<br />
frustrated short sellers cover their positions bidding the market up creating a<br />
whipsaw. The market advance is exacerbated by the ‘wait and see’ crowd who come in<br />
after most of the cards have been played, and the ‘buy low’ crowd who add to their<br />
longs having been rewarded <strong>for</strong> their bravery in resisting the downside break. The resulting<br />
rally often lasts <strong>for</strong> several price bars, presenting a lucrative trading opportunity <strong>for</strong><br />
the swing trader.<br />
Graphic illustration of the Bear Trap (reverse criteria <strong>for</strong> Bull Trap)<br />
Here are some examples of the Bull and Bear Trap in action:<br />
EUR/USD daily chart<br />
S&P 500 Weekly chart<br />
EUR/JPY Monthly chart<br />
TEXT HOWARD FRIEND<br />
DECEMBER 2009 The <strong>Forex</strong> Journal 25<br />
SOURCE BLOOMBERG FINANCE LP
TECHNICAL ANALYSIS SWING TRADING<br />
Type 1 Bear Trap Buy Signal<br />
The first and most obvious strategy is to go<br />
long on a break above the high of the breakdown<br />
bar. When a swing low is broken, draw a<br />
line above the high of the bar on which the<br />
break occurs – this will be the buy trigger. If<br />
the market breaks above this line, all of the<br />
sellers of the break (of the swing low) will be trapped and their<br />
positions will be losing money. They will be covering their short<br />
positions, bidding up the price, and it is this move we are trying<br />
to capture.<br />
I would place a stop-loss below the low of the last 2 bars <strong>for</strong> protection.<br />
If the market falls back through this point, the original<br />
downside break would be validated and more selling would likely<br />
follow.<br />
26 The <strong>Forex</strong> Journal DECEMBER 2009<br />
Graphic illustration of the Type 1 Bear Trap buy signal<br />
GBP/USD Daily chart an example of the Type 1 Bear Trap Buy signal in action<br />
It is worth noting that as this strategy is taken intra-bar, i.e. you<br />
are buying ‘on a stop entry’ be<strong>for</strong>e the close of the bar, the possibility<br />
of an intra-bar whipsaw against you exists.<br />
This would involve going long at the trigger, getting stopped out<br />
on a pullback to a new 2-bar low, be<strong>for</strong>e the market rallies over<br />
the next few bars as one would expect. In my experience, this<br />
does not happen very often and is a negligible risk, but one that<br />
should be considered.<br />
Type 2 Bear Trap Buy Signal<br />
An alternative entry method would be to go long on the first<br />
close back above the broken swing low, provided it is backed up<br />
by another sign of strength such as a close in the top half of the<br />
range or a higher close. This signal may not be as strong as the<br />
SOURCE BLOOMBERG FINANCE LP
first one because not all of the sellers of the original break are<br />
underwater at this stage, but it does offer early indications of<br />
bear failure. Again, I would place a protective stop below the<br />
low of the last 2 bars, just in case.<br />
Where to Take Profits?<br />
Once a position is established, where should it be exited? The<br />
Holy Grail of the swing trader, I would say, is the strong 2 to 4<br />
bar price swing and I would certainly be looking <strong>for</strong> a powerful<br />
move in my favour within 4 price bars. I would use this move to<br />
exit the position.<br />
I would also want to take some profits at previous swing highs<br />
or swing lows, as traders tend to lighten up positions at these<br />
points. The key is to take some profits off of the table as mar-<br />
Graphic illustration of the Type 2 Bear Trap buy signal<br />
ket swings can reverse more quickly than one would like. Take<br />
your profits and wait <strong>for</strong> another set-up!<br />
I hope that I have given you food <strong>for</strong> thought and that you will<br />
look at price charts and trading opportunities from a new exciting<br />
perspective. I wish you all the best in your trading! TFJ<br />
Howard Friend is Chief Market Strategist at MIG Investments SA<br />
based in Neuchatel, Switzerland. He has worked as trader and market<br />
analyst <strong>for</strong> over 20 years and has developed proprietary trading<br />
methods to time the markets.<br />
Howard can be reached at hfriend@migfx.com or via www.migfx.com<br />
EUR/USD Daily chart an example of the Type 2 Bear Trap Buy signal in action<br />
TEXT HOWARD FRIEND<br />
DECEMBER 2009 The <strong>Forex</strong> Journal 27<br />
SOURCE BLOOMBERG FINANCE LP
![Hedge [Modo de compatibilidad] - FXstreet.com](https://img.yumpu.com/17927360/1/190x135/hedge-modo-de-compatibilidad-fxstreetcom.jpg?quality=85)