Using Non-Time Based Charts for Short-Term Forex Trading (pdf)
Using Non-Time Based Charts for Short-Term Forex Trading (pdf)
Using Non-Time Based Charts for Short-Term Forex Trading (pdf)

Create successful ePaper yourself
Turn your PDF publications into a flip-book with our unique Google optimized e-Paper software.
28<br />
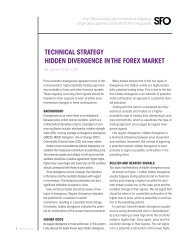
TECHNICAL ANALYSIS<br />
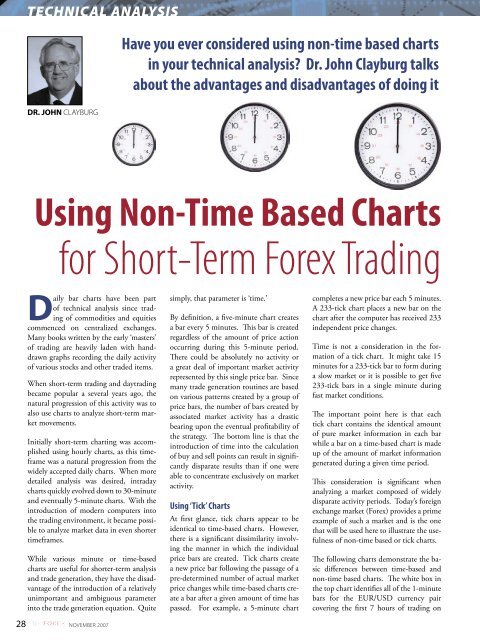
DR. JOHN CLAYBURG<br />
Have you ever considered using non-time based charts<br />
in your technical analysis? Dr. John Clayburg talks<br />
about the advantages and disadvantages of doing it<br />
<strong>Using</strong> <strong>Non</strong>-<strong>Time</strong> <strong>Based</strong> <strong>Charts</strong><br />
<strong>for</strong> <strong>Short</strong>-<strong>Term</strong> <strong>Forex</strong> <strong>Trading</strong><br />
Daily bar charts have been part<br />
of technical analysis since trading<br />
of commodities and equities<br />
commenced on centralized exchanges.<br />
Many books written by the early ‘masters’<br />
of trading are heavily laden with handdrawn<br />
graphs recording the daily activity<br />
of various stocks and other traded items.<br />
When short-term trading and daytrading<br />
became popular a several years ago, the<br />
natural progression of this activity was to<br />
also use charts to analyze short-term market<br />
movements.<br />
Initially short-term charting was accomplished<br />
using hourly charts, as this timeframe<br />
was a natural progression from the<br />
widely accepted daily charts. When more<br />
detailed analysis was desired, intraday<br />
charts quickly evolved down to 30-minute<br />
and eventually 5-minute charts. With the<br />
introduction of modern computers into<br />
the trading environment, it became possible<br />
to analyze market data in even shorter<br />
timeframes.<br />
While various minute or time-based<br />
charts are useful <strong>for</strong> shorter-term analysis<br />
and trade generation, they have the disadvantage<br />
of the introduction of a relatively<br />
unimportant and ambiguous parameter<br />
into the trade generation equation. Quite<br />
NOVEMBER 2007<br />
simply, that parameter is ‘time.’<br />
By definition, a five-minute chart creates<br />
a bar every 5 minutes. This bar is created<br />
regardless of the amount of price action<br />
occurring during this 5-minute period.<br />
There could be absolutely no activity or<br />
a great deal of important market activity<br />
represented by this single price bar. Since<br />
many trade generation routines are based<br />
on various patterns created by a group of<br />
price bars, the number of bars created by<br />
associated market activity has a drastic<br />
bearing upon the eventual profitability of<br />
the strategy. The bottom line is that the<br />
introduction of time into the calculation<br />
of buy and sell points can result in significantly<br />
disparate results than if one were<br />
able to concentrate exclusively on market<br />
activity.<br />
<strong>Using</strong> ‘Tick’ <strong>Charts</strong><br />
At first glance, tick charts appear to be<br />
identical to time-based charts. However,<br />
there is a significant dissimilarity involving<br />
the manner in which the individual<br />
price bars are created. Tick charts create<br />
a new price bar following the passage of a<br />
pre-determined number of actual market<br />
price changes while time-based charts create<br />
a bar after a given amount of time has<br />
passed. For example, a 5-minute chart<br />
completes a new price bar each 5 minutes.<br />
A 233-tick chart places a new bar on the<br />
chart after the computer has received 233<br />
independent price changes.<br />
<strong>Time</strong> is not a consideration in the <strong>for</strong>mation<br />
of a tick chart. It might take 15<br />
minutes <strong>for</strong> a 233-tick bar to <strong>for</strong>m during<br />
a slow market or it is possible to get five<br />
233-tick bars in a single minute during<br />
fast market conditions.<br />
The important point here is that each<br />
tick chart contains the identical amount<br />
of pure market in<strong>for</strong>mation in each bar<br />
while a bar on a time-based chart is made<br />
up of the amount of market in<strong>for</strong>mation<br />
generated during a given time period.<br />
This consideration is significant when<br />
analyzing a market composed of widely<br />
disparate activity periods. Today’s <strong>for</strong>eign<br />
exchange market (<strong>Forex</strong>) provides a prime<br />
example of such a market and is the one<br />
that will be used here to illustrate the usefulness<br />
of non-time based or tick charts.<br />
The following charts demonstrate the basic<br />
differences between time-based and<br />
non-time based charts. The white box in<br />
the top chart identifies all of the 1-minute<br />
bars <strong>for</strong> the EUR/USD currency pair<br />
covering the first 7 hours of trading on
Chart 1 : EUR/USD Source : TradeStation<br />
Chart 3 : EUR/US<br />
NOVEMBER 2007<br />
29
30<br />
TECHNICAL ANALYSIS<br />
Chart 3 : EUR/US Source : TradeStation<br />
December 14, 2006. The white box in<br />
the bottom non-time based chart identifies<br />
the same price activity in a 233-tick<br />
chart.<br />
The purpose of using non-time based<br />
charts is not to ignore price activity during<br />
quiet periods – but to simply put this<br />
data into its proper perspective devoid of<br />
the time parameter.<br />
Automated trading systems frequently determine<br />
entry or exit signals based on relative<br />
chart patterns that compare recent<br />
price activity and calculate trades based on<br />
previous similar market action. For these<br />
systems to have validity, it is assumed that<br />
each price bar is as significant as any other<br />
bar on the chart. Since charts that are<br />
non-time based contain equivalent price<br />
in<strong>for</strong>mation, these bars are more likely to<br />
create a consistent trading strategy.<br />
The following charts and system reports<br />
are created from the application of a single<br />
trading system to both a one-minute<br />
chart and a 233-tick chart.<br />
This chart depicts the trades generated by<br />
the system on a 233-tick chart. The red<br />
bar inside the white ellipse marks the 7<br />
hours of data discussed in the previous<br />
chart illustration. Note that the data is ig-<br />
NOVEMBER 2007<br />
nored by the trade generation routine and<br />
is simply a portion of the overall downtrend<br />
being traded by the system.<br />
In contrast, note that there are 5 unprofitable<br />
trades generated by the same data<br />
when it is graphed as a time-based chart.<br />
Injecting time into the signal generation<br />
equation has caused the strategy to generate<br />
multiple false signals.<br />
The TradeStation Strategy Per<strong>for</strong>mance<br />
Report above shows a hypothetical return<br />
of $16,580 <strong>for</strong> the Universal System during<br />
the time period from October 31,<br />
2006 through January 3, 2007 when applied<br />
to our 233 tick chart.<br />
The same system applied over the identical<br />
time period shows radically different<br />
results when a 1-minute chart is used to<br />
graph the data.<br />
While it is possible to remove some of<br />
the ‘system noise’ added by the time parameter<br />
with relatively longer timeframes,<br />
such as 60-minute to 120-minute charts,<br />
similar research has shown that non-time<br />
based charts remain the preferred methodology<br />
when attempting to analyze pure<br />
market data <strong>for</strong> the purpose of systematic<br />
trading.<br />
Although this discussion has concentrated<br />
on <strong>Forex</strong> data to describe the use of non<br />
time-based charts, the same effects are demonstrable<br />
when other tradable markets<br />
such as stock indices, futures markets and<br />
equities are modeled <strong>for</strong> systematic trading.<br />
One disadvantage of tick charts is the relative<br />
unavailability of tick data from many<br />
data providers and charting applications<br />
due to the significantly larger amount of<br />
storage space required to retain all price<br />
changes <strong>for</strong> a given item. While this detail<br />
may limit the spectrum of historical<br />
testing that is possible on an automated<br />
strategy, the advantages of examining<br />
price data without unnecessary ‘noise’ far<br />
outweighs this insignificant obstacle.<br />
While time-based charts are certainly useful<br />
<strong>for</strong> intraday trading, serious traders<br />
are encouraged to also consider non-time<br />
based data representation as a basis <strong>for</strong><br />
short-term strategy development.<br />
Dr. John Clayburg is a trading system developer<br />
and trader based in Western Iowa in the U.S.<br />
More in<strong>for</strong>mation on the Universal System and<br />
other self-adaptive automated systems and<br />
indicators may be found at www.clayburg.<br />
com.
Chart 4 : EUR/US Source : TradeStation<br />
Chart 5 : EUR/US Source : TradeStation<br />
NOVEMBER 2007<br />
31
![Hedge [Modo de compatibilidad] - FXstreet.com](https://img.yumpu.com/17927360/1/190x135/hedge-modo-de-compatibilidad-fxstreetcom.jpg?quality=85)