Reach Report 2008 - Special Olympics
Reach Report 2008 - Special Olympics
Reach Report 2008 - Special Olympics

You also want an ePaper? Increase the reach of your titles
YUMPU automatically turns print PDFs into web optimized ePapers that Google loves.
<strong>Reach</strong> <strong>Report</strong><br />
<strong>2008</strong><br />
<strong>Special</strong> <strong>Olympics</strong> <strong>Reach</strong> <strong>Report</strong> <strong>2008</strong>
<strong>Special</strong> <strong>Olympics</strong> <strong>Reach</strong> <strong>Report</strong> <strong>2008</strong>
May 2009<br />
<strong>Reach</strong> <strong>Report</strong> <strong>2008</strong><br />
This annual report summarizes data and key findings describing the breadth and depth of the global <strong>Special</strong><br />
<strong>Olympics</strong> movement – hence the title “<strong>Reach</strong> <strong>Report</strong>.” Data on athletes, coaches, competitions, financial and<br />
in-kind support from nearly 170 countries was compiled to produce this year’s report. <strong>Special</strong> <strong>Olympics</strong>, Inc.<br />
greatly appreciates the hard work invested by Programs, Regional staff members and volunteers worldwide to<br />
gather and report <strong>2008</strong> <strong>Special</strong> <strong>Olympics</strong> Census data.<br />
<strong>Special</strong> <strong>Olympics</strong>, Inc.<br />
1133 19 th Street, NW<br />
Washington, DC 20036 USA<br />
Phone: +1 (202) 628-3630<br />
Fax +1 (202) 824-0200<br />
www.specialolympics.org<br />
<strong>Special</strong> <strong>Olympics</strong> <strong>Reach</strong> <strong>Report</strong> <strong>2008</strong>
<strong>Special</strong> <strong>Olympics</strong> <strong>Reach</strong> <strong>Report</strong> <strong>2008</strong>
The Year in Brief<br />
Athlete Participation<br />
Growth<br />
• <strong>Special</strong> <strong>Olympics</strong> grew at a 10.5 percent rate<br />
• We currently serve approximately 3.2 million athletes worldwide<br />
Age<br />
• Nearly 68 percent of our athletes are of school age (8-21)<br />
• Over 31 percent are adults (22+)<br />
• <strong>Special</strong> <strong>Olympics</strong> also serves more than 27,000 individuals ages 2-7<br />
Sports<br />
• The Movement’s top sports include athletics, football, basketball, bowling, aquatics and table-tennis<br />
• Over 200,000 athletes and partners are now engaged in Unified Sports opportunities<br />
• 27,243 athletes serve in leadership positions offered through Athlete Leadership Programs (ALPs)<br />
Program Development Data<br />
Coaches<br />
• More than 260,000 coaches supported <strong>Special</strong> <strong>Olympics</strong> athletes – 11.3 percent growth on a year earlier<br />
Competitions<br />
• Nearly 33,000 competitions organized around the world, 90 competitions hosted every day<br />
• 2.5 million individuals experienced <strong>Special</strong> <strong>Olympics</strong> competitions in <strong>2008</strong><br />
Revenue<br />
• Cash revenue generated by <strong>Special</strong> <strong>Olympics</strong> Programs amounted to 176 million USD in <strong>2008</strong><br />
• In-kind revenue exceeded 70 million USD<br />
<strong>Special</strong> <strong>Olympics</strong> <strong>Reach</strong> <strong>Report</strong> <strong>2008</strong>
<strong>Special</strong> <strong>Olympics</strong> <strong>Reach</strong> <strong>Report</strong> <strong>2008</strong>
Table of Contents<br />
Executive Summary 1<br />
Program Development Data – the Foundation for Success 3<br />
Detailed Findings by Area:<br />
The Movement’s <strong>Reach</strong><br />
Growth 4<br />
Serving the World 5<br />
Average Program Size 6<br />
Quality<br />
Athletes-to-Participants Ratio 7<br />
Coaches 8<br />
Competitions 9<br />
Support<br />
Cash and In-kind Donations 10<br />
Participation<br />
Athlete Demographics – age and gender distribution 11<br />
Sports Participation 12<br />
Most Popular Sports 12<br />
Unified Sports® 13<br />
Motor Activities Training Program (MATP) 13<br />
Athlete Leadership Programs (ALPs) 14<br />
Regional Results Directory 15<br />
Methodology and Definitions 24<br />
<strong>Special</strong> <strong>Olympics</strong> <strong>Reach</strong> <strong>Report</strong> <strong>2008</strong>
<strong>Special</strong> <strong>Olympics</strong> <strong>Reach</strong> <strong>Report</strong> <strong>2008</strong>
Executive Summary<br />
The current <strong>Special</strong> <strong>Olympics</strong> <strong>Reach</strong> <strong>Report</strong> is designed to provide a summary of key programmatic results achieved<br />
globally in the framework of <strong>Special</strong> <strong>Olympics</strong> activities conducted in the course of the year <strong>2008</strong>. <strong>Special</strong> <strong>Olympics</strong><br />
operates in nearly 170 countries, 50 U.S. States and three U.S. territories. By collecting data from all of the<br />
Programs across the globe, the Movement continues to reinforce its commitment to development and monitoring<br />
of the objective parameters that measure the organization’s progress and accomplishments. Athlete participation<br />
information has been consistently collected since 2002. In addition, the 2006 <strong>Special</strong> <strong>Olympics</strong> Census paved the<br />
way for gathering data about coaches, competitions, cash and in-kind donations 1 . Collectively, these inputs inform<br />
the tracking of progress toward achieving the growth, quality, and revenue goals outlined in the 2006-2010 Strategic<br />
Plan.<br />
Growth<br />
In <strong>2008</strong>, <strong>Special</strong> <strong>Olympics</strong> continued to grow steadily and expanded the global reach at an annual rate of 10.5<br />
percent. In the course of the year the Movement delivered sports training and competition opportunities to<br />
3,177,410 athletes across the globe and exceeded well ahead of schedule the 2010 Strategic Goal of serving<br />
3 million individuals with intellectual disabilities. <strong>Special</strong> <strong>Olympics</strong> Asia-Pacific recruited new athletes at the<br />
annual rate of 19.8 percent and emerged as the organization’s fastest growing region, followed by Africa and East<br />
Asia that posted 12.4 percent and 12.0 percent growth rates, respectively. In the past year, the Movement’s two<br />
largest regions - Asia-Pacific and East Asia - accounted for an overwhelming majority of the new <strong>Special</strong> <strong>Olympics</strong><br />
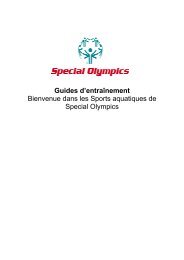
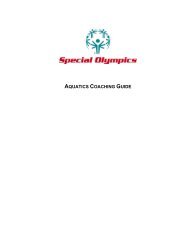
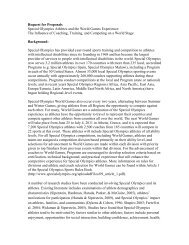
athletes (68 percent). The overall regional distribution of athletes is shown below in Figure 1.<br />
Figure 1 - Regional Distribution of <strong>Special</strong> <strong>Olympics</strong> Athletes, <strong>2008</strong><br />
Geographic Distribution of <strong>Special</strong> <strong>Olympics</strong> Athlete Population (<strong>2008</strong>)<br />
Europe/Eurasia<br />
15%<br />
Latin America<br />
9%<br />
East Asia<br />
27%<br />
MENA<br />
4%<br />
1 Definitions for these metrics can be found in the methodology section at the back of the current document.<br />
Asia-Pacific<br />
22%<br />
Africa<br />
4%<br />
North America<br />
20%<br />
<strong>Special</strong> <strong>Olympics</strong> <strong>Reach</strong> <strong>Report</strong> <strong>2008</strong><br />
1
2<br />
While the most popular <strong>Special</strong> <strong>Olympics</strong> sports remain unchanged and include athletics, football, basketball,<br />
bowling, aquatics and table-tennis, in <strong>2008</strong>, the Programs reported some notable trends in the demographic<br />
characteristics of the athlete population:<br />
• The ratio of male to female athletes has decreased to 1.6-to-1 signaling a trend toward greater engagement of<br />
female athletes.<br />
• Nearly 68 percent of <strong>Special</strong> <strong>Olympics</strong> athletes are of school age (8-21) and this age group is shrinking, while the<br />
proportions of adult athletes (age 22 and over) and young athletes (2-7) are increasing gradually. In <strong>2008</strong>, adult<br />
athletes and young athletes accounted for 31.3 percent and 0.9 percent of the athlete population, respectively.<br />
The number of children ages 2-7 that trained according to <strong>Special</strong> <strong>Olympics</strong> rules increased by over 50<br />
percent (to 27,243 individuals) as compared to the previous year.<br />
• Athlete Leadership Programs (ALPs) experienced a period of brisk growth and expanded by 59 percent as<br />
compared to 2007 – nearly six times faster than the overall growth rate for the Movement. <strong>Special</strong> <strong>Olympics</strong><br />
currently offers leadership opportunities to 21,218 athletes (0.7% of all athletes).<br />
Quality<br />
The Movement continues to sharpen the focus on delivering year-round competition opportunities in a variety of<br />
sports. In the course of <strong>2008</strong>, <strong>Special</strong> <strong>Olympics</strong> offered athletes 2,000 more competitions than a year earlier and<br />
increased the overall number to 32,817 – with 90 competitions staged every day around the world. Over offered by<br />
the Programs.<br />
Throughout the world 260,232 coaches supported <strong>Special</strong> <strong>Olympics</strong> athletes in the course of training and<br />
competitive endeavors. Three of the Movement’s seven Regions reported double-digit increases in the numbers of<br />
coaches and the overall cohort gained over 26 thousand new recruits. North America accounts for 42 percent of all<br />
coaches, followed by Asia-Pacific and East Asia (18 percent in each of these two regions). As a result of the strong<br />
growth in the number of coaches, <strong>Special</strong> <strong>Olympics</strong> continues to provide individualized attention – the worldwide<br />
athletes-to-coaches ratio improved in <strong>2008</strong> and reached 12.2 athletes per every coach (down from 12.6 athletes<br />
per every coach in 2006 and 12.3 – in 2007).<br />
Support<br />
For 2007, Movement-wide revenue amounted to more than 176 million USD 1 . U.S.-based Programs continued<br />
to generate the vast majority of the Movement’s cash donations, contributing over 80 percent of the total cash<br />
income brought in by <strong>Special</strong> <strong>Olympics</strong> Programs worldwide. If cash donations across all Programs could be<br />
distributed equally to <strong>Special</strong> <strong>Olympics</strong> athletes, in <strong>2008</strong> global donations per athlete would amount to 55.4 USD –<br />
approximately 20 percent lower than a year earlier and 15.4 lower than the 2006 level.<br />
2 Movement-wide revenue is the sum of self-reported cash income (does no include in-kind( from Programs. This figure does not include revenue<br />
generated by <strong>Special</strong> <strong>Olympics</strong>, Inc.<br />
<strong>Special</strong> <strong>Olympics</strong> <strong>Reach</strong> <strong>Report</strong> <strong>2008</strong>
Program Development Data –<br />
The Foundation for Success<br />
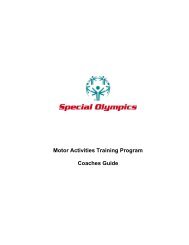
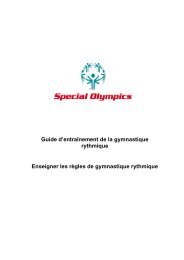
<strong>Special</strong> <strong>Olympics</strong> continues steady expansion of the organization’s reach and athlete participation. In <strong>2008</strong>, the<br />
Movement surpassed its 2006-2010 strategic growth goal of 3 million athletes and provided sports training and<br />
competition opportunities to nearly 3.18 million individuals worldwide. The expanding scope of services and the<br />
growing promise to individuals with intellectual disabilities and family members require development and consistent<br />
deployment of capabilities in the areas of coaches’ recruitment and education, delivery of competitions, communications<br />
and fundraising. Since 2006, <strong>Special</strong> <strong>Olympics</strong> has been applying a consistent set of definitions to track the dynamics<br />
of participation for athletes and coaches, frequency of competitions and the extent of the cash and in-kind fundraising<br />
contributions. Collectively these factors are known as Critical Program Development Indicators (CPDIs).<br />
<strong>Special</strong> <strong>Olympics</strong> Progress Toward 2010 Growth Goal<br />
3 million<br />
2 million<br />
1 million<br />
0<br />
<strong>Special</strong> <strong>Olympics</strong><br />
has surpassed<br />
the 2006-2010<br />
Strategic Growth<br />
Goal of 3 million<br />
athletes<br />
2006 2007 <strong>2008</strong> 2010<br />
In <strong>2008</strong>, <strong>Special</strong> <strong>Olympics</strong> reached out to 300,784 new athletes – a 10.5 percent increase in the number of individuals<br />
served. However, this stable growth in the number of athletes corresponded with a decline of 11 percent in the amount<br />
of cash revenue generated by <strong>Special</strong> <strong>Olympics</strong> Programs around the world and only modest growth of 5.4 percent in<br />
the amount of in-kind contributions. To offset the decline in revenues and sustain the quality of activities Programs rely<br />
on increasing numbers of coaches and volunteers. In the course of <strong>2008</strong>, for example, <strong>Special</strong> <strong>Olympics</strong> engaged 26,335<br />
new coaches. Available CPDIs continue to point to wide disparities in the types of service delivery models across the<br />
seven Regions. Middle East/North Africa and Asia-Pacific favor larger competitions and on average in these Regions<br />
every competition attracts 420 and 245 athletes, respectively. By contrast, in North America and Africa only 41 and<br />
35 athletes, respectively, take part in an average competitive opportunity. Programs in North America generated 238.2<br />
USD of cash income per athlete – 450 times more than Programs in East Asia and nearly six times more than in Europe/<br />
Eurasia.<br />
Table 1: Critical Program Development Indicators, <strong>2008</strong><br />
Region<br />
Africa<br />
Asia-Pacific<br />
East Asia<br />
Europe/Eurasia<br />
Latin America<br />
MENA<br />
North America<br />
Worldwide<br />
Athletes<br />
95,830<br />
577,634<br />
698,186<br />
309,231<br />
196,378<br />
74,449<br />
528,817<br />
2,480,525<br />
Participants<br />
19,365<br />
101,363<br />
169,926<br />
169,832<br />
97,631<br />
50,293<br />
88,475<br />
696,885<br />
Total<br />
115,195<br />
678,997<br />
868,112<br />
479,063<br />
294,009<br />
124,742<br />
617,292<br />
3,177,410<br />
Coaches<br />
9,466<br />
46,818<br />
46,953<br />
30,252<br />
13,621<br />
3,778<br />
109,344<br />
260,232<br />
Competitions<br />
3,233<br />
2,774<br />
5,048<br />
3,401<br />
3,089<br />
297<br />
14,975<br />
32,817<br />
Total Revenue<br />
1,310,359<br />
5,003,899<br />
459,912<br />
18,972,190<br />
2,677,639<br />
622,220<br />
147,039,406<br />
176,125,625<br />
In-kind<br />
697,352<br />
3,550,101<br />
308,400<br />
2,993,505<br />
3,549,572<br />
614,340<br />
58,467,484<br />
70,180,754<br />
<strong>Special</strong> <strong>Olympics</strong> <strong>Reach</strong> <strong>Report</strong> <strong>2008</strong><br />
3
4<br />
The Movement’s <strong>Reach</strong><br />
Growth<br />
In the past year, the organization generated a notably slower rate of growth at the global level than in 2007 – 10.5<br />
percent versus 13.5 percent, respectively. Overall, the deceleration of the Movement’s worldwide expansion results from<br />
a deliberate change of priorities and a shift of resources to local sports infrastructure development, training and higher<br />
quality of athlete participation. However, at the Regional level the trend resulted in uneven fluctuations. In <strong>2008</strong>, Asia-<br />
Pacific Region continued to grow at an almost 20 percent rate, while Africa and Middle East/North Africa expanded at<br />
approximately half of their 2007 growth rates and Latin America reported near-zero growth. North America defied the<br />
trend and increased the number of athletes served across the Region by 9.8 percent (see Table 2 below).<br />
Table 2: 2006-<strong>2008</strong> <strong>Special</strong> <strong>Olympics</strong> Athlete Growth, by Region<br />
Region<br />
Africa<br />
Asia-Pacific<br />
East Asia<br />
Europe/Eurasia<br />
Latin America<br />
MENA<br />
North America<br />
Worldwide<br />
Total<br />
Athletes<br />
(2006)<br />
81,884<br />
467,128<br />
660,014<br />
426,063<br />
265,324<br />
111,424<br />
522,576<br />
2,534,413<br />
Despite the growth rate fluctuations Asia-Pacific and East Asia Regions continue to catalyze global growth collectively<br />
contributing more than 200,000 new athletes. <strong>Special</strong> <strong>Olympics</strong> North America was able to sustain the strong positive<br />
momentum generated in 2007 and for the second year in a row accounted for nearly 20 percent of the new athletes.<br />
Based on the data presented in the charts below, approximately half of all <strong>Special</strong> <strong>Olympics</strong> athletes now train and<br />
compete in East Asia (27.3 percent of the global athlete population) and Asia-Pacific (21.4 percent), while 80 percent of<br />
all athletes come from outside of North America – the organization’s birthplace.<br />
Europe/Eurasia<br />
15%<br />
<strong>Special</strong> <strong>Olympics</strong> <strong>Reach</strong> <strong>Report</strong> <strong>2008</strong><br />
Total<br />
Athletes<br />
(2007)<br />
102,507<br />
566,653<br />
774,929<br />
457,375<br />
293,551<br />
119,581<br />
562,030<br />
2,876,626<br />
Total<br />
Athletes<br />
(<strong>2008</strong>)<br />
115,195<br />
678,997<br />
868,112<br />
479,063<br />
294,009<br />
124,742<br />
617,292<br />
3,177,410<br />
Geographic Distribution of <strong>Special</strong> <strong>Olympics</strong><br />
Athlete Population (2007)<br />
Latin America<br />
9%<br />
East Asia<br />
27%<br />
MENA<br />
4%<br />
Asia-Pacific<br />
20%<br />
Africa<br />
4%<br />
North America<br />
20%<br />
Growth<br />
(2006-<br />
2007)<br />
20,623<br />
99,525<br />
114,915<br />
31,312<br />
28,227<br />
8,157<br />
39,454<br />
342,213<br />
Europe/Eurasia<br />
15%<br />
Growth<br />
(2007-<br />
<strong>2008</strong>)<br />
12,688<br />
112,344<br />
93,183<br />
21,688<br />
458<br />
5,161<br />
55,262<br />
300,784<br />
Growth<br />
Rate (2006-<br />
2007)<br />
25.2%<br />
21.3%<br />
17.4%<br />
7.3%<br />
10.6%<br />
7.3%<br />
7.5%<br />
13.5%<br />
Growth<br />
Rate(2007-<br />
<strong>2008</strong>)<br />
Geographic Distribution of <strong>Special</strong> <strong>Olympics</strong><br />
Athlete Population (<strong>2008</strong>)<br />
Latin America<br />
9%<br />
East Asia<br />
27%<br />
MENA<br />
4%<br />
12.4%<br />
19.8%<br />
12.0%<br />
4.7%<br />
.2%<br />
4.3%<br />
9.8%<br />
10.5%<br />
Asia-Pacific<br />
21%<br />
Africa<br />
4%<br />
North America<br />
20%
Serving the World<br />
Guided by the Movement’s Mission Statement, <strong>Special</strong> <strong>Olympics</strong> is determined to offer sport training and competition<br />
opportunities to all individuals with intellectual disability. Over the years, the organization has significantly expanded the<br />
geographic scope of its work and engaged millions of new athletes. However, as evidenced by the data in Table 3 below,<br />
<strong>Special</strong> <strong>Olympics</strong> still serves less than 2 percent of the world’s population of people with intellectual disability.<br />
As a result of multi-year active growth in Asia-Pacific and East Asia, in <strong>2008</strong> the Movement reached important service<br />
milestones in these two Regions. In Asia-Pacific <strong>Special</strong> <strong>Olympics</strong> now offers training sessions and competitions to 1<br />
percent of the eligible population and over 2 percent of the eligible individuals in East Asia have opportunities to participate<br />
in the sporting activities developed by the Programs.<br />
Table 3: <strong>Special</strong> <strong>Olympics</strong> Global Service Rate, <strong>2008</strong><br />
Region<br />
Africa<br />
Asia-Pacific<br />
East Asia<br />
Europe/Eurasia<br />
Latin America<br />
MENA<br />
North America<br />
Worldwide<br />
Population<br />
(thousands)*<br />
559,425<br />
2,266,084<br />
1,382,965<br />
884,184<br />
395,997<br />
391,465<br />
444,391<br />
6,324,511<br />
Persons with ID<br />
(thousands)**<br />
16,783<br />
67,983<br />
41,489<br />
26,526<br />
11,880<br />
11,744<br />
13,332<br />
189,735<br />
# of <strong>Special</strong><br />
<strong>Olympics</strong> Athletes<br />
115,195<br />
678,997<br />
868,112<br />
479,063<br />
294,009<br />
124,742<br />
617,292<br />
3,177,410<br />
% of Eligible Population<br />
Served by <strong>Special</strong> <strong>Olympics</strong><br />
*Sources: World Population Prospects: The 2006 Revisions. Highlights. New York, United Nations, 2007. For U.S. Program:<br />
2006 Population Estimates Program, U.S. Census Bureau, 2007.<br />
**Estimated 1-3 percent of the world’s population have an intellectual disability, according to 2001 World Health <strong>Report</strong>,<br />
Mental Health: New Understanding, New Hope, The 3 percent level was applied for the current <strong>Report</strong>.<br />
0.69%<br />
1.00%<br />
2.09%<br />
1.81%<br />
2.47%<br />
1.06%<br />
4.63%<br />
1.67%<br />
<strong>Special</strong> <strong>Olympics</strong> <strong>Reach</strong> <strong>Report</strong> <strong>2008</strong><br />
5
6<br />
Average Program Size<br />
These days <strong>Special</strong> <strong>Olympics</strong> Programs are as diverse as ever in terms of the numbers of athletes served, organizational<br />
structures and modes of operation. In <strong>2008</strong>, the smallest Program in the world offered services to 19 athletes, while the<br />
largest provided sports opportunities to 828,053 athletes. There is not a “typical” <strong>Special</strong> <strong>Olympics</strong> Program anywhere<br />
in the world. However, averages and medians of key parameters – athletes, coaches, competitions and cash donations –<br />
help us understand the overarching trends in the development of the Movement. Table 4 below presents the results for<br />
2006-<strong>2008</strong>:<br />
Table 4: 2006-2007 Average and Median Program Size. 3<br />
Athletes<br />
Coaches<br />
Competitions<br />
Cash Donations<br />
Average Per<br />
Program<br />
Over the last three years the average size of a <strong>Special</strong> <strong>Olympics</strong> Program increased by over 20 percent. The Programs on<br />
average engaged nearly 25 percent more coaches in <strong>2008</strong> than they did in 2006 and organized almost 40 percent more<br />
competitions. However, Program-level revenue streams remain volatile as evidenced by the average size of cash donations<br />
– after an 8.5 percent year-on-year increase in 2007, last year this indicator plunged by nearly 12 percent erasing all the<br />
gains achieved since the launch of the 2006-2010 Strategic Plan.<br />
The median values based on the information captured in <strong>2008</strong> indicate that half of all <strong>Special</strong> <strong>Olympics</strong> Programs<br />
generate less than 50,000 US dollars per year and serve fewer than 3,200 athletes per Program, suggesting that large<br />
numbers of athletes and a major proportion of the revenue generating capacity are concentrated within relatively few<br />
established Programs.<br />
<strong>Special</strong> <strong>Olympics</strong> <strong>Reach</strong> <strong>Report</strong> <strong>2008</strong><br />
11,520<br />
922<br />
101<br />
805,280<br />
2006 2007<br />
<strong>2008</strong><br />
Program<br />
Median<br />
3,336<br />
188<br />
16<br />
40,500<br />
Average Per<br />
Program<br />
12,672<br />
1,030<br />
135<br />
874,119<br />
Program<br />
Median<br />
3,022<br />
179<br />
20<br />
72,350<br />
Average Per<br />
Program<br />
13,912<br />
1,146<br />
139<br />
772,222<br />
Program<br />
Median<br />
3 Average (mean) serves as a mathematical representation of the typical value of a series of numbers, computed as the sum of all numbers in the series divided by<br />
the count of all numbers in the series. Median is defined as sthe midpoint in the range of numbers that arranged in order of value - 50% of the range are above the<br />
median and 50% are below.<br />
3,227<br />
200<br />
22<br />
47,600
Quality<br />
Athletes-to-Participants Ratio<br />
A quality <strong>Special</strong> <strong>Olympics</strong> experience enables every individual to take part in sports training as well as competitions.<br />
The data collected about <strong>Special</strong> <strong>Olympics</strong> competitions in <strong>2008</strong> indicates that there were 7 percent more competitive<br />
opportunities available last year than in 2007. The athletes-to-participants ratio points to how widely these<br />
opportunities were available and how many individuals were able to take advantage of the experiences. Even though<br />
there is no “ideal” level for the ratio, <strong>Special</strong> <strong>Olympics</strong> believes that the higher values signal improvement since more<br />
athletes benefit from both training and competitions. In <strong>2008</strong>, this ratio experienced a minimal decline from 3.57 in<br />
2007 to 3.56 in <strong>2008</strong>. However, as indicated in Table 5 below, in <strong>2008</strong>, nearly 2.5 million individuals (2,480,525)<br />
with intellectual disability got a chance to compete in <strong>Special</strong> <strong>Olympics</strong> events representing a 10.4 percent increase in<br />
the number of competing athletes over the 2007 level and a 28.1 percent increase as compared to 2006.<br />
Table 5: Athletes-to-Participants Ratio Comparison, 2006-<strong>2008</strong><br />
Region<br />
Africa<br />
Asia-Pacific<br />
East Asia<br />
Europe/Eurasia<br />
Latin America<br />
MENA<br />
North America<br />
Worldwide<br />
Athletes<br />
71,041<br />
271,410<br />
627,189<br />
264,472<br />
173,636<br />
70,846<br />
457,808<br />
1,936,402<br />
2006 2007<br />
<strong>2008</strong><br />
Participants<br />
10,843<br />
195,718<br />
32,825<br />
161,591<br />
91,688<br />
40,578<br />
64,768<br />
598,011<br />
Athletes/<br />
Participants<br />
Ratio<br />
Athletes<br />
6.55 87,399<br />
1.39 468,993<br />
19.11 660,638<br />
1.64 285,500<br />
1.89 183,262<br />
1.75 74,179<br />
7.07 487,513<br />
3.24 2,247,484<br />
Participants<br />
15,108<br />
97,660<br />
114,291<br />
171,875<br />
110,289<br />
45,402<br />
74,517<br />
629,142<br />
Athletes/<br />
Participants<br />
Ratio<br />
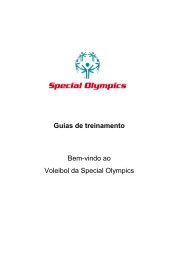
Globally, 78 percent of individuals engaged in <strong>Special</strong> <strong>Olympics</strong> took part in competitions in 2007 and <strong>2008</strong>.<br />
However, at the regional level there are notable disparities in the proportion of participants – those individuals with<br />
intellectual disability who trained but did not compete in the course of the year. In North America, participants<br />
accounted for 14.3 percent of the total involvement in <strong>Special</strong> <strong>Olympics</strong>, while in Middle East/North Africa<br />
this indicator reached 40.3 percent. Over the years the global athletes-to-participants ratio has demonstrated<br />
improvements rising from on average 2.7 in 2000-2006 to 2.9 in 2000-<strong>2008</strong>. The renewed focus on quality has<br />
enabled <strong>Special</strong> <strong>Olympics</strong> to offset sharp declines in the ratio caused by the rapid expansion in 2000-2005.<br />
4<br />
3.5<br />
3<br />
2.5<br />
2<br />
1.5<br />
5.78<br />
4,80<br />
5.78<br />
1.66<br />
1.66<br />
1.63<br />
6.54<br />
3.57<br />
Athletes-to-Participants Ratio, 2000-<strong>2008</strong><br />
2000-2005 Strategic Plan -<br />
focused on growth<br />
2006-2010 Strategic Plan -<br />
focused on quality<br />
2000 2002 2003 2004 2005 2006 2007 <strong>2008</strong><br />
Athletes<br />
95,830<br />
577,634<br />
698,186<br />
309,231<br />
196,378<br />
74,449<br />
528,817<br />
2,480,525<br />
Participants<br />
19,365<br />
101,363<br />
169,926<br />
169,832<br />
97,631<br />
50,293<br />
88,475<br />
696,885<br />
Athletes/<br />
Participants<br />
Ratio<br />
6.55<br />
1.39<br />
19.11<br />
1.64<br />
1.89<br />
1.75<br />
7.07<br />
3.24<br />
<strong>Special</strong> <strong>Olympics</strong> <strong>Reach</strong> <strong>Report</strong> <strong>2008</strong><br />
7
8<br />
Coaches<br />
Although multiple other considerations can play a role, individualized attention of qualified coaches represents an<br />
important factor that determines the quality of <strong>Special</strong> <strong>Olympics</strong> training and competition experiences. Thus, the<br />
number of coaches compared to the number of athletes serves as an indicator of quality that can be uniformly applied<br />
across the Movement. In the framework of the current <strong>Report</strong> we do not assess coaching qualifications and apply a<br />
very broad definition of a “coach” that includes all individuals who provided sports instruction to <strong>Special</strong> <strong>Olympics</strong><br />
athletes in a given year. It is also implied that there is no single best coaching formula and varying sports, athlete<br />
ability levels and other factors determine numbers of coaches recruited by <strong>Special</strong> <strong>Olympics</strong> Programs. In 2007,<br />
<strong>Special</strong> <strong>Olympics</strong> achieved a rate of growth in the number of coaches in excess of 11 percent (See Table 6 below),<br />
however the athletes-to-coaches ratio improved only in three of the Movement’s seven Regions (Africa, Asia-Pacific,<br />
and Europe/Eurasia) pointing to a potential mismatch with growth in the number of athletes.<br />
Table 6: Coaches by Region, 2007-<strong>2008</strong><br />
Region<br />
Africa<br />
Asia-Pacific<br />
East Asia<br />
Europe/Eurasia<br />
Latin America<br />
MENA<br />
North America<br />
Worldwide<br />
Athletes<br />
102,507<br />
566,653<br />
774,929<br />
457,375<br />
293,551<br />
119,581<br />
562,030<br />
2,876,626<br />
<strong>Special</strong> <strong>Olympics</strong> <strong>Reach</strong> <strong>Report</strong> <strong>2008</strong><br />
2006 2007<br />
<strong>2008</strong><br />
Coaches<br />
Coaches<br />
as % of<br />
Worldwide<br />
Total<br />
Athletes/<br />
Coaches Athletes<br />
Ratio<br />
Coaches<br />
Coaches<br />
as % of<br />
Worldside<br />
Total<br />
7,541 3.2% 13.6 115,195 9,466 3.6%<br />
34,872 14.9% 16.2 678,997 46,818 18.0%<br />
47,424 20.3% 16.3 868,112 46,953 18.0%<br />
23,458 10.0% 19.5 479,063 30,252 11.6%<br />
15,066 6.4% 19.5 294,009 13,621 5.2%<br />
4,172 1.8% 28.7 124,742 3,778 1.5%<br />
101,364 43.3% 5.5 617,292 109,344 42.0%<br />
233,897 100% 12.3 3,177,410 260,232 100%<br />
Athletes/<br />
Coaches<br />
Ratio<br />
12.2<br />
14.5<br />
18.5<br />
15.8<br />
21.6<br />
33.0<br />
5.6<br />
12.2
Competitions<br />
In the past year, <strong>Special</strong> <strong>Olympics</strong> continued to offer growing numbers<br />
of competitive opportunities. Instead of 60 competitions organized<br />
every day in 2006, throughout <strong>2008</strong> <strong>Special</strong> <strong>Olympics</strong> athletes had a<br />
chance to participate in 90 competitive events that took place every<br />
day around the world! With the global competitions growth rate above<br />
7 percent, <strong>Special</strong> <strong>Olympics</strong> Africa added competitions at a brisk pace of<br />
54 percent, followed by Europe/Eurasia (15.2 percent) and North<br />
America (9.9 percent).<br />
<strong>Special</strong> <strong>Olympics</strong> North America continues to account<br />
for over 45 percent of all competitive events with <strong>Special</strong><br />
<strong>Olympics</strong> Africa demonstrating notable gains in <strong>2008</strong><br />
and currently offering 10 percent of competitions.<br />
Table 7: Competitions by Region, 2007-<strong>2008</strong><br />
Region<br />
Africa<br />
Asia-Pacific<br />
East Asia<br />
Europe/Eurasia<br />
Latin America<br />
MENA<br />
North America<br />
Worldwide<br />
# of Competitions<br />
2006 2007<br />
<strong>2008</strong><br />
2,097<br />
3,641<br />
5,040<br />
2,952<br />
3,104<br />
284<br />
13,621<br />
30,739<br />
% of the<br />
Worldwide Total<br />
6.8%<br />
11.8%<br />
16.4%<br />
9.6%<br />
10.1%<br />
0.9%<br />
44.3%<br />
100.0%<br />
<strong>2008</strong> Competitions<br />
32,817 Every Year<br />
90 Every Day<br />
# of Competitions<br />
3,233<br />
2,774<br />
5,048<br />
3,401<br />
3,089<br />
297<br />
14,975<br />
32,817<br />
% of the<br />
Worldwide Total<br />
9.9%<br />
8.5%<br />
15.4%<br />
10.4%<br />
9.4%<br />
0.9%<br />
45.6%<br />
100.0%<br />
<strong>Special</strong> <strong>Olympics</strong> <strong>Reach</strong> <strong>Report</strong> <strong>2008</strong><br />
9
10<br />
Cash and In-kind Donations<br />
<strong>Special</strong> <strong>Olympics</strong> Programs (excluding <strong>Special</strong> <strong>Olympics</strong>, Inc.) raised almost 176.1 million USD of cash revenue<br />
in <strong>2008</strong>. As compared to a year earlier, the Movement’s cash contributions declined by 11 percent driven by<br />
notable Regional-level decreases in East Asia, Europe/Eurasia, Africa and North America. Asia-Pacific was the only<br />
Region to buck the trend and post 133 percent increase in donations. The organization-wide fall in cash revenue<br />
was partly offset by a 5.4 percent expansion of in-kind contributions with Asia-Pacific, Middle East/North Africa<br />
and Latin America Regions achieving triple-digit growth in this revenue category. As indicated in Table 8 below,<br />
<strong>Special</strong> <strong>Olympics</strong> Programs in North America continue to lead in terms of cash and in-kind revenue generated as a<br />
proportion of the worldwide total.<br />
Table 8: Cash and In-kind Donations, 2007-<strong>2008</strong><br />
Region<br />
Africa<br />
Asia-Pacific<br />
East Asia<br />
Europe/Eurasia<br />
Latin America<br />
MENA<br />
North America<br />
Worldwide<br />
“Donations per athlete” represent another key parameter of the Movement’s fundraising capabilities. To understand<br />
this indicator, it is critical to account for the fact that “donations per athlete” do not represent and are not<br />
synonymous with “cost per athlete”, since “donations per athlete” only account for the actual revenue generated<br />
and do not capture the budgeted and/or actual expenses related to <strong>Special</strong> <strong>Olympics</strong> services. In <strong>2008</strong>, the level<br />
of donations per athlete declined in five of the Movement’s seven Regions with Asia-Pacific and Latin America<br />
representing the two exceptions from the global trend.<br />
<strong>Special</strong> <strong>Olympics</strong> <strong>Reach</strong> <strong>Report</strong> <strong>2008</strong><br />
2006 2007<br />
<strong>2008</strong><br />
Cas Cash h % of the In-K In-Kind ind % of of the CasCashh % of the<br />
In-K In-Kind ind % of of the<br />
Rev enue Worldwide Rev enue W orldwide Rev enue Worldide Rev enue<br />
Revenue Worldwide Revenue Worldwide Revenue<br />
W orldside<br />
(USD) Total (USD) Total (USD)<br />
Worldwide Revenue<br />
Total (USD)<br />
Worldwide<br />
Total<br />
(USD) Total (USD) Total (USD) Total (USD) Total<br />
1,592,028 0.8% 1,291,405 1.9% 1,310,359 0.7% 697,352 1.0%<br />
2,145,531 1.1% 328,953 0.5% 5,003,899 2.8% 3,550,101 5.1%<br />
1,078,147 0.5% 1,828,765 2.7% 459,912 0.3% 308,400 0.4%<br />
34,716,816 17.5% 3,929,020 5.9% 18,972,190 10.8% 2,993,505 4.3%<br />
2,510,430 1.3% 1,263,697 1.9% 2,677,639 1.5% 3,549,572 5.1%<br />
664,992 0.3% 296,250 0.4% 662,220 0.4% 614,340 0.9%<br />
155,717,029 78.5% 57,675,553 86.6% 147,039,406 83.5% 58,467,484 83.3%<br />
198,424,973 100.0% 66,613,643 100% 176,125,625 100.0% 70,180,754 100%<br />
Table 9: Donations Per Athlete, 2007-<strong>2008</strong><br />
Region<br />
Africa<br />
Asia-Pacific<br />
East Asia<br />
Europe/Eurasia<br />
Latin America<br />
MENA<br />
North America<br />
Worldwide<br />
2006<br />
Donations Per<br />
Athlete (Cash<br />
Only, USD)<br />
6.1<br />
8.2<br />
1.1<br />
19.3<br />
6.4<br />
2.1<br />
288.4<br />
65.5<br />
2007<br />
Donations Per<br />
Athlete (Cash<br />
Only, USD)<br />
15.5<br />
3.8<br />
1.4<br />
75.9<br />
8.6<br />
5.6<br />
277.1<br />
69<br />
<strong>2008</strong><br />
Donations Per<br />
Athlete (Cash<br />
Only, USD)<br />
11.4<br />
7.4<br />
0.5<br />
39.6<br />
9.1<br />
5.3<br />
238.2<br />
55.4<br />
SUPPORT<br />
At 238.2 USD per athlete, <strong>Special</strong> <strong>Olympics</strong><br />
North America continues to demonstrate the<br />
highest Regional level of revenue generation per<br />
athlete. If cash donations brought in by all<br />
Programs could be distributed equally<br />
across all <strong>Special</strong> <strong>Olympics</strong> athletes, in <strong>2008</strong><br />
global donations per athlete would be<br />
55.4 USD – 19.7 percent lower than<br />
a year earlier and 15.4 percent lower than the<br />
2006 level.
PARTICIPATION<br />
Athlete Demographics – age and gender<br />
distribution<br />
As Table 10 below indicates, at the global level athletes 8 to 15 years of age constitute over one third of all individuals<br />
participating in <strong>Special</strong> <strong>Olympics</strong>. School age athletes that fall into 8-15 and 16-21 age groups comprise nearly 68<br />
percent of the worldwide athlete population – a decline of one percentage point from the 2007 level, while adult<br />
athletes (22 years of age and older) account for nearly 30 percent.<br />
At the Regional level, North America continues to serve the highest proportion of athletes 22 years of age and<br />
older, though the contribution of this age group to the overall athlete population is declining and has fallen below<br />
44 percent of the Regional total. East Asia serves large numbers of younger athletes in the 8-15 age group (over 38<br />
percent) and Africa focuses on athletes in the 16-21 age group (over 44 percent of the Regional total). While these<br />
variations reflect the differences in approaches taken by the Regions in delivering <strong>Special</strong> <strong>Olympics</strong> sports training<br />
and competitions, in 2007 and <strong>2008</strong>, the disparities have been diminishing and possibly pointing to more balanced<br />
recruitment efforts across age groups.<br />
Since 2007, data is collected about young individuals (ages 2-5 and 6-7), who train according to <strong>Special</strong> <strong>Olympics</strong><br />
rules and guidelines, but are not yet eligible to compete. In <strong>2008</strong>, the number of children with intellectual<br />
disabilities ages 2-7 that train around the world increased by over 50 percent as compared to the previous year.<br />
Overall, representatives of the two youngest age groups contribute less than one percent to the global total; however,<br />
in Africa and North America the youngest athletes account for 1.8 and 2.4 percent of the athlete populations,<br />
respectively, signaling a strong interest in the Young Athletes initiative and related programming.<br />
Table 10: Age Groups by Region, <strong>2008</strong><br />
Region<br />
Africa<br />
Asia-Pacific<br />
East Asia<br />
Europe/Eurasia<br />
Latin America<br />
MENA<br />
North America<br />
Worldwide<br />
2-5<br />
Age 2006 Groups - Total Athletes<br />
Age Groups - as % of Regional Total<br />
6-7<br />
8-15<br />
16-21<br />
901 1,161 31,660 49,982<br />
384 962 232,183 258,719<br />
469 1,065 332,013 284,024<br />
573 2,032 171,600 162,518<br />
1,970 1,728 105,802 102,420<br />
168 765 44,433 47,152<br />
7,001 8,064 166,699 162,869<br />
11.466 15,777 1,084,390 1,067,684<br />
22+<br />
31,497<br />
186,749<br />
250,541<br />
142,340<br />
82,089<br />
32,224<br />
269,104<br />
994,544<br />
Gender<br />
In <strong>2008</strong>, female athletes accounted for 38 percent of the Movement-wide total (male athletes constituted 62<br />
percent of the population) representing an increase of one percentage point over a year earlier – a substantial change<br />
considering that despite the overall aggressive growth, the proportion of <strong>Special</strong> <strong>Olympics</strong> male athletes remained<br />
unchanged in 2002-2007. Among the seven <strong>Special</strong> <strong>Olympics</strong> Regions, Asia-Pacific reported the highest level<br />
of female participation (42 percent), followed by Africa (41 percent). At the opposite end of the spectrum, male<br />
athletes accounted for 71 percent of the total athlete participation in the Middle East/North Africa Region, and 65<br />
percent in Europe/Eurasia and Latin America Regions.<br />
2-5<br />
0.8%<br />
0.1%<br />
0.1%<br />
0.1%<br />
0.7%<br />
0.1%<br />
1.1%<br />
0.4%<br />
6-7<br />
1.0%<br />
0.1%<br />
0.1%<br />
0.4%<br />
0.6%<br />
0.6%<br />
1.3%<br />
0.5%<br />
8-15<br />
27.5%<br />
34.2%<br />
38.2%<br />
35.8%<br />
36.0%<br />
35.6%<br />
27.2%<br />
34.2%<br />
16-21<br />
43.4%<br />
38.1%<br />
32.7%<br />
33.9%<br />
34.8%<br />
37.8%<br />
26.5%<br />
33.6%<br />
22+<br />
27.3%<br />
27.5%<br />
28.9%<br />
29.7%<br />
27.9%<br />
25.8%<br />
43.8%<br />
31.3%<br />
Total<br />
100.0%<br />
100.0%<br />
100.0%<br />
100.0%<br />
100.0%<br />
100.0%<br />
100.0%<br />
100.0%<br />
<strong>Special</strong> <strong>Olympics</strong> <strong>Reach</strong> <strong>Report</strong> <strong>2008</strong><br />
11
12<br />
SPORTS PARTICIPATION<br />
Most Popular Sports<br />
In the course of <strong>2008</strong>, on average, every athlete in <strong>Special</strong> <strong>Olympics</strong> participated in training sessions and competitions<br />
in 1.2 sports. Nearly 70 percent of all sports experiences were associated with the six most popular kinds of sports<br />
presented in Table 12 below. The respective levels of popularity remained stable over the last three years. However,<br />
disparate patterns emerged since <strong>Special</strong> <strong>Olympics</strong> Census data collection commenced in 2002.<br />
The Movement’s most popular sport – athletics – has been continuously losing in popularity as a result of dedicated<br />
efforts to offer <strong>Special</strong> <strong>Olympics</strong> athletes a broader range of training and competitive opportunities. Football gained<br />
in popularity in 2004-2005 following concerted expansion efforts in Europe/Eurasia and Latin America, but the<br />
proportion of football players stagnated at the 10 percent level for the last four years. The growing number of<br />
athletes engaged in sports other than the “Top 6” further illustrates the global trend toward diversification of athlete<br />
experiences, though in <strong>2008</strong>, the less popular sports accounted for only 30 percent of all training sessions and<br />
competitions.<br />
Throughout <strong>2008</strong>, nearly 158 thousand <strong>Special</strong> <strong>Olympics</strong> athletes took part in Nationally Popular Sports offered by<br />
<strong>Special</strong> <strong>Olympics</strong> Programs representing a 163 percent increase in this segment of the athlete population as compared<br />
to the year earlier. Currently over 4 percent of athletes participate in Nationally Popular Sports and the combined<br />
share of these experiences approaches popularity of table tennis, the Movement’s sixth most popular sport.<br />
Table 12: Trends in Popular Sports 2002-<strong>2008</strong><br />
Sport<br />
Athletics<br />
Football<br />
Basketball<br />
Bowling<br />
Aquatics<br />
Table Tennis<br />
Other Sports<br />
<strong>Special</strong> <strong>Olympics</strong> <strong>Reach</strong> <strong>Report</strong> <strong>2008</strong><br />
2006<br />
Percent of Athletes Participating in Top Sports<br />
2002<br />
37%<br />
8%<br />
11%<br />
12%<br />
7%<br />
1%<br />
24%<br />
2003<br />
30%<br />
8%<br />
11%<br />
11%<br />
6%<br />
4%<br />
30%<br />
2004<br />
30%<br />
8%<br />
11%<br />
11%<br />
6%<br />
4%<br />
30%<br />
2005<br />
34%<br />
10%<br />
11%<br />
9%<br />
6%<br />
4%<br />
26%<br />
2006<br />
34%<br />
10%<br />
9%<br />
8%<br />
5%<br />
5%<br />
29%<br />
2007<br />
34%<br />
10%<br />
9%<br />
7%<br />
6%<br />
5%<br />
29%<br />
<strong>2008</strong><br />
33%<br />
10%<br />
9%<br />
7%<br />
6%<br />
5%<br />
30%
Unified Sports<br />
With Unified Sports participation increasing by 35 percent in <strong>2008</strong>, athletes and partners involved in the program<br />
constituted the fastest growing segment of the overall <strong>Special</strong> <strong>Olympics</strong> athlete population. Moreover, the expansion<br />
of Unified Sports further accelerated in the past year, up from the 28 percent growth rates achieved in 2006 and<br />
2007. The recruitment of athletes continues to outpace the delivery of services to new partners. Data presented in<br />
Table 13 below indicates that last year <strong>Special</strong> <strong>Olympics</strong> achieved 38 percent growth in the number of Unified Sports<br />
athletes, while the number of partners increased at a 30 percent rate, leading to a further shift in the athletes-topartners<br />
ratio – from 1.27 athletes per partner in 2006; to 1.6 in 2007 and 1.69 in <strong>2008</strong>. The most popular sports<br />
offered in the Unified Sports format continue to be football, basketball and athletics.<br />
Table 13: Unified Sports Participation, 2002-<strong>2008</strong><br />
Sport<br />
Unified Sports<br />
Participation<br />
2002<br />
71,380<br />
2003<br />
63,306<br />
2006<br />
2004<br />
73,801<br />
2005<br />
90,997<br />
2006<br />
119,044<br />
Athletes<br />
94,035<br />
2007<br />
Partners<br />
58,681<br />
Motor Activity Training Program (MATP)<br />
In <strong>2008</strong>, MATP participation grew by 11.6 percent, primarily as a result of the strong increase in MATP activities<br />
reported by Programs in North America (21.7 percent).<br />
Region<br />
Africa<br />
AsiaPacific<br />
East Asia<br />
Europe/Eurasia<br />
Latin America<br />
MENA<br />
North America<br />
Worldwide<br />
2006<br />
Motor Activities Training Program Participation<br />
2002<br />
2003<br />
80 40<br />
523 575<br />
41 0<br />
10,275 14,402<br />
482 634<br />
262 553<br />
10,764 10,964<br />
22,427 27,169<br />
2004<br />
471<br />
764<br />
219<br />
17,220<br />
666<br />
1,224<br />
13,987<br />
34,551<br />
2005<br />
475<br />
3,354<br />
132<br />
20,474<br />
1,148<br />
1,135<br />
13,403<br />
40,121<br />
2006<br />
937<br />
3,791<br />
473<br />
20,339<br />
1,389<br />
1,693<br />
13,139<br />
41,761<br />
The rapid expansion of MATP services in North America firmly established the Region’s leading position accounting<br />
for 44 percent of all MATP participants, followed by Europe/Eurasia with 35 percent. Together these two Regions<br />
(See Table 14) continue to provide sports opportunities for nearly four-fifths of all MATP athletes. At the same time,<br />
East Asia and Africa Regions report the fastest annual growth rates increasing participation in the initiative by 85<br />
and 57 percent, respectively. Since 2002, when the first comprehensive MATP results were reported, the number<br />
of individuals benefiting from the program expanded by 82 percent with growth taking place in all seven <strong>Special</strong><br />
<strong>Olympics</strong> Regions.<br />
2007<br />
391<br />
3,405<br />
594<br />
13,841<br />
2,299<br />
1,338<br />
14,709<br />
36,576<br />
<strong>2008</strong><br />
612<br />
3,463<br />
1,097<br />
14,132<br />
2,272<br />
1,360<br />
17,911<br />
40,847<br />
Total<br />
152,716<br />
2007<br />
Athletes Partners<br />
129,623<br />
75,507<br />
Total<br />
206,130<br />
<strong>Special</strong> <strong>Olympics</strong> <strong>Reach</strong> <strong>Report</strong> <strong>2008</strong><br />
13
Regional Results - Middle East/North Africa<br />
<strong>Special</strong> <strong>Olympics</strong> <strong>Reach</strong> <strong>Report</strong> <strong>2008</strong><br />
21
14<br />
Athlete Leadership Programs (ALPs)<br />
For the second year in a row <strong>Special</strong> <strong>Olympics</strong> Athlete Leadership Programs experience robust gains in popularity – a 60<br />
percent jump in ALPs participation reported for <strong>2008</strong> builds upon the 14 percent growth rate achieved a year earlier (See Table<br />
15 below). Five of the seven <strong>Special</strong> <strong>Olympics</strong> Regions were able to increase the reach of athlete leadership offerings with the<br />
ALPs population in Africa skyrocketing more than 10 times above the 2007 level. The strong growth achieved in <strong>2008</strong> enabled<br />
<strong>Special</strong> <strong>Olympics</strong> Africa to account for over 25 percent of all ALPs athletes – more than the combined total for Asia-Pacific,<br />
Middle East/North Africa and North America. East Asia and Latin America Regions account for 21.5 percent and 18.3<br />
percent of the ALPs athletes, respectively, followed by Europe/Eurasia with 12.3 percent.<br />
Table 15: ALPs Participation, 2002-<strong>2008</strong><br />
Region<br />
Africa<br />
AsiaPacific<br />
East Asia<br />
Europe/Eurasia<br />
Latin America<br />
MENA<br />
North America<br />
Worldwide<br />
The steady growth in the numbers of ALPs athletes at the global level has increased the proportion of athlete leaders in the<br />
overall <strong>Special</strong> <strong>Olympics</strong> athlete population from 0.46 percent in 2007 to 0.67 percent in <strong>2008</strong>; however, despite the dynamic<br />
three-fold expansion of ALPs programming between 2002 and <strong>2008</strong> the Movement is yet to reach the 1 percent level for<br />
<strong>Special</strong> <strong>Olympics</strong> athletes serving in leadership positions.<br />
<strong>Special</strong> <strong>Olympics</strong> <strong>Reach</strong> <strong>Report</strong> <strong>2008</strong><br />
Athlete Leadership 2006 Programs<br />
2002<br />
432<br />
170<br />
595<br />
569<br />
4,005<br />
281<br />
1,006<br />
7,058<br />
2003<br />
1,216<br />
298<br />
1,091<br />
869<br />
2,045<br />
323<br />
2,618<br />
8,460<br />
2004<br />
108<br />
235<br />
1,265<br />
1,027<br />
1,215<br />
555<br />
2,349<br />
6,754<br />
2005<br />
108<br />
156<br />
1,346<br />
1,409<br />
3,608<br />
985<br />
2,411<br />
10,023<br />
2006<br />
398<br />
480<br />
1,829<br />
1,361<br />
4,081<br />
1,077<br />
2,472<br />
11,698<br />
2007<br />
451<br />
843<br />
2,742<br />
1,926<br />
3,514<br />
1,372<br />
2,474<br />
13,322<br />
<strong>2008</strong><br />
5,362<br />
554<br />
4,571<br />
2,611<br />
3,892<br />
2,147<br />
2,081<br />
21,218
Regional Results Directory<br />
Below is the report of the <strong>2008</strong> Census results presented alphabetically by Region and by Program. For comparison, 2007<br />
Census data is included as well.<br />
All of the background information can also be found in an electronic format through the Program Development System (PDS)<br />
under the <strong>2008</strong> Athlete Participation reporting options and the 2009 Program Information Profile data (<strong>2008</strong> Actual results for<br />
coaches, competitions, cash and in-kind revenue).<br />
<strong>Special</strong> <strong>Olympics</strong> <strong>Reach</strong> <strong>Report</strong> <strong>2008</strong><br />
15
16<br />
Regional Results - Africa<br />
<strong>Special</strong> <strong>Olympics</strong> <strong>Reach</strong> <strong>Report</strong> <strong>2008</strong>
Regional Results - Asia-Pacific<br />
East Asia<br />
<strong>Special</strong> <strong>Olympics</strong> <strong>Reach</strong> <strong>Report</strong> <strong>2008</strong><br />
17
18<br />
Regional Results - Europe/Eurasia<br />
<strong>Special</strong> <strong>Olympics</strong> <strong>Reach</strong> <strong>Report</strong> <strong>2008</strong>
<strong>Special</strong> <strong>Olympics</strong> <strong>Reach</strong> <strong>Report</strong> <strong>2008</strong> 19
20<br />
Regional Results - Latin America<br />
<strong>Special</strong> <strong>Olympics</strong> <strong>Reach</strong> <strong>Report</strong> <strong>2008</strong>
Regional Results - Middle East/North America<br />
<strong>Special</strong> <strong>Olympics</strong> <strong>Reach</strong> <strong>Report</strong> <strong>2008</strong><br />
21
22<br />
Regional Results - North America<br />
<strong>Special</strong> <strong>Olympics</strong> <strong>Reach</strong> <strong>Report</strong> <strong>2008</strong>
<strong>Special</strong> <strong>Olympics</strong> <strong>Reach</strong> <strong>Report</strong> <strong>2008</strong> 23
24<br />
Methodology and Definitions<br />
<strong>Special</strong> <strong>Olympics</strong> <strong>Reach</strong> <strong>Report</strong> <strong>2008</strong><br />
APPENDIX<br />
In the framework of the <strong>2008</strong> <strong>Special</strong> <strong>Olympics</strong> Census, each <strong>Special</strong> <strong>Olympics</strong> Program submitted an Athlete<br />
Participation Summary (APS) form, which is housed in the Program Development System (PDS). The additional<br />
metrics collected were also submitted through PDS in the Program Information Profile (PIP). All data was captured in<br />
PDS by March 31, 2009.<br />
The <strong>2008</strong> Census captured athlete participation data (including Unified Sports, MATP and ALPs), as well as<br />
information about coaches, competitions, cash and in-kind donations received by <strong>Special</strong> <strong>Olympics</strong> Programs.<br />
In the course of data collection, analysis and presentation, <strong>Special</strong> <strong>Olympics</strong> relied on the following set of definitions:<br />
Athlete<br />
A <strong>Special</strong> <strong>Olympics</strong> athlete is a person with an intellectual disability who trains in a <strong>Special</strong> <strong>Olympics</strong> sport and who<br />
competes at least once in that sport at a <strong>Special</strong> <strong>Olympics</strong> Games or competition at any level (local, state, national,<br />
regional, or world) during the calendar year (1 January - 31 December);<br />
-Or-<br />
A <strong>Special</strong> <strong>Olympics</strong> athlete is a person with an intellectual disability who participates in Motor Activities Training<br />
Program.<br />
Participant<br />
A <strong>Special</strong> <strong>Olympics</strong> participant is a person with an intellectual disability who trains in a <strong>Special</strong> <strong>Olympics</strong> sport<br />
but has not competed at least once in a <strong>Special</strong> <strong>Olympics</strong> Games or competition at any level (local, state, national,<br />
regional, or world) during the calendar year (1 January - 31 December).<br />
Unified Sports<br />
<strong>Special</strong> <strong>Olympics</strong> “Unified Sports®” is a program that combines <strong>Special</strong> <strong>Olympics</strong> athletes and athletes without<br />
intellectual disabilities on sports teams for training and competition.<br />
Unified Sports Athlete<br />
A <strong>Special</strong> <strong>Olympics</strong> Unified Sports Athlete is a person with an intellectual disability who trains in a <strong>Special</strong> <strong>Olympics</strong><br />
“Unified” sport and who competes at least once in that sport at a <strong>Special</strong> <strong>Olympics</strong> Games or competition at any level<br />
(local, state, national, regional, or world) during the calendar year (1 January - 31 December).<br />
Unified Sports Partner<br />
A <strong>Special</strong> <strong>Olympics</strong> Unified Sports Partner is a person without an intellectual disability who trains in a <strong>Special</strong><br />
<strong>Olympics</strong> “Unified” sport and who competes at least once in that sport at a <strong>Special</strong> <strong>Olympics</strong> Games or competition at<br />
any level (local, state, national, regional, or world) during the calendar year (1 January - 31 December).<br />
Athlete Leadership Programs (ALPs) Athlete An Athlete Leadership Programs (ALPs) Athlete is defined as a person<br />
with an intellectual disability who participates in at least one Athlete Leadership Program and fulfills the definition of a<br />
<strong>Special</strong> <strong>Olympics</strong> Athlete as defined in these instructions
Athlete Leadership Programs (ALPs) Participant An Athlete Leadership Program Participant (ALPs) is defined as<br />
a person with an intellectual disability who participates in at least one Athlete Leadership Program and fulfills the<br />
definition of a <strong>Special</strong> <strong>Olympics</strong> Participant set forth in these instructions<br />
-Or-<br />
APPENDIX<br />
An Athlete Leadership Program Participant (ALPs) is defined as a person with an intellectual disability who<br />
participates in at least one Athlete Leadership Program and is not training or competing as an athlete or participant.<br />
Motor Activities Training Program (MATP)<br />
A MATP athlete is a person with an intellectual disability that participates in MATP activities during the calendar<br />
year January 1-December 31. MATP activities are designed for individuals with intellectual disabilities with severe<br />
limitations who do not yet possess the physical and/or behavioral skills necessary to participate in official <strong>Special</strong><br />
<strong>Olympics</strong> sports.<br />
“Other” Sports<br />
“Other” Sports are those sports that are not official sports but are locally popular or recognized sports.<br />
The word “other” on the APS form in the Sports Column is designated to collect data for other sports that are not<br />
listed on the form (for example, Recognized sports).<br />
An example of “other” is the sport of cricket for South Africa. Cricket is not an official <strong>Special</strong> <strong>Olympics</strong> sport.<br />
However, it is offered by <strong>Special</strong> <strong>Olympics</strong> South Africa and provides data for growth of new sports.<br />
Total Revenue (USD) Definition<br />
Revenue includes SOI distributions (such as direct mail and grants, including Christmas Records<br />
Grants), contributions from individuals, royalties and sponsorships from corporations, government support,<br />
foundation grants, and community support. <strong>Report</strong> the estimated total revenue (in USD) that your Program<br />
received from all sources during the calendar year 1 January to 31 December (except for in-kind donations -- these<br />
will be reported separately below).<br />
In-Kind Donations<br />
In-kind donations are goods and services provided free of charge to Programs to support their operations. <strong>Report</strong><br />
the value of in-kind donations (USD) your Program received from 1 January to 31 December.<br />
Number of Competition Opportunities<br />
Competitions can include all forms of competition, including: multi-sport “Games,” local level league play for team<br />
sports, single sport meets and competitions. <strong>Report</strong> the total number of competitions that have been conducted at<br />
all Program levels from 1 January to 31 December.<br />
Coaches<br />
A coach provides <strong>Special</strong> <strong>Olympics</strong> athletes with comprehensive sports training and preparation for competitions.<br />
<strong>Report</strong> the total number of coaches that have coached athletes from 1 January to 31 December.<br />
<strong>Special</strong> <strong>Olympics</strong> <strong>Reach</strong> <strong>Report</strong> <strong>2008</strong><br />
25
<strong>Special</strong> <strong>Olympics</strong> <strong>Reach</strong> <strong>Report</strong> <strong>2008</strong><br />
www.specialolympics.org