By: Richard Caldwell
By: Richard Caldwell
By: Richard Caldwell

You also want an ePaper? Increase the reach of your titles
YUMPU automatically turns print PDFs into web optimized ePapers that Google loves.
Reflective<br />
practice<br />
Holistic<br />
appraisal<br />
Coherent information<br />
systems<br />
Analysis &<br />
Synthesis<br />
Focused<br />
strategy<br />
<strong>By</strong>: <strong>Richard</strong> <strong>Caldwell</strong><br />
Editing and formatting: Tom Barton<br />
CARE DME Series Editor: Jim Rugh<br />
July 2002
Working Draft – Full Version 1.0 July 2002<br />
(See also condensed version: “Essentials of Project Design”)<br />
Author:<br />
<strong>Richard</strong> <strong>Caldwell</strong>, Tango International, Tuscon, Arizona, USA<br />
Editing and formatting:<br />
Tom Barton, Creative Research and Evaluation Centre (CRC), Kampala, Uganda<br />
CARE DME Series Editor:<br />
Jim Rugh, DME Co-ordinator, CARE, Atlanta, USA<br />
This report was made possible<br />
through support provided by the<br />
Office of Food for Peace, US<br />
Agency for International<br />
Development under the terms of<br />
CARE's Institutional Support<br />
Assistance Award<br />
FAO-A-00-98-00055-00. The<br />
opinions expressed herein are<br />
those of CARE and do not<br />
necessarily reflect the views of the<br />
US Agency for International<br />
Development. It may be<br />
reproduced, if credit is given to<br />
CARE.<br />
Copyright 2002 © Cooperative for Assistance and Relief Everywhere, Inc. (CARE)<br />
151 Ellis Street NE, Atlanta, Georgia 30303 USA<br />
Not-for-profit and governmental organizations supporting humanitarian relief and development may reproduce this<br />
publication, in whole or part, provided the following notice appears conspicuously with any such reproduction:<br />
“From Project Design Handbook. Copyright 2002 Cooperative for Assistance and Relief Everywhere, Inc. (CARE).<br />
Used by permission”<br />
For information about how to obtain additional copies, contact PHLSinfo@care.org
Table of Contents<br />
Table of Contents<br />
Foreword ................................................................................................................................ 3<br />
Chapter 1................................................................................................................................ 5<br />
Introduction ....................................................................................................................................... 5<br />
1.1 Project Design Handbook Overview ................................................................................... 6<br />
1.2 Objectives ........................................................................................................................... 8<br />
1.3 Project Design Defined ..................................................................................................... 10<br />
1.4 Designing CARE Projects ................................................................................................. 14<br />
1.5 Design Frameworks .......................................................................................................... 19<br />
Chapter 2.............................................................................................................................. 24<br />
Holistic Appraisal ............................................................................................................................ 24<br />
2.1 Operating Environment (setting and context) ................................................................... 27<br />
2.2 Diagnostics ....................................................................................................................... 28<br />
2.3 Understanding Diversity – Differentiation and Disaggregation ......................................... 34<br />
2.4 Stakeholder Analysis ........................................................................................................ 36<br />
2.5 Institutional Assessment ................................................................................................... 38<br />
2.6 Gender Analysis ............................................................................................................... 42<br />
2.7 Breadth versus Depth ....................................................................................................... 43<br />
2.8 Sequencing of Activities.................................................................................................... 44<br />
Chapter 3.............................................................................................................................. 48<br />
Analysis & Synthesis Techniques in Design ............................................................................... 48<br />
3.1 Systems Perspective ........................................................................................................ 50<br />
3.2 Logic of Cause and Effect ................................................................................................ 51<br />
3.3 Using Cause and Effect Logic in Project Design .............................................................. 52<br />
3.4 Hierarchical Causal Analysis ............................................................................................ 53<br />
3.5 Methods of Causal Analysis ............................................................................................. 57<br />
Chapter 4.............................................................................................................................. 62<br />
Focused Strategy ............................................................................................................................ 62<br />
4.1 Selection of Causes to Address from the Causal Analysis .............................................. 64<br />
4.2 Making Key Choices on Interventions .............................................................................. 67<br />
4.3 Project Hypothesis ............................................................................................................ 72<br />
4.4 Logic Models ..................................................................................................................... 76<br />
4.5 A Rights-Based Assessment of Interventions .................................................................. 78<br />
Chapter 5.............................................................................................................................. 81<br />
Coherent Information Systems...................................................................................................... 81<br />
5.1 Goals................................................................................................................................. 82<br />
5.2 Indicators .......................................................................................................................... 88<br />
5.3 Targets and Benchmarks ................................................................................................. 92<br />
5.4 Outputs, Activities and Inputs ........................................................................................... 94<br />
5.5 Planning for Monitoring and Evaluation ............................................................................ 96<br />
Chapter 6............................................................................................................................ 103<br />
Reflective Practice ........................................................................................................................ 103<br />
6.1 What is Reflective Practice? ........................................................................................... 104<br />
6.2 The Role of Reflective Practice in Project Design .......................................................... 105<br />
6.3 Tools for Promoting Reflective Practice ......................................................................... 106<br />
6.4 Incorporating a Rights-Based Approach into Reflective Practice ................................... 109<br />
Annex 1.1: CARE International Project Standards .................................................................... 112<br />
Annex 2.1: Operating Environment–Analysis Themes ............................................................. 116<br />
Annex 2.2: A Needs Assessment Case Study ........................................................................... 117<br />
Annex 2.3: Wealth Ranking example .......................................................................................... 119<br />
1
Project Design Handbook<br />
2<br />
Annex 2.4: Glossary of Tools ...................................................................................................... 120<br />
Annex 3.1: Causal Analysis Practice Exercises ........................................................................ 124<br />
Annex 3.2: Applying Appreciative Inquiry ................................................................................. 129<br />
Annex 4.1: Project Hypothesis .................................................................................................... 130<br />
Annex 5.1: Goals and Indicators for an Agricultural Project ................................................... 131<br />
Annex 5.2: Goals and Indicators for a Small Business Development Project ....................... 132<br />
Annex 5.3: Indicators at Different Levels in the Project Hierarchy ......................................... 133<br />
Annex 5.4: CARE’s Project Outcome Model .............................................................................. 134<br />
Annex 5.5: The United Way’s Program Outcome Model .......................................................... 135<br />
Annex 5.6: Canadian Performance Framework ......................................................................... 136<br />
Annex 5.7: Classical 4X4 LogFrame ........................................................................................... 137<br />
Annex 5.8: USAID Results Framework ....................................................................................... 138<br />
Annex 5.9: Information for Monitoring Project Process ........................................................... 139<br />
Annex 5.10: Practical Exercise: Writing Clear and Precise Goals .......................................... 140<br />
Annex 5.11: Goal Statements and Operational Definitions ...................................................... 141<br />
Annex: Glossary of Definitions & Acronyms ............................................................................ 142<br />
Definitions given in this Project Design Handbook ..................................................................... 142<br />
Acronyms used in this handbook ................................................................................................ 144<br />
Annex: Bibliography and Suggested Reading .......................................................................... 145<br />
Chapter 1: Overall Design Issues ............................................................................................... 145<br />
Chapter 2: Appraisal ................................................................................................................... 145<br />
Chapter 3: Analysis and Synthesis ............................................................................................. 147<br />
Chapter 4: Focused Strategy ...................................................................................................... 147<br />
Chapter 5: Coherent Information Systems ................................................................................. 148<br />
Chapter 6: Reflective Practice .................................................................................................... 148<br />
Additional Highly Recommended References and links to many more: ..................................... 149
Foreword<br />
We in CARE are on a journey from the ‘old days’ of the CARE Package, ‘truck-and-chuck’<br />
and direct service, to Household Livelihood Security and the incorporation of Rights-Based<br />
Approaches, working with partners to address underlying causes of poverty through the<br />
empowerment of people and advocating for gender equity, human rights and social justice.<br />
We now have a common CARE International vision that compels us to “seek a world of<br />
hope, tolerance and social justice, where poverty has been overcome and people live in<br />
dignity and security.” It goes on to state, “CARE International will be a global force<br />
and a partner of choice within a worldwide movement dedicated to ending poverty.<br />
We will be known everywhere for our unshakable commitment to the dignity of people.”<br />
Our CARE International Mission complements that Vision Statement:<br />
“To serve individuals and families in the poorest communities in the world. Drawing<br />
strength from our global diversity, resources and experience, we promote innovative<br />
solutions and are advocates for global responsibility. We facilitate lasting change by:<br />
• Strengthening capacity for self-help;<br />
• Providing economic opportunity;<br />
• Delivering relief in emergencies;<br />
• Influencing policy decisions at all levels;<br />
• Addressing discrimination in all its forms.<br />
“Guided by the aspirations of local communities, we pursue our mission with both<br />
excellence and compassion because the people whom we serve deserve nothing less.”<br />
We could spend time meditating on those Vision and Mission statements, ‘est’ style, like<br />
‘visualizing world peace,’ hoping that somehow it will happen if enough people really believe<br />
in and are committed to that vision. But we’re practical people. We want to do what we can<br />
to translate that vision into reality – to fulfill that mission.<br />
How do we do that? Well, the means we have to translate vision, principles and values into<br />
action are through programs and projects. Whether in the form of long-term program<br />
strategies, or specific time-bound and funded projects, there have to be processes of<br />
planning programs or designing projects. In order for those processes to translate good<br />
intentions into practical realities, there are a number of basic ‘good practice’ procedures<br />
and methodologies required.<br />
That’s what this Project Design Handbook has been compiled to help us do.<br />
Acknowledging a perception that we should be doing a much better job of project design,<br />
there has been a high demand expressed by many for guidance on what constitutes ‘good<br />
practice’ in design, and how to apply it. Knowing of his many years of experience training<br />
the staff of CARE and other development agencies in many countries around the world, we<br />
asked Rich <strong>Caldwell</strong> to condense his best guidelines into the form of a handbook. This<br />
Foreword<br />
3
Project Design Handbook<br />
4<br />
volume is the result of many years of his work, informed as well by many others who have<br />
also been involved in promoting better project design.<br />
The essence of good design practice requires holistic, logical, systematic, participatory<br />
diagnosis of situations, getting agreement on priority problems to be addressed,<br />
identification of the underlying causes of those problems, choosing interventions that<br />
CARE and partners can implement that have maximum potential for leveraging desired<br />
change, and then designing projects to do that effectively. Projects must also be costeffective,<br />
minimize negative side effects, and maximize their positive impact on the quality<br />
of life of poor people – those who most deserve help.<br />
Over the past several years there has been a major effort (the Impact Evaluation<br />
Initiative or IEI) involving many of us to identify the most essential elements of good<br />
Design, Monitoring and Evaluation. These have evolved into the Project Standards that<br />
have been officially endorsed by the CARE International Board. 1<br />
We recognize the need for a whole series of guidelines and tools to accompany the CI<br />
Project Standards, to help practitioners understand and apply them. This Project Design<br />
Handbook is a major part of that guidance. This Handbook is addressed to those<br />
responsible for project design, whether full-time CARE staff, consultants, or partners.<br />
It is being initially issued as a “working draft” to give time for additional input. We seek<br />
feedback from you, the user, on how to make it even more useful. How can it be improved?<br />
In particular, we seek more examples of project designs, especially logic models, from a<br />
variety of sectors and situations. We especially need examples of projects that are more<br />
explicitly addressing human rights and social injustice; projects that are incorporating<br />
gender equity and diversity; projects that are working with or through partner agencies;<br />
projects that focus on building institutional capacity and promoting civil society; projects<br />
that advocate for policy change. We’re also looking for additional tools and methodologies<br />
you have found useful in diagnostics and design.<br />
This Project Design Handbook is a work in process. For the latest version go to the main<br />
DME (Design, Monitoring and Evaluation) website: www.kcenter.com/care/dme. (There you<br />
will also find links to other DME-related materials, produced by CARE and many other<br />
sources.) Your recommendations for how to improve this Handbook are solicited –<br />
especially more examples of logic models. Please send these to rugh@care.org. Our goal is<br />
to have a final, published version of this Project Design Handbook completed before the<br />
end of calendar year 2002. In the meanwhile, we hope that you find it useful in its present<br />
form as you design projects, or use the material to teach yourself and/or others how to do<br />
so.<br />
Jim Rugh, CARE Coordinator of Program Design, Monitoring and Evaluation<br />
Atlanta, 17 July 2002<br />
1 The CI Project Standards can be seen in Annex 1.1 (page 113).
Reflective<br />
practice<br />
Holistic<br />
appraisal<br />
Coherent information<br />
systems<br />
Analysis &<br />
Synthesis<br />
Focused<br />
strategy<br />
Chapter 1 - Introduction<br />
Chapter 1<br />
Introduction<br />
Project Design Handbook Overview<br />
Objectives<br />
Project Design Defined<br />
Designing CARE Projects<br />
Frameworks for Project Design<br />
This Introduction Chapter provides an overview of design and its<br />
association with CARE's DME cycle. It offers a definition of project<br />
design and provides a suggested hierarchical framework of<br />
objectives. Other conceptual frameworks used in CARE are also<br />
explored and their relevance to design is discussed.<br />
5
Project Design Handbook<br />
6<br />
Chapter 1: Introduction<br />
1.1 Project Design Handbook Overview<br />
This guide introduces a conceptual framework, or roadmap, to program and<br />
project planning. It is designed to help development practitioners understand<br />
the process of design specifically as it relates to development assistance<br />
promoted by CARE. The terminology and stages of design that will be<br />
presented are consistent with CARE’s Impact Evaluation Initiative Guidelines 2<br />
and the CI Project Standards 3 that offer norms and practices that will help<br />
programmers design projects for impact using CARE frameworks.<br />
The rationale for this guide to project design is simple. CARE wants to place<br />
more of the responsibility for project design into the hands of its own<br />
personnel, partners and participants, rather than relying too heavily on<br />
outside consultants. Well-designed projects are crucial to the operation of<br />
development organizations and must be carefully crafted in such a way that<br />
the desired beneficiaries realize the intended effects and impacts.<br />
The purpose of this handbook is to provide you with a general understanding<br />
of project design procedures and with several new skills that can improve the<br />
quality of the programs and projects that you take part in designing. The<br />
skills and knowledge gained by using this handbook should also help you<br />
better understand the projects and programs you are currently implementing<br />
or evaluating, thus contributing to overall program quality and effectiveness.<br />
Issues Box 1<br />
Programs versus Projects<br />
Historically, design efforts within CARE have been geared towards the project level. CARE is<br />
currently placing greater emphasis on a more broadly consolidated program approach as a means<br />
to achieve comprehensive and sustainable impact on improving household livelihood security and<br />
thus reducing poverty. Though projects may be situated within a broader programmatic<br />
framework – based on sectoral, geographic or synergistic impact criteria – they will continue to<br />
be the basic units of CARE’s development interventions. Thus, this handbook focuses on<br />
project-level design, though the design process presented here applies to the program level as<br />
well. Keep in mind that projects operating within a programmatic framework should be clearly<br />
linked to program level goals.<br />
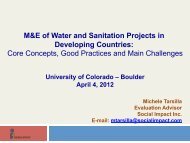
The design framework offered in this handbook is based on five discrete<br />
phases: a holistic situational appraisal around which a project is conceived;<br />
an analysis and synthesis of information that leads to rational choices; a<br />
focused strategy that leads to specific outcomes; a coherent information<br />
system; and reflective practices that seek continual improvement. A<br />
“roadmap” of this framework is illustrated in Figure 1.<br />
2 CARE Impact Guidelines 1999<br />
3 CI Programme Standards Framework 2002.
Figure 1<br />
CARE’s project design framework<br />
1. Holistic appraisal<br />
Purpose - Learning (more) about the context<br />
in which you plan to work<br />
Key Steps/Tools:<br />
• Operating environment<br />
• Diagnostics<br />
• Target groups<br />
• Needs assessment<br />
• Understanding diversity<br />
• Stakeholder analysis<br />
• Institutional assessment<br />
• Gender analysis<br />
• Rights assessment<br />
5. Reflective practice<br />
Purpose – Using M&E information to<br />
make informed decisions and plan<br />
necessary changes in this and<br />
future projects<br />
Key steps/Tools:<br />
• Incorporating reflective practice in<br />
design<br />
• Intended/unintended changes<br />
• Benefits/harms analysis<br />
• Review impact on vulnerable groups, e.g.,<br />
by gender, age, poverty status<br />
• Institutional learning<br />
• Change management<br />
Improved<br />
Household<br />
Livelihood<br />
Chapter 1 - Introduction<br />
2. Analysis and Synthesis<br />
Purpose - Organizing, synthesizing and<br />
understanding the data from your appraisal<br />
Key steps/Tools:<br />
• System perspective<br />
• Cause-effect logic in project design<br />
• Hierarchical analysis<br />
• Methods of causal analysis<br />
• Macro-micro linkages<br />
3. Focused strategy<br />
Purpose - Choosing project interventions and<br />
designing the project<br />
Key steps/Tools:<br />
• Selecting causes to address<br />
• Making key choices on interventions<br />
• Stating the project hypothesis<br />
• Developing logic model<br />
• Examining proposed interventions from a rights<br />
perspective<br />
4. Coherent information systems<br />
Purpose – Planning for how processes will be<br />
monitored and outcomes evaluated<br />
Key steps/Tools:<br />
• Clear goals<br />
• Appropriate indicators<br />
• Set targets and benchmarks<br />
• Outputs, activities and inputs<br />
• Detailed M&E planning<br />
Modified from CARE SWARMU Design Workshop (2000) and O’Brien (2001)<br />
7
8<br />
Project Design Handbook<br />
1.2 Objectives<br />
The overarching objectives of this handbook are listed below. However, you<br />
may have your own reasons for improving your knowledge and skills related<br />
to design. Perhaps you are preparing yourself to take on responsibility for a<br />
project design process. Perhaps you have just completed a concept paper,<br />
design document, or a project proposal and were not totally satisfied with the<br />
process and want to learn other, more systematic methods. Or, perhaps you<br />
are new to these areas and seek a broad understanding of basic design<br />
concepts.<br />
Objectives of this Project Design Handbook<br />
θ To improve the quality of CARE's projects and programs, with<br />
specific emphasis on improving:<br />
• Program effectiveness<br />
• Effect and impact level changes<br />
• Coherency of information systems (and hence the measurability of<br />
impact, as well as an understanding more broadly of the project’s<br />
effect)<br />
• Reflective learning and its use in project management<br />
θ To promote innovation in program/project design, particularly with<br />
respect to:<br />
• The use of current CARE frameworks, the programming principles<br />
and CARE International Project Standards relating to the program<br />
cycle<br />
• Project design within a broader and more holistic planning process<br />
• Participatory methodologies and empowerment approaches<br />
• CARE’s growing role as a facilitator of projects involving multiple<br />
institutions of a community, civil society, government and private<br />
sector nature<br />
• Incorporation of other program frameworks, lenses and approaches,<br />
especially rights-based approaches, benefit/harms and gender<br />
analysis.<br />
There are relatively few good examples of guidelines or blueprints for<br />
planning projects. Part of the reason for this is that, historically, development<br />
projects were planned primarily from a technical perspective, and the<br />
"guidelines" for design were the best practices from the technical fields<br />
themselves. It is still common to find a design team headed by and<br />
composed primarily of sector experts. The development community has only<br />
recently started to implement more holistically and systematically planned<br />
projects, requiring the participation of individuals from a number of<br />
disciplines.<br />
Another reason for poorly designed projects is that often more training and<br />
focus is placed on evaluation and not design. For example, there are<br />
national and global organizations whose primary purpose is promoting quality<br />
evaluation (e.g., American Evaluation Association, African Evaluation<br />
Association) but we know of no organization anywhere dedicated solely to
promoting good program and project planning. This is something like putting<br />
the cart before the horse. As a result, we often have highly skilled evaluators<br />
assessing weak projects. Speaking of poor projects, look what The World<br />
Bank’s own assessment of the quality of their development projects reveals<br />
(Issues Box 2).<br />
Evaluation of project designs for development<br />
How do we, then, improve the quality of project designs? Obviously one way<br />
is to train more people in design processes. To do this effectively, we need a<br />
design framework that can be shared and used and, hopefully, improved<br />
upon over time. Despite the usefulness of a common framework, no strict<br />
blueprint exists for project design. If CARE were in the bridge construction<br />
business, things would be relatively more straightforward. The design of<br />
development assistance projects, however, is complex if for no other reason<br />
than the fact that we work with complex human systems.<br />
Figure 2: The Project DME Cycle<br />
Chapter 1 - Introduction<br />
Issues Box 2<br />
The World Bank Operations Evaluation Department (1987) reported that only 80% of World<br />
Bank projects completed in 1985 could be classified as “worthwhile” and that the proportion was<br />
significantly lower for complex projects in low-income countries where major social and<br />
economic transformations were required (Valdez and Bamberger, 1994). Of the 112 projects<br />
approved in calendar year 1993 and subject to CBA [cost-benefit analysis], 20% were rated<br />
good or better, 42% average or acceptable, 25% barely acceptable or marginal, and 13% were<br />
rated as poor. (Kirkpatrick and Weiss, 1996)<br />
9
10<br />
Project Design Handbook<br />
Project design is an important step or stage of the design, monitoring and<br />
evaluation (DME) cycle. It is useful to review the general DME cycle in order<br />
to understand which stages influence project design and how project design<br />
influences other stages in the life of a project. Note in Figure 2 that design is<br />
an integral part of the DME cycle. Design itself is shown following a<br />
diagnostic phase, which could be, for example, a Long-Range Strategic Plan<br />
or other form of holistic program-level diagnostic, a field-based assessment,<br />
or even a diagnostic of a donor request for interest in a particular<br />
development activity. Later we will discuss a diagnostic phase within the<br />
project design process itself. This should not be confused with a diagnostic<br />
event that guides strategic planning.<br />
One of the important outputs of design, as shown in the DME cycle, is a<br />
logical framework (or some other form of a logic model) that clearly shows the<br />
cause-effect relationships upon which the project is based. In effect, this tool<br />
serves as an executive summary of the goal hierarchy and hypothesis of the<br />
project and usually includes the project's objectives along with verifiable<br />
indicators and assumptions.<br />
Another product that results from design is a monitoring and evaluation plan<br />
(M&E plan). These range from the simple to the complex, and provide details<br />
on how anticipated changes will be measured, when, and by whom. The<br />
baseline phase of the project in many ways symbolizes the start of project<br />
activities and is a qualitative/quantitative study whose main objective is to<br />
establish the initial state of indicators at the start of interventions. Some<br />
compare it to taking a photograph of a person or a place so that in the future,<br />
if you take another photograph you can evaluate changes. Baselines and<br />
other monitoring and evaluation phases are parts of the reflective learning<br />
aspects of the DME cycle. Learning leads to a set of lessons, or collective<br />
knowledge, related to how well the project is meeting or has met its<br />
objectives. These lessons are then available as information to improve the<br />
current project or to design new projects.<br />
1.3 Project Design Defined<br />
Definition Box 1<br />
Project Design<br />
The collaborative and systematic<br />
identification and prioritization of problems<br />
and opportunities and the planning of solutions<br />
and ways of assessing project outcomes,<br />
which together will promote fundamental and<br />
sustainable change in target populations and<br />
institutions.<br />
Suffice it to say that project design is the<br />
systematic identification and prioritization of<br />
problems and opportunities and the planning<br />
of solutions. A stricter definition is not<br />
needed, for good project design can be many<br />
things, depending on the circumstances.<br />
All project designs, however, should have at<br />
least five elements or layers. Project design<br />
systematically formulates and describes each<br />
of the basic elements: inputs, activities,<br />
outputs, effects, and impact (Figure 3).
Each element is defined,<br />
in part, by the previous<br />
element. As we will see<br />
later, project design<br />
should start with defining<br />
the desired impact. So we<br />
work from the ‘top’ down:<br />
What effects are needed<br />
to achieve the desired<br />
impact? What outputs are<br />
needed to achieve the<br />
desired effects? And so on.<br />
Figure 3: Project Hierarchy<br />
Outputs<br />
Activities<br />
Inputs<br />
Projects, almost without exception, should follow this strict yet simple<br />
hierarchy. The lowest level in the hierarchy is inputs (Table 1). All projects<br />
require inputs such as time, finances, human resources and materials. Inputs<br />
have to be budgeted, and so the project budget will detail most of the<br />
required inputs and the quantity required. Inputs such as time can be<br />
presented in the project’s time-line or Gantt chart.<br />
All projects involve a series of activities such as communicating, training,<br />
organization, construction and management. The implementation of project<br />
activities converts inputs to outputs. Outputs are the basic goods and<br />
services that the project produces by carrying out the activities. These three<br />
levels -- inputs, activities, and outputs -- include resources and actions that a<br />
project takes in order to bring about desired change. The interventions that<br />
we design in projects are also composed of these three elements. That is to<br />
say, interventions are a strategic combination of inputs, activities and outputs.<br />
Outcomes, including effects and impact, represent desired changes the<br />
project hopes to bring about. Each project is unique and is aimed at<br />
achieving a set of different outcomes, and the most important types of<br />
outcomes for CARE are client/participant outcomes and institutional<br />
outcomes (see example in Issues Box 3 below). Note that a project has<br />
direct control up to the output level. If the project’s hypothesis is sound and<br />
does its work well, its outputs should lead to desired outcomes. However, the<br />
outcomes are beyond its direct control. Outcomes are what others do<br />
(influenced by the project).<br />
Chapter 1 - Introduction<br />
Impact<br />
Effects<br />
Issues Box 3<br />
Example: Impacts and effects<br />
A project aimed at improving health care systems by strengthening decentralization and local<br />
decision-making, and restructuring how services are accessed and financed, has a desired impact<br />
of "improved health status for those living in the community served.” The effect changes<br />
include effective decentralization (systemic), improved local decision making (systemic),<br />
changing use (access) by households (behavioral) and restructuring finance (systemic).<br />
11
Project Design Handbook<br />
12<br />
Table 1: Terms for Project Hierarchy Defined<br />
Definition and explanation Agroforestry Examples<br />
Impact: Equitable and durable improvements in human wellbeing<br />
and social justice. The ultimate outcomes of<br />
development and emergency assistance (e.g., improved<br />
health status or wellbeing), measured at the individual,<br />
social, geographic or administrative level.<br />
Comments: There are various levels of impact, from more<br />
tangible and immediate to broader impact that may not<br />
be manifested or discernable until some time later.<br />
Programs aim at “higher level,” longer-term impact.<br />
Projects aim at levels of impact that can be manifested<br />
during their lifetimes, given their resources.<br />
Effects: Changes in human behaviors and practices as well as<br />
systems. Systems changes can include institutional<br />
competency (e.g., improved health-care systems), policy<br />
change (e.g., new or revised policies, change of<br />
enforcement) or service changes (e.g., more effective<br />
extension system).<br />
Comments: Effects result from the successful<br />
achievement of outputs but their realization is<br />
dependent on the logic of the project hypothesis being<br />
sound. Effects are what others (such as beneficiaries)<br />
do on their own (influenced by the project’s outputs as<br />
well as external factors).<br />
Outputs: The goods and services produced through project<br />
activities. Outputs include such things as trained<br />
individuals, physical structures, documents or newly<br />
formed institutions.<br />
Comments: This is the highest level over which project<br />
implementers have direct control.<br />
Activities: The actions or interventions that convert project inputs<br />
into outputs (e.g., communicating, training, construction,<br />
organization and management).<br />
Inputs: All resources (e.g., money, materials, time, and personnel)<br />
needed to undertake a set of activities.<br />
Increased income for practicing<br />
farmers; improved safety nets<br />
for vulnerable households;<br />
increased environmental<br />
stability; improved diet (from<br />
fruit trees or new crop<br />
alternatives)<br />
Farmers incorporating trees into<br />
their agricultural practices;<br />
agroforestry committee<br />
advocating tree ownership issues<br />
to local government; proper tree<br />
management by farm households;<br />
new policies enacted and<br />
enforced on tree tenure; sales of<br />
agroforestry goods such as<br />
lumber<br />
Viable tree saplings for<br />
distribution; trained farmers<br />
willing to participate;<br />
demonstration farm;<br />
agroforestry manuals in local<br />
language; agroforestry<br />
committees organized<br />
Farmer-to-farmer training;<br />
seedling management training;<br />
extension activities<br />
Tree seedlings; participant labor;<br />
land for demo farm; plastic<br />
sacks; fertilizer, transportation<br />
Effect changes represent the first level of desired outcomes that we want to design for and<br />
later verify. There are two basic types of effect outcomes - behavioral and systemic. (These<br />
terms are defined more precisely in Table 1). Our project design logic tells us that these<br />
effect changes will occur as a result of all the goods and services (the outputs) a project<br />
produces, plus the fulfillment of key assumptions regarding external factors.<br />
The success or achievement at one level in the hierarchy is dependent on those levels<br />
below. Thus, the desired change at the effect level will be the result of the successful
Chapter 1 - Introduction<br />
completion of the project outputs. If the project produces all of its planned outputs but the<br />
effect level changes do not occur, then something was wrong with the project’s logic,<br />
leading to the selection of an improper set of interventions. Alternatively, the logic was<br />
correct but something significant changed while implementing the project.<br />
The final level in the hierarchy is impact. CARE defines impact as an “equitable and durable<br />
improvement in human wellbeing and social justice.” 4 This includes, for example, decreases<br />
in malnutrition, increases in income, positive changes in health status, etc. It is the ultimate<br />
aim of our project or program. Again, project logic tells us that if our outputs are<br />
successfully achieved they will lead to the planned effect changes, which, in turn, will lead to<br />
our desired change(s) at the impact level. If this doesn't happen, even if the quality of our<br />
process and outputs was adequate, then perhaps our design logic was flawed or key<br />
assumptions did not hold.<br />
We will see throughout the course of this guide how design logic is constructed and how we<br />
must think about what external factors could disrupt this logic and cause our planned<br />
changes not to be achieved.<br />
Remember that project design is not a hard science. If you search for information on project<br />
design in your local library or through the Internet, you may have a difficult time finding much<br />
information. Few academic papers, and even fewer books, have been written about project<br />
design or planning. You will, however, find some guidelines similar to these developed<br />
within specific agencies or institutions. Perhaps it is this way because project design has<br />
not traditionally been given serious merit by academicians or by donor agencies. Many<br />
assume that it is purely common sense and that anyone experienced in their technical<br />
subject area -- be it nutrition, health, agriculture, water, etc. -- can design a good project.<br />
History has taught us otherwise! Everyone who has had experience in managing projects<br />
knows that there are well-designed projects and there are poorly designed projects.<br />
Although nobody sets out to purposefully design a poor project, there are many avoidable<br />
circumstances that commonly increase the likelihood of a poor design.<br />
“Those who forget the past are doomed to repeat it.”<br />
George Santayana<br />
We recommend that a project planning team spend as much time as necessary reviewing<br />
the most frequent causes of project failures and successes, as well as any relevant local<br />
project or project component/sectoral successes and failures in recent memory. This can be<br />
done through reviewing evaluation reports and ‘best practice’ guidelines. To not take this<br />
step is to ignore history, and thus risk repeating it.<br />
Table 2 provides some reasons that some projects are successful. The more of these items<br />
that you can check off as completed during your design process, the more chance you have<br />
of designing a winning project!<br />
4 CI Project Standards, IEI-II Conference Report, Nov. 2001.<br />
13
Project Design Handbook<br />
14<br />
Table 2: Some Common Factors That Contribute to Successful Projects<br />
Lessons learned about why projects succeed<br />
Is this practice<br />
present in your<br />
project? (yes/no)<br />
(See chapters below<br />
to learn more)<br />
1. A formal project planning (design) process is utilized Chapter 1.1 – 1.3<br />
2. Presence of a “winning” strategic plan, focused on achieving fundamental<br />
change, to which all programs/projects contribute<br />
3. Presence of a comprehensive and detailed holistic appraisal of the existing<br />
situation.<br />
4. Clear lines of responsibility and understanding with other organizations in the<br />
project area, so it is easy to assess success or failures (attribution is<br />
evident up to output level, contribution to effect and impact levels)<br />
Chapter 1.4-1.5<br />
Chapter 2.2 – 2.4, 5.5<br />
Chapter 2.4 – 2.5<br />
5. A thorough, systemic problem analysis is completed Chapter 3.1 – 3.5<br />
6. Potential constraints are considered, key questions answered, and assumptions<br />
identified<br />
7. Stakeholders intimately involved in the design process (they have “buy-in” to<br />
the project)<br />
Chapter 3.4.1, 4.3 –<br />
4.4<br />
Chapter 2.3, 2.4,<br />
3.4.2, 4.2ff<br />
8. Clear linkage of project design to a comprehensive program logic Chapter 4<br />
9. Lessons learned from previous project failures and successes (e.g., by<br />
reviewing evaluation reports and ‘best practice’ guidelines) are incorporated<br />
in new designs<br />
10. Alternative, more cost-effective approaches are considered during the<br />
design stage<br />
Chapter 4.2<br />
Chapter 4.2<br />
11. Clear and measurable indicators of outcomes (effect and impact changes) Chapter 5.1<br />
12. Indicators are linked to the right levels (inputs, outputs, effects, impact) Chapter 5.2<br />
13. Indicators that can be measured in an objectively verifiable manner Chapter 5.2<br />
14. Clear specifications for quality and quantity of deliverables Chapter 5.4<br />
15. Inputs and/or outputs are linked to effect objectives or impact goal Chapter 5<br />
16. Time, inputs, and outputs are logically connected Chapter 5.3<br />
17. Progress in achieving the project’s objectives is measured and reported Chapter 5.5<br />
18. Anticipate changes made to the original design during the life of the project<br />
(promote flexibility – if reasonable and the reasons are documented and<br />
approved by key stakeholders)<br />
1.4 Designing CARE Projects<br />
Chapter 6<br />
The nature and scope of projects that institutions undertake is potentially<br />
limitless. However, some projects are not worth doing and should never be<br />
designed, or they may not have a high priority when compared to others that<br />
could be designed with the same money. Other projects may be beyond the<br />
capabilities of the implementing organization. To bring coherence to an
institution’s portfolio, there needs to be guidance that governs the choice of<br />
projects that are designed. This chapter describes the directives used by<br />
CARE and how they relate to projects that are ultimately designed.<br />
Vision and Programming Principles<br />
Organizations operate on some mix of<br />
principles and philosophical ideals. Indeed,<br />
most institutions have a mandate or vision<br />
statement that provides a broad direction to<br />
guide choices of what actions will be initiated<br />
and what objectives will be pursued. An<br />
organization’s vision is often an abstract<br />
statement or mental picture of where an<br />
organization wants to be sometime in the<br />
future. It is not always attainable, but should<br />
Chapter 1 - Introduction<br />
Definition Box 2<br />
Programming Principles<br />
Frameworks that can be used to define<br />
appropriate problems to address. These<br />
frameworks also help clarify a project’s<br />
context and how a project links to larger<br />
program goals.<br />
reflect an organization’s values and ideals. Finally, a vision is often a means<br />
of differentiating an organization from its peers or competitors.<br />
An environmental organization might be dedicated to the preservation of<br />
biodiversity worldwide or to the promotion of sustainable agriculture. Other<br />
institutions might be committed to enhancing the rights of women or children,<br />
to ending hunger or to eradicating diseases. For each of these institutions,<br />
the projects they design should be consistent with the vision and mission of<br />
the organization.<br />
Issues Box 4<br />
CARE International's Vision Statement<br />
We seek a world of hope, tolerance and social justice, where poverty has been overcome and<br />
people live in dignity and security. CARE International will be a global force and a partner of<br />
choice within a worldwide movement dedicated to ending poverty. We will be known everywhere<br />
for our unshakable commitment to the dignity of people.<br />
CARE's vision statement (Issues Box 4) tells us that its projects will be linked<br />
to eradicating poverty and promoting social justice. This at once tells us that<br />
we design projects that contribute in some way to these ultimate impacts.<br />
CARE International's vision is only one of several organizational directives<br />
that guide the design of its projects. Figure 4 shows other "levels," including<br />
Program Principles, Project Standards and DME Core Guidelines. Together,<br />
these elements provide design guidance on the genre of projects compatible<br />
with CARE’s core business.<br />
15
Project Design Handbook<br />
16<br />
Figure 4: "Levels" of Direction Provided by<br />
CARE for Designing Projects<br />
CI Vision & Mission<br />
Vision<br />
Program Principles<br />
CI Project<br />
Standards<br />
DME Guidelines<br />
CARE International has a set of five<br />
fundamental principles that form the<br />
basis of all CARE's work in<br />
development and relief. Each CARE<br />
project is expected to embody all five<br />
principles. 5<br />
They are:<br />
• Significant scope<br />
• Fundamental change<br />
• Working with poor people<br />
• Participation<br />
• Replicability<br />
Each CARE project, then, must<br />
identify an opportunity to resolve a<br />
problem that makes an important<br />
difference in the lives of significant<br />
numbers of poor people. Each project must promote fundamental change.<br />
This means that the impact of a project must contribute to a meaningful<br />
change in the lives of people. (We see this reflected in CARE's definition of<br />
impact: “equitable and durable improvements in human wellbeing and social<br />
justice.”) Projects must work with and for the benefit of the poorest people<br />
(whether this be done through direct service or indirectly through<br />
partnerships, advocacy, etc.). Projects must involve meaningful participation<br />
by a broad range of stakeholders. Finally, projects must be replicable, i.e.,<br />
they must have lessons learned that can be applied to new projects in<br />
different geographic locations and with different participants. This includes<br />
scaling up to extend benefits to a greater number of persons.<br />
In addition to an organizational vision and program principles, CARE<br />
International has developed a set of standards for the design, monitoring and<br />
evaluation of programs and projects (Issues Box 5). These standards have<br />
been developed with broad participation of CARE International Members and<br />
Country Offices. They represent what CARE considers as best practices for<br />
good programming. As noted in the introduction to the CARE International<br />
Project Standards 6 , if a project cannot meet one or more standards, it must at<br />
a minimum provide an explanation of why, and what will be done about it.<br />
These standards, as well as guidelines in this Project Design Handbook, are<br />
used to guide the work of project designers, as a checklist for approval of<br />
project proposals, as a tool for periodic project self-appraisal, and as a part of<br />
project evaluation.<br />
5<br />
At the time this Handbook was being completed the CI Programme Working Group was reviewing these<br />
principles for possible revision.<br />
6<br />
As endorsed by the CARE International Board, May 2002.
CARE International Project Standards<br />
Each CARE project should:<br />
Chapter 1 - Introduction<br />
Issues Box 5<br />
1. be consistent with the CARE International Vision and Mission, Programming Principles<br />
and Values.<br />
2. be clearly linked to a Country Office strategy and/or long term program goals.<br />
3. ensure the active participation and influence of stakeholders in its analysis, design,<br />
implementation, monitoring and evaluation processes.<br />
4. have a design that is based on a holistic analysis of the needs and rights of the target<br />
population and the underlying causes of their conditions of poverty and social injustice.<br />
It should also examine the opportunities and risks inherent in the potential<br />
interventions.<br />
5. use a logical framework that explains how the project will contribute to an ultimate<br />
impact upon the lives of members of a defined target population.<br />
6. set a significant, yet achievable and measurable final goal.<br />
7. be technically, environmentally, and socially appropriate. Interventions should be based<br />
upon best current practice and on an understanding of the social context and the needs,<br />
rights and responsibilities of the stakeholders.<br />
8. indicate the appropriateness of project costs, in light of the selected project strategies<br />
and expected outputs and outcomes.<br />
9. develop and implement a monitoring and evaluation plan and system based on the logical<br />
framework that ensures the collection of baseline, monitoring, and final evaluation data,<br />
and anticipates how the information will be used for decision making; with a budget that<br />
includes adequate amounts for implementing the monitoring and evaluation plan.<br />
10. establish a baseline for measuring change in indicators of impact and effect, by<br />
conducting a study or survey prior to implementation of project activities.<br />
11. use indicators that are relevant, measurable, verifiable and reliable.<br />
12. employ a balance of evaluation methodologies, assure an appropriate level of rigor, and<br />
adhere to recognized ethical standards.<br />
13. be informed by and contribute to ongoing learning within and outside CARE.<br />
As approved by the CI Board on 24 May 2002. See brief explanatory statements in Annex 1.1.<br />
Note that the CARE International Project Standards speak of both the CARE<br />
International Vision as well as Country Office strategies. Each Country Office<br />
may have its own vision statement as well as a long-range strategic plan,<br />
both of which provide further guidance on what types of projects are<br />
appropriate to design.<br />
17
Project Design Handbook<br />
18<br />
D, M&E Core Guidelines<br />
For explicit guidance on project design, monitoring and evaluation, CARE is<br />
developing a comprehensive set of core guidelines based on the CARE<br />
International Project Standards, and to expand upon them. These guidelines<br />
are meant to facilitate planning and execution of projects and serve not only<br />
CARE staff but also others, such as partner organizations and consultants,<br />
who assist CARE in it design efforts. This Project Design Handbook is the<br />
Core Guideline for the design portion of D, M&E.<br />
Strategic Directions<br />
Strategic directions are the actions organizations undertake to achieve their<br />
vision. In a given organization, a strategic planning process—at the<br />
international, national or regional levels—is a likely method used to define the<br />
strategic direction. Projects represent the operationalization of such strategic<br />
plans. Defining and acting upon strategic directions has two major<br />
components: programming decisions and institutional decisions. Projects<br />
should not be isolated, but clearly embedded in long-term program and<br />
strategic frameworks.<br />
Planning links between programmes and projects<br />
Issues Box 6<br />
Long-range Strategic Plan (Country office or area) Program Plans Project(s)<br />
1. Programmatic Decisions: A strategic plan generally explores a wide range<br />
of contextual information to guide the project design process. It defines<br />
strategies including target population(s), priority problems to be addressed<br />
and the broad implementation approach(es). The plan can also define the<br />
sequence in which one or more project interventions will be implemented and<br />
identify the resources available from government, non-government and<br />
community organizations plus the private sector to support such projects, as<br />
well as identify specific project zones or geographic areas.<br />
Ideally, project design should fit within programmatic strategies (see Issues<br />
Box 6) and correspond in part to the intervention strategy, which is described<br />
later in Chapter 4. The results of a program diagnostic assessment and<br />
problem analysis should help the program/project design team to link the<br />
strengths and capabilities of the organization and its partners in the<br />
community with the needs and rights to be addressed.<br />
2. Organizational Capacity: Project designers try to match the institution’s<br />
capabilities with potential interventions. However, an organization need not<br />
be limited by its current capacity when making programmatic decisions. It<br />
can choose to develop its own capacity, so that it is capable of carrying out<br />
programs and projects it deems vital, or it can choose to partner with<br />
organizations that have the capacity. An analysis of organizational capacity<br />
should examine its structures, systems and processes as well as the skills<br />
and training needs of permanent staff and associates. More often CARE
programs will focus on the institutional development or institutional capacity<br />
building of partner institutions, so that they, in turn, can be more capable of<br />
planning and implementing programs that improve the lives of their clients –<br />
the ultimate beneficiaries we all care about.<br />
1.5 Design Frameworks<br />
Definition Box 3 describes household livelihood security – a multi-sectoral<br />
framework used by CARE to guide programmatic decisions. In designing<br />
CARE projects one also needs to consider frameworks that are in use by the<br />
organization and how they influence the way a project is designed. These<br />
frameworks represent development paradigms in use by the organization.<br />
They relate quite specifically to the vision and principles established by CARE<br />
and, in fact, they are borne out of the organization’s strategy for meeting its<br />
objectives.<br />
HLS is the basic framework used by CARE to guide its programming.<br />
Recently RBA has been added as an important approach for addressing HLS<br />
by more explicitly examining underlying causes of poverty and social justice<br />
from a human rights perspective.<br />
Chapter 1 - Introduction<br />
Issues Box 7<br />
Multi-sectoral programming<br />
Multi-sectoral programming is a conceptual approach to program and project design that looks<br />
at the full range of requirements of vulnerable populations. A holistic diagnostic of needs and<br />
opportunities is conducted under a multi-sectoral framework, though this does not necessarily<br />
need to lead to a fully integrated project. The approach seeks to identify those actions that<br />
will best help these populations fulfill fundamental rights and meet basic needs by empowering<br />
them to acquire adequate and sustainable access to income, resources, and rights.<br />
The benefits of a multi-sectoral approach to project design include:<br />
• Improving an organization’s ability to target poor and vulnerable populations in its<br />
programming;<br />
• Assisting organizations to achieve complementarity among projects in the same<br />
geographical region;<br />
• Focusing attention on addressing underlying causes and promoting sustainable, positive<br />
change in the wellbeing of people;<br />
• Helping identify interventions with a high potential for impact;<br />
• Providing a learning tool (framework) for improving staff capacity to look at development<br />
problems from a multi-sectoral perspective;<br />
• Promoting cross-sectoral indicators for measuring meaningful change.<br />
19
Project Design Handbook<br />
20<br />
Household Livelihood Security<br />
Since 1995, CARE USA has promoted the use of a livelihoods<br />
approach to its programming worldwide. The idea of Household<br />
Livelihood Security (HLS) as defined<br />
Definition Box 3<br />
Household Livelihood Security<br />
HLS is a multi-sectoral design framework<br />
employed by CARE and other development<br />
organizations. It can be defined as “adequate<br />
and sustainable access to assets and<br />
resources necessary to satisfy basic human<br />
needs.” HLS emphasizes households as the<br />
focus of analysis because they are the social<br />
and economic units within which resources are<br />
organized and allocated to meet the basic<br />
needs of the household members.<br />
Livelihoods comprise the adequate stocks and<br />
flows of food, cash and other resources to<br />
meet basic needs. They can be made up of a<br />
range of on-farm and off-farm activities that<br />
together provide a variety of procurement,<br />
storage, utilization and management<br />
strategies to meet their needs. The basic<br />
rights and needs of households include a wide<br />
range of commodities and services such as<br />
food, nutrition, potable water, health services<br />
and facilities, educational opportunities,<br />
housing, social freedom, and so on.<br />
Livelihoods are secure when households have<br />
secure ownership of or access to resources<br />
and income-earning activities, including<br />
reserves and assets to offset risks, ease<br />
shocks and meet contingencies. The longterm<br />
sustainability of livelihoods is assured<br />
when Households can:<br />
• cope with and recover from stress and<br />
shocks;<br />
• maintain their capability and assets; and<br />
• provide sustainable livelihood<br />
opportunities for the next generation.<br />
in Definition Box 3 embodies three<br />
fundamental attributes: the<br />
possession of human capabilities<br />
(such as education, skills, health,<br />
psychological orientation); access to<br />
tangible and intangible assets; and<br />
the existence of economic activities.<br />
The interaction between these<br />
attributes defines what livelihood<br />
strategy a household pursues and is<br />
thus central to CARE’s Livelihood<br />
Security Model outlined in the Figure<br />
5 on the next page. This model is<br />
continuously evolving and it has had a<br />
major impact on the way that CARE<br />
designs its development assistance<br />
projects. In fact, much of the content<br />
of this handbook reflects the influence<br />
that HLS has had on project design<br />
(e.g., holistic appraisal as a discrete<br />
design step).<br />
Note - Because the livelihood security of a<br />
household is determined by the cumulative<br />
actions of its members, the rights and<br />
responsibilities/ tasks of all the household<br />
members and its community (broadly<br />
defined) must be taken into account when<br />
designing projects. It is important to be<br />
aware that the HLS framework does not<br />
require CARE to work directly at the<br />
household level, but rather, CARE may work<br />
with and through community or regional<br />
institutions, or even through policy advocacy.<br />
But the point is that ultimately the impact<br />
needs to be manifest at the household level<br />
(in the lives of real people).<br />
Unlike more traditional ‘resource-focused’<br />
projects, the livelihood approach requires<br />
design staff 7 to gain a good understanding of<br />
the overall context in which households are<br />
operating, before seeking to design<br />
7 The term ‘design staff’ represents anyone involved in any stage of the design process. This can range<br />
from a small group of people within CARE to a large and diverse group that includes community members,<br />
partners, and other key stakeholders. Maximum participation should be sought whenever practical.
appropriate interventions, and then subsequently to evaluate the impact of<br />
interventions on livelihoods of people. This is captured in CARE’s three basic<br />
design principles for livelihood programs:<br />
■ Programs must be founded on a holistic analysis of the contextual<br />
environment.<br />
■ Programs must be strategically focused.<br />
■ Programs require coherent information systems. 8<br />
Figure 5: CARE’s Household Livelihood Security Model<br />
• Natural<br />
Resources<br />
• Institutions<br />
• Infrastructure<br />
• History<br />
• Economic,<br />
Cultural and<br />
Political<br />
Environment<br />
• Demography<br />
SHOCKS<br />
&<br />
STRESSES<br />
Natural<br />
Capital<br />
(resources)<br />
Production<br />
&<br />
Income<br />
Activities<br />
Human Capital<br />
(Livelihood<br />
Capabilities)<br />
ASSETS<br />
Social Capital<br />
(Claims &<br />
Access)<br />
HOUSEHOLD<br />
Processing, Exchange,<br />
Marketing Activities<br />
CONTEXT LIVELIHOOD<br />
STRATEGY<br />
Economic Capital<br />
(Stores &<br />
Resources)<br />
Consumption<br />
Activities<br />
A livelihoods approach builds heavily on participatory poverty assessments.<br />
In many of CARE’s livelihood promotion projects we have taken this a stage<br />
further and made participatory approaches the basis of not only the analysis,<br />
but also the design, implementation, monitoring and ongoing sustainability of<br />
the project. More will be said about HLS in the context of specific project<br />
design stages throughout this handbook.<br />
8 This coherence is critical for programs (which may be made up of a number projects) not just individual<br />
projects, yet is something which is rarely satisfactorily achieved by NGOs, and poses an even greater<br />
challenge for donors. Adapted from Drinkwater<br />
Chapter 1 - Introduction<br />
Security of:<br />
• Food<br />
• Nutrition<br />
• Health<br />
• Water<br />
• Shelter<br />
• Education<br />
• Community<br />
Participation<br />
• Personal<br />
Safety<br />
LIVELIHOOD<br />
OUTCOMES<br />
From: Frankeberger, Drinkwater and Maxwell 2000<br />
21
Project Design Handbook<br />
22<br />
Rights-based Design<br />
Since 1999, CARE has been developing rights-based approaches. CARE’s<br />
definition of a Rights-Based Approach (RBA) is provided in Definition Box 4.<br />
RBA is compatible with, complementary to, and in many ways builds on, the<br />
HLS framework. Both approaches emphasize holistic analysis, participation,<br />
and rooting out poverty and injustice by addressing underlying causes of<br />
human suffering.<br />
Definition Box 4<br />
Rights-Based Approach<br />
‘A rights-based approach deliberately and<br />
explicitly focuses on people achieving the<br />
minimum conditions for living with dignity (i.e.,<br />
achieving their human rights). It does so by<br />
exposing the roots of vulnerability and<br />
marginalization and expanding the range of<br />
responses. It empowers people to claim and<br />
exercise their rights and fulfil their<br />
responsibilities. A rights-based approach<br />
recognizes poor, displaced, and war-affected<br />
people as having inherent rights essential to<br />
livelihood security – rights that are validated<br />
by international law.’ Jones, 2001<br />
As we saw with the HLS framework, there<br />
are important design principles that<br />
accompany a rights-based programming<br />
(RBA) approach. 9<br />
RBA affirms people’s right to participate<br />
in decision-making processes that affect<br />
their lives – The right to participate in<br />
such processes includes the right to<br />
have access to relevant information.<br />
Genuine participation and control over<br />
our own destinies is not a luxury; it is a<br />
right. Relevant decision-making<br />
processes take place at all levels of<br />
governance, from the community to the<br />
national and even international levels,<br />
as well as in other spheres (e.g., the<br />
decisions of private actors – including<br />
CARE – intervening at the local level).<br />
RBA requires identifying and seeking to address the underlying causes of<br />
poverty and suffering – The achievement of rights and, indeed, poverty<br />
eradication are impossible without embracing a holistic perspective and<br />
identifying and addressing the underlying, basic causes of people’s<br />
inability to realize their rights, e.g., to food, health, etc. Interventions that<br />
fail to target these causes can only have limited, if any, sustainable<br />
impact on poverty and people’s ability to live in dignity and security.<br />
RBA refuses to tolerate discrimination and inequities that impede peace<br />
and development – An emphasis on the equal dignity and worth of all<br />
underlies the promotion of tolerance, inclusion, nondiscrimination, and<br />
social justice. The building of more just societies requires identifying and<br />
overcoming barriers that prevent excluded or oppressed people from<br />
realizing their rights. It also calls for a specific focus on empowering such<br />
groups to stand up for their rights and effectively assume responsibility for<br />
their own futures.<br />
RBA holds all of us accountable for respecting and helping to protect and<br />
fulfill human rights – We all are born not only with rights, but also with<br />
duties, or responsibilities. Affirming our moral nature and mutual<br />
9 Jones 2001.
solidarity, the Universal Declaration of Human Rights is explicit on this<br />
fundamental point. Unlike needs, which can be viewed in isolation, rights<br />
generate responsibilities - and those responsibilities are tied to defined<br />
and universally agreed standards. The relational nature of rights adds<br />
new force to our commitment to be advocates for global responsibility.<br />
Throughout this handbook, there will be references to how rights-based<br />
programming can be accommodated during specific design steps.<br />
Chapter 1 - Introduction<br />
23
Project Design Handbook<br />
24<br />
Reflective<br />
practice<br />
Holistic<br />
appraisal<br />
Coherent information<br />
systems<br />
Analysis &<br />
Synthesis<br />
Focused<br />
strategy<br />
Chapter 2<br />
Holistic Appraisal<br />
Operating Environment<br />
Diagnostic Assessment<br />
Participant Groups<br />
Differentiation/ Disaggregation<br />
Stakeholder Analysis<br />
Institutional Assessment<br />
Gender Analysis<br />
This Chapter provides guidance for conducting a holistic program<br />
diagnostic assessment, the first stage in our project design<br />
framework. Holistic appraisal provides us with a number of tools to<br />
collect information we can use to identify constraints and<br />
opportunities around which the project will be designed.
Chapter 2: Holistic Appraisal<br />
The first stage in our project design process is holistic appraisal. The term<br />
holistic appraisal implies a multi-dimensional view of livelihoods and factors,<br />
both internal and external, which influence livelihoods. Holistic appraisal is<br />
used to identify priority needs, describe livelihoods and search for key<br />
conditions that have an impact on livelihoods, and will lead us to the<br />
identification of the most vulnerable households. It will also place peoples'<br />
priorities and aspirations for improving their livelihoods firmly at the center of<br />
our analytical and planning process.<br />
Holistic analysis concerns the assessment and analysis of human conditions,<br />
at a more macro level in strategic planning and a more micro level<br />
(geographically speaking) in project design. Though holistic analysis applies<br />
to both the program and the project levels, in reality it is usually more in-depth<br />
at the program level, as it is often neither feasible nor cost-effective to<br />
conduct a thorough, holistic diagnostic assessment for each individual<br />
project.<br />
The holistic appraisal stage utilizes a number of tools for assessing problems<br />
and opportunities, identifying participants, and understanding the context of<br />
the geographic, institutional, economic and social setting around which the<br />
project will be designed. This chapter will provide you with general guidelines<br />
for using these tools to assess a project’s operating environment. We will<br />
define diagnostics, their uses in identifying participants, and present some of<br />
the many useful tools used in holistic appraisal including needs assessment,<br />
differentiation/disaggregation, stakeholder analysis, institutional assessments<br />
and gender analysis. Issues and guidelines for incorporating both a<br />
household livelihood security and rights-based approaches into holistic<br />
appraisal are covered throughout the chapter.<br />
Incorporating CARE’s Household Livelihood Security<br />
approach into holistic appraisal<br />
CARE’s holistic approach to determining problems and their underlying<br />
causes, as well as opportunities for program and project activities, is a key<br />
principle of CARE’s Household Livelihood Security framework. An HLS<br />
approach to program planning and project design encourages the use of<br />
secondary data reviews as well as participatory people-centered diagnostic<br />
tools. Participation and empowerment are the basic tenets of the approach.<br />
An HLS Assessment involves taking into account the following components:<br />
Context - What are the social, economic, political, historical, and<br />
demographic trends that influence the livelihood options of a given<br />
population and what are the risks to which they are exposed?<br />
Resources - What are the various assets (financial, physical, social,<br />
human and natural) that households and communities have access to<br />
and how are they differentiated and disaggregated? Vulnerability is<br />
Chapter 2 – Holistic Appraisal<br />
25
Project Design Handbook<br />
26<br />
determined by the risks that households and communities are exposed to<br />
and their ability to use assets or other means to cope with these risks.<br />
Institutions and Organizations - The institutions that operate within a<br />
given context will be critical to sustainable livelihood outcomes. It is<br />
important for CARE and its partners to identify which government, civic<br />
groups and private sector institutions operate in a given livelihood setting<br />
to determine their relative strengths and weaknesses in delivering goods<br />
and services essential to secure livelihoods. The private sector has<br />
usually been left out of such analyses even though it can play a critical<br />
role in providing goods and services. A stakeholder analysis is a critical<br />
first step in any diagnosis<br />
Livelihood Strategies - A Holistic appraisal attempts to identify the<br />
various strategies people use to make a living and how they cope with<br />
stress. These are also referred to as adaptive strategies and coping<br />
strategies in the food security literature. It is important to determine the<br />
variability that may exist across ethnic groups, households and individuals<br />
in the pursuit of different strategies to tailor interventions appropriately.<br />
Livelihood Outcomes - Outcomes are measured to determine how<br />
successful households are in their livelihood strategies. These outcomes<br />
can be based on normative standards (e.g., nutritional status) or be<br />
based on criteria identified by the communities (e.g., wealth ranking).<br />
Such outcome measures often need to be differentiated and<br />
disaggregated across groups (e.g., livelihood category, socio-economic<br />
status), households (e.g., by wealth status, gender of the head of<br />
household) and individuals (e.g., including gender and age).<br />
Incorporating CARE’s Rights Based Approach into<br />
holistic appraisal<br />
Incorporation of a rights-based approach requires the capacity to understand<br />
and take into account vulnerability and marginalization, diagnose power<br />
relations, and incorporate legal, policy and institutional analyses.<br />
Broadening our analytical framework to include all human rights.<br />
Human rights reflect an integral vision of what humanity is and, as such,<br />
represent a comprehensive yardstick for measuring human wellbeing. Even<br />
while CARE focuses on livelihood security conditions (e.g., food, water and<br />
sanitation, nutrition, health, education, and economic opportunity), we have to<br />
consider other conditions affecting livelihood security and, more broadly, life<br />
with dignity (i.e., the enjoyment – or lack thereof – of additional human rights,<br />
such as personal security, freedom of movement, and participation in public<br />
affairs). Such conditions are interdependent. For example, the pursuit of<br />
secure livelihoods is frustrated where members of a certain ethnic group are<br />
physically prevented from getting their goods to market, or women are not<br />
allowed to participate in community health or education associations.<br />
While awareness of major gaps in the enjoyment of human rights may, in<br />
some cases, lead us to focus on new programmatic areas (e.g., domestic
violence or women’s political participation), our “core business” will remain<br />
the advancement of livelihood security (or economic and social rights). In<br />
pursuing our core business, we will better understand the bigger picture<br />
facing the communities we serve, the inter-relationships between different<br />
rights, and the need for collaborative and complementary action with other<br />
organizations focusing on other parts of the human rights spectrum.<br />
Analyzing more deeply underlying and basic causes. CARE is<br />
accustomed to undertaking in-depth causal analysis of why households<br />
behave the way they do. We are less accustomed to (and less equipped for)<br />
analyzing, in a thorough, meaningful way, the political, economic, and sociocultural<br />
systems and relations at all levels that so powerfully influence<br />
household-level conditions. Such analysis is essential for helping us to<br />
understand the limits of more traditional responses (focusing on the more<br />
immediate causes) and to explore the potential for higher impact<br />
interventions.<br />
Efforts are underway to build our capacity to analyze causes and power<br />
dynamics between groups (i.e., relational analysis). Recent efforts to<br />
incorporate greater analytical capacity in gender dynamics may be<br />
instructive. In addition, our commitment to partnership and, more generally,<br />
inter-organizational collaboration holds the promise of fruitful relationships<br />
with groups that conduct research and analysis in just these areas.<br />
2.1 Operating Environment (setting and<br />
context)<br />
As discussed in Chapter 1, project design begins with the identification of<br />
problems or opportunities and their causal linkages. In designing a project,<br />
you identify the needs of participants and communities and then propose<br />
strategies to address those needs. To do this effectively, keep in mind that<br />
problems/opportunities and their solutions are contextual. In other words, the<br />
characteristics of the setting in which livelihoods are conducted are critical to<br />
understanding the nature of the problems and opportunities and designing<br />
appropriate responses.<br />
The setting of a project refers to the social, political, economic and<br />
environmental factors that can influence the nature of a problem and its<br />
underlying causes. A term commonly used for describing the context or<br />
setting of a design is the operating environment (see definition box 5, next<br />
page). The operating environment is like the stage of a play – it is the context<br />
within which people act out their livelihoods. The setting can be with<br />
reference to a particular geographic area or community. Specific elements of<br />
the operating environment will play a more prominent role depending on the<br />
participants.<br />
To illustrate the importance of the operating environment, consider the<br />
following example. Suppose you are involved in the design of an agroforestry<br />
project in a part of your country where you have not worked before. You<br />
Chapter 2 – Holistic Appraisal<br />
27
Project Design Handbook<br />
28<br />
Definition Box 5<br />
What is an Operating Environment?<br />
The operating environment consists of the<br />
characteristics of a setting in which<br />
livelihoods are conducted. It includes the<br />
elements that define the context for a<br />
project and which can have a positive or<br />
negative effect on its success. The key<br />
elements that make up the operating<br />
environment include:<br />
People – demography and human resources:<br />
cultural/ethnic groups, their numbers and<br />
distribution, relationships, ages, gender,<br />
educational levels, occupations, labor pool,<br />
etc.<br />
Environment - vegetation, climate, natural<br />
resources<br />
Public/private Infrastructure - roads,<br />
schools, hospitals, water and sanitation<br />
Beliefs and Practices - religious, cultural,<br />
political, social beliefs<br />
Economics – nature and distribution of<br />
wealth, assets, income, employment<br />
Institutions – policies, governance, projects,<br />
civil society<br />
Definition Box 6<br />
Diagnostics<br />
A systematic set of procedures undertaken<br />
for the purpose of gathering and analyzing<br />
information needed for setting priorities and<br />
making decisions about project or program<br />
direction and allocation of resources.<br />
have recently completed a very successful<br />
agroforestry project in one region and hope<br />
to apply the lessons learned in the new<br />
region. However, the new region is very<br />
different. The only land farmers have<br />
access to consists of steep slopes, there is<br />
no access to irrigation, the government<br />
extension service is much weaker than in<br />
other parts of the country, and the local<br />
government is not actively enforcing recent<br />
government policy giving households land<br />
tenure rights.<br />
The actions needed to study and<br />
understand the operating environment are<br />
not discrete and finite. Rather, they can<br />
include a wide range of research and<br />
analysis that occur throughout the design<br />
process. Depending on circumstances,<br />
much of the information about the operating<br />
environment may be available through<br />
secondary sources. It can also come from<br />
the types of diagnostics and assessments<br />
discussed in this chapter. During the<br />
holistic appraisal, you may discover gaps in<br />
knowledge that require further research.<br />
What is important is that the knowledge you<br />
gain about the operating environment be<br />
accurate and comprehensive.<br />
In Annex 2.1 you will find examples of<br />
outlines or guides to conducting a thorough analysis of the operating<br />
environment for four sectors: small business development, health,<br />
agriculture/natural resource management, and education.<br />
2.2 Diagnostics<br />
In Chapter 1 we reviewed the concept of ‘strategic directions’ that CARE uses<br />
for identifying appropriate project opportunities. The design team draws on<br />
CARE’s vision and programming principles, and strategic and design<br />
frameworks to narrow the project focus and<br />
establish a contextual framework for the<br />
project design process. Holistic appraisal<br />
requires a more in-depth diagnosis to<br />
identify the important factors at work in the<br />
specific context. Diagnostics are<br />
undertaken for the purpose of setting<br />
priorities and making decisions about<br />
project or program direction and the
allocation of resources. The priorities are based on identified needs.<br />
Here we will focus primarily on diagnostic tools influenced by the Household<br />
Livelihood Security approach, including needs assessment, disaggregation<br />
and differentiation, stakeholder analysis, institutional assessment and gender<br />
analysis. We begin with a brief discussion of participants, the identification of<br />
which will result from the use of one or several diagnostic tools. In addition to<br />
these methods, there are many other potentially useful tools for exploring the<br />
existing reality of a given community. Issues Box 8 provides a brief<br />
description of some other commonly used diagnostic tools.<br />
Examples of diagnostic tools<br />
2.2.1 Identifying Participants (Target Population) 10<br />
Participants are specific populations (e.g., individuals, households,<br />
institutions, etc.) that are directly affected by the problem the project seeks to<br />
address and stand to benefit and/or change because of project interventions.<br />
Often participants are identified according to<br />
poverty or livelihood status, or institutional<br />
affiliation. Participants can also be identified<br />
according to geographical area, such as<br />
communities within a forest buffer zone<br />
(Table 3). Identifying participants helps the<br />
design team to develop project focus and<br />
design interventions that facilitate<br />
participation by (or the flow of benefits to) a<br />
Chapter 2 – Holistic Appraisal<br />
Definition Box 7<br />
Participant Group<br />
A population of individuals or institutions<br />
directly affected by a problem and which<br />
might benefit from a proposed intervention.<br />
10 These can also be referred to as intended beneficiaries. The assumption is being made here that these<br />
beneficiaries will actually be enable to participate in project design, implementation, monitoring and<br />
evaluation.<br />
Issues Box 8<br />
Participatory Rural (or Rapid) Assessment (PRA) is based on the idea that communities and<br />
households are quite capable of analyzing their own constraints and arriving at their own<br />
solutions. The external investigator acts as a facilitator to the participatory process.<br />
Benefits-Harms “profile” tools offer a practical way to broaden our analytical framework to<br />
include all human rights, which, for purposes of simplicity, are divided into three categories:<br />
economic and social, political, and security rights.<br />
Stakeholder Analysis is a data collection activity that focuses on the identification and<br />
concerns of key individuals and institutions that have a direct or indirect interest in the project.<br />
It analyzes the social and political interactions of individuals and institutions.<br />
SWOT Analysis uses group brainstorming to determine the internal Strengths and Weaknesses,<br />
and external Opportunities and Threats (or limitations) of a given project idea. Besides being<br />
useful in needs assessment, SWOT analysis is a valuable tool for participatory evaluation.<br />
29
Project Design Handbook<br />
30<br />
Common criteria for selecting participants<br />
Social Institutional Geographical<br />
• Wealth vs. Poverty<br />
• Vulnerability<br />
• Age cohorts<br />
• Gender<br />
• Life style<br />
• Livelihood<br />
• Ethnicity<br />
specific group. Frequently, participants include vulnerable groups, such as<br />
youth, single mothers, unemployed persons, victims of natural disasters,<br />
displaced families, and people with low-paying or low-status jobs.<br />
Participants, then, are the individuals, households and institutions that the<br />
project will serve, also referred to as target groups, clients, beneficiaries, and<br />
primary stakeholders. In conducting an assessment as part of a holistic<br />
appraisal, we generally define a ‘study group,’ a collection of individuals and<br />
institutions that help us to understand the situation and who may or may not<br />
become participants.<br />
It is possible to select participants in a number of ways. Multi-sectoral<br />
assessments are well suited to identifying groups vulnerable to constraints in<br />
meeting basic needs. In addition to the assessment tools summarized in this<br />
chapter, useful approaches to identifying vulnerable groups include rightsbased<br />
analysis, anthropometric measurements, or vulnerability mapping (see<br />
issues box 9 below).<br />
• Government level<br />
• Private Sector<br />
• NGO or CBO<br />
• New or emerging institution<br />
• Specialization (e.g., technical<br />
area)<br />
Issues Box 9<br />
• Urban<br />
• Rural<br />
• Regional Population<br />
• Environment<br />
• Agroecological zone<br />
• Proximity (e.g., time and<br />
distance to services)<br />
Participants must be identified in the context of one or more specific<br />
problems, since virtually every member of a community is vulnerable to<br />
something. Thus, you can investigate who in the community is most<br />
vulnerable in relation to access to a nutritious diet, education, health care,<br />
shelter or whatever other themes are prioritized in the assessment and direct<br />
interventions accordingly. For example, if your assessment reveals that<br />
diarrheal diseases are significant in a community, and that a limited supply of<br />
potable water is a contributing factor, you should find out who in the<br />
community has insufficient access to clean water. It may prove to be a<br />
specific group, such as landless farmers, a particular ethnic group, the<br />
poorest economic strata, widows and single mothers -- or it may be defined<br />
by a geographic area such an urban neighborhood or a watershed area.<br />
CARE’s guiding principles require that projects must work to benefit poor<br />
people. However, it may not always be feasible for the poorest members of a<br />
community to directly participate in a particular intervention. To achieve this,<br />
interventions may target less vulnerable individuals or households that are<br />
likely to participate in and benefit from these interventions. Consider an<br />
agricultural project that aims to introduce soil conservation techniques: the<br />
poorest farmers in a community may not have the resources (e.g., time,
available land) to risk participating in an intervention to train farmers and<br />
establish a demonstration plot. If the new techniques prove successful for<br />
those farmers who do participate, however, the poorest farmers may choose<br />
to participate as well. In this way, the poorest sector of the community may<br />
be identified as indirect project beneficiaries.<br />
Table 3: Examples of Participant Groups<br />
Project<br />
Name<br />
Buffer Zone<br />
Management<br />
Project<br />
HIV/AIDS<br />
Education<br />
Participant Group<br />
(vulnerable to the core<br />
problem(s) the project<br />
could potentially address)<br />
Members of<br />
communities living<br />
within the buffer zone<br />
Inclusion Criteria<br />
(targeted to obtain<br />
relevant and appropriate<br />
benefits of this project)<br />
Households that use<br />
forest resources – to<br />
facilitate use of<br />
alternative resources,<br />
less destructive<br />
methods, shared<br />
ownership and<br />
management, etc.<br />
Adolescents Out-of-school<br />
adolescents – higher<br />
risk of early and<br />
unprotected sex, less<br />
reliably reached by<br />
standard public<br />
health education, less<br />
likely to have<br />
adequate life skills<br />
Study group<br />
(potential respondents and<br />
participants in diagnostic<br />
assessment)<br />
Members of participating<br />
communities<br />
Local authorities<br />
Natural resources<br />
authorities<br />
Unmarried and married<br />
out-of-school adolescents<br />
in participating<br />
communities<br />
Cultural and opinion<br />
leaders, especially youth<br />
leaders<br />
Local authorities<br />
In order to focus project interventions and increase the potential to measure<br />
effect and impact changes, it is important to identify target groups of potential<br />
project participants as clearly as possible. This can be a difficult task.<br />
Boundaries of a population group are often fluid, shifting as people move in<br />
and out of geographic areas or organizations. Households themselves may<br />
shift their economic status or level of vulnerability due to changes in their<br />
resources. Targeting one specific group of participants may lead to the<br />
exclusion of others. A thorough holistic appraisal can assist the project<br />
design team in collecting information needed to identify and select target<br />
groups.<br />
2.2.2 Needs Assessment<br />
A need can be defined as a discrepancy or gap between “what is,” or the<br />
present state of affairs of a target group or area, and “what should be,” or a<br />
desired state of affairs. A needs assessment seeks to identify the gaps,<br />
examine their nature and causes, and suggest priorities for future action. It<br />
often highlights key issues or constraints that, along with consideration of<br />
programmatic principles and strategic objectives, identify the main problems<br />
and opportunities on which the project interventions will focus.<br />
Needs may be categorized in different ways, e.g., by type of person affected,<br />
by nature of need, by level or degree of need, etc. Needs of beneficiaries<br />
include those of farmers, household members, women, children, etc. Needs<br />
Chapter 2 – Holistic Appraisal<br />
Selection reasons<br />
(likely to be able to give<br />
useful diagnostic<br />
information)<br />
Aware of local needs<br />
and patterns of forest<br />
use/off-take (felt<br />
needs)<br />
Responsible for these<br />
communities<br />
Responsible for the<br />
forest area<br />
Aware of local risk<br />
behaviors<br />
Influential<br />
determiners of beliefs<br />
Responsible for the<br />
community<br />
31
Project Design Handbook<br />
32<br />
of service providers and policymakers involve people such as teachers,<br />
parents, health-care workers, merchants, or government. Needs related to<br />
Definition Box 8<br />
Needs Assessment<br />
A specific data collection activity that<br />
focuses on identifying unmet needs of the<br />
project participants. Needs are often<br />
categorized according to felt, relative and<br />
normative. Needs assessment helps identify<br />
the problems and causes the project will<br />
address, the existing local resources and<br />
opportunities for action, and constraints that<br />
have prevented the target population from<br />
solving their problem.<br />
Definition Box 9<br />
Categories of needs<br />
Normative Needs<br />
Professional, expert, or policy judgment<br />
regarding “desirable” conditions based on<br />
national or international standards.<br />
Felt Needs<br />
Needs based on people’s perceptions and<br />
attitudes.<br />
Relative Needs<br />
Need in one area in comparison to the same<br />
need in other communities, locations, or even<br />
points in time.<br />
resources refer to things such as<br />
infrastructure, technology, programs,<br />
working conditions and benefits.<br />
Needs assessment can be an important<br />
tool for targeting vulnerable groups within<br />
the larger community. <strong>By</strong> focusing on such<br />
subsets of a population, you simplify the<br />
causal analysis and are more likely to<br />
identify clear causal linkages. In addition,<br />
by focusing causal analysis and<br />
subsequent project interventions on<br />
particularly vulnerable groups, you are<br />
most likely to achieve significant and<br />
measurable impact.<br />
One caution about using needs assessment: <strong>By</strong> focusing on the needs or<br />
problems of communities and individuals, an unintended yet perverse<br />
consequence is the mistaken perception that the identified needs represent<br />
the complete "picture" of the community or group. Based solely on a needs<br />
perspective, one may conclude that communities, neighborhoods or people<br />
are devoid of the capacities to effectively address their needs. What is often<br />
lacking is a complementary assessment, which identifies the capacities or<br />
assets of people and their community. We need to understand the<br />
perceptions of the community about their most pressing needs, but we also<br />
must assess the ways in which people can make meaningful contributions to<br />
their own development. A methodology that focuses on this approach is<br />
called Appreciative Inquiry. (See references in Bibliography annex.)<br />
2.2.3 Classifying Needs<br />
The degree to which individuals or<br />
communities are in need is based on three<br />
distinct definitions of needs: normative, felt,<br />
and relative.<br />
Normative Needs are based on professional,<br />
expert or policy judgment regarding desirable<br />
conditions. Normative conceptions are value<br />
judgments that change over time as the<br />
values, knowledge and practices of society<br />
change. To define a normative need, policy<br />
statements from experts, usually political or<br />
professional, are used. For example, the<br />
Ministry of Health in a particular country may<br />
state that all individuals should have access<br />
to safe drinking water. Once operational<br />
definitions of “safe water” and “access” have
een determined, this standard becomes the norm against which all drinking<br />
water is compared. If individuals or communities do not have access to<br />
drinking water of that quality, they are considered to be in need.<br />
Felt Needs are what people themselves say they need. Often, the most<br />
accurate way to demonstrate felt needs is by engaging the population in<br />
exploratory processes that reveal more accurately how individuals view their<br />
world. Caution must be taken, however, to ensure that the felt needs<br />
expressed represent the views of the general population or particular<br />
vulnerable group, and not just those of a dominant or vocal group. People’s<br />
statements of needs may be limited or inflated by their personal perceptions<br />
and experience. Some communities, for example, may be reluctant to admit<br />
a need, while others may request a service though it may not address a<br />
normative need and would not be used if it were available.<br />
The tools used to gather these data include focus groups, observation,<br />
interviewing (key informant, conversational, investigative), community<br />
meetings, problem stories, and social dramas or skits. The data generated<br />
by these tools are usually narrative and require carefully structured analysis<br />
and subsequent confirmation by the population. People are capable of<br />
ranking their needs although perceptions may differ according to subpopulations:<br />
by gender, age, ethnicity and status.<br />
Relative Needs compare a project area with other communities, locations or<br />
even other points in time. If individuals or communities with similar<br />
characteristics are not receiving the same services, the lesser served is said<br />
to be in need. Most often, comparative need is relative to socio-economic<br />
status and location, although gender, age, religion, and race can also be<br />
important characteristics. For example, if in one region the vast majority of<br />
households have flush toilets, those that do not are thought to be in need.<br />
On the other hand, people in a poor rural area who do not have piped water<br />
systems might not be considered to be in need of flush toilets<br />
Statistical analyses are commonly used to determine comparative needs. In<br />
the health sector, for instance, mortality and morbidity rates are compared to<br />
identify groups at higher risk for certain diseases so they can be targeted for<br />
specific interventions.<br />
Differentiating between and balancing normative, felt and relative needs can<br />
be a delicate task. A case study is included in Annex 2.2 that describes the<br />
rationale for and results of a needs assessment conducted in a hypothetical<br />
but typical rural community. The material presented illustrates the different<br />
classes of needs and the difficulties you may face in resolving differences<br />
among these three types of needs.<br />
Chapter 2 – Holistic Appraisal<br />
33
Project Design Handbook<br />
34<br />
2.3 Understanding Diversity –<br />
Differentiation and Disaggregation<br />
The purpose of differentiation or sub-dividing populations is to reveal and<br />
understand variations among individuals, households, communities and<br />
institutions. This is a vital process in a holistic appraisal because it helps us<br />
identify degrees of vulnerability for particular individuals or groups. Tools for<br />
exploring diversity can be applied by community members to identify persons<br />
in their community who are the poorest and have the least stable livelihoods.<br />
Understanding diversity in this way helps us to both target better and to<br />
develop more sustainable interventions<br />
Definition Box 10<br />
Differentiation/Disaggregation<br />
Techniques used to identify different socioeconomic<br />
groups within a community based on<br />
a set of criteria; a means by which to identify<br />
a specific target population or audience.<br />
appropriate to specific groups. These<br />
techniques can allow members of<br />
communities to express factors that make<br />
households different from one another, and<br />
thus help everyone to understand the<br />
constraints under which different social<br />
classes live.<br />
Differentiation and disaggregation are used<br />
to assess variation between and within groups specific to the nature of the<br />
problem the project seeks to address. In the case of a project addressing<br />
child malnutrition, for example, the team may need to differentiate groups of<br />
women and children geographically based on their relative proximity to<br />
adequate health care facilities. Note that differentiation techniques are used<br />
in design to categorize groups and make determinations about the<br />
differences among groups.<br />
Some designers prefer the term ‘disaggregation’ when they use participatory<br />
consultation to involve the target group itself in determining the categories of<br />
diversity. In the example of wealth categorization, the first step is consulting<br />
with community members to identify key local characteristics or criteria of<br />
poverty and wealth, which are then used to determine a set of useful<br />
categories appropriate to the local context.<br />
Table 4 (below) displays an example of "Wealth Ranking", a means by which<br />
programmers can disaggregate a community’s households into categories of<br />
very poor, poor, better off, and well to do. Each category is cross-referenced<br />
with an indicator such as food, clothing or education to better define each<br />
category’s characteristics. Without proper differentiation or disaggregation of<br />
data, a program will not be able to maximize its impact on vulnerable<br />
households or individuals because of an unclear definition of its target<br />
population. (This table is a selection of the ranking criteria developed by the<br />
women of Chikhutu, Zambia. See Annex 2.3 for the full set.)<br />
Issues Box 10 shows an alternative to wealth ranking termed "Wealth<br />
Categorization." It is quite similar to wealth ranking, but it simply categorizes<br />
a population by poverty. This may be sufficient, especially when what is<br />
needed is poverty programming and targeting or understanding the dynamics<br />
of wealth and poverty in a particular community.
Chapter 2 – Holistic Appraisal<br />
Table 4: Wealth Ranking example – selection from Livelihood Profiles by Women<br />
Criteria for<br />
ranking<br />
Category 1:<br />
Very poor<br />
Wealth categories<br />
Category 2:<br />
Poor<br />
Livestock None Usually have small<br />
chicken<br />
House<br />
structure<br />
Possessions<br />
(assets)<br />
Live in abandoned house<br />
No kitchen, toilet or<br />
bathroom<br />
Have a clay pot<br />
A few plates<br />
Employment Piecework or casual labor,<br />
e.g., working on someone<br />
else’s farm, pounding maize.<br />
House thatched with<br />
grass<br />
One room to sleep in<br />
No kitchen, toilet or<br />
bathroom<br />
Have two plates<br />
One cooking pot<br />
(small)<br />
Piecework labor<br />
similar to first<br />
category, but more<br />
regular<br />
Wealth categorization - an example from Uganda<br />
Category 3:<br />
Better off<br />
One goat<br />
One chicken<br />
Houses have<br />
kitchen, toilet and<br />
bathroom<br />
Two cooking pots<br />
At least four<br />
mats<br />
Look after house,<br />
e.g., sweeping and<br />
farming<br />
Category 4:<br />
Well-to-do<br />
Usually have cattle,<br />
goats, pigs, chicks,<br />
sheep, pigeons<br />
Roofed with iron sheets<br />
Maintained with cement<br />
Kitchen, bathroom and<br />
toilet<br />
Beds for all the family<br />
Ox –cart, Buckets,<br />
Cupboard, Table, Plates,<br />
Bicycle, Household items<br />
Several workers, and<br />
house servant<br />
CARE Zambia, 1999<br />
Issues Box 10<br />
Wealth is a continuum, but the boundaries of the categories are fuzzy, there are marginal<br />
individuals and households, and there is mobility between categories over time. Instead of<br />
ranking, categorizing a population by wealth or poverty is sometimes sufficient.<br />
The first step is to discuss with community members and identify some of the key local criteria<br />
or characteristics of poverty and wealth. It is important to try to avoid derogatory<br />
classifications, instead choosing terms that are broadly acceptable. For example, one<br />
community in Uganda agreed on a four-fold classification of:<br />
1. "Those who can manage", a euphemism for the relatively wealthy who could look after<br />
their own interests without help from anybody;<br />
2. "Those who have something", i.e., had some small assets, such as a few animals, some<br />
equipment, and an opportunity of developing;<br />
3. "Those who earn slowly", i.e., they had no real capital assets, but struggled on a daily<br />
basis to make ends meet; and<br />
4. "Those who cannot manage" (the opposite of the first group), persons who were<br />
destitute and therefore required external support to survive.<br />
The general characteristics of each social group could then be explored and described. Broad<br />
approximation can be made of the relative proportions of these, either by observation or social<br />
mapping. Further insights can be obtained by individual household analysis, biographies, key<br />
informants, or identifying households with serious problems, e.g., food shortage, lost all their<br />
animals. Adapted from: IIDS 1995<br />
35
Project Design Handbook<br />
36<br />
2.4 Stakeholder Analysis<br />
Definition Box 11<br />
Stakeholder Analysis<br />
An analysis of individuals and/or organizations<br />
that are involved in or may be affected by<br />
project activities.<br />
At an early stage in holistic appraisal, the<br />
design team needs to identify those entities–<br />
local and national government, CBOs<br />
(Community-Based Organizations), utility<br />
organizations, national and international<br />
NGOs (Non-Governmental Organizations,<br />
including CARE), research institutions,<br />
private sector (small and large), donor(s), the<br />
target group itself – that may have something<br />
to gain or lose from the project. These entities are defined as stakeholders:<br />
individuals or institutions with interests in the process and outcomes of<br />
CARE-supported activities and the ability to significantly affect a project,<br />
positively or negatively. Stakeholders may be partners, recipients of project<br />
resources, or organizations that have a vested interest in the outcome of the<br />
project (e.g., donors, local government, etc.)<br />
It is important to identify and understand the relationship between<br />
stakeholders and the proposed project. Some stakeholders will benefit more<br />
than others; key individuals (perhaps representatives of an organization) may<br />
have personal interests at stake. Stakeholder analysis thus aims to identify:<br />
who are the entities with potential interests in the problem the project seeks<br />
to address, what their interests and roles might be, and how to incorporate<br />
strategies into the project design to mitigate conflict or turn potential<br />
situations of conflict into opportunities for collaboration. Looking for<br />
opportunities to build constituencies for what CARE does can create the<br />
weave that enables services to be provided in appropriate ways within<br />
communities.<br />
There are four main steps to conducting a stakeholder analysis: 11<br />
• Identify principal stakeholders.<br />
• Investigate their interests, roles, relative power and capacity to<br />
participate.<br />
• Identify relationships between stakeholders, noting potential for<br />
cooperation or conflict.<br />
• Interpret the findings of the analysis and determine how this will affect<br />
project design and success.<br />
Three sample matrix formats that can be used to help structure a stakeholder<br />
analysis are presented in the tables below. Table 5 can be used to present a<br />
summary profile of stakeholders, their interests and roles relative to project<br />
focus, and relationships with other stakeholders.<br />
11<br />
For further discussion of Stakeholder Analysis refer to: Reitbergen-McCracken and Narayan 1997; IDRC<br />
1998; AusAID 2000.
Table 5: Stakeholder Analysis Profile Matrix<br />
Stakeholder<br />
Interests<br />
in the<br />
project<br />
Effect of<br />
project on<br />
interest(s)<br />
Capacity/motiv<br />
ation to<br />
participate<br />
Relationship with other<br />
stakeholders (partnership<br />
or conflict)?<br />
Key stakeholders can significantly influence or are important to the success<br />
of a project. Influence refers to the degree to which a stakeholder has power<br />
over the project and can therefore facilitate or hinder project interventions.<br />
Importance refers to the degree to which achievement of project goals<br />
depends upon the involvement of a given stakeholder. A simple matrix such<br />
as the one presented in Table 6 can be useful to assess the relative influence<br />
and importance of stakeholder groups. (Place the name of the stakeholder<br />
group in the appropriate cell, depending on its influence on and importance to<br />
the project.)<br />
Table 6: Relative Influence and Importance of Key Stakeholders<br />
Influence of<br />
Stakeholder<br />
Unknown<br />
Low<br />
Moderate<br />
Significant<br />
Highly Influential<br />
Importance of Stakeholder to Project Achievement<br />
Unknown Low Moderate Significant Critical<br />
Importance<br />
When considering a stakeholder’s capacity or motivation to participate in or<br />
otherwise influence the success of a project, it can be useful to develop a<br />
matrix to identify various stakeholders according to the level of their<br />
involvement and the stage of the project cycle during which they would most<br />
likely participate (Table 7).<br />
Table 7: Stakeholder Analysis Participation Matrix<br />
Stage in Project<br />
Planning<br />
Diagnostic<br />
Assessment<br />
Project Design<br />
Implementation<br />
Monitoring<br />
Evaluation<br />
Inform<br />
(one-way<br />
flow)<br />
Consult<br />
(two-way<br />
flow)<br />
Type of Participation<br />
Partnership<br />
(joint involvement; potentially includes coplanning,<br />
decision-making, shared<br />
resources, joint activities)<br />
Chapter 2 – Holistic Appraisal<br />
37
Project Design Handbook<br />
38<br />
These tables also fit with an RBA orientation, in which stakeholder analysis<br />
involves identifying responsibilities that various duty bearers have vis-à-vis<br />
the rights of target beneficiaries. In Table 5, for example, key stakeholders<br />
with a high degree of influence and importance to project success are<br />
potential project partners. Stakeholders with a high degree of influence, but a<br />
limited role relative to project achievement, may be involved through periodic<br />
consultations.<br />
Early in the design stage for a child malnutrition project, for example, the<br />
design team may anticipate forming partnerships with the Ministries of Health<br />
and Agriculture. As the team identifies specific project interventions (see<br />
Chapter 4), however, the team may determine to focus on a health<br />
intervention, thus forming a partnership only with the Ministry of Health, yet<br />
continuing to inform the Ministry of Agriculture through periodic project<br />
updates.<br />
These simple matrix formats can be adapted to include different or additional<br />
information about the main stakeholders. The design team should review<br />
and update the stakeholder analysis throughout project planning, as the<br />
scope of the project becomes more focused and new information becomes<br />
relevant to the planning process.<br />
2.5 Institutional Assessment<br />
Definition Box 12<br />
Institutional Assessment<br />
A group activity to look at the organizational<br />
capacities of CARE and other institutional<br />
stakeholders; processes used to make key<br />
choices on with whom we are likely to seek<br />
collaboration, and how we make decisions<br />
about the respective roles of other<br />
organizations and CARE.<br />
Definition box 13<br />
CARE’s Definition of Partnership<br />
Partnerships are “relationships that result<br />
from putting into practice a set of principles<br />
that create trust and mutual accountability.<br />
Partnerships are based on shared vision,<br />
values, objectives, risk, benefit, control and<br />
learning, as well as joint contribution of<br />
resources. The degree of interdependence is<br />
unique to each relationship, depends on<br />
context, and evolves over time.”<br />
Institutional assessment focuses on an<br />
analysis of internal and external capacities<br />
(human, financial and material) to implement<br />
specific activities and absorb inputs such as<br />
training. It is complementary to stakeholder<br />
analysis, differing in that it focuses more<br />
specifically on the capacity of potential<br />
institutional partners – including CARE – to<br />
collaborate in project implementation, and<br />
possible roles and responsibilities of other<br />
collaborating agencies. For example, during<br />
a holistic appraisal of issues surrounding<br />
child malnutrition, the design team identifies<br />
the local health department as a key<br />
stakeholder and potential project partner.<br />
Therefore, the team elects to conduct a<br />
thorough assessment of the department to<br />
identify particular assets of the agency, or<br />
institutional capacities that may need<br />
strengthening to ensure project achievement.<br />
In this example, the assessment was part of<br />
a holistic appraisal, but in practice, an<br />
institutional assessment may be more<br />
practical once the project strategy becomes<br />
defined, so that it is clear which institutions<br />
need to be considered.
Illustrative Tools and Methods for Institutional Analysis<br />
1) Partnership analysis: How are CARE and its potential partners compatible<br />
in terms of vision, values, mission and capacity? What is the common<br />
ground? Where are the areas of divergence? What is the nature of the<br />
relationship? What are the possibilities for enhancing the relationship? What<br />
are the constraints to making the relationship productive for partners? (See<br />
Issues Box 11 for a discussion of partnering in CARE, and Issues Box 12 for<br />
examples.)<br />
Chapter 2 – Holistic Appraisal<br />
Issues Box 11<br />
CARE and prospective partners<br />
An area of increased exploration within CARE in recent years is the growing range and intensity<br />
of operational relationships with other organizations. Gone are the days when CARE saw itself<br />
primarily doing direct delivery of goods and services to those affected by emergencies. There<br />
are multiple reasons for this, but some of the pre-eminent are:<br />
• CARE increasingly sees its role in programming as one of experimenting with innovative<br />
approaches, developing new models from these, and then promoting their wider replication.<br />
• Replication, scale-up and spread of programs, in order to achieve a more widespread impact,<br />
all require the influencing and cooperation of a wide range of other agencies.<br />
• The achievement of real and lasting benefits to livelihoods is not something that can be<br />
easily achieved by one agency operating alone. It requires building of new and innovative<br />
partnerships, which include governmental, civil society, private sector and donor agencies.<br />
These factors lead CARE to increasingly see its responsibility to learn from, collaborate and to<br />
influence an ever growing variety and number of agencies. This is happening at all levels of<br />
CARE: internationally, regionally, nationally and locally within country contexts. CARE’s new role<br />
is to facilitate partnership, multi-agency collaboration, and the creation of linkages between<br />
community-based and other CSO actors, government and private sector agencies that commonly<br />
have not worked together previously.<br />
The major objectives for CARE’s partnering include:<br />
• Ensure sustainable service delivery capacity;<br />
• Expand the scope and scale of programming;<br />
• Increase impact.<br />
The major partnership principles advocated by CARE include:<br />
• Weave a fabric of sustainability;<br />
• Acknowledge interdependence;<br />
• Build trust;<br />
• Find shared vision, goals, values and interests;<br />
• Honor the range of resources;<br />
• Generate a culture of mutual support;<br />
• Find opportunities for creative synergy;<br />
• Address relationship difficulties as they occur;<br />
• See partnering as a continuous learning process. Adapted from: Stuckey et al, 2000<br />
39
Project Design Handbook<br />
40<br />
Examples: Partnering by CARE<br />
2) Force Field Analysis: How do institutions support program objectives?<br />
How do they represent a resisting factor or barrier to change? What is the<br />
susceptibility to change the institution? What is the potency of the institution<br />
for influencing positive change?<br />
Table 8: Force Field Analysis (Example of a tool)<br />
VISION (Describe desired vision here):<br />
DRIVING FORCES<br />
<br />
(fill in driving forces)<br />
TODAY<br />
(current situation)<br />
<br />
<br />
RESTRAINING<br />
FORCES<br />
(fill in restraining forces)<br />
Issues Box 12<br />
One example of CARE’s partnership relationships is the Strengthening Capacities for<br />
Transforming Relationships and Exercising Rights (SCAPE) project in South Africa. South<br />
Africa is a country of multiple institutions, but often with limited capacity and limited scope to<br />
their activities, whether in the complex three-tiered government structure or in civil society.<br />
All are struggling to adapt after the coming of a democratic government in 1994, which resulted<br />
in the country’s non-white population gaining rights it lacked previously, but where old attitudes<br />
and practices hinder the evolution of more empowering development approaches. In this<br />
situation, people are not enabled to gain confidence and understanding of how to exercise their<br />
new rights and benefit their livelihoods. This applies equally to local communities, civil society<br />
organizations working with them, and to local government, all of which retain an expectation that<br />
resources and solutions will be provided centrally. Accordingly, the CARE South Africa office<br />
has been developing and piloting a program that works with multiple partners in furthering the<br />
transformation of both the horizontal and vertical relationships that affect the nature and<br />
effectiveness of local development policies.<br />
More commonly, many CARE country offices are working in partnership with Municipal<br />
Governments. For example, in Latin America, both CARE Bolivia and CARE Honduras have been<br />
working with Municipal Governments in their project areas, focusing on strengthening planning<br />
and service delivery. One of the key findings from a recent evaluation of the program in Bolivia<br />
was that Municipal partners are very effective institutions to promote HLS programming. This<br />
is because these institutions are holistic in their service delivery. Similarly, in Southern Africa,<br />
urban livelihood programs have established successful partnerships with municipal authorities in<br />
Zambia, Madagascar, Mozambique and Angola. Stuckey et al 2000<br />
VISION<br />
GAPS<br />
(missing elements of<br />
desired vision)<br />
To achieve change towards a goal or vision three steps are required:<br />
• First, an organization has to unfreeze the driving and restraining forces<br />
that hold it in a state of quasi-equilibrium.
• Second, an imbalance is introduced to<br />
the forces to enable the change to take<br />
place. This can be achieved by<br />
increasing the drivers, reducing the<br />
restraints or both.<br />
• Third, once the change is completed<br />
the forces are brought back into quasiequilibrium<br />
and refrozen.<br />
3) Trends analysis and historical timelines:<br />
Who are the key groups or institutions<br />
that have influenced the issues<br />
problems or opportunities) over time?<br />
What are their relationships with the target population, and how have they<br />
changed over time?<br />
4) Institutional Mapping: Who are the organizations involved in addressing<br />
key issues and problems? What do they do? Where do they work? How<br />
do they interact with the target population? Where are the overlaps?<br />
Where are the gaps? What are the strengths and weaknesses of the<br />
institutions? What are the organizational profiles/typologies?<br />
5) Venn diagrams: How do program participants/target groups interact with<br />
organizations and institutions? How do the organizations work together?<br />
Identify subsets of organizations. What is the relative importance of these<br />
associations? How are these associations linked? What is their value and<br />
importance to the target population and their livelihoods? What is the level<br />
of access? What are the constraints to access and participation?<br />
Institutional Assessment: A Rights-Based Approach<br />
Chapter 2 – Holistic Appraisal<br />
Definition Box 14<br />
Force field analysis<br />
Force field analysis is used in change<br />
management to help understand most change<br />
processes in organizations. In force field<br />
analysis, change is characterized as a state of<br />
imbalance between driving forces (e.g., new<br />
personnel, changing markets, new technology)<br />
and restraining forces (e.g., individuals’ fear<br />
of failure, organizational inertia).<br />
Issues Box 13<br />
To broaden our assessment of institutions and their relations to rights realization, we need to<br />
assess and consider what other actors are doing, at different levels, in relation to conditions on<br />
the ground. The HLS assessment process includes an institutional mapping component, which<br />
focuses on mapping the activities and long-range plans of other institutions working in the area<br />
in order to determine CARE’s role/comparative advantage. Under RBA, institutional mapping<br />
would be expanded to include a broader range of responsible actors (covering the wider<br />
spectrum of rights issues) and to identify how such actors advance or impede rights realization<br />
for the target population. The assessment would also need to include a component that helps us<br />
understand local perceptions of the legitimacy and/or value of these institutions. The<br />
institutional assessment process will become critical as RBA inherently calls for working in<br />
coalitions, networks, etc. and for engaging in advocacy vis-à-vis key responsible actors.<br />
41
Project Design Handbook<br />
42<br />
Gender analysis tools<br />
2.6 Gender Analysis<br />
Gender analysis focuses on identifying and understanding different gender<br />
roles, rights and responsibilities. It seeks to better understand women’s<br />
needs and roles in relation to men’s, and to their social, cultural, political and<br />
economic context, acknowledging that neither women nor men are<br />
homogenous groups. Gender analysis considers the roles, rights, and<br />
responsibilities of both men and women in all aspects of their lives, e.g.,<br />
production, reproduction, management of household and community<br />
activities, and access to community resources. In project design, gender<br />
analysis helps us to 1) identify gender-based differences in access to<br />
resources to determine how different members of households will participate<br />
in and be affected by project interventions, 2) incorporate gender equity and<br />
empowerment into the project design process and subsequent goals and<br />
interventions.<br />
Issues Box 14<br />
Resource Access Assessment. This participatory technique provides insights into how access<br />
to and control of domestic and community resources varies according to gender. Simple<br />
activities can be adapted for use in various professional and cultural contexts, drawing on the<br />
daily experience of participants. One particular gender analysis technique used three large<br />
drawings of a man, a woman and a couple, and a set of cards depicting different resources and<br />
assets owned by people in a community (e.g., house, land, animals, farm implements). Participants<br />
then assign the resources to the man, woman or couple, depending on the patterns of ownership<br />
(as distinct from use) in their community (Rietbergen-McCracken and Narayan 1997).<br />
Activities Profile. Also known as Analysis of Tasks, this is a gender analysis tool that raises<br />
awareness of the distribution of domestic, market and community activities according to gender.<br />
An activities profile solicits information essential to the planning of effective project<br />
interventions, allowing project designers to identify the degree of role flexibility associated<br />
with different activities and participants’ allocation of time to existing tasks. World Bank 1996<br />
Because gender planning is part of the overall project design process, the<br />
composition of the planning team, the timing and approach of the holistic<br />
appraisal, and the integration of gender concerns into the identification of<br />
causal linkages, the development of project goals and interventions, and<br />
monitoring and evaluation are all critical to project achievement.<br />
Each of the diagnostics described in this chapter can be useful in conducting<br />
a gender analysis. Needs assessment, for example, can be used to<br />
understand how the needs of women differ from those of men. Table 4 (page<br />
35) earlier in this chapter shows how wealth ranking can be used by village<br />
women’s groups to disaggregate households. Issues Box 14 summarizes<br />
two additional tools useful in gender analysis, resource access assessment<br />
and activities profile. Gender analysis techniques can be used as group<br />
activities involving both women and men. For women to feel comfortable
expressing themselves openly, in many design contexts it will be preferable–<br />
or perhaps even necessary – for men and women to meet separately.<br />
2.7 Breadth versus Depth<br />
Holistic appraisal is an exploratory phase of project design. Also called<br />
diagnostic assessment, it is a process often undertaken during initial design<br />
activities. Its primary purpose is to understand the range of constraints,<br />
needs, problems, opportunities, etc. that are present in a defined group or<br />
area. Our initial work, then, in the holistic appraisal stage, is to gain a general<br />
understanding of individuals, households and communities. In the diagram<br />
below (figure 6), the horizontal line labeled ‘breadth’ illustrates this initial<br />
work.<br />
Figure 6: Breadth versus Depth of Diagnosis and Design<br />
Diagnostics<br />
(problem identification)<br />
Design<br />
(analysis)<br />
Diagnostic work explores the breadth of problems and<br />
opportunities and looks for synergistic relationships.<br />
In project design,<br />
we are exploring<br />
the depth of causal<br />
relationships using<br />
identified problems<br />
and target groups.<br />
DEPTH<br />
Later in the design process, we will focus in on a narrower range of issues<br />
and seek to understand these issues in much more depth. There is rarely<br />
enough understanding of an issue after one round of assessment to design a<br />
good project. It is usually necessary to focus in on a sub-set of issues, and<br />
then conduct more research (i.e., secondary literature reviews, further<br />
assessment work) to gain a fuller understanding of the livelihood and rights<br />
issues.<br />
Chapter 2 – Holistic Appraisal<br />
BREADTH<br />
43
Project Design Handbook<br />
44<br />
2.8 Sequencing of Activities<br />
A successful holistic appraisal relies upon the ability of the project design<br />
team to choose and adapt existing tools (or develop new ones) that are most<br />
appropriate to the particular context of the project design. The methods<br />
described above comprise a number of techniques designed to collect,<br />
understand and exchange information. A brief description of these and other<br />
tools and terminology used in holistic appraisal is presented in Annex 2.4.<br />
In conducting a holistic appraisal, the exact sequencing of assessment and<br />
diagnosis will vary depending on the objectives of the analysis and<br />
information requirements. The sequence of a full-blown HLS Assessment,<br />
presented below in Issues Box 15, can provide guidance for a project design<br />
team. 12 Remember, it may not be cost-effective to conduct such a thorough,<br />
holistic diagnosis assessment for a single project. However, it is<br />
recommended for determining the strategic directions of a long-term,<br />
comprehensive area program. This information can be subsequently used to<br />
guide the design of a number of projects focused on specific problems faced<br />
by communities in that area.<br />
An example of a sequenced approach for participatory livelihood<br />
assessments in Malawi is displayed in Table 9 on page 46.<br />
12 These are laid out in much greater detail in several other resources. See: Frankenberger and McCaston<br />
1999; Maxwell and Rutahakana 1997; and Pareja 1997.
Steps of a full-blown Household Livelihood Security Assessment<br />
Chapter 2 – Holistic Appraisal<br />
Issues Box 15<br />
• Objective setting Clear objectives are fundamental to keeping the entire diagnosis process<br />
on track.<br />
• Review of existing information A comprehensive review of existing information from<br />
secondary sources and an assessment of its validity, reliability, and comprehensiveness set<br />
the parameters for primary information collection.<br />
• Identification of major issues for field data collection Where there are gaps in existing<br />
information, tools for gathering this information have to be designed.<br />
• Stakeholder validation of conclusions from secondary information and gaps Prior to<br />
investing time and resources in field data collection, experience shows it is useful to validate<br />
preliminary conclusions emerging from the secondary information. Stakeholders to contact<br />
include representatives of communities where activities may take place, members of partner<br />
organizations that may be involved in diagnosis, design and implementation, local authorities,<br />
and other organizations or research institutes that may have experience or information.<br />
• Site selection Locations for field data collection must reasonably represent locations where<br />
programs will be implemented, but can rarely be statistically representative due to resource<br />
restrictions. Therefore, careful thought must go into purposive selection of sites, and the<br />
number of sites must be adequate to capture the breadth of variation in livelihood systems,<br />
constraints and sources of vulnerability.<br />
• Community preparation The quality of information gathered is only as good as the quality of<br />
response from groups participating in the information collection, so good communication with<br />
communities is the sites selected is critical. Likewise, it is important to inform communities<br />
that projects or “aid” may not necessarily follow immediately (or ever).<br />
• Field team training Often field teams include staff from partner organizations or local<br />
government, representing multi-disciplinary viewpoints and expertise. Incorporating HLS<br />
concepts and rigorous field methods into a mixed team is a challenge that needs to be<br />
allocated adequate amounts of time. This is also a good time for pretesting tools/methods.<br />
• Field data collection/entry/analysis iteration Capturing information, organizing it and<br />
making it retrievable (and backed up!), and beginning to synthesize findings, is all part of<br />
fieldwork. In general, at least a day for these activities is required for every day of actual<br />
information collection, and is best built into an iterative process, rather than lumping<br />
information collection and entry/analysis into separate activities and timeframes.<br />
• Analysis and design workshops Refinement and synthesis of information, identification of<br />
problems and causal linkages, and selection of strategically focused interventions, usually<br />
occur in design workshops that follow the field exercise. (These stages of the project<br />
design process will be covered in detail in Chapters 3 and 4 of this Handbook.) Often times,<br />
multiple stakeholders including community representatives are involved in this process. Once<br />
a set of intervention themes has been identified, these are subjected to a series of analyses<br />
to determine the key leverage points for follow-up project design. These selected themes<br />
are reviewed with the community to determine if they are valid community priorities.<br />
45
Project Design Handbook<br />
46<br />
Table 9: Example - Methods Used And Key Information Collected in Malawi<br />
Level of Analysis Methods Key Information Collected<br />
Community level<br />
environmental and<br />
economic analysis<br />
Household level<br />
social analysis<br />
Problem<br />
prioritization,<br />
analysis and<br />
opportunity<br />
identification<br />
(synthesis)<br />
i) Resource mapping<br />
and focus group<br />
discussions around<br />
resource map<br />
ii) Historical time line<br />
iii) Seasonality<br />
calendars<br />
iv) Venn diagramming<br />
v) Matrix ranking<br />
i) Identification of<br />
livelihood indicators<br />
ii) Identification of<br />
livelihood<br />
categories<br />
iii) Livelihood category<br />
profiles<br />
iv) Social mapping<br />
v) Case study and<br />
household<br />
interviews<br />
i) Problem<br />
identification<br />
analysis.<br />
ii) Cause – effect<br />
analysis<br />
iii) Opportunity<br />
analysis<br />
• Infrastructure, key services, land use,<br />
farming systems, land tenure, natural<br />
resource base, availability, access, quality,<br />
and historical changes.<br />
• Historical analysis, changes over time,<br />
trends, past efforts.<br />
• Seasonal farming activities, income,<br />
expenditure, stress periods, coping and<br />
adaptive strategies.<br />
• Institutional identification, operation,<br />
interaction, level of service, performance.<br />
• Economic activities, priorities,<br />
performance, trends, gender.<br />
• Economic, social, and environmental criteria<br />
used for classifying households by<br />
wellbeing.<br />
• Difference by gender.<br />
• Location and names of households<br />
• Proportional livelihood status<br />
• Vulnerability, shocks, stress, coping and<br />
adaptive behavior.<br />
• Potential opportunities.<br />
• Validation.<br />
• Prioritized problems by gender.<br />
• Problem linkages, causes and effects.<br />
• Previous efforts, successes, failures.<br />
• Roles and responsibilities.<br />
• Potential opportunities and strategies.<br />
Malawi Participatory Livelihood Assessment, July 1998.
Chapter 2 Review: Holistic Appraisal<br />
Chapter 2 – Holistic Appraisal<br />
Key concepts Focus questions Notes<br />
2.1 Establishing the<br />
operating environment<br />
for your project design<br />
2.2 Diagnostic tools for<br />
holistic appraisal<br />
2.2.2 Needs Assessment<br />
2.3 Understanding Diversity<br />
(Differentiation/<br />
Disaggregation)<br />
2.4 Stakeholder analysis<br />
2.5 Institutional assessment<br />
2.6 Gender analysis<br />
2.7 Breadth vs. Depth<br />
2.8 Sequencing activities<br />
for holistic appraisal<br />
• Have you considered the context<br />
in which your project will be set?<br />
• What factors will be important to<br />
assess in the holistic appraisal<br />
stage?<br />
• Following your review of available<br />
secondary data, what diagnostic<br />
tools will be most appropriate to<br />
holistic appraisal?<br />
• Have you clearly defined the<br />
project target group?<br />
• Have you determined which tools<br />
will provide you with the<br />
information you need to<br />
understand:<br />
– The "needs" of the target<br />
group;<br />
– Appropriate categories for<br />
disaggregating information;<br />
– The relative importance and<br />
influence of various<br />
stakeholders;<br />
– Opportunities for collaboration<br />
or potential for conflict with<br />
stakeholders;<br />
– Institutional capacities of<br />
partners or target groups;<br />
– Gender-based differences<br />
affecting project interventions?<br />
• Have you developed a logical<br />
sequence for the assessment,<br />
based on the objectives of the<br />
analysis?<br />
47
Project Design Handbook<br />
48<br />
Reflective<br />
practice<br />
Chapter 3<br />
Analysis & Synthesis Techniques in Design<br />
Holistic<br />
appraisal<br />
Coherent information<br />
systems<br />
Systems Perspective<br />
Logic of Cause and Effect<br />
Using Cause and Effect in Project Design<br />
Hierarchical Causal Analysis<br />
Methods of Causal Analysis<br />
Analysis &<br />
Synthesis<br />
Focused<br />
strategy<br />
Chapter 3 provides guidance on synthesis techniques used to<br />
organize information collected during the holistic appraisal. Here<br />
we define Causal Analysis and discuss methods for applying<br />
Causal Analysis in project design.
Chapter 3: Analysis and Synthesis<br />
The analysis and synthesis stage of project design is used for organizing<br />
information collected during the holistic diagnostic assessment stage and<br />
extracting meaning from this information. We often have more information<br />
than we can reasonably assimilate using summary techniques. Therefore,<br />
we need tools to help us to organize information.<br />
The holistic appraisal stage of design identified a set of constraints (we can<br />
also refer to these as problems or needs) of varying complexity and<br />
importance relative to a defined geographical area and population.<br />
Developing a strategy to eliminate constraints of realized possibilities requires<br />
an in-depth knowledge about the underlying causal factors that lead to an<br />
analysis of the problem. One of the tools we have for exploring causal<br />
relationships is called Cause-and-Effect Analysis, and it is a commonly used<br />
tool in project design. You may also hear it referred to as simply Causal<br />
Analysis or Problem Analysis or Logic Modeling.<br />
Causal Analysis is based on cause-effect relationships. Cause and effect<br />
has its roots in the physical sciences. Laws of physics, for example, dictate<br />
that nothing happens by accident, that something causes something else to<br />
happen, and that what happens in the beginning determines what happens at<br />
a later point in time. These notions of cause-effect are periodically<br />
challenged in the social sciences. In other fields, researchers can establish<br />
cause-effect relationships (or at least strong correlative relationships) using<br />
statistical probability -- for example, that smoking is a major causal factor in a<br />
high percentage of lung cancer cases, or that hydrocarbon emissions from<br />
automobiles are a causal factor of airborne particulates that result in smog in<br />
major cities. When working with social systems, as we do in the development<br />
field, we often do not have the luxury of clear statistical rigor. Nevertheless,<br />
causal analysis based on cause-effect relationships is still one of the best<br />
tools we have for systematically exploring events or factors that lead to a<br />
problem or opportunity.<br />
In design, Causal Analysis normally does not<br />
refer to rigorous methods of mathematical<br />
causal path analysis but, rather, consists<br />
largely of qualitative procedures. A logical<br />
cause-effect stream is established which<br />
illustrates, to the best of our ability, the<br />
relationships among behaviors, conditions,<br />
and problems. In this way, Causal Analysis<br />
is used to discover factors that lead to<br />
constraints and to bring project designers<br />
closer to the real needs of target populations.<br />
Causal Analysis<br />
Chapter 3 – Analysis & Synthesis<br />
Definition Box 15<br />
Causal Analysis is a systematic process used<br />
to determine causes and consequences of a<br />
problem and to link them based on cause<br />
effect relationships.<br />
49
Project Design Handbook<br />
50<br />
Causal Analysis Tools<br />
3.1 Systems Perspective<br />
Needs do not exist in a vacuum. Needs are contextual, which is why we start<br />
the design process by conducting a holistic appraisal and exploring, for<br />
example, the Operating Environment. Needs exist within systems, whether<br />
educational, social, political, familial, governmental, or business. Thus,<br />
anything that affects one part of the system also interacts with other parts of<br />
the system. The causal analysis that we do for project design reflects this<br />
systems thinking, and the livelihood framework used in our holistic appraisal<br />
promotes a systems perspective by looking at needs across multiple sectors.<br />
Issues Box 16 summarizes the strengths and limitations of the Causal<br />
Analysis tool applied to project design.<br />
3.1.1 The Pareto Principle<br />
Another concept we need to keep in mind as we explore causal analysis is<br />
called the Pareto Principle, which states that only a few causal streams that<br />
lead to a problem are responsible for the bulk of the problem (Juran and<br />
Gryna, 1988). You often hear statements like “90% of repeated violent<br />
crimes are caused by 5% of the population,” or “80% of the yield reduction is<br />
caused by two major plant pests.” This<br />
Definition Box 16<br />
Causal Streams<br />
A sequence of conditions or factors, linked by<br />
cause-effect logic, that contributes to a predefined<br />
problem. Can also be referred to as<br />
cause-effect linkages.<br />
Issues Box 16<br />
What the tools do well…<br />
Improves our analysis of constraints and causal linkages, at both the program and<br />
project levels.<br />
Advances the interaction among practitioners in the analysis of constraints.<br />
Provides a starting point to select appropriate effect and impact level indicators.<br />
When done at the program level, provides us with a base to develop further assessment<br />
for project design.<br />
Facilitates data analysis from exploratory assessment.<br />
What needs more understanding…<br />
Analysis of cross-causal linkages.<br />
Relative contribution of different causal streams.<br />
Linkage/complementarity/use with capacities and opportunities, prioritizing leverage<br />
points for influencing sustainable change.<br />
principle is well established in fields such as<br />
manufacturing and assembly, administrative<br />
and support services, and marketing. It is<br />
also relevant to development and social<br />
systems, and reminds us to assure that the<br />
most critical pathways are identified during<br />
design. See example below from agriculture<br />
(Issues Box 17).
Causal analysis example using the Pareto Principle in the agriculture sector<br />
3.2 Logic of Cause and Effect<br />
Causal analysis helps organize the many<br />
concerns and needs identified in a community<br />
into a logical hierarchy of cause-and-effect<br />
relationships. However, what exactly do<br />
cause and effect mean? Consider a<br />
particular “problem” you have encountered<br />
(say, dangerous driving conditions on city<br />
streets), and then ask yourself, what the most<br />
influential factors are that most directly lead<br />
to that problem. Likely answers might include<br />
too many vehicles, roads in poor condition, or<br />
a lack of streetlights and other safety<br />
features. These are the 'causes' leading to<br />
the problem of dangerous driving conditions.<br />
Each cause identified above is in turn the<br />
“effect” portion of another cause-and-effect<br />
relationship. For example, what might lead to<br />
the condition “too many vehicles,” which was<br />
identified as a direct cause of the problem? A<br />
logical answer (i.e., the cause in this causeeffect<br />
relationship) would be a lack of public<br />
transit. This condition – a lack of public<br />
transit – is in turn the effect of specific<br />
causes, which may in turn be the effects of<br />
other causes. The result is a sequence or<br />
stream of conditions or factors that lead to the core problem. Figure 7 offers<br />
two sample causal streams that further illustrate this cause-effect logic for<br />
high HIV infection rates and decreasing family farm incomes. For some<br />
people, developing (or following) a pathway of events is quite difficult. This<br />
may be a result of inexperience with relational thinking beyond a one-step<br />
process. It may also happen because the causes of many problems are quite<br />
complex and require more than a singular, linear causal stream to adequately<br />
analyze them.<br />
Chapter 3 – Analysis & Synthesis<br />
Figure 7: Two Causal Stream Examples<br />
High rates of<br />
HIV/AIDS Infection<br />
Exchange of bodily<br />
fluid (implied<br />
condition)<br />
People engage in<br />
unsafe sex practices<br />
Problem Low Farm Family<br />
Income<br />
Cause Declining Crop Yields<br />
Cause Severe Soil Erosion<br />
Condom use is limited Cause Farmers use<br />
improper plowing<br />
techniques<br />
People think that<br />
condom use is<br />
sacrilegious<br />
Condom use has<br />
negative cultural<br />
connotations<br />
Issues Box 17<br />
In Country X, the problem of decreasing farm family income was investigated through the use of<br />
a survey of 100 households. 65 households mentioned the primary cause as the lack of<br />
resources (access to land, irrigation, inputs) to support production, 20 households mentioned<br />
lack of access to markets to sell their goods, and 15 identified their lack of knowledge of<br />
improved farming practices as the primary cause of a decreasing farm family income.<br />
Cause Farmers unaware of<br />
benefits of contour<br />
plowing<br />
Cause No access to<br />
extension services<br />
or information<br />
51
Project Design Handbook<br />
52<br />
3.3 Using Cause and Effect Logic in Project<br />
Design<br />
Definition Box 17<br />
Problem<br />
A condition or set of conditions that affect<br />
people in a negative way (e.g., death,<br />
infectious diseases, poverty, low income, low<br />
agricultural production, inadequate housing).<br />
Underlying Causes<br />
Major causes of problems that are often the<br />
effects of other causes and must be defined<br />
during the synthesis stage of design.<br />
The first step in developing a causal analysis<br />
in project design is to identify the problem that<br />
the project will address. The objective here is<br />
to use cause-and-effect logic relative to a predefined<br />
problem, since the causal logic is<br />
always relative to a particular problem, which<br />
leads to other effects, also termed<br />
consequences. If you change the core<br />
problem, then the causal analysis will also<br />
change. Of course, local social, political and<br />
economic conditions will partly determine the<br />
identification of the project’s focus, however<br />
other factors will also influence it.<br />
Problems are selected based primarily on such criteria as:<br />
The degree to which resolution of the problem (or seizing of the<br />
opportunity) will result in a fundamental change in the lives of the<br />
target group<br />
The significance and scope of the problem (i.e., the degree to which<br />
society considers it a serious problem and the number of people it<br />
impacts);<br />
The identification by the affected community that this is a priority<br />
problem;<br />
The organization’s programming principles;<br />
The organization’s comparative advantage (ability to address the<br />
problem);<br />
The interests of donors and the opportunity for resources.<br />
The process of defining the problem in the project design phase in most<br />
cases will begin at a very general level. For instance, a holistic appraisal is<br />
often conducted with the rather generic “problem” of low livelihood security in<br />
mind, and data is collected around basic needs, access to resources, and<br />
other factors associated with livelihood security. An initial cause-effect<br />
analysis can be conducted with the problem defined as low livelihood security<br />
and the result will be an understanding of the major causes of low livelihood<br />
security. As mentioned above, these major causes are often too broad for a<br />
single project, and are themselves the effects of other underlying causes.<br />
The project design team will need to clarify these underlying causes before<br />
going further in the project design process, as the suitable focus for a project<br />
is more likely to be found at this level in the causal stream. Thus, causal<br />
analysis should be an iterative and on-going process through the life of the<br />
project to continuously ensure proper project focus.<br />
Causal analysis is a fundamental tool for building the central logic of any<br />
project design. The primary reason for carrying out a causal analysis is to<br />
develop a hierarchical relationship between causes and effects identified
through the holistic appraisal. Causal analysis allows us to assess the<br />
relative contributions of causal streams to the problem and therefore select<br />
factors to address through project interventions. Other reasons to use causal<br />
analysis in project design include:<br />
Selection of appropriate effect and impact indicators;<br />
Exploration of multiple causal interactions (synergy);<br />
Mobilizing “buy-in” to a project design for staff, partners, community<br />
participants, donors, etc.<br />
3.4 Hierarchical Causal Analysis<br />
Causal Analysis describes a set of complex relationships among system<br />
variables in a hierarchical manner. In most cases, the sequence of causes in<br />
a causal stream fall in the following hierarchy:<br />
• The direct causes of the problem are often specific physical or social<br />
conditions;<br />
• These conditions, in turn, are typically ‘caused’ by human behaviors<br />
or by systemic shortcomings;<br />
• Systemic shortcomings might be caused by low institutional<br />
capacities, or underlying power dynamics (e.g., duty bearers who<br />
have control);<br />
• Human behavior is determined primarily by people’s knowledge,<br />
attitudes and beliefs (although there can be conditions that<br />
themselves influence behavior); and<br />
• People’s knowledge, attitudes and beliefs have their roots in the<br />
context or the environment in which the target area is found.<br />
Figure 8 illustrates the causal hierarchy.<br />
Note that this is generic and illustrative only.<br />
Most causal analyses are much more<br />
detailed, and thus more complex. The<br />
figure, though, illustrates the primary<br />
relationships found in hierarchical causal<br />
analysis. There are specific reasons in<br />
project design that we model our causeeffect<br />
logic using a hierarchical analysis, as<br />
we will see later in this chapter.<br />
The higher-level consequences of a problem<br />
in the hierarchy are the result of the problem,<br />
and are based on the same cause-effect<br />
Chapter 3 – Analysis & Synthesis<br />
Definition Box 18<br />
Consequences<br />
Social, political, or economic conditions that<br />
result from a problem. A cause-effect linkage<br />
where the consequence is the effect and the<br />
problem is the cause.<br />
Conditions<br />
Factors that exist in the household,<br />
community, or external environment which<br />
contribute to a problem.<br />
logic as the conditions and other causes. If a project makes a significant<br />
contribution towards resolving the problem that it addressed then the<br />
consequences will themselves change.<br />
Conditions are identified as direct causes of the problem, and frequently exist<br />
because of certain human behaviors or gaps in necessary systems. For<br />
example, the condition whereby water is contaminated by human waste could<br />
be caused either by a negative human behavior such as failure to use<br />
53
Project Design Handbook<br />
54<br />
latrines, or by a system shortcoming such as a lack of a municipal sewage<br />
treatment facility.<br />
Figure 8: Hierarchical Causal Tree<br />
CONDITION (BROAD)<br />
ATTITUDE<br />
BEHAVIOR<br />
CONSEQUENCE<br />
KNOWLEDGE<br />
PROBLEM<br />
CONDITION (BROAD)<br />
CONDITION (SPECIFIC) CONDITION (SPECIFIC)<br />
CONDITION (SYSTEMIC)<br />
SYSTEMIC<br />
CAPACITY<br />
general social, cultural, & political factors<br />
PUBLIC<br />
POLICY<br />
Human behavior is based primarily on our knowledge, beliefs and attitudes.<br />
As human behavior often contradicts them, we must be careful to distinguish<br />
between stated and implicit beliefs. Thus, the next level of cause in the<br />
causal analysis hierarchy describes what is causing the targeted human<br />
behavior. The findings may show reluctance of nursing mothers in a specific<br />
community to eat foods high in protein – a gender-linked behavior usually<br />
based on cultural beliefs, gender roles and rights, and perhaps a lack of<br />
knowledge of good nutrition.<br />
Finally, you should examine the external environment for basic factors that<br />
influence or lead directly to causes at each level in the hierarchy. For<br />
instance, a dominant religion can be a factor in the cultural environment that<br />
leads to specific beliefs or attitudes. Government policies or the availability of<br />
resources can cause shortcomings in certain basic services or systems.<br />
Project design must take these factors into account.<br />
Recognize that behavior (and attitudes and beliefs) also applies to duty<br />
bearers, persons in power who have influence over institutions and systemic<br />
structures. These have a great deal of influence over the fulfillment of<br />
people’s rights. Whether constraints at these levels should be addressed<br />
specifically by projects or broader program strategies, they should not be<br />
ignored, for often the underlying causes of problems (denial of rights) can be<br />
traced to these sources.
Incorporating a Rights-Based Approach into synthesis techniques<br />
3.4.1 Phrasing Problems, Causes and Consequences<br />
There are a few simple rules for the proper phrasing of problem, cause and<br />
consequence statements. To write the problem statement, first determine the<br />
condition the project is intended to address. This is the “what” of the problem<br />
statement. Next, identify the population affected by the condition. This is the<br />
“who” of the problem statement and is sometimes referred to as the target<br />
population. Finally, state the area or location of the population. This<br />
describes “where” the problem occurs. The following are examples of<br />
problem statements.<br />
• High mortality in children under five living in Jalapa District.<br />
• Dehydration in children living in Western Nepal.<br />
• Low nutritional status of small farm households in Dangriga.<br />
• Low income for small-business women living in peri-urban areas<br />
of Guatemala.<br />
Chapter 3 – Analysis & Synthesis<br />
Issues Box 18<br />
Holistic appraisal sets the stage for synthesis leading to program design. Put simply, a rightsbased<br />
approach focuses us on those most severely affected by discrimination, exploitation, and<br />
neglect, on the inter-related roots of their predicaments, and on how different actors are or<br />
are not living up to their responsibilities for addressing human suffering and poverty.<br />
Targeting the key leverage points or factors which, if not addressed, will impede<br />
significant, lasting impact. A core principle of a rights-based approach is the focus on the<br />
roots of poverty. Addressing underlying or basic causes means going beyond addressing<br />
immediate causes of livelihood insecurity. For example, instead of solely working to improve<br />
farm production, CARE may need to promote pro-poor agricultural policies. To some extent,<br />
addressing basic causes of livelihood insecurity implies addressing areas that previously fell into<br />
the “assumptions” column in program design, particularly the policy dimensions of poverty’s<br />
roots. These assumptions have sometimes been viewed as out of CARE’s control or too political<br />
in nature. However, with a rights-based approach, no fundamental causes or “drivers” of<br />
livelihood insecurity should automatically be “assumed away” as too political, sensitive, or<br />
complex for CARE. In fact, if our analysis shows that a certain cause is a critical leverage point,<br />
we should carefully assess opportunities for and potential risks of addressing it at different<br />
levels. We should not necessarily take direct action. In some cases, we should assume a purely<br />
indirect and discreet role of mobilizing or facilitating action by those who have stronger<br />
mandates and/or greater resources to address the situation.<br />
The causal-responsibility analysis tool developed by CARE’s Human Rights Office is one<br />
simplified methodology for framing and stimulating analysis of root causes and responsible<br />
actors, setting the stage for the development of coalitions and focused intervention strategies.<br />
Jones 2001<br />
55
Project Design Handbook<br />
56<br />
The causes and consequences are phrased in a similar fashion. First,<br />
identify the subject or the “who” of the sentence. Then, state the verb(s) of<br />
the sentence. Finally, state the objects of the verb (examples 1 to 4 below) or<br />
the subjective completions (examples 5-8 below). The following are samples<br />
of properly written causes and consequences.<br />
1) Children have frequent<br />
diarrhea.<br />
2) Mothers do not wash hands.<br />
3) Farmers cut trees.<br />
4) Families pay for funerals.<br />
5) People are uneducated.<br />
Positive approaches to causal analysis<br />
6) People have no power to<br />
influence decisions that affect<br />
their community.<br />
7) Farm families cannot own their<br />
own land.<br />
8) Community-based irrigation<br />
committees are not functioning.<br />
A word of caution: There is an unfortunate tendency to use phrases such as<br />
“lack of education or knowledge” for causes. Stating problems as a lack of<br />
something presupposes the solutions. In other words, you assume that the<br />
lack of education is the cause when in fact education may be one of several<br />
possible solutions. To help you improve your ability to detect differences<br />
among problem-cause and consequence statements, practice exercises are<br />
included in Annex 3.1.<br />
3.4.2 “Positive “ Approaches to Analysis<br />
New approaches are being developed by some designers in response to<br />
what they perceive as the ‘negativist’ connotations of the ‘problem-based<br />
approach’ to project design. Their premise is that a problem-based approach<br />
Issues Box 19<br />
Assets Approach – The assets approach highlights resources within the community and designs<br />
community-building activities using those resources. Implicit in this method is the idea that<br />
among the most important of these resources are the people of the community – including youth,<br />
women and other sometimes marginalized groups – and that by getting these people involved in<br />
the process, there is more likely to be a successful outcome.<br />
Appreciative Inquiry – Frequently used in institutional development processes, appreciative<br />
inquiry helps participants go beyond problem identification and focus on a positive vision for the<br />
future. In an appreciative inquiry, a facilitator guides participants through four phases:<br />
Discovery – appreciating what gives life (i.e., the best of what is); Dream – envisioning what<br />
might be (i.e., what is our world or community calling for); Design – group construction of the<br />
ideal vision; and Delivery – strategies to achieve the ideal. (See also Annex 3.6)<br />
Positive Deviance – This concept proposes that progressive influences in a community often<br />
come from those people who conduct themselves in a way that is outside local behavioral norms.<br />
Development projects seek to identify and work with progressive farmers who, unlike the<br />
majority, try new techniques or materials in an attempt to be more productive. Assessment<br />
based on positive deviance would seek such individuals from all sectors of society so that their<br />
successful discoveries could be shared, and other community members encouraged to copy them.
focused on seeking problems and their solutions is unhelpful for two main<br />
reasons. First, the spirit of partnership can be damaged when the<br />
development agent pays attention primarily to what a community lacks. In<br />
addition, the problem-based approach may not pay adequate homage to<br />
opportunities or assets locally available in the form of skills, capacities and<br />
human resources. There are approaches that take a more positive point of<br />
view, and it is valuable to be aware of some of the new terminology and tools<br />
being promoted (see Issues Box 19).<br />
3.5 Methods of Causal Analysis<br />
As we saw in Chapter 2, there are many tools that project design teams can<br />
use during the holistic diagnostic assessment stage to collect information<br />
relative to the project focus area or problem. Synthesis techniques can be<br />
used to organize this information to determine cause-and-effect relationships<br />
and establish priorities for project interventions. There are many methods<br />
available for conducting a causal analysis. We will focus primarily on the use<br />
of causal trees, but it is worth mentioning some of the other techniques here,<br />
because any one of the techniques can be used.<br />
Group Brainstorm/Consensus<br />
The simplest form of analysis is for a group to brainstorm possible causes,<br />
discuss them, and then prioritize. This can be done with any size of group<br />
but works best when guided using good facilitation techniques. It is often<br />
more useful, however, to use more structured methods which capitalize both<br />
on the experience of team members and on the visual representation of the<br />
“system” aspects of the causal analysis.<br />
Fishboning<br />
Fishboning is an easy and effective tool for exploring causes of identified<br />
problems. The fishbone can be useful with a relatively small number of<br />
causes. Figure 9 is a basic fishbone diagram, with the head of the fish at the<br />
right and the ribs extending to the left. The problem (or opportunity)<br />
statement is written on the head. Categories or labels can be placed on the<br />
ribs, which help identify and categorize potential types of causes that lead to<br />
the head.<br />
Fishboning is useful as an exploratory method, especially during<br />
assessments that seek to identify a number of constraints. The method is<br />
also a useful participatory tool because the process of diagramming facilitates<br />
group involvement. Fishboning does not, however, help clarify the<br />
sequencing or hierarchy of causes, a point we will see is important to project<br />
design. Nor does the method provide us with much insight on the relative<br />
contribution of each of the causal streams. Consequences are often left out<br />
of the diagram. One other limitation is that this structuring of the diagram<br />
assumes only problem enhancing (negatively contributing) streams, and does<br />
not portray forces that oppose these streams (positively contributing to<br />
solutions). For example, while the present diagram can show risk<br />
contributing behaviours, like non-use of condoms, poverty and pressure for<br />
Chapter 3 – Analysis & Synthesis<br />
57
Project Design Handbook<br />
58<br />
commercial sex, there is no way to show cultural beliefs and behaviours that<br />
contribute to delaying the age of first sex in adolescents, and thereby<br />
decrease their risk of HIV transmission.<br />
Figure 9: Example of the Fishbone Method of Diagramming Problems<br />
Cause and Consequence Analysis<br />
Another convenient method for exploring problems is called Cause and<br />
Consequence Analysis. It is designed to aid in uncovering both causes and<br />
consequences (effects) of phenomena in order to determine factors that<br />
contribute to the present situation and the future. It is a form of risk<br />
assessment and works best with small groups and key informants. It is<br />
visually represented in matrix form. One important output of the process is a<br />
priority ranking of problems based on severity of causes and consequences.<br />
The general format for this analysis is illustrated below in Table 10.<br />
Table 10: General Format for Cause and Consequence Analysis<br />
Problem/Need<br />
From: Witkin and Altschuld 1995.<br />
Causes Consequences Difficulty to correct -<br />
low, medium, high<br />
Criticality -<br />
1 2 3 4 5<br />
Witkin and Altschuld 1995<br />
To arrive at the final two columns in the format, each participant makes<br />
individual judgments using rating sheets with numbers keyed to the problems<br />
on a master chart. One of the major uses of this type of analysis is to set<br />
priorities for addressing problems. In this sense, it may be more useful for<br />
strategic or program planning and not project design, where the problem has<br />
already been defined.<br />
Nevertheless, groups generally like using this type of analysis and it is simple<br />
to learn and apply. Each problem will have more than one cause, and a
given cause may be related to more than one problem (which starts to show<br />
the interaction among causal factors, but still not very efficiently).<br />
Causal Trees<br />
A recommended method to consider is Causal Trees. Other terms for this<br />
method include Fault Tree Analysis, Causal Analysis, and Problem Trees or<br />
Diagrams. Causal Trees represent a systems approach to analyzing cause<br />
and effect, and in this light, they are extremely useful for project design. It is<br />
the most complex of the three methods we have discussed, as well as the<br />
most powerful. It is a useful tool for synthesizing the information collected<br />
during the holistic diagnostic assessment stage because it helps us to identify<br />
multiple causal linkages. The hierarchical causal analysis technique<br />
discussed earlier (Section 3.4) outlined the basic structure for the<br />
development of Causal Trees.<br />
The sample Causal Tree presented in Figure 10 addresses the problem of<br />
high child malnutrition. Relating the diagram to the Hierarchical Causal Tree<br />
presented earlier (Figure 8), we see that the direct consequences of the<br />
problem are identified as high child mortality, abnormal physical and mental<br />
child development, and high health care costs incurred by households. Thus,<br />
the identified problem is also a cause of higher-level consequences.<br />
Recall that conditions are identified as direct causes of the problem. In our<br />
example here, the conditions are the inadequate quantity of food provided to<br />
children, the poor nutritional quality of that food, and high incidence of<br />
infectious diseases.<br />
Chapter 3 – Analysis & Synthesis<br />
59
Project Design Handbook<br />
60<br />
Figure 10: Example of Causal Tree for Child Malnutrition<br />
Low agricultural<br />
production<br />
High soil erosion<br />
Farmers using slash and<br />
burn<br />
Farmers unwilling to<br />
change practices<br />
High mortality in<br />
children under five<br />
Inadequate quantity of<br />
food provided to children<br />
High<br />
inflation<br />
Low income<br />
Problem – High malnutrition rates among children<br />
under 5 in Mawawasi Province<br />
Few income-generating<br />
activities<br />
Women have no access to<br />
credit/capital<br />
Men control all<br />
household income<br />
Abnormal physical and mental<br />
development of children<br />
Poor nutritional quality of<br />
foods consumed by children<br />
Improper<br />
weaning<br />
Mothers receive<br />
no prenatal care<br />
Mothers do not<br />
participate in child<br />
feeding programs<br />
Mothers do not perceive<br />
of a problem of<br />
malnutrition<br />
Lack of knowledge<br />
about nutrition<br />
Families do not attend<br />
nutrition education<br />
classes<br />
Foods are classified<br />
based on folklore<br />
Rural households are<br />
very superstitious<br />
High<br />
illiteracy<br />
rates<br />
Parents are<br />
uneducated<br />
Society places<br />
low value on<br />
education<br />
Households incur high<br />
health-care costs<br />
High incidence of<br />
infectious diseases<br />
Inadequate<br />
health care<br />
Clinics are far<br />
from villages<br />
Few doctors willing<br />
to work in rural<br />
areas<br />
Doctors want<br />
high income<br />
Unsanitary<br />
conditions in<br />
households<br />
Homes open to<br />
flies and rodents<br />
Households do<br />
not hang screens<br />
People unaware of<br />
good sanitation<br />
practices
Chapter 3 – Analysis & Synthesis<br />
Chapter 3 Review: Analysis and Synthesis<br />
Key concepts Focus questions Notes<br />
3.1 Systems perspective<br />
reflected in Causal<br />
Analysis<br />
3.2 The logic of cause and<br />
effect<br />
3.3 Using cause and effect<br />
logic in project design<br />
3.4 Hierarchical Causal<br />
Analysis<br />
3.5 Methods of Causal<br />
Analysis<br />
• How does Causal Analysis<br />
promote a systems<br />
perspective?<br />
• What are the strengths of<br />
the Causal Analysis tool?<br />
• How does the Pareto<br />
Principle apply to Causal<br />
Analysis?<br />
• What is meant by cause<br />
and effect?<br />
• What are the factors that<br />
most directly contribute to<br />
the problem your project<br />
will address?<br />
• Have you considered the<br />
criteria you use to define<br />
the problem the project<br />
will address?<br />
• Have you established<br />
underlying causes?<br />
• Have you identified the<br />
hierarchical causal levels<br />
that contribute to the<br />
problem your project will<br />
address?<br />
• Have you clearly<br />
differentiated between<br />
problems, causes and<br />
consequences?<br />
• Does your causal analysis<br />
promote a positive<br />
approach?<br />
• Have you selected the<br />
most appropriate method<br />
for causal analysis?<br />
• Does your method clarify<br />
the hierarchy of causes<br />
and clearly identify causal<br />
streams?<br />
61
Project Design Handbook<br />
62<br />
Chapter 4<br />
Focused Strategy<br />
Selection of Causes from the Causal Analysis<br />
Making Key Choices on Interventions<br />
Project Hypothesis and Logic Model<br />
Assessing Project Interventions: A Rights-based Framework<br />
Reflective<br />
practice<br />
Holistic<br />
appraisal<br />
Coherent information<br />
systems<br />
Analysis &<br />
Synthesis<br />
Focused<br />
strategy<br />
This chapter discusses the development of a focused strategy, the<br />
third stage of the project design process. A project strategy defines<br />
how the project will address constraints by targeting specific causes<br />
identified during the synthesis stage. Developing a strategy involves<br />
selecting causes from the Causal Analysis that should be addressed<br />
by a project, choosing appropriate interventions, and constructing a<br />
project hypothesis and logic model.
Chapter 4: Focused Strategy<br />
Once a community’s problems or opportunities have been identified and all of<br />
the major linkages have been explored, the design team can turn its attention<br />
to developing a strategy that will lead to important changes in practices and<br />
systems. A project strategy defines how the project will address constraints<br />
and take advantage of opportunities by targeting specific causes in the causal<br />
analysis. Developing a strategy is no trivial task, and many design efforts fail<br />
at this stage even when a good analysis and synthesis has been done.<br />
Developing a strategy involves five key steps:<br />
1. Selecting specific causes to address from the synthesis;<br />
2. Developing interventions for each selected cause; and<br />
3. Constructing a project hypothesis and logic model;<br />
4. Identifying key assumptions; and<br />
5. Identifying and responding to unintended project impacts.<br />
Chapter 4 – Focused Strategy<br />
Selecting specific causes to address from the causal analysis can be<br />
problematic. Ideally, one would want to address all of the causes that lead to<br />
a problem. This is rarely possible. Fortunately, if fifty causal streams were<br />
identified as leading to child malnutrition, it is likely that three or four of these<br />
causal streams would account for 80% or more of the problem. This is the<br />
Pareto Principle discussed in the last chapter. The key is to correctly identify<br />
the causes that contribute most significantly to the problem and then define a<br />
strategy that will eliminate the causes of the<br />
problem.<br />
Definition Box 19<br />
Based on cause-effect logic, the strategy<br />
describes how project inputs and resulting<br />
outputs are going to bring about desired<br />
effect and systemic changes that will lead to<br />
sustainable impact on improving livelihoods.<br />
Interventions are a discrete package of<br />
actions and procedures that are developed<br />
and implemented. They are designed to<br />
Strategy<br />
Based on the cause-effect logic of problem<br />
analysis, the strategy is the approach through<br />
which project inputs and resulting outputs<br />
bring about the desired changes leading to<br />
sustainable impact on human wellbeing.<br />
directly (or sometimes indirectly) address a cause of identified phenomena.<br />
While generally an intervention is designed to address only one cause,<br />
sometimes a situation calls for interventions that address multiple causes. A<br />
project is commonly composed of multiple interventions which together work<br />
toward solving a defined problem.<br />
Interventions are often referred to as solutions to a problem. The word<br />
intervention, however, is perhaps more meaningful here since the ultimate<br />
solution to a problem depends on what actions are taken and how effective<br />
these actions are carried through. Thus, while all interventions are designed<br />
as solutions, their success in resolving the cause of a problem depends on<br />
many factors. At least some of these other factors may be external, and<br />
outside the control of the project, but they still need to be considered and<br />
63
Project Design Handbook<br />
64<br />
included in the project design under the topic of assumptions, which will be<br />
covered in section 4.3.2 (later in this chapter).<br />
Interventions can include such things as advocating for policy changes,<br />
information-education-communication (IEC), extension education,<br />
procurement and provisioning of resources such as seeds and tools, training<br />
of individuals or staff of an organization, institutional capacity building, etc.<br />
Not all interventions require creativity and innovation. In many cases, tried<br />
and tested interventions are entirely appropriate. For example, oral<br />
rehydration therapy is internationally accepted as a treatment intervention for<br />
diarrhea. Certainly, this intervention should be considered in a program<br />
addressing diarrhea, but it is also worth considering other options or other<br />
approaches, e.g., health education, improving water supplies, building<br />
sanitation facilities, etc.<br />
A key step in project design is the construction of the project hypothesis. In<br />
this step, we shift the focus of the design process from the problem to the<br />
solution. We restate the causes of our problem as anticipated outcomes of<br />
the solution. <strong>By</strong> adding our selected interventions to the project hypothesis<br />
diagram, we can check the logic of the cause-effect relationship identified in<br />
the causal analysis.<br />
At this stage in the design process, we need to step back and evaluate the<br />
project strategy for the overall potential impact. Tools from the Benefits-<br />
Harms Analysis approach can help us to consider and respond to unintended<br />
impacts of the project. Impact and decision tools used to evaluate the project<br />
strategy may lead to a redesign of the interventions.<br />
4.1 Selection of Causes to Address from<br />
the Causal Analysis<br />
A good causal analysis reveals all of the major cause-effect linkages that<br />
contribute to an identified constraint. Rarely, however, can all of the causes<br />
be addressed in one project. Therefore, we need to ensure that causes we<br />
choose to address contribute significantly to the resolution of an identified<br />
problem.<br />
We select causes to address based on several criteria, including those which:<br />
1) Show good potential that we (with our partners) really can make a<br />
significant difference in eliminating the cause in a sustainable and<br />
cost-effective way;<br />
2) Make a significant contribution to the problem;<br />
3) Have high synergy in relation with other interventions;<br />
4) Fit our organization’s comparative advantage;<br />
5) Have potential for partnering;<br />
6) Make sense to participants – indeed, involvement by representatives<br />
of target communities in the whole design process is an important<br />
factor in enhancing a project’s potential to be successful.<br />
7) In these and other ways consistent with the CI Project Standards.
Make a Significant Contribution to Solving the Problem<br />
We try to address causes that will solve the problem and provide the greatest<br />
degree of impact. Each cause-effect linkage contributes to X percent of the<br />
problem. The difficulty is that we rarely know what the exact percentage is.<br />
There are no simple tools for determining the contribution of each cause to<br />
the problem. Research around a particular problem analysis can reveal<br />
important insights, but we cannot usually afford the required time or costs to<br />
do it very rigorously. Simply ranking the causes by the frequency they are<br />
cited (for example, in a household survey) gives an idea of how common a<br />
problem is, but still does not provide you with knowledge of what contribution<br />
the cause makes to the problem.<br />
So, what do we normally do in project design to identify the primary causes?<br />
Ask key sector specialists.<br />
Research secondary data and literature reviews, including evaluations<br />
of previous projects that addressed similar problems under similar<br />
circumstances.<br />
Collect additional primary data if needed.<br />
Look for convergence of evidence.<br />
Determining the significance of a cause: example from child malnutrition<br />
Chapter 4 – Focused Strategy<br />
Issues Box 20<br />
As shown in the Causal Tree presented in Chapter 3, the causal analysis of child malnutrition<br />
revealed three major primary causes: food quantity; food quality; and infectious diseases. In a<br />
survey of 100 households with malnourished children, 65 mentioned a shortage of food, 23<br />
mentioned a shortage of high-quality food, and 12 mentioned an occurrence of infectious<br />
diseases within the previous two months. Based on this information, we might conclude that in<br />
these households, food quantity is the most frequent contributor to malnutrition. We cannot<br />
determine without more in-depth analysis, however, that food quantity accounts for the<br />
majority of the malnutrition problem.<br />
High Synergy<br />
Often we can have greater impact toward solving a problem by addressing<br />
highly inter-related causes. In design, the idea of synergy is that the<br />
combined impact of addressing two or more causes is greater than the sum<br />
of addressing each cause individually. In other words, the payoff of working<br />
on certain combinations of causes is greater than if we work on each cause<br />
separately. In the case of high child malnutrition, for example, if we can<br />
identify an intervention that will address multiple causes for the inadequate<br />
quantity of food provided to children, and these causes are synergistic, we<br />
can expect greater impact on the problem of malnutrition (see example in<br />
Figure 11, next page).<br />
In many cases, it is neither feasible nor advisable for a single project to<br />
address multiple causes of a higher-order problem. This is an important<br />
reason to incorporate a program strategy. Two or more projects can each<br />
65
Project Design Handbook<br />
66<br />
Inadequate quantity of<br />
food provided to children<br />
Low agricultural<br />
production<br />
High soil erosion<br />
Farmers using<br />
slash and burn<br />
Farmers unwilling<br />
to change practices<br />
address particular causes of a problem, thereby achieving a synergy that<br />
enables a higher-level impact than either project could accomplish on its own.<br />
Again, there are no simple tools available for identifying synergistic<br />
relationships among different cause-effect linkages. We can rely, in part, on<br />
our experience and common sense but we often need to pilot interventions in<br />
order to determine synergy. As more and more projects combine efforts of<br />
different sectors, we should gain more knowledge of synergy among causeeffect<br />
linkages. Caution – note that it is equally important to avoid or<br />
Figure 11: Addressing Synergistic Causes – Example from Child Malnutrition<br />
Problem – High malnutrition rates among<br />
children under 5 in Mawawasi Province<br />
Low income<br />
Poor nutritional quality of<br />
food consumed by children<br />
Few income generating<br />
activities<br />
Women have no access<br />
to credit/capital<br />
Men control all<br />
household income<br />
High incidence of<br />
infectious diseases<br />
The Causal Tree Analysis in<br />
Chapter 3 identifies 'inadequate<br />
quantity of food provided to<br />
children' as one of three direct<br />
causes of high child<br />
malnutrition. <strong>By</strong> designing an<br />
agricultural intervention with an<br />
income-generating component<br />
that targets women, we can<br />
address two cause-effect<br />
linkages at the behavioral level.<br />
In this way, we expect our<br />
impact to be greater than if we<br />
were to implement the two<br />
interventions separately.<br />
Intervention 1: Extension education to convince farmers to practice farming methods that are less<br />
detrimental to the environment yet provide their households with sufficient food and income.<br />
Intervention 2: Micro-lending scheme for women farmers growing food crops in forested areas: <strong>By</strong><br />
providing small scale loans to women farmers who are growing food crops traditionally cultivated in forested<br />
areas, the intervention provides an incentive to farmers to maintain forested areas, thereby changing<br />
practices of slash and burn that lead to soil erosion. Additionally, the intervention will enhance the<br />
opportunity for women to control a portion of household income, through profit gained through access to<br />
agricultural credit.
minimize ‘competition’ (which could be called ‘negative synergy’). This<br />
negative outcome can occur between project interventions, between projects,<br />
or between partners/agencies. For example, in Tanzania, CARE found in<br />
one area that they had a project encouraging women to stay home and spend<br />
more time with the children – for improving nutrition and child development.<br />
In the same location, there was another CARE project promoting women’s<br />
involvement in microenterprise and IGAs (income generating activities) that<br />
was taking the women out of the home more of the time.<br />
Comparative Advantage of the Organization<br />
We want to ensure that the causes we select<br />
to address are those that the organization<br />
can implement. Normally a design team<br />
considers capacity or the comparative<br />
advantage of an organization as one of its<br />
selection criteria for choosing interventions.<br />
Of course, an organization can alter its<br />
Chapter 4 – Focused Strategy<br />
Definition Box 20<br />
Comparative Advantage<br />
Capacity of an organization in terms of skills,<br />
experience and other resources.<br />
comparative advantage by hiring new staff with skills required for addressing<br />
a cause. Given CARE's cumulative experience with Household Livelihood<br />
Security, a CARE design team may have a comparative advantage in<br />
addressing causes at the household and community levels. In this way, we<br />
should look for causes that will provide good entry points into communities.<br />
In choosing causes to address to impact childhood malnutrition, for example,<br />
a design team may prefer to focus on sanitation practices in households, or<br />
child nutrition, or food production. It is important to note, however, that the<br />
HLS framework does not require CARE to work at the micro level.<br />
Depending on the comparative advantage of the implementing organization,<br />
a project design team could chose to work at regional or national levels, or in<br />
institutional capacity development or in policy advocacy.<br />
Potential for Partnering<br />
Cause-effect linkages can also be selected with partnering in mind. A<br />
conscious decision can be made - and often is - by an organization to identify<br />
partner organizations that can address specific problem causes related to<br />
sectors in which they specialize. For example, partnering with another<br />
organization might allow CARE to focus on the micro-level causes of the<br />
problem, while the partner addresses macro-level causes of the problem.<br />
This may increase the overall scope of the project, while also better targeting<br />
and delegating responsibilities to project actors.<br />
4.2 Making Key Choices on Interventions<br />
After deciding which causes to address, the next step is to develop<br />
intervention themes for each cause. Choosing intervention themes includes<br />
several sub-steps:<br />
● Develop intervention alternatives<br />
● Select criteria to decide which intervention is preferable<br />
● Choose an intervention to develop<br />
67
Project Design Handbook<br />
68<br />
Develop Intervention Options<br />
Definition Box 21<br />
Intervention<br />
A discrete package of actions and procedures<br />
that are developed and implemented. They<br />
are designed to directly (or less often<br />
indirectly) address a cause of an identified<br />
problem.<br />
Choosing the best intervention for any given<br />
cause requires a good list of alternatives.<br />
This is where creativity in project design is<br />
important! All too often, design teams are<br />
biased in their thinking of possible<br />
interventions (“this is how we’ve always<br />
done it here”), or they are particularly<br />
swayed by one person’s opinion, or they are<br />
misinformed by not including broad<br />
participation. Consider bringing others into<br />
the design process to help identify<br />
appropriate interventions, such as community members, partner<br />
organizations, government officials, outside experts, or even other people<br />
from your organization (e.g. CARE staff in other units or sectors).<br />
To generate ideas about interventions, a design team should hold a<br />
brainstorming session to develop a list of possible alternatives, both<br />
conventional and unconventional. The point is to be as creative as possible.<br />
The ideas that individuals will have for alternative interventions come from<br />
several sources, including:<br />
● Current best practices (including latest HLS, RBA, DME, sectoral and<br />
other guidelines)<br />
● Lessons learned from previous projects (including evaluation reports)<br />
● Individual and institutional experiences<br />
● Inputs from communities on desired solutions<br />
● Ideas from review of research and secondary literature<br />
We should always consider best practices since they are interventions that<br />
have proven to be effective over time and in a large number of contexts.<br />
Don’t forget that best practices are contextual and may not always provide<br />
the best strategy for all situations. However, our selection of intervention<br />
themes must always consider the operating environment of the project being<br />
designed and the influence it has on what is feasible. There will likely be a<br />
variety of intervention options for any given cause.<br />
Issues Box 21 provides examples of multiple interventions appropriate for<br />
three causes. As these examples demonstrate, there are often several valid<br />
intervention options to address the cause(s) of a problem. While sometimes<br />
the situation calls for some combination of all interventions, it is also common<br />
that only one intervention is chosen, the successful implementation of which<br />
makes the implementation of others unnecessary.<br />
Select Criteria to Decide on Preferred Interventions<br />
Once all alternatives have been expressed, the next step is to examine and<br />
eventually select one of them. The selection process can be as simple as<br />
arriving at team consensus or as complicated as applying decision tools to<br />
make the choice. The final chosen intervention can be a hybrid of several<br />
different ideas. Regardless of how a team ultimately arrives at selecting an
intervention, it is important to develop criteria on which to base decisions.<br />
Each team should be responsible for developing its own criteria. However,<br />
some common criteria used for selecting interventions include:<br />
● Cost-effectiveness<br />
● Social acceptability<br />
● Required management support<br />
● Community support<br />
● Sustainability<br />
● Technical feasibility<br />
● Political sensitivity<br />
● Level of risk<br />
Possible project interventions<br />
Choosing the Best Intervention<br />
The Multiple Criteria Utility Assessment tool and the Pairwise Ranking Matrix,<br />
presented in the following two pages as Issues Boxes 22 and 23, are tools<br />
that can be used by project design teams when selecting interventions.<br />
Samples are included to help illustrate the tools’ functions.<br />
Chapter 4 – Focused Strategy<br />
Issues Box 21<br />
Cause (behavioral level): Farmers are not applying sustainable practices for hillside cropping<br />
Possible Interventions<br />
♦ Trained extension agents to work with farmers in the zone<br />
♦ Model farms where proper methods can be observed<br />
♦ Direct technical training of progressive farmers in the zone<br />
♦ Radio and television public-service spots promoting improved cropping practices<br />
Cause (behavioral level): Inadequate diet provided to children<br />
Possible Interventions<br />
♦ Community-based nutritional education for young mothers<br />
♦ Billboards and radio spots promoting proper nutrition<br />
♦ Physical growth monitoring and counselling<br />
♦ Supplementary feeding in community kitchens<br />
♦ Supplementary feeding in schools<br />
Cause (system-level): Unreliable supply of medicines<br />
Possible Interventions<br />
♦ Periodic import and distribution of donated medicine<br />
♦ Community-managed pharmacies<br />
♦ Greater availability of traditional and/or locally produced medicines<br />
♦ Private sector promotion in pharmacy<br />
♦ Advocate change in government policy to promote medical supplies<br />
69
Project Design Handbook<br />
70<br />
Multiple Criteria Utility Assessment tool<br />
Issues Box 22<br />
The MCUA is a powerful tool for choosing among intervention options using several selection criteria. Using a quantifiable tool such as<br />
MCUA preserves a record of decision-making processes and helps mitigate disagreement among individuals. The steps to an MCUA<br />
are:<br />
1. Use brainstorming or other means to generate a list of acceptable alternative interventions for each cause of the problem listed in the project<br />
design.<br />
2. Create a table as illustrated below for each set of interventions. Write the corresponding cause at the top of the table.<br />
3. Determine and list in the left column the criteria against which to evaluate each potential strategy (for example, cost-effectiveness,<br />
sustainability).<br />
4. Assign a numerical value (weight) to each criterion according to its importance relative to the others (1=least important, 5=most important). Show<br />
this in the 2 nd column.<br />
5. List the alternative intervention strategies generated for this particular cause (e.g., community-managed courses, etc.).<br />
6. Score - For each intervention strategy, rank each criterion from 1 to 3 (1=least favorable, 3=most favorable) for the estimated degree to which<br />
the strategy will meet the criteria.<br />
7. S x W - Multiply the score of the criterion by its weight and enter the value.<br />
8. Total - Add the values under the S x W column. The greatest values are those strategies which are the "best" according to the MCUA.<br />
CAUSE (1): POOR PERSONAL AND DOMESTIC HYGIENE PRACTICES<br />
#1 Community-managed Hygiene<br />
Courses<br />
Optional Intervention Strategies<br />
#2 Independent<br />
Counseling<br />
#3 Short Courses<br />
Criteria Weight Score Score x Weight Score Score x Weight Score Score x Weight<br />
Cost Effectiveness 4 1 4 2 8 2 8<br />
Social Acceptability 5 3 15 2 10 3 15<br />
Political Feasibility 4 2 8 2 8 2 8<br />
Administrative Feasibility 4 2 8 3 12 1 4<br />
Sustainability 3 2 6 1 3 1 3<br />
Community Participation 3 1 9 1 3 1 3<br />
Total 50 44 41<br />
Based on the criteria used by the design team, the first intervention in this example is the most likely to succeed in correcting the problem of<br />
personal/domestic hygiene. The next step would be to ask if the results of this MCUA exercise make sense to the key stakeholders.
Note: While it is true that many of these choices are subjective, generating a good participatory discussion about them -- leading to agreement on<br />
relative weights and scores – the tool adds objectivity and transparency to the process.<br />
71
Project Design Handbook<br />
72<br />
Pair-wise Ranking Matrix<br />
Issues Box 23<br />
Another tool used frequently for participatory prioritization of intervention options is the Pair-wise Ranking Matrix. This tool is less precise than<br />
the MCUA but is a bit simpler and perhaps more comprehensible to partners new to these methodologies. This tool facilitates the comparison of<br />
many items on a list by having participants prioritize items two at a time (hence the name ‘pair-wise ranking’). Note: In certain communities, it is<br />
important that an experienced facilitator lead the Pair-wise Ranking given the need for thorough discussion and consensus before intervention<br />
selection.<br />
The steps to conducting the Pair-wise Ranking methodology are presented below:<br />
1. A group should first brainstorm for a list of intervention options.<br />
2. A matrix such as the example on the right should then be created<br />
with sufficient rows and columns to allow all options to be entered.<br />
Example: Interventions to address women’s lack of access to pre-natal care<br />
3. Each option should be written sequentially in both the rows and<br />
LIST OF INTERVENTION OPTIONS<br />
columns. Symbols or objects may be used if space is a problem, or<br />
if the group works better with visual representations.<br />
1.<br />
2.<br />
Build a clinic in the community.<br />
Facilitate transportation to clinics in neighboring towns.<br />
4. Each option in the matrix should then be compared with the others, 3. Have a visiting nurse provide periodic care.<br />
one pair at a time. Through voting, consensus, or other means, the<br />
team should then decide which item is preferable for each pair.<br />
4. Train a community member in pre-natal care.<br />
5. The ‘winner‘ should be noted in the cell where the row and column<br />
meet for the two items being compared. Illustrated in the sample<br />
Criteria: Which intervention option is likely to be more cost-effective?<br />
matrix to the right, the group decided that arranging for transport CREATE MATRIX AND CONDUCT PAIRWISE RANKING<br />
is a better option than building a clinic and noted that choice in the<br />
Clinic Transport Nurse Training<br />
appropriate cell.<br />
Clinic Transport Nurse Training<br />
6. The team should then repeat this process for each unique pair of Transport Nurse Transport<br />
options. (Note: The matrix cells are blocked out when they<br />
Nurse Nurse<br />
represent the intersection of the same item from row and column,<br />
or when they repeat a comparison already made.)<br />
Training<br />
TALLY RESULTS<br />
The basis of comparison in the Pair-wise Ranking Matrix may differ<br />
1. Have a visiting nurse provide periodic care. (three votes)<br />
depending on the needs of the team. In the example shown here,<br />
2. Facilitate transportation to clinics in neighboring towns. (two votes)<br />
comparisons were based on the question, ‘Which intervention option is 3. Train a community member in pre-natal care. (one vote)<br />
most cost-effective?’ They could have been based on other criteria<br />
such as technical feasibility, social acceptability, or time needed to<br />
complete the project.<br />
4. Build a clinic in the community. (zero votes)
4.3 Project Hypothesis<br />
Definition Box 22<br />
Hypothesis<br />
Presumed correlations between outputs and<br />
effect objectives, or between effect<br />
objectives and impact goal. The hypothesis is<br />
either accepted (from, for example, a<br />
secondary literature review) or tested during<br />
project implementation.<br />
Five basic steps in constructing a project hypothesis<br />
The Project Hypothesis is a critical step in the<br />
design of a project. It is in this step that we<br />
are going to shift from being predominantly<br />
problem focused to being predominantly<br />
solution focused. It is the core of the logic<br />
model upon which the project is designed. In<br />
this regard, it is an important step for us to<br />
take.<br />
Many people with experience in project<br />
design will tell you that this step does not<br />
need to be as mechanical as it will seem here. This is true, and many people<br />
will even do most of the project hypothesis as a mental exercise and not as a<br />
structured diagram as presented here. It is important to walk through it stepby-step,<br />
however, so that we are all clear about how it works.<br />
Completing the project hypothesis diagram will position you to develop clear<br />
and precise goal or objectives statements, a step in the design process that<br />
many people have trouble with. It is also a stage in the design where key<br />
questions and assumptions need to be explored. In addition, it will help us to<br />
determine whether our logic is sound when we add our recommended<br />
interventions to the diagram.<br />
4.3.1 Constructing the Project Hypothesis<br />
Developing a project hypothesis involves five basic steps, outlined in Issues<br />
Box 24 below. <strong>By</strong> completing the simple exercises, the problem hierarchy<br />
has been converted to a form that summarizes the core content of the<br />
project. The project hypothesis clearly states what interventions will be used<br />
to address which causes. The examples on the following page (Issues Box<br />
25) illustrate the steps outlined below with a child malnutrition project. A<br />
second example for developing a project hypothesis is included in Annex 4.1.<br />
Chapter 4 – Focused Strategy<br />
Issues Box 24<br />
1. Convert the problem and its key causes to solutions and anticipated outcomes.<br />
2. Develop a diagram that illustrates the cause-and-effect relationships of these solutions and<br />
outcomes. See Issues Box 25 and the Annex 4.1 for examples of the project hypothesis<br />
diagram.<br />
3. Add interventions (as identified in the project strategy) to the project hypothesis diagram<br />
(see next section).<br />
4. Identify assumptions and insert them appropriately to complete the project hypothesis<br />
diagram; simultaneously identify and resolve key questions affecting the project hypothesis.<br />
5. Complete the project hypothesis diagram.<br />
73
Project Design Handbook<br />
74<br />
Constructing a Project Hypothesis – Example of Child Malnutrition<br />
Issues Box 25<br />
Step 1: Converting the Problem and Its Key Causes to Solutions and Anticipated Outcomes<br />
Problem: Poor nutritional status of children<br />
Causes: Children consume inadequate combinations and amounts of nutrients<br />
Children frequently suffer from diarrhea<br />
Children who get diarrhea are not given ORT (Oral Rehydration Therapy)<br />
Anticipated outcomes:<br />
(1) Childhood nutritional status will improve (Solution to the Problem)<br />
(2) Children’s consumption of nutrients will rise to adequate level (Cause #1)<br />
(3) Children’s consumption of contaminated water will decrease. (Cause #2)<br />
Steps 2-5: Developing a Project Hypothesis Diagram<br />
Step 2 illustrates the cause-effect relationships of the anticipated outcomes.<br />
In Step 3, interventions are added to the diagram.<br />
In Step 4, assumptions and/or key questions are inserted.<br />
Reviewing the diagram in Step 5 ensures that the project hypothesis diagram is complete.<br />
Project Hypothesis Diagram: Child Malnutrition Problem<br />
(Read from bottom up)<br />
Hypothesis Outcomes Assumptions/Key Questions<br />
IF<br />
IF<br />
Cause 1<br />
IF<br />
Cause 2<br />
IF<br />
THEN<br />
THEN<br />
THEN<br />
General nutritional status of children<br />
living in Mawawasi Province will improve.<br />
Children’s consumption of nutrients<br />
rises.<br />
Children’s consumption of contaminated<br />
water decreases.<br />
Children's consumption of nutrients will<br />
rise to an adequate level.<br />
Nutrition education programs are<br />
provided to households.<br />
Children's consumption of<br />
contaminated water will decrease.<br />
Families have access to clean water and<br />
sanitation facilities.<br />
AND<br />
AND<br />
AND<br />
AND<br />
No other causes of<br />
malnutrition develop<br />
(Assumption)<br />
Families have access to<br />
more nutritious foods<br />
(Key Question)<br />
Parents store water<br />
safely<br />
(Key Question)
4.3.2 IDENTIFYING Assumptions and Key Questions<br />
Definition Box 23<br />
Assumption<br />
Circumstances or conditions important for the<br />
success of the project but beyond direct<br />
control by the project. This may include<br />
beliefs, essentially improvable, held by the<br />
design team about the environment in which<br />
the project takes place. It can also include<br />
assumptions that other agencies will do their<br />
part to address related causes. (Note that<br />
such assumptions should be monitored during<br />
the life of a project.)<br />
Key Question<br />
All questions you can and should answer during<br />
the design of a project. Differs from an<br />
assumption in that it can lead to action. Key<br />
questions are also used to guide evaluations.<br />
Identifying assumptions and key questions is<br />
one of the most difficult aspects of project<br />
design to both teach and comprehend.<br />
Ample time should be spent trying to<br />
understand what are and what are not useful<br />
assumptions. It is important not to confuse<br />
assumptions with key questions.<br />
Assumptions are conditions that are<br />
important to the success of a project, but<br />
beyond its control. Key questions, on the<br />
other hand, are those queries you can and<br />
should answer during the design of a project.<br />
For example, if you are designing a project<br />
with a nutrition-education component, a key<br />
question would be, ‘Are there adequate<br />
nutritious foodstuffs available to the<br />
households?’ This is obviously important to<br />
know when designing interventions. <strong>By</strong><br />
simply assuming nutritious foods are<br />
available, you may be condemning the<br />
project to failure.<br />
Assumptions can be identified through the following process:<br />
1. Identify external factors recognized as causes during problem<br />
analysis but not addressed directly by the project.<br />
2. Identify external factors not recognized in the project hypothesis logic<br />
but important to the success of the project.<br />
3. Determine if information on external factors is both critical and<br />
obtainable. Conduct research on these key questions and revise the<br />
project design accordingly.<br />
4. Assess the importance of each remaining external factor (assumption)<br />
and the likelihood of it being realized. If questionable, the project<br />
could fail (the infamous ‘killer assumption’). Depending on the<br />
conclusions:<br />
• If it almost certainly will happen, do not bother to include it as an<br />
assumption.<br />
• If it is likely to happen, include the factor as an assumption<br />
• If the factor is important but is unlikely to occur – it is a killer<br />
assumption; stop - redesign the intervention; add factors to ensure<br />
success.<br />
5. Enter valid assumptions into the project hypothesis diagram at the<br />
appropriate level.<br />
6. Check to verify that intervention logic is still valid and does not<br />
overlook important factors.<br />
Figure 12 is an algorithm (a series of questions to be answered in sequence)<br />
to assess the importance of various external factors to the project hypothesis.<br />
Chapter 4 – Focused Strategy<br />
75
Project Design Handbook<br />
76<br />
Figure 12: Algorithm to Assess Importance of External Factors<br />
I<br />
Is the factor important to the success of the project?<br />
YES<br />
NO<br />
Is sufficient information about the factor obtainable or<br />
answerable during the project development stage?<br />
YES NO<br />
Analysis - Identify it as a ‘key question’.<br />
Action - Conduct research on this key question<br />
and revise the project design accordingly.<br />
Will the factor be realized or solved as a result of<br />
another project?<br />
Almost certainly<br />
Analysis - Do not<br />
include in the<br />
project hypothesis<br />
Action – STOP<br />
with this factor!<br />
Likely<br />
Analysis - Include<br />
in the hypothesis<br />
as an ‘assumption.’<br />
Action – STOP<br />
with this factor!<br />
Is it possible to modify the component or redesign project<br />
in order to influence the factor?<br />
YES NO<br />
Analysis - Identify it as a ‘key<br />
question’ for design;<br />
Action - Redesign project, e.g., add<br />
activities, or change goals of project.<br />
Unlikely<br />
Analysis - It should<br />
not be included in the<br />
project hypothesis.<br />
Action – STOP on<br />
this factor!<br />
Analysis - Identify it<br />
as an ‘assumption’.<br />
Action - Proceed to<br />
the other questions.<br />
Analysis - This is a “killer assumption”;<br />
the project is not feasible unless a<br />
solution can be found to nullify the<br />
assumption.<br />
Action – STOP! Rethink this design!
Issues Box 27 shows how the algorithm is used to differentiate between key<br />
questions and assumptions in the Child Malnutrition Example.<br />
4.4 Logic Models<br />
A logic model documents the essence of a program or a project: what<br />
activities does the project do with what resources? What outputs does it<br />
produce for what customer groups? What effects or outcomes do these<br />
outputs have? What longer term, strategic goal or impact is the program<br />
trying to achieve? What contextual factors influence success? And what are<br />
the logical, causal linkages among these? (See: Jordan, Gretchen. Sandia<br />
National Laboratories.)<br />
Throughout this handbook, we have taken a systematic cause-and-effect<br />
approach to project design. Recall that in Chapter 1, a project hierarchy was<br />
presented that identified input, activity, output, effect and impact levels. This<br />
hierarchy corresponds with a problem hierarchy based on the same cause-<br />
Chapter 4 – Focused Strategy<br />
Issues Box 26<br />
Important Caution<br />
Keep in mind that any external factors that can be further assessed through additional<br />
research should be considered ‘key questions’ rather than ‘assumptions’. Examples of key<br />
questions: Does additional household income actually lead to better diet for children in this<br />
setting? Will families in the proposed area actually use latrines if they were available?<br />
Issues Box 28<br />
Example: Cause and Effect Logic in the Problem and Project Hierarchy<br />
Results of Problem Analysis Hypothesis<br />
Issues Box Project 27 Hierarchy<br />
Using an algorithm for assumptions and key questions<br />
(read<br />
-<br />
from<br />
Child<br />
bottom<br />
Malnutrition<br />
upward)<br />
example<br />
Problem<br />
Expected Outcome<br />
Impact Goal<br />
External Factor A: No (Decreasing other causes Farm Family of malnutrition (Farm develop family in Mawawasi income increases) Province during (Income the Increases life Where, When,<br />
Income) of the project<br />
Then this outcome can happen<br />
for Whom, by How Much)<br />
Design question Response Analysis and action to be taken<br />
If this change happens<br />
Is this factor important Direct Causes to the YES Change Proceed in Condition to next question<br />
Effect objective<br />
success of the project? (Low Crop Yields)<br />
(Crop Yields Increase)<br />
(Farmers Use Better Methods as<br />
Is sufficient information about the NO Then this Identify change as can an happen ‘assumption’. Measured by Increased Crop Yields)<br />
factor obtainable or answerable during<br />
Proceed to next question.<br />
the project development stage?<br />
If this change happens<br />
Will the factor be Indirect realized Causes or solved LIKELY Change Include in Condition in the hypothesis as an<br />
Effect objective<br />
as a result of another (Severe project? Soil Erosion)<br />
(Soil Fertility<br />
‘assumption’.<br />
Improves)<br />
STOP with this<br />
(Farmers<br />
factor!<br />
use better methods as<br />
Then this change can happen measured by improved soil fertility)<br />
External Factor B: Families have access to more nutritious foods<br />
If this intervention happens<br />
Design question Behavioral Causes Response Analysis Intervention and action to be taken<br />
Outputs<br />
Is this factor important (Farmers to use the improper YES (Agricultural Proceed Extension to next Program question (People Trained, Educational<br />
plowing techniques)<br />
success of the project?<br />
Implemented)<br />
Materials Produced, etc.)<br />
Is sufficient information about the YES<br />
Base Causes<br />
factor obtainable or answerable during<br />
(Farmers have no knowledge<br />
the project development of improved stage? methods)<br />
Identify as a ‘key question’.<br />
Activities<br />
Conduct research on this key<br />
(Training, Writing, Building, etc.)<br />
question and revise the project<br />
Inputs<br />
design accordingly.<br />
(Staff Time, Money, Materials, etc.)<br />
77
Project Design Handbook<br />
78<br />
and-effect logic. Issues Box 28 illustrates the relationship between the<br />
problem and project hierarchies and shows how the hypothesis forms a link<br />
between the two. Within the project hierarchy, if certain chosen activities are<br />
successfully implemented – if inputs are effectively converted to outputs –<br />
then change at the effect and ultimately impact levels will be expected to be<br />
observed, if the hypothesis is well founded.<br />
Note on diagram in Issues Box 28: For simplicity purposes, only linear causeeffect<br />
paths are shown here. In most cases, there are multiple causes, thus<br />
there will need to be multiple activities and outputs, plus assumptions<br />
regarding what others will do to address related causes that the project will<br />
not address directly.<br />
<strong>By</strong> completing the steps necessary to develop the project hierarchy, the<br />
project design team has identified the primary components of the logic<br />
model. 13 The logic model provides a structure to the process of planning and<br />
summarizes the output of the design process. The model should show how<br />
proposed interventions and anticipated outputs would result in stated effects<br />
and impact. It should identify key assumptions and validate the central<br />
project hypothesis.<br />
Note: We are introducing logic models here at the end of the Focused<br />
Strategy chapter because a logic model summarizes a project design.<br />
However, as we will see in Chapter 5, as we further refine goals and<br />
objectives, and as we develop specific indicators leading to a monitoring and<br />
evaluation plan, we will be able to refine and add more detail to our project’s<br />
logic model.<br />
When we have assigned precise goals at the effect and impact levels – and<br />
selected indicators to allow for the measurement of change, and presented<br />
this information in a logic model, we will have developed a framework for a<br />
monitoring and evaluation system to track project progress. As project<br />
information changes during implementation, such as modifications<br />
recommended in mid-term evaluations, logic models and frameworks can<br />
also evolve.<br />
Logic modeling can be as simple or as complex as needed for the audience<br />
and situation. The interest in logic models has increased with the increased<br />
requirements to explain relevance and measure the performance of public<br />
programs. Depending on the logic model you choose, you can manage and<br />
communicate – to varying degrees of detail – what the project intends to do<br />
and how. There are many ways to portray a logic model:<br />
• Descriptive text<br />
• Line diagram<br />
• Table<br />
• Objectives hierarchy<br />
• Flow diagram<br />
• Sequential flow diagram<br />
13 A common form of logic model is the logical framework (logframe) matrix. However, we are using the<br />
more generic term ‘logic model’ here because there are other forms that can be more helpful in giving a<br />
picture that summarizes a project design.
Other examples of project/program logic models including logical frameworks<br />
can be seen in Annexes 5.4-5.8.<br />
4.5 A Rights-Based Assessment of<br />
Interventions<br />
Another framework being developed in CARE is the "Benefits-Harms<br />
Analysis". Benefits-harms analysis draws on the Household Livelihood<br />
Security approach, in that it aims for a fuller understanding of the conditions<br />
that affect the ability of people to satisfy their basic needs and realize basic<br />
human rights. (See Chapter 1 for a discussion of HLS.) The approach also<br />
builds upon the "Do No Harm" framework in promoting critical analysis in<br />
relief and development work. The purpose of Benefits-Harms Analysis is to<br />
assist CARE and other relief and development organizations to better<br />
understand and take responsibility for the overall impact of projects, and to<br />
minimize unintended harms.<br />
The benefits-harms tools can be useful at various stages throughout the<br />
project design process. When developing a project strategy or designing an<br />
intervention, impact and decision tools, summarized below in Issues Box 29,<br />
can be particularly useful to assess our project hypothesis for unintended<br />
impacts and to ensure that our recommended interventions maximize positive<br />
impacts. These tools help us to step back and reconsider the internal and<br />
external factors that affect desired change and to situate interventions within<br />
the broader context of rights and responsibilities in which we work.<br />
Benefits-Harms Analysis<br />
Chapter 4 – Focused Strategy<br />
Issues Box 29<br />
Benefits-harms analysis is grounded in three categories of rights and impacts: 1) political<br />
rights, 2) security rights, and 3) economic, social and cultural rights. The approach offers three<br />
types of flexible tools; of these, a design team can use the decision and impact tools at this<br />
stage of the project design process to help identify and address unintended human rights<br />
impacts that may result from proposed interventions.<br />
▷ Profile tools help project planners consider holistically the<br />
political, security, economic, social and cultural rights<br />
environment in any given context.<br />
▷ Decision tools help a project design team choose a course<br />
of action to minimize unintended harms or maximize<br />
previously unforeseen benefits.<br />
▷ Impact tools help project planners consider the<br />
causes and effects that may lead to unintended<br />
impacts.<br />
Security<br />
Benefit<br />
Harms<br />
Categories<br />
Economic Political<br />
79
Project Design Handbook<br />
80<br />
The tools can be used in a variety of ways depending on time constraints, the<br />
agency's resources and capacities, and the operating environment. If, for<br />
example, the project design team will be implementing an intervention to<br />
address causes of high childhood malnutrition in a conflict setting, the design<br />
team may choose to use impact and decision tools focusing on security<br />
rights. CARE's Benefits-Harms Handbook discusses the approach in detail<br />
and provides guidelines for using the full set of tools. (See: "Benefits-Harms<br />
Handbook.” CARE International. 2001.)<br />
Incorporating a Rights-Based Approach into a focused<br />
project strategy<br />
A focused strategy grows out of the synthesis of our assessments and<br />
analysis and centers on the design of CARE’s interventions. Incorporation of<br />
a rights-based approach highlights the importance of investing in local<br />
participation, empowerment, and dialogue on rights, responsibilities, and<br />
power relations, of working at multiple levels, and of seeking to have<br />
significant positive impact on people’s overall ability to live with dignity.<br />
Anticipating and avoiding (or at least minimizing) harms that may result from<br />
our interventions - CARE is an outside agency with significant resources<br />
relative to the communities we serve. Even strategically focused, welldesigned<br />
projects and programs can have negative side effects. An<br />
agricultural production intervention may, for example, contribute to exclusion<br />
and oppression of small landholders or landless people. Or a revolving loan<br />
project targeting women may lead to their being victims of violence at the<br />
hands of male spouses who resent their newfound economic empowerment.<br />
A rights-based approach is concerned with the full range of impacts our<br />
interventions are likely to have, and seeks to maximize the net positive<br />
impact on human dignity and self-worth.
Chapter 4 – Focused Strategy<br />
Chapter 4 Review: Focused Strategy<br />
Key concepts Focus questions Notes<br />
4.1 Select causes from the<br />
causal analysis<br />
4.2 Make key choices on<br />
interventions<br />
4.3 Construct the project<br />
hypothesis<br />
4.4 Summarize the project<br />
design in the form of a<br />
logic model.<br />
4.5 Evaluate the overall<br />
impact of the strategy<br />
using rights based and<br />
benefit-harms analysis<br />
• Do the causes make a<br />
significant contribution to the<br />
problem?<br />
• Do they have high synergy?<br />
• Have the cause effect<br />
linkages been selected with<br />
partnering in mind?<br />
• Have you brainstormed a<br />
wide range of possible<br />
interventions?<br />
• Does your list include<br />
interventions "outside the<br />
box"?<br />
• Have you developed sound<br />
criteria for selecting key<br />
interventions?<br />
• Have you constructed a<br />
clear project hypothesis?<br />
• How will you differentiate<br />
between assumptions and<br />
key questions?<br />
• Does the project hypothesis<br />
illustrate clear cause-effect<br />
logic?<br />
• Have you added more detail<br />
to the project hypothesis<br />
with at least an initial matrix<br />
showing the links between<br />
goals, objectives and<br />
planned activities?<br />
• Have you evaluated your<br />
project strategy and<br />
interventions for potential<br />
unintended impacts?<br />
• How will you respond to<br />
opportunities or constraints<br />
to maximize the project's<br />
overall positive impact?<br />
81
Project Design Handbook<br />
82<br />
Reflective<br />
practice<br />
Holistic<br />
appraisal<br />
Coherent information<br />
systems<br />
Chapter 5<br />
Coherent Information Systems<br />
Clear Goals/ Indicators<br />
Benchmarks<br />
Outputs, Activities & Inputs<br />
Planning for Monitoring and Evaluation<br />
Analysis &<br />
Synthesis<br />
Focused<br />
strategy<br />
Chapter 5 discusses the formulation of clear goals and objectives,<br />
benchmarks, and indicators for measuring progress. These elements<br />
form the basis for a coherent information system, which is based on and<br />
provides complementary detail to a logic model. It is the responsibility of<br />
the project designers to develop a preliminary monitoring and evaluation<br />
plan that can be validated after the project baseline has been<br />
completed.
Chapter 5 – Coherent Information Systems<br />
Chapter 5: Coherent Information Systems<br />
5.1 Goals<br />
Establishing goals and selecting indicators are key steps in the design of a<br />
good project. Even a well-designed project can turn out poorly if the goals<br />
are not clearly defined before implementation. Other stakeholders can also<br />
be misled if the goals are not clearly stated. Fuzzy or poorly articulated goals<br />
can be interpreted differently; thus, people may never agree whether or not<br />
they are being met during implementation.<br />
In simplest terms, the goals are the specification of what the project wants to<br />
accomplish. There are some important concepts to know about establishing<br />
goals:<br />
■ Any project that you design must be logical in terms of the impact<br />
goal that benefits people in some way. If a project does not have<br />
a real and meaningful benefit, why bother? Make sure the impact<br />
goal of a project meets your organization’s criteria for meaningful<br />
change. You should be able to clearly describe outcomes,<br />
magnitude of changes, and the benefits to the target population<br />
of achieving the goal.<br />
■ Project goals should link to a larger program goal. Within CARE,<br />
there is an effort to develop cohesive design, planning and<br />
evaluation guidelines that link projects to wider programmatic<br />
strategies. Projects should operate within this programmatic<br />
framework. Project designers must establish achievable goals<br />
that make significant contributions to goals at the higher program<br />
level.<br />
■ Project goals must be carefully thought out and should link back<br />
directly to the problem analysis. Even the most obvious<br />
questions as to the worthiness of the goal should be asked.<br />
■ Goals need to be developed by consensus among the key<br />
stakeholders (including participants and partners) and reviewed<br />
periodically to assess their validity. Don’t get trapped into trying<br />
to achieve a goal that cannot be attained due to changes in<br />
circumstances.<br />
Of course, even projects with inappropriate goals can be implemented. If<br />
your goal is to build a bridge over the Nile River, you might feel satisfied<br />
when the bridge joins the two banks of the river. However, if the bridge<br />
collapses under the weight of rush-hour traffic, your bridge project really<br />
wasn’t of much use. In fact, it was a waste of money and had serious<br />
negative impact.<br />
83
Project Design Handbook<br />
84<br />
What’s in a Name?<br />
You may notice that the terminology used in these guidelines may be<br />
different from what you are accustomed to. All development projects follow<br />
the general project logic hierarchy as presented in this handbook in the<br />
Introduction (Figure 3). Some insert additional intermediate logic steps<br />
between the elements described here. Most organizations also create their<br />
own terminology that corresponds to the different levels of the hierarchy. For<br />
example, the terms Overall Goal, Final Goal, Overall Objective and Strategic<br />
Aim all refer to impact-level changes but each is used, or has in the past<br />
been used, by a different organization. Each organization may want to<br />
believe that they are approaching project design in a unique manner, but the<br />
fact is projects are all based on a cause-effect, logical hierarchy. Table 11<br />
compares the terminologies used by different international donors 14 .<br />
5.1.1 Definitions and Characteristics of Goals<br />
In order to develop goals, however, we need to be clear on what they<br />
represent. For CARE, the goal that corresponds to the specific problem or<br />
opportunity we are trying to address is called the project final or impact goal.<br />
The intermediate or effect objectives are the intended changes that must be<br />
achieved to accomplish the impact goal.<br />
Impact Goal (Project Final Goal)<br />
The ultimate aim or purpose of the project, written to reflect an improvement<br />
in human conditions expected to take place in a target group.<br />
Example: <strong>By</strong> the end of 2007, 8000 small farm families in the Rio<br />
Blanco community will have increased their incomes by 20%<br />
over what they were in 2002.<br />
Characteristics of an Impact Goal<br />
Presents the anticipated improvements in some aspect of the lives of<br />
project beneficiaries.<br />
Describes what you expect the project setting to be like after<br />
interventions have been completed.<br />
Is the result of the achievement of all effect-level objectives.<br />
Contributes to higher (program) goals (broader consequences).<br />
Must be significant, yet achievable and measurable during the life of a<br />
project. 15<br />
Must also be realistic - do not state that a project can accomplish<br />
more than it possibly can. This implies that the targets must be based<br />
on evidence, and are therefore able to be justified, not just pulled out<br />
of the air to make a proposal look good.<br />
The impact goal statement includes:<br />
• Identification and number of intended beneficiaries<br />
• Type of foreseen improvement (quality change) / impact<br />
• When change is expected to take place (time)<br />
14 Note: Different documents produced by these agencies may contain different terminologies.<br />
15 See CI Project Standard #6.
Table 11: Comparison of Donor Agency Terminologies for Results/Logical Frameworks<br />
Chapter 5 – Coherent Information Systems<br />
Ultimate Impact Long-term Outcomes Intermediate Outcomes Outputs Interventions<br />
CARE terminology 16 Program Impact Project Impact Effects Outputs Activities Inputs<br />
CARE logframe Program Goal Project Final Goal Intermediate Objectives Outputs Activities Inputs<br />
AusAID 17 Scheme Goal Major Development Objectives Outputs Activities Inputs<br />
CIDA 18 , GTZ 19 Overall goal Project purpose Results/outputs Activities Inputs<br />
DANIDA, DFID 20 Goal Purpose Outputs Activities<br />
European Union 21 Overall Objective Project Purpose Results Activities<br />
FAO 22 , UNDP 23 , NORAD 24 Development Objective Immediate Objectives Outputs Activities Inputs<br />
PC/LogFrame 25 Goal Purpose Outputs Activities<br />
UNHCR 26 Sector Objective Goal Project Objective Outputs Activities Inputs<br />
USAID Logframe 27 Final Goal Strategic Goal/<br />
Objective<br />
USAID Results<br />
Framework 28<br />
Strategic<br />
Objective<br />
Intermediate results Activities 202E<br />
Intermediate Results Outputs Activities Inputs<br />
World Bank Long-term Objectives Short-term Objectives Outputs Inputs<br />
16 CARE Impact Guidelines, October 1999.<br />
17 AusAID NGO Package of Information, 1998<br />
Compiled by Jim Rugh for CARE International and InterAction’s Evaluation Interest Group<br />
18 Guide for the use of the Logical Framework Approach in the Management and Evaluation of CIDA’s International Projects. Evaluation Division.<br />
19 ZOPP in Steps. 1989.<br />
20 A Guide to Appraisal, Design, Monitoring, Management and Impact Assessment of Health & Population Projects, ODA [now DFID], October 1995<br />
21<br />
Project Cycle Management: Integrated Approach and Logical Framework, Commission of the European Communities Evaluation Unit Methods and Instruments for<br />
Project Cycle Management, No. 1, February 1993<br />
22<br />
Project Appraisal and the Use of Project Document Formats for FAO Technical Cooperation Projects. Pre-Course Activity: Revision of Project Formulation and<br />
Assigned Reading. Staff Development Group, Personnel Division, August 1992<br />
23<br />
UNDP Policy and Program Manual<br />
24<br />
The Logical Framework Approach (LFA). Handbook for Objectives-oriented Project Planning.<br />
25<br />
PC/LogFrame (tm) 1988-1992 TEAM technologies, Inc.<br />
26<br />
Project Planning in UNHCR: A Practical Guide on the Use of Objectives, Outputs and Indicators for UNHCR Staff and Implementing Partners, Second Ver. March 2002.<br />
27 The Logical Framework Approach to portfolio Design, Review and Evaluation in A.I.D.: Genesis, Impact, Problems and Opportunities. CDIE, 1987.<br />
28 Results Oriented Assistance Sourcebook, USAID, 1998.<br />
85
Project Design Handbook<br />
86<br />
In other words, a good goal statement should clearly identify who is to<br />
benefit, in what way, how much and by when. A well-articulated goal should<br />
provide clear guidance to project implementers and project evaluators. See<br />
Issues Box 32 later in this chapter for more specific guidelines.<br />
Effect Objectives 29<br />
The intended changes in systemic conditions or behaviors that must be<br />
achieved in order to accomplish the impact goal; that is, each effect objective<br />
is a necessary condition to achieving the impact goal.<br />
They reflect changes in behavior by members of the target group or of<br />
systems that influence them; changes that are needed to bring about positive<br />
change in human condition (reflected in the impact goal). Typical effect<br />
objectives include, for example, such things as functioning farm credit<br />
systems (systemic), adoption and correct use of appropriate technology<br />
(behavioral).<br />
Example: <strong>By</strong> December 2004, 3000 participating farmers from<br />
Rio Blanco Province will be using improved seeds and<br />
appropriate cropping practices.<br />
Characteristics of Effect Objectives<br />
Describe the reported changes in system conditions or behaviors that<br />
must take place in order to achieve the impact goal.<br />
An essential condition to achieve the impact goal.<br />
Indicate what practices will change and how and when the foreseen<br />
change will take place.<br />
Verifiable at some point during or at the completion of the life of the<br />
project.<br />
Described as endpoints, not processes.<br />
5.1.2 Linking Goal Statements to Causal Analysis and<br />
Interventions<br />
Up to this point, we have focused on identifying problems and causes and<br />
developing interventions to address selected causes. In addition, we have<br />
developed a project hypothesis diagram to describe how our proposed<br />
interventions will lead to the anticipated outcomes. These anticipated<br />
outcomes form the core of our goal statements for the project. Table 12 (next<br />
page) summarizes the cause and effect logic in a typical project. You can<br />
see how the logic is related as we move from causal analysis to the hierarchy<br />
of goals and objectives.<br />
29 In our business the word ‘goal’ is often used interchangeably with ‘objective.’ We are here proposing<br />
that what has typically been referred to in CARE as ‘intermediary objectives’ we identify as ‘effect<br />
objectives’ to clearly identify the level in the hierarchy they address. Since we already have Program<br />
Impact Goal and Project Impact Goal (See Table 11), we’re using ‘effect objectives’ to make the<br />
distinction.
Chapter 5 - Coherent Information Systems<br />
In Chapter 3, we established the cause and effect logic of the causal analysis<br />
as follows:<br />
General sociocultural<br />
Attitudes,<br />
beliefs,<br />
knowledge<br />
<br />
Behaviours <br />
Specific<br />
& political factors Systemic factors <br />
conditions<br />
Systemic<br />
conditions<br />
<br />
Broad<br />
conditions<br />
This translates to the problem and its causes in this way:<br />
Indirect Causes Direct Causes Problem<br />
(Attitudes/Beliefs) (Behaviors) (Specific or Broad Condition)<br />
Problem<br />
In Chapter 4, we developed interventions to directly address the causes that, in turn, would<br />
address the problem.<br />
Interventions Causes (Direct and Indirect) Problem<br />
(Outputs) (Effect Objectives) (Impact Goal)<br />
Table 12: Cause and Effect Logic in a Typical Project (agricultural example)<br />
Levels of the<br />
Causal Analysis<br />
Broad Condition<br />
(poverty)<br />
Specific Condition<br />
(low production)<br />
Behaviors<br />
(poor planting<br />
practices)<br />
Attitudes & Beliefs<br />
(tradition must be<br />
followed)<br />
Social, Political,<br />
Economic, Cultural<br />
and Environmental<br />
Factors<br />
(no access to<br />
improved<br />
technologies)<br />
Output of the<br />
Causal Analysis<br />
Problem<br />
(low income)<br />
Direct (Immediate)<br />
Causes<br />
(high soil erosion/low<br />
fertility)<br />
Indirect (Secondary)<br />
Causes<br />
(farmers plant on steep<br />
slopes)<br />
Behavioral Causes<br />
(farmers plant in<br />
vertical rows; do not<br />
practice contour<br />
planting)<br />
Output of the<br />
Strategy Selection<br />
Problem<br />
(low income)<br />
Particular Cause<br />
(high soil erosion/low<br />
fertility)<br />
Causes<br />
(farmers plant on steep<br />
slopes)<br />
Interventions<br />
(extension education)<br />
Hierarchy of Effect<br />
and Impact Goals<br />
Program Impact Goal<br />
(increase income)<br />
Project Impact Goal<br />
(increase yields)<br />
Effect Objectives<br />
(farmers will adopt new<br />
cropping practices,<br />
including contour<br />
planting)<br />
Outputs<br />
(establish extension<br />
system)<br />
Activities<br />
(hire and recruit<br />
extension workers;<br />
organize farmer groups;<br />
conduct trainings)<br />
Inputs (labor, cash,<br />
transportation<br />
necessary to establish<br />
extension service)<br />
In this cause-effect logic, the project interventions generate outputs; the<br />
effects of the project are the result of achieving intermediate or effect<br />
objectives, which address attitudes, beliefs and behaviors of the target<br />
Cause and<br />
Effect Logic<br />
Ultimate Impact<br />
(poverty condition)<br />
Intermediate<br />
Impact<br />
(increased<br />
productivity)<br />
Effects<br />
(change in<br />
behavior)<br />
Outputs<br />
(goods & services<br />
produced)<br />
Processes<br />
(activities to turn<br />
inputs into<br />
outputs)<br />
Inputs<br />
(resources<br />
necessary to<br />
achieve outputs)<br />
87
Project Design Handbook<br />
88<br />
population; and the impact of the project is the final or impact goal, which<br />
addresses the problem and relates to a fundamental change (improvement)<br />
in human condition.<br />
The table in Issues Box 30 shows an example of how the problem, causes<br />
and interventions can be converted into impact goals and effect objectives<br />
and outputs in a water project.<br />
Example of problem hierarchy and goal statements for a water project<br />
Problem Impact Goal<br />
High incidence of water/excretarelated<br />
disease among villagers in Bella<br />
District<br />
Causes Effect Objectives<br />
Villagers do not have access to<br />
adequate clean water<br />
Villagers do not wash hands regularly;<br />
Fecal contamination gets into food<br />
Villagers do not use latrines<br />
Interventions Output Targets<br />
Drinking Water System<br />
Hygiene Education<br />
Latrines<br />
Issues Box 30<br />
To decrease incidence of excreta/water-related disease<br />
by 10% (from X% to Y%) in project villages by the end<br />
of 2007.<br />
To increase the percent of villagers who use potable<br />
water from 10% to 75% by 2007.<br />
To increase by the number of villagers that properly use<br />
improved hygiene practices by 2004.<br />
To increase usage of latrines by village HHs from 0% to<br />
50% by the end of the project.<br />
W number of drinking water systems serving X<br />
households<br />
Y number of people completing training<br />
Z number of latrines built<br />
Characteristics of Clear and Precise Goals<br />
Impact and Effect goals must be specific (what and when) and measurable<br />
(how much) and must describe what is desirable (suitable and appropriate<br />
for the situation) and obtainable (realistic). The ‘SMART’ checklist (Issues<br />
Box 31, next page) helps define proper impact and effect goals. A goal<br />
statement does not necessarily have to be written to provide all of the<br />
specificity required to meet the above criteria. However, if it does not do so,<br />
then details must be provided in an operational definition. Annex 5.10 is a<br />
practical exercise on how to write clear, precise goals.
Operational Definitions<br />
We use operational definitions to describe<br />
more precisely the terms used in goal<br />
statements. They facilitate the selection<br />
and evaluation of indicators by describing<br />
the details embedded in or implied by goal<br />
statements. Making use of operational<br />
definitions allows the design team to<br />
simplify and shorten goal phrases.<br />
Examples of terms that require these<br />
definitions include: appropriate, efficient,<br />
Chapter 5 – Coherent Information Systems<br />
Definition Box 24<br />
Operational Definition<br />
Describes specifically the terms used in goal<br />
statements and indicators to simplify and<br />
shorten those statements and provide<br />
practice in selecting appropriate indicators.<br />
effective, strengthened, properly used, well-managed, sustainable, health<br />
status and improve. Technical terms not universally recognized or<br />
understood also require operational definitions. Keep in mind that a term<br />
may be defined differently for different projects depending on context.<br />
Examples of operational definitions for a hypothetical water project appear in<br />
Annex 5.11.<br />
5.2 Indicators<br />
Indicators are quantitative or qualitative<br />
measures that enable one to assess the<br />
degree to which project inputs, activities,<br />
outputs, effects and impact have been<br />
achieved. There are five general types of<br />
indicators:<br />
Definition Box 25<br />
Indicator<br />
A variable, measure or criterion used to assist<br />
in verifying whether a proposed change has<br />
occurred.<br />
Input indicators - describe what goes<br />
into the project, the amount of money spent, the amount of staff time<br />
devoted to the project, infrastructure (training center, office,<br />
transportation) made available;<br />
Issues Box 31<br />
"SMART" checklist for impact and effect goals/objectives<br />
S – Specific .................. Is the goal clear in terms of what, how, when, and where the situation<br />
will be changed?<br />
M - Measurable .......... Are the targets measurable (e.g., how much of an increase or how many<br />
people)? What evidence will there be of goal achievement?<br />
A - Area-Specific ...... Does the goal delineate an area (village, province, agricultural zone)<br />
and/or a population group (gender, age, ethnic, occupational group)?<br />
R - Realistic ................. Is the project able to obtain the level of involvement and change<br />
reflected in the goal statement? Is it reasonable to expect to produce<br />
this degree of change, based on past experience under similar conditions,<br />
with the level of resources available?<br />
T - Time-Bound .......... Does the goal reflect a time period in which it will be accomplished?<br />
89
Project Design Handbook<br />
90<br />
Activity indicators - document the number of activities or their percent<br />
completion (e.g., - the number of training events completed);<br />
Output indicators - describe the goods and services produced by project<br />
activities (such as the number of community workers trained, the number<br />
of condoms distributed, the number of women enrolled in mothers' clubs,<br />
IEC materials disseminated);<br />
Effect indicators - describe the change in systems or behavior resulting<br />
from achievement of an intermediate goal (such as the number of<br />
community clinics meeting quality of care standards [systemic] or the<br />
number of women breastfeeding their babies for six months [a behavior]);<br />
Impact indicators - measure actual change in conditions of the basic<br />
problem identified, e.g., changes in livelihood status, health, wealth, etc.<br />
Input, activity and output indicators are easier to achieve and measure than<br />
effect and impact indicators, but they provide only an indirect measure of the<br />
success of the project. The project hypothesis may state that the<br />
achievement of certain activities will result in desired change, but outcome<br />
indicators need to be measured to demonstrate it. Activity and output<br />
indicators also provide a standard against which to measure, or assess, or<br />
show, the progress of an activity against stated targets or benchmarks.<br />
The selection of proper indicators can be a delicate task. Try to balance<br />
restrictions such as time and available resources, the need for measurement<br />
accuracy, logistic or cultural restrictions, etc. Some established criteria can<br />
provide guidance, such as the ideal characteristics of indicators listed in<br />
Issues Box 32 below.<br />
Ideal characteristics of indicators<br />
Issues Box 32<br />
MEASURABLE .................... Indicators should be measurable by the use of specific quantifiable<br />
variables and/or through other factual, objective evidence obtained<br />
through qualitative methods.<br />
TECHNICALLY FEASIBLE .. The indicators should be capable of being assessed or measured with the<br />
skills available.<br />
RELIABLE .......................... Conclusions based on these indicators should also be verifiable or<br />
objective if measured by different people at different times and under<br />
varying circumstances.<br />
VALID ............................... Indicators should be capable of measuring the phenomena.<br />
RELEVANT ......................... Indicators should apply to project objectives at the appropriate level in<br />
the hierarchy.<br />
SENSITIVE ....................... They should be sensitive to changes in the situation being observed.<br />
COST EFFECTIVE .............. Information obtained should be worth the time and money involved to<br />
procure it.<br />
TIMELY ............................. It should be possible to collect and analyze and report the data in a<br />
reasonable period of time.
Use of Aggregate and Operational Indicators<br />
Chapter 5 – Coherent Information Systems<br />
It is useful to divide indicators into two broad classes called aggregate (or<br />
broad) and operational. The distinction is beneficial because it helps us to<br />
clarify exactly what we will be measuring, and it helps us link interventions<br />
with indicators. See Table 13 (page 94) for sectoral examples of indicators at<br />
different levels in the project hierarchy.<br />
Aggregate indicators: These indicators<br />
are variables that broadly describe progress<br />
toward a goal. They are useful as an<br />
intermediate step to defining indicators that<br />
are more specific and measurable. In fact,<br />
when we are trying to decide on appropriate<br />
indicators to measure an effect or impact<br />
goal, our first thought is usually an indicator<br />
that generally describes the changes we<br />
want to see occur. The problem is that<br />
Definition Box 26<br />
Aggregate Indicators<br />
Indicators that broadly describe progress<br />
toward a goal. They are useful as an<br />
intermediate step to defining and summarizing<br />
more specific and measurable indicators or<br />
variables.<br />
aggregate indicators are usually not very specific as to what will be<br />
measured, so that if two people were to independently measure the indicator<br />
they would likely measure different things, thus perhaps coming up with<br />
different conclusions.<br />
In the upper part of the example on the next page (issues box 35) are some<br />
examples of effect objectives and aggregate indicators for an agricultural<br />
project. Note that the first indicator would show the farmers whose behavior<br />
reflects safe application of pesticides. The second indicator would reflect<br />
farmers who are using the right pesticides with proper doses, etc. Measuring<br />
both these indicators would give us some information to assess whether the<br />
behavioral changes related to pesticide use are occurring or not.<br />
Operational indicators: Indicators at the<br />
‘aggregate’ level are usually not specific<br />
enough to reflect what is or will be actually<br />
measured in the field. We need to be more<br />
specific in order to develop tools for data<br />
collection and analysis, as illustrated by the<br />
example in Issues Box 33. The first step in<br />
doing this is to look at the operational<br />
definitions that were developed for the<br />
words ‘safe’ and ‘proper’ use. The<br />
interventions related to pesticide use will<br />
Definition Box 27<br />
Operational Indicators<br />
Variables that reflect a sub-set of the<br />
aggregate indicator. They are more specific<br />
in terms of what to measure and are based on<br />
the criteria developed for the aggregate<br />
indicator.<br />
include a number of project activities related to training farmers in specific<br />
methods of pesticide application and use. Eventually we want variables that<br />
measure the adoption rate of the methods being promoted by the project.<br />
These variables are referred to as “operational indicators.” Operational<br />
indicators reflect a sub-set of the aggregate indicator. They are variables that<br />
are more specific in terms of what to measure and are based on the criteria<br />
developed for the aggregate indicator. For each operational indicator, it<br />
should be obvious as to what will be measured.<br />
91
Project Design Handbook<br />
92<br />
Example: Indicator development – aggregate and operational indicators<br />
Incorporating a Rights-Based Approach into coherent information systems<br />
This stage of the program cycle focuses on planning for monitoring and evaluation.<br />
Incorporation of a rights-based approach entails a commitment to various accountability<br />
mechanisms, including ongoing, open engagement with program participants.<br />
Issues Box 33<br />
Effect objective:<br />
50% of project farmers in the Rio Negro community will apply pesticides to potato, beans and<br />
rice fields, using safe and proper techniques, by July 1999.<br />
Aggregate Indicators:<br />
A. % of farmers safely applying pesticides in their fields<br />
B. % of farmers properly applying pesticides in their fields<br />
Operational Indicators (examples):<br />
For aggregate indicator A:<br />
1. % of farmers safely using hand pump sprayers to apply pesticides<br />
2. % of farmers who properly use the coke bottle method to apply pesticides to their crops<br />
during two growing seasons after training<br />
3. % of farmers who wear protective clothing while applying pesticides<br />
For aggregate indicator B:<br />
1. % of farmers who apply pesticides in the recommended dosage<br />
2. % of pesticides applied which are appropriate to control the identified pest or disease<br />
Note: Be clear on the denominator for operational indicators. In the above example, which and<br />
how many farmers are targeted? I.e., how many adapters would it take to be 100%?<br />
See Annexes 5.1-5.3 for examples from various sectors of indicators at<br />
different levels of the project hierarchy.<br />
Issues Box 34<br />
Gauging program impact in relation to the realization of human rights. A rights-based<br />
approach explicitly focuses on people achieving their human rights. Project goals or objectives<br />
should be thought of as concrete steps on the path to realising the rights identified in the<br />
overall program goal. Program goals framed as incremental improvements in livelihood security<br />
are not sufficient without reference to the minimum standards of the human rights framework.<br />
These “minimum conditions for living with dignity” are standards defined in international law,<br />
although the indicators used to measure their achievement are not necessarily well defined.<br />
Recognizing this, CARE has committed to “work with others to define human rights indicators<br />
and apply them as the standard against which we measure impact.” Jones 2001
5.3 Targets and Benchmarks<br />
Setting Goal Targets:<br />
Chapter 5 – Coherent Information Systems<br />
Often project proposals contain targets stated against goals that have not<br />
been carefully thought through. Too often, project designers set<br />
unrealistically high targets, hoping to impress donors. There are examples of<br />
projects that claim they will reduce malnutrition by 40%-50% without even<br />
knowing for sure what the present (baseline) rate is in the target community,<br />
nor by how much similar projects in the past have been able to reduce<br />
malnutrition rates.<br />
A well-written goal includes the statement “change the rate (of the indicator<br />
related to the problem being addressed) from X% to Y%.” To know what X is<br />
requires a baseline survey, done with the same degree of rigor as the<br />
precision that will be required for the final evaluation. To know what the<br />
target (Y) should be requires researching how much change has been<br />
achieved by previous projects working in similar communities. We need to<br />
set goal targets that challenge us to strive for excellence, yet keep them<br />
realistic enough that we’re not embarrassed when the final evaluation reports<br />
what the project actually achieved.<br />
Indicators are simply variables that we measure in order to ascertain whether<br />
a change has occurred. It is fairly easy to propose what change we want to<br />
occur, where and when, but to predict the degree of change sometimes<br />
seems impossible. Despite this difficulty, it is essential for monitoring and<br />
evaluation that project designers estimate the magnitude of change you<br />
expect for each indicator and the rate of change over time.<br />
In order to understand the rate of change<br />
over time of an indicator, we need to<br />
establish benchmarks. Benchmarks are<br />
expected values or levels of achievement<br />
at specified periods of time. For example,<br />
suppose you have a five-year project and,<br />
Definition Box 28<br />
Benchmarks<br />
Expected values or levels of achievement at<br />
specified periods of time.<br />
in addition to measuring change in use of safe drinking water at the<br />
conclusion of the project, you want to track the number of households using<br />
safe drinking water over time.<br />
Your benchmarks could look like those in the example to<br />
the right. The initial value (year 0) was measured during<br />
the baseline survey. The values 15%, 25%, 40%, 60%<br />
and 85% are benchmarks. These values indicate, for<br />
instance that if households were surveyed at the end of<br />
Year 3 you would expect about 40% to be using safe<br />
drinking water. The benchmark for year 5 – the final<br />
target – would also be the quantity as stated in the<br />
corresponding goal statement. Thus at the end of the<br />
project you expect most of the households (85%) to be<br />
using safe water.<br />
Example: Benchmarks for water<br />
project<br />
Year % of households using<br />
safe drinking water<br />
0 10%<br />
1 15%<br />
2 25%<br />
3 40%<br />
4 60%<br />
5 85%<br />
93
Project Design Handbook<br />
94<br />
It is important to establish benchmarks so that we can track planned<br />
progress. In Figure 13 (below), you see three different curves, A, B and C.<br />
Curve A represents a situation in which you expect the indicator to change<br />
rapidly in the beginning of a project and then the rate of change slows down.<br />
Such is the case with immunization campaigns–as time goes on it becomes<br />
more and more difficult to find people who have not been immunized. Curve<br />
B represents a constant rate of change over the life of the project. A roadbuilding<br />
project might have such a curve since it is probable that about the<br />
same length of road could be laid each year. Curve C represents a slow rate<br />
of change in the beginning and then later in the project the change becomes<br />
very rapid. Such would be the case, for instance, where new farming<br />
practices were being promoted to rural populations. Early on, there would<br />
likely be a reluctance to adopt the new practices, but as people see<br />
successes, they would likely become more willing to try. Of course, the rates<br />
of change might also be the result of factors such as project phasing or<br />
expansion/reduction of activities.<br />
Figure 13: Example - Comparison of Different Benchmark Trends<br />
The rate of change of an indicator can depend on many factors, including<br />
timing of the intervention, level of resources committed to the intervention,<br />
anticipated spread effect of the intervention, etc. Note in the example above<br />
if you measured the indicator between years 3 and 4 you would get very<br />
different values depending on which response curve reflected the expected<br />
rate of change. We set benchmarks so that we know what rate of change to<br />
expect and, thus, help us during monitoring and evaluation to determine if we<br />
are on course.<br />
To estimate final benchmarks, which need to be reasonably accurate and<br />
realistic, make use of information from a variety of sources. The ‘Final<br />
Benchmark’ or target value is the desired level of an indicator that one<br />
expects to see as the result of the changes brought about through the<br />
implementation of an intervention. Secondary sources can often provide
Chapter 5 – Coherent Information Systems<br />
average values for the indicator at national, regional and local levels. Project<br />
documents may be available that show the results of similar interventions in<br />
other zones. Design teams should also consider other resources available to<br />
their project and potential limitations to achievement. <strong>By</strong> analyzing all of this<br />
information, the team should reach an acceptable figure as a final benchmark<br />
or goal target. Table 13 provides a tool to help us record and use this<br />
information to arrive at realistic and achievable final benchmark values:<br />
Table 13: Final Benchmark Value Tool<br />
Indicator<br />
Indicator<br />
value, as<br />
found<br />
through a<br />
baseline<br />
study at the<br />
community<br />
level<br />
Indicator value<br />
at the<br />
municipal or<br />
department<br />
level (from<br />
secondary<br />
sources)<br />
Trend that<br />
the indicator<br />
shows in<br />
national<br />
surveys<br />
(from<br />
secondary<br />
sources)<br />
Changes that have<br />
been achieved in<br />
the indicator in the<br />
past, through<br />
implementation of<br />
similar projects<br />
5.4 Outputs, Activities and Inputs<br />
Reported values<br />
of the indicator<br />
for sectors of<br />
the population<br />
that have<br />
better living<br />
standards (for<br />
example, urban<br />
vs. rural<br />
sectors)<br />
Now that goals and indicators at the effect and impact levels have been<br />
determined and appropriate interventions developed, the hard work of project<br />
design is over. While the earlier stages of project design can be very difficult,<br />
particularly problem analysis and definition of goals and indicators, it is<br />
relatively easy deciding on outputs, activities and inputs. Nevertheless,<br />
defining outputs, activities and inputs along with corresponding indicators is<br />
essential to establishing a project monitoring and evaluation plan. Indeed,<br />
these steps should be completed before any project begins.<br />
The clearer the goal, the easier it is to define what actions or interventions<br />
need to be taken to bring about the change that will lead to the fulfillment of<br />
that goal. We refer to these actions that the project will take as its activities.<br />
They require resources, have a sequence and have persons responsible for<br />
carrying them out. It is critical to monitor and periodically revise activities as<br />
experience is gained, and as conditions change. Through activities, outputs<br />
may be achieved. Outputs are the products needed to assure expected<br />
change at the effect level, and eventually the achievement of the desired<br />
impact.<br />
Basic steps for developing project outputs, activities and inputs:<br />
1. Define outputs for each effect objective. The project team must<br />
decide what products will be needed to assure expected change at<br />
Final<br />
Target<br />
Benchmark<br />
(End of<br />
Project<br />
Status)<br />
95
Project Design Handbook<br />
96<br />
the effect level. Remember that for successful monitoring and<br />
evaluation, the link between outputs and the corresponding effect<br />
objectives must be clear. Indicators for output goals are typically a<br />
simple enumeration of products or services delivered.<br />
2. Develop activities and targets for each output. The list of activities<br />
should include both actions to be taken and proper sequence for<br />
implementation. In addition, timeframes and quantified targets are<br />
important components of each activity goal. As with output objectives,<br />
indicators usually require project monitors to record the number of<br />
activities successfully implemented. Well-written activity statements<br />
include a precise verb, quantified target and timeframe. (See<br />
examples in Issues Box 35, below)<br />
3. Define inputs. Objectives at this level are simply the quantities of<br />
basic resources required (money, materials, technical assistance) for<br />
each activity. Typically the budget shows most of these.<br />
Example: Developing project outputs for three projects<br />
Tree planting example:<br />
Output Objective - 2000 trees planted by 2007<br />
Output Indicator - number of trees planted and surviving<br />
Sustainability Indicator – number of trees surviving after two years<br />
Issues Box 35<br />
Institutional Capacity Building example:<br />
Output Objective – Trained staff of partner agency have enhanced skills in extension<br />
education<br />
Output Indicator – Number of staff passing a test of knowledge and demonstration of<br />
skills<br />
Sustainability Indicator – Partner agency has demonstrated competency to continue<br />
effective extension program on its own.<br />
Advocacy project example:<br />
Output Objective – Advisors to the Minister of the Environment recommend adoption of<br />
comprehensive environmental policy.<br />
Output Indicator – Number of government-level key policy makers that favor proposed<br />
environmental policy.<br />
Sustainability Indicator – Number of community representatives actively involved in<br />
drafting environmental policy, and learning how to conduct similar advocacy<br />
campaigns.<br />
[Last example from CARE Advocacy Tools and Guidelines, 2001]
DME Capacity<br />
Chapter 5 – Coherent Information Systems<br />
5.5 Planning for Monitoring and Evaluation<br />
Up to this point, the design team has<br />
assigned clear and precise goals (or<br />
Definition Box 29<br />
objectives) at each level of the project<br />
Monitoring and Evaluation Plan<br />
hierarchy, selected corresponding<br />
Describes what steps will be taken to monitor<br />
indicators to allow for measurement of<br />
change, and summarized this information in its process and evaluate the progress towards<br />
the logic model. <strong>By</strong> following a systematic achieving effect and impact goals.<br />
cause-and-effect approach to project design<br />
and summarizing this information in the<br />
logic model, we have set the foundation for a project monitoring and<br />
evaluation plan. Note that the development of a project logic model<br />
(logframe) is an iterative process. As goals and indicators are more precisely<br />
defined, and the M&E plan is being developed, it would be good to refine the<br />
logic model.<br />
An M&E plan outlines what information needs to be collected during and after<br />
the life of the project, in order to assess the completion of activities and<br />
outputs and achievement of effect and impact goals.<br />
It is important for the project design process to include planning for<br />
monitoring and evaluation to ensure coherence and continuity between<br />
project design, monitoring of implementation and evaluation of results. It is<br />
also important to develop a plan during the design stage so that monitoring<br />
and evaluation activities can begin prior to or shortly following project start-up<br />
– particularly a baseline study, and to ensure that adequate resources are<br />
budgeted and directed toward conducting M&E activities.<br />
Issues Box 36<br />
Findings from an assessment of CARE's Design, Monitoring and Evaluation (DME) capacity<br />
worldwide show that many project design teams are increasingly developing SMART goals<br />
(65% of projects) and logical frameworks (84% of projects) in the project design phase. The<br />
use of sound logic models demonstrates attention to the causal linkages between inputs and<br />
impact among CARE project teams. Fewer projects, however, take the logic model one step<br />
further to develop a monitoring and evaluation plan – an important step to ensure project<br />
continuity and coherence. Johri 2002<br />
In this chapter, we will define M&E and summarize some useful approaches<br />
and tools, emphasizing the importance of developing an M&E plan as a part<br />
of a coherent information system. CARE staff should particularly note the<br />
wise guidance provided by the CI Project Standards (see Annex 1.1), and the<br />
related Impact Guidelines. A number of other resources for M&E are<br />
available to project design teams, including the How Are We Doing? basic<br />
97
Project Design Handbook<br />
98<br />
CARE M&E guidelines 30 . Currently, CARE is developing Baseline &<br />
Evaluation Guidelines, an additional essential reference for CARE project<br />
managers and staff.<br />
Monitoring and Evaluation Defined<br />
Definition Box 30<br />
Monitoring<br />
The process of routinely gathering<br />
information on the process of project<br />
implementation.<br />
Definition Box 31<br />
Evaluation<br />
An assessment of the extent to which a<br />
project is achieving or has achieved its stated<br />
outcome goals.<br />
Monitoring is the process of routinely<br />
gathering information with which to make<br />
informed decisions for project management.<br />
Monitoring provides project managers with<br />
the information needed to assess the current<br />
project situation, identify project trends and<br />
patterns, keep project activities on schedule,<br />
and measure progress toward expected<br />
outcomes.<br />
Close monitoring allows project teams to adapt project strategies, make<br />
decisions regarding human, financial and material resources, minimize<br />
project costs and enhance effectiveness. Monitoring is an essential and<br />
continuous management practice that should be written into the project work<br />
plan, and should incorporate participants' own criteria. A monitoring system<br />
should be in place before project start-up to allow for the collection of useful<br />
and timely information throughout the life of the project. Table 14 (page 101)<br />
provides information guidelines for project monitoring.<br />
Evaluation is the process of gathering<br />
information to inform judgments about a<br />
project’s achievements and value. Some<br />
evaluations are conducted to determine<br />
whether a project has met (is meeting) its<br />
goals. Others examine whether or not the<br />
project hypothesis was valid, and whether or<br />
not it addressed priority needs of the target<br />
community. Depending on the purpose of a particular evaluation, it might<br />
assess project progress in the work plan, the establishment of systems,<br />
implementation of activities, production of intended outputs, achievement of<br />
outcome goals, cost-efficiency, effectiveness, impact and/or sustainability.<br />
Findings from evaluations allow project teams and stakeholders to learn from<br />
experience to improve future activities and intervention strategies. While<br />
monitoring is an ongoing activity, evaluations occur periodically, typically at<br />
mid-term and at the end of the project. See Issues Box 37 (page 100) for a<br />
summary of useful evaluation approaches and tools.<br />
• A Baseline Study is the first phase of a project evaluation. It is used to<br />
measure the ‘starting points’ of indicators of effect and impact. Baseline<br />
data collection allows organizations to begin the process of measuring<br />
progress toward achieving their goals. The baseline study differs from<br />
assessments conducted during the Holistic Appraisal stage in that it<br />
30 Barton 1997.
Chapter 5 – Coherent Information Systems<br />
focuses on the specific information needs derived from indicators of<br />
intended outcomes in the logic model (M&E plan).<br />
• Process and formative evaluations occur during the course of the<br />
project (typically at mid-term) to assess activities or functions to make<br />
recommendations for improving project implementation.<br />
• Summative evaluations are carried out at the end of a funding period to<br />
assess positive and negative impacts and examine the effectiveness of a<br />
project. Lessons learned from final evaluations should contribute to the<br />
formation of future projects and programs.<br />
Monitoring and Evaluation Plans<br />
A monitoring and evaluation plan should be developed during or immediately<br />
after project design. The elements of the plan derive from the project<br />
hierarchy and indicators summarized in the logic model. To complete the<br />
M&E plan, all that is required is the incorporation of additional project details<br />
such as the specific information on the data necessary to measure indicators,<br />
the logistics of data collection, and broad guidelines for analysis of data and<br />
interpretation and dissemination of results. Table 14 (page 101) provides an<br />
example of a monitoring and evaluation plan for evaluating effect objectives.<br />
Annex 5.9 provides a sample framework for a monitoring and evaluation<br />
system plan based on the project hierarchy.<br />
Characteristics of a Monitoring and Evaluation System Plan:<br />
• Derive from the logic model. The best way to ensure coherence<br />
and continuity between project design and subsequent monitoring and<br />
evaluation stages is to use project planning tools such as logic<br />
models, not only to summarize project strategy but also as a basis for<br />
planning, monitoring and evaluation. It is essential to review logical<br />
frameworks or equivalent logic models at the outset of each stage of<br />
the monitoring and evaluation process.<br />
• Relate to program monitoring and evaluation. Project managers<br />
should focus on achieving and measuring goals at the project level<br />
rather than the program level. A good project design, however,<br />
should be able to demonstrate how the project’s goals contribute to a<br />
higher level program goal.<br />
• Establish a management information system for complete,<br />
accurate and timely information for a monitoring and evaluation<br />
system. A design, monitoring and evaluation information system<br />
(DME-IS) is the set of activities, staff, equipment and processes<br />
necessary to collect, manage, analyze, report and disseminate<br />
information useful for decision-making. Ideally, the system should be<br />
in place at the time of project start-up, including a clear workplan with<br />
responsibility assignments and a realistic budget/resource plan.<br />
• Include collection of baseline data. In Chapter 3 we reviewed the<br />
Holistic Diagnostic Assessment stage of project design. We use this<br />
information to inform project design and develop sound goals and<br />
99
Project Design Handbook<br />
100<br />
indicators based on cause-and-effect linkages. In contrast, a baseline<br />
study should focus on measuring the initial status of indicators of<br />
effect and impact within the corresponding target populations, using<br />
both qualitative and quantitative techniques. Baseline studies must<br />
describe indicators at the start of the project with enough precision to<br />
allow for later evaluation to clearly measure change over the life of<br />
project as compared with this initial assessment. This means that the<br />
same indicators must be measured in the same population using the<br />
same methodology for at least two points in time.<br />
Monitoring Processes and Measuring Systems: an RBA Framework<br />
Issues Box 37<br />
Monitoring processes. Within a rights framework, inclusion, participation, and empowerment<br />
become essential program objectives, not only for their potential to enhance our impact on food,<br />
health, and educational insecurity, although this is important, but, rather, in their own right. A<br />
rights-based approach requires a commitment to evaluating impact not only in outcome terms<br />
(i.e., in terms of conditional change), but also in terms of systemic addressing of rights and<br />
responsibilities.<br />
Adapting and extending our measurement systems. The HLS framework compels us to<br />
understand better and document the household-level impact of our programs. This is harder to<br />
do with higher-level, longer-term rights-based interventions than it is for standard service<br />
delivery projects. The former raise questions concerning the household-level impact of often<br />
longer-term effects that rights-based programs have on, among other things, participation in<br />
public affairs, capacities of local groups, institutional policies and practices, and legal and other<br />
systems. It is important that we develop intermediate and community-level measures and<br />
indicators for tracking these often less tangible, slower to materialize changes at the local level.<br />
Jones 2001
Evaluation Approaches and Tools<br />
Chapter 5 – Coherent Information Systems<br />
Issues Box 38<br />
The most commonly used tools for data collection in evaluation are described below, including<br />
important advantages and disadvantages.<br />
• Surveys These are standardized written instruments that contain questions about the<br />
issues being evaluated. Sample surveys are complementary to and often informed by<br />
participatory methods. Advantages of sample surveys: they generate detailed<br />
information about a population from a small sample, answers to standardized questions<br />
allow comparisons across groups, and data can be aggregated quickly. Disadvantages -<br />
they are highly extractive, can be costly, are often poorly implemented leading to<br />
measurement error, take time to process, and have a tendency to collect too much data.<br />
• Participatory Rapid Assessments These are interactive techniques with open-ended<br />
questions and exercises for exploration of program issues. Advantages - they have<br />
substantial strength in qualitative information, ordering of priorities, income/wealth<br />
ranking and involvement of distinct social groups. They are often quick and low cost, can<br />
provide an initial basis for further quantitative work, and can provide insights to<br />
quantitative findings. Disadvantages: they are prone to bias in interpretation, are not<br />
statistically representative, and analyzing and summarizing findings from multiple<br />
community PRAs can be very time-consuming.<br />
• Key Informant Interviews These are interviews using a semi-structured set of topics<br />
and questions with selected individuals approached for their views on the issues.<br />
Advantages - Such interviews are useful to get information on complex issues or<br />
sensitive topics. The key to maximizing the value of this method is triangulation,<br />
meaning that the views and opinions of diverse individuals are solicited. Disadvantages -<br />
some informants may have agendas that are not explicit, and viewpoints of less powerful<br />
groups are not always represented.<br />
• Focus Group Discussions A focus group is a facilitated discussion with 6-12 individuals<br />
using a semi-structured set of open-ended topics or interactive exercises. A key to<br />
success is using pre-set criteria to select homogeneous participants, with the criteria<br />
linked to the discussion topic. Advantages - focus groups can help to: 1) understand how<br />
project participants feel about services; 2) identify reasons for problems in the project;<br />
and 3) develop and test messages for communication or social marketing strategies.<br />
Disadvantages - you cannot reliably generalize findings to a wider population; special<br />
skills are needed to properly analyze data obtained from multiple focus group sessions.<br />
• Individual and Household Case Studies Case studies usually involve a semi-structured<br />
list of questions allowing for a mixture of qualitative and quantitative data to be<br />
collected. The output is usually in the form of a portrait of each individual or household.<br />
Advantages – it can be quite low cost, it can give deeper insights into the lives of<br />
individual households; it can also yield preliminary impact information, including negative<br />
impacts, long before the end of a project. Disadvantages - because random sampling<br />
methods are not usually followed, there is a risk that the cases chosen are too biased or<br />
101
Project Design Handbook<br />
102<br />
Table 14: Sample Monitoring and Evaluation System Plan<br />
A monitoring and evaluation plan should be included as a part of project design. M&E activities should be scheduled on annual<br />
implementation or work plans. Note: To save space on this matrix, rather than repeating details here, just list the monitoring or<br />
evaluation events. In a separate table, give the details (e.g., schedule, data collection methodology, etc.) for each M&E event (e.g.,<br />
baseline, monthly monitoring, annual self-evaluation and report, mid-term and final evaluation, etc.)<br />
Level of<br />
Project<br />
Hierarchy<br />
Impact<br />
Goal<br />
Effect<br />
Objectives<br />
Outputs<br />
Activities<br />
Operational<br />
Indicators<br />
Measures from<br />
the logic model<br />
used to<br />
ascertain or<br />
verify that a<br />
planned change<br />
has occurred.<br />
Data<br />
Needed<br />
What specific<br />
data will be<br />
necessary to<br />
characterize<br />
the indicator?<br />
Depending on<br />
the indicator,<br />
one or many<br />
types of data<br />
(variables,<br />
types of<br />
evidence) may<br />
be needed.<br />
Timeframe<br />
How often will<br />
data be<br />
collected?<br />
(e.g., at<br />
baseline and<br />
project end?<br />
Monthly?<br />
Quarterly?)<br />
Source/<br />
Collection<br />
From where<br />
and how will<br />
the data be<br />
collected?<br />
(e.g.,<br />
household<br />
survey,<br />
community<br />
PRAs,<br />
district-level<br />
secondary<br />
data)<br />
Data<br />
Analysis<br />
How will<br />
the data be<br />
analyzed?<br />
(e.g.,<br />
statistical<br />
tests,<br />
tables,<br />
cross-tabs,<br />
graphs)<br />
Dissemination/<br />
Utilization<br />
What reports will be<br />
generated from the<br />
information? How<br />
and with whom will it<br />
be shared and used to<br />
improve the project?<br />
Responsibilities<br />
Who is responsible<br />
for data collection<br />
and analysis?
Chapter 5 – Coherent Information Systems<br />
Chapter 5 Review:<br />
Coherent Information Systems<br />
Key concepts Focus questions Notes<br />
5.1 Setting clear goals<br />
at the right level<br />
5.2 Defining<br />
appropriate<br />
indicators for<br />
measuring goal<br />
achievement<br />
5.3 Setting realistic yet<br />
challenging targets<br />
and benchmarks<br />
for achievement<br />
5.4 Defining Outputs,<br />
Activities and<br />
Inputs<br />
5.5 Developing a plan<br />
for monitoring<br />
process and<br />
evaluating<br />
outcomes<br />
• Does the project final goal address<br />
impact?<br />
• Do the project’s intermediate<br />
objectives address effect-level<br />
changes?<br />
• Can the goal statements pass the<br />
‘SMART’ test?<br />
• Have aggregate (broad) indicators<br />
been translated into objectively<br />
verifiable (measurable) indicators?<br />
• Do the indicators meet the<br />
characteristics listed in Issues Box<br />
34?<br />
• Were other sources checked for<br />
setting reasonable targets?<br />
• Do you have an approximate estimate<br />
of baseline levels?<br />
• Is the proposed change over the life<br />
of the project reasonable given<br />
experience of others?<br />
• Did you use the Causal Analysis to<br />
identify a set of outputs that will be<br />
needed to achieve each effect<br />
objective?<br />
• Have you described key activities to<br />
produce needed outputs?<br />
• Are the needed inputs included in the<br />
budget?<br />
• Has an M&E plan been drawn up that<br />
adds sufficient detail to the logic<br />
model?<br />
103
Project Design Handbook<br />
104<br />
Reflective<br />
practice<br />
Holistic<br />
appraisal<br />
Coherent information<br />
systems<br />
Chapter 6<br />
Reflective Practice<br />
What is Reflective Practice?<br />
The Role of Reflective Practice in Project Design<br />
Some Tools for Promoting Reflective Practice<br />
Analysis &<br />
Synthesis<br />
Focused<br />
strategy<br />
Chapter 6 discusses reflective practice, a term now used to<br />
denote actions and behaviors that promote continual learning in<br />
a project. In design, reflective practice is an empowering<br />
process.
Chapter 6: Reflective Practice<br />
6.1 What is Reflective Practice?<br />
Self-reflection is much like the process of orienteering, where an individual<br />
uses both map and compass to navigate through unfamiliar territory. The<br />
ultimate goal is to stay on course and find your destination. Reflective<br />
practice is the art of continual self-reflection, which enables us to routinely<br />
assess whether we are on course to achieve our goals. It is a practice that<br />
we often do in our personal lives (for example, as one plots her/his course of<br />
education leading to a career path) but less often in our professions.<br />
Schon (1987), credited as the founder of the concept, describes reflective<br />
practice as a professional activity in which the practitioner (you!) reflects, both<br />
in-action and on-action in order to improve his or her practice. When applied<br />
to development in general and project design in particular, this means that we<br />
both experiment with our own actions while they are being carried out and<br />
evaluate them through verbalizing, writing and appropriating relevant<br />
knowledge about them from other sources. Put another way, reflective<br />
practice is a mode that integrates or links thought and action with reflection.<br />
It requires individuals to assume a role of external observer/evaluator.<br />
According to Schon (1988), the stage is set for reflection when "knowing-inaction"--the<br />
sort of knowledge that professionals come to depend on to<br />
perform their work spontaneously--produces an unexpected outcome or<br />
surprise. This surprise can lead to one of two kinds of reflection: reflection on<br />
action, which occurs either following or by interrupting the activity, or<br />
reflection in action, which occurs during (without interrupting) the activity by<br />
thinking about how to reshape the activity while it is underway. We will get to<br />
some practical illustrations shortly.<br />
Reflection-on-action takes place after the activity, when full attention can be<br />
given to analysis without the necessity for immediate action and when there<br />
is opportunity for the professional to receive assistance from others in<br />
analyzing the event. Project mid-term and final evaluations are a type of<br />
reflection-on-action in which project outcomes are compared to expectations.<br />
Reflection-in-action, which occurs during the event, may be more effective in<br />
improving practice. It results in on-the-spot analysis to adjust and improve<br />
actions even though it requires simultaneous attention to the behavior and<br />
the analysis as if from an external perspective. This reflection consists of<br />
strategies of action, understanding of phenomena, and ways of framing the<br />
situations encountered in day-to-day experience. This reflection-in-action<br />
may take the form of problem solving, theory building, or re-appreciation of<br />
the situation (Schon, 1985). In CARE projects, reflection-in-action depends<br />
on monitoring data for insight as well as individual insight into how systems<br />
and behaviors are changing. Some call this simply learning. Learning is<br />
dependent upon the integration of experience with reflection and of theory<br />
with practice.<br />
Chapter 6 - Reflective Practice<br />
105
Project Design Handbook<br />
106<br />
"Professional practice has at least as much to do with FINDING<br />
the problem as with SOLVING the problem." Schon 1983<br />
6.2 The Role of Reflective Practice in<br />
Project Design<br />
What does all of this, you may be asking, have to do with project design?<br />
Project design is based on what we know and believe at a particular moment<br />
in time. The entire process, even if based on sound cause-effect logic, is<br />
dependent to some degree on imperfect understanding of systems, human<br />
behavior, and the role of external influences. Our project logic is based on<br />
operating environments that change, sometimes in a subtle way, other times<br />
in a not-so-subtle way. As both project designers and project implementers,<br />
we need to constantly challenge the logic of our projects, both to add new<br />
insights as we learn more about the communities and institutions with which<br />
we work, and to make adjustments during implementation to ensure that our<br />
goals are met.<br />
In designing a project, we need to assure that key questions have been<br />
addressed and all relevant assumptions have been identified. We then need<br />
to develop monitoring and evaluation frameworks that effectively track the<br />
livelihood status of the populations with whom we work. Based on such ongoing<br />
‘reality checks’, our reflective practice should contribute to periodic redesign.<br />
Historically, project (and program) information systems have largely been<br />
dependent on a reflection-on-action approach. All too often, learning has<br />
relied on external evaluators, and the identification of ‘best practices’.<br />
Monitoring has often focused on resource flows into the project and on<br />
outputs (goods and services), with less attention to implications.<br />
Reflective practice is a powerful empowering process if it is allowed to nurture<br />
and grow in a project. Project staff are encouraged to question the practical<br />
limits of project interventions, discuss results as they emerge in communities<br />
and institutions, and propose alternative strategies to improve the<br />
effectiveness of project deliverables. It is not only empowering to challenge<br />
staff to be reflective in their practice, it makes good development sense. In<br />
reflective practice, the relationships between outputs and effect changes are<br />
viewed as a dynamic process that takes constant adjustment. In a project,<br />
for example, some often overlooked but critical activities to support this<br />
reflection are monitoring of project assumptions, and analysis of the<br />
implications of changes in program direction within CARE and/or the country<br />
office.<br />
The reflective practitioner in CARE analyzes lessons in order to increase<br />
her/his control over variables that affect changing human behaviors and<br />
systems. Much like action research, the reflective project manager (or any<br />
other staffer) selects a problem to study, collects the necessary data and
analyzes their information to improve their performance by directly studying<br />
their work. Here’s what reflective practice steps may look like from a<br />
development perspective:<br />
• Recognizing barriers to behavioral or systemic change, including<br />
changes in the operating environment;<br />
• Responding to a barrier by recognizing both similarities in other<br />
situations and the unique patterns of the particular situation;<br />
• Framing and reframing the barrier;<br />
• Experimenting with alternatives to discover the implications of various<br />
solutions; and<br />
• Examining the intended and unintended consequences of an<br />
implemented solution and evaluating it by determining whether the<br />
consequences are desirable.<br />
Note that it is important to think about these consequences from the<br />
perspective of all the stakeholders, which, of course, is easiest to do if<br />
representatives of all of them can be regularly included in the reflection<br />
process.<br />
6.3 Tools for Promoting Reflective Practice<br />
Reflective practice is easier said than done, and it requires not only individual<br />
discipline, but also effective support systems and practical tools. In project<br />
design, this discipline is guided by monitoring and evaluation plans but also<br />
relies on other systems that promote reflective practice (e.g., freedom of<br />
expression, collective reflection, etc.). Engaging in reflective practice takes<br />
time and effort but the rewards can be great.<br />
The following practices are things CARE staff can do to promote reflective<br />
practice.<br />
General Strategy<br />
The following “top ten” list summarizes reflective practice processes (Roth<br />
1989):<br />
1. Questioning what, why, and how one does things and asking what,<br />
why, and how others do things<br />
2. Seeking alternatives<br />
3. Keeping an open mind - Comparing and contrasting<br />
4. Viewing from various perspectives<br />
5. Asking "what if...?"<br />
6. Asking for others' ideas and viewpoints<br />
7. Considering consequences<br />
8. Hypothesizing<br />
9. Synthesizing and testing<br />
10. Seeking, identifying, and resolving problems<br />
Chapter 6 - Reflective Practice<br />
107
Project Design Handbook<br />
108<br />
Action Research<br />
There are two main ways to use action research to aid in making decisions as<br />
a development practitioner. The first is to review the literature and apply the<br />
relevant findings to your project. The second is to do an action research<br />
study as part of your project implementation.<br />
In addition to being cyclical, action research tends to be:<br />
• Participative—the clients and informants are involved as partners, or<br />
at least active participants, in the research process – and in the<br />
planning and decision-making based on that research;<br />
• Qualitative—it deals more with language than with numbers; and<br />
• Reflective—critical reflection upon the process and outcome is an<br />
important part of each cycle.<br />
Perhaps the most important part of action research is the reflection on<br />
collected data. Having asked a question that begs an answer, and designed<br />
a plan for collecting that information, staff need to reflect on their experiences<br />
and ask such questions as:<br />
• What were the anticipated effects?<br />
• Were there some unanticipated effects?<br />
• What have we learned from this?<br />
• What might we have to relearn or unlearn in our work?<br />
• What are our next steps?<br />
• Should we stop doing this because it doesn't work as well as we had<br />
planned?<br />
• Continue doing this because it is getting results we find desirable?<br />
• Start doing something else that may be more likely to succeed?<br />
One justification for action research methods is that they can be responsive,<br />
at least in the short term, to the situation in a way that many other research<br />
methods cannot. They can also help mobilize participant target groups to<br />
have significant ‘buy-in’ to the resulting plans and implementation efforts.<br />
DATA<br />
Peters (1991) describes a process called DATA that consists of four steps:<br />
• Describe (practice or system needs to be changed)<br />
• Analyze (identify factors that contribute to current practices)<br />
• Theorize (what alternative approaches are possible)<br />
• Act!<br />
First, the problem, task, or incident representing some critical aspect of<br />
practice that the practitioner desires to change is described. For example, a<br />
CARE field manager may wish to become less directive and more<br />
collaborative in her/his efforts to build capacity of partner organizations.
In the DATA model, the staff member would identify the context in which<br />
capacity building takes place, how s/he feels about the directive approach,<br />
and reasons for changing it.<br />
Next, through analysis, s/he would identify factors that contribute to the<br />
current directive approach. An important part of this stage is to identify the<br />
assumptions that support this approach and bring to light underlying beliefs,<br />
rules, and motives governing capacity building and learning. Here, the staff<br />
member can uncover the theory behind the directive approach.<br />
The third step of the DATA process involves theorizing about alternative ways<br />
of approaching capacity building by taking the theory derived from the<br />
previous step and developing it into a new one. In this step, the staff member<br />
is developing an espoused theory to govern a new, collaborative approach.<br />
Finally, s/he will act and try out the new theory. The goal of this step will be<br />
to minimize any discrepancies between the espoused theory and the theory<br />
in use, but this will only occur through further thought and reflection.<br />
Other tools useful for reflective practice<br />
Case Studies - Case studies are very useful for viewing a situation from<br />
various perspectives, and then reflecting on the circumstances of each<br />
situation in order to inform the direction that future activities should take.<br />
Case studies are also a good reflective practice tool in that they encourage<br />
dialogue with participants, promote documentation, and make practical use of<br />
anecdotes.<br />
Deviant or Extreme Case Sampling – A refinement of the case study<br />
approach is the deviant or extreme case sampling, which facilitates<br />
comparing and contrasting. During implementation, one looks for successes<br />
and failures. This can be with individuals, households, institutions or any<br />
other "unit." In any endeavor, there are those who do well and those who do<br />
not so well. In deviant sampling, one identifies cases where things are going<br />
quite well and cases where things are not going very well at all; then one<br />
studies each to try and determine what the factors of success and failure are.<br />
After this analysis, the elements that make cases more successful can be<br />
applied to the project at large. As well, the factors of failure can be<br />
recognized and avoided. Deviant sampling tests assumptions about<br />
homogeneity and promotes reflection on what goes well and what goes<br />
badly.<br />
Reflective Journaling - A writing out of confusions, frustrations, questions,<br />
intentions, hypotheses, and assumptions pertaining to our work, how a<br />
project is going, or a particular event. Journal entries are informal and are<br />
not a retelling of the event's content, but a summary and reflection of thinking<br />
and awareness of self-talk.<br />
Reflective Discussion - Reviewing the reflective journaling entries either with<br />
peers or supervisor(s) in terms of what happened and what was learned.<br />
Chapter 6 - Reflective Practice<br />
109
Project Design Handbook<br />
110<br />
Retrospection - Drawing together materials, linking to previous reflections,<br />
and developing and articulating those values, beliefs, and concepts that guide<br />
reflective decision-making.<br />
Reflective Supervision - Utilizing a supervisory relationship to review<br />
intentionality, beliefs and base assumptions surrounding a disorientating<br />
professional event can aid in clarifying patterns and themes necessary for<br />
learning and professional growth.<br />
Descriptive Reflection - Descriptive reflection is a documentation process that<br />
includes both a description of events and some reasons for why they<br />
occurred. It is helpful in documenting the interpretation of logic or theory.<br />
6.4 Incorporating a Rights-Based Approach<br />
into Reflective Practice<br />
Reflective practice utilizes and expands upon project logframes and M&E<br />
plans to encompass deeper organizational reflection, learning, and change<br />
management at all stages of program implementation.<br />
Monitoring the intended and unintended results (i.e., benefits and<br />
harms) of our interventions. As emphasized in the rights-based discussion<br />
in Chapter 5, our interventions can harm people’s rights, in spite of our best<br />
intentions. From a rights perspective, what’s important is for us to be aware<br />
of how our interventions may be harmful, to select appropriate indicators to<br />
track overall impact – positive and negative – we are having, and to monitor<br />
these indicators on an ongoing basis. Where harms become more significant<br />
to the point that they may approximate benefits, we need to consider<br />
suspending programs.<br />
Disaggregating data in order to monitor the impact of our programs on<br />
different marginalized groups. Although this was flagged as a crosscutting<br />
principle above, it bears repeating here. To ensure that we are<br />
achieving our intended impact and positively affecting women or other<br />
marginalized groups, it is critical to disaggregate our monitoring and<br />
evaluation data. In addition to gender, other distinctions may be important to<br />
make, for example along racial, ethnic, class/caste, age, or religious belief<br />
lines. Without this disaggregation, it will be impossible to fully monitor<br />
positive and negative (intended and unintended) results.<br />
Learning from a diversity of rights-based approaches and their resulting<br />
impact. Successes and shortcomings in achieving our rights-based goals<br />
and objectives are precisely what we want to explain, with an eye toward<br />
learning from different approaches employed in different contexts. The<br />
program cycle is complete when such learning is folded back into our holistic<br />
analysis, synthesis, and development of focused strategies in the future.<br />
Fostering an internal culture that encourages innovation, dissent, the<br />
airing of disparate views, and critical review. Without such an<br />
organizational culture, the transformative nature of a rights-based approach
will not take hold. And a supportive internal environment is indispensable to<br />
genuine reflection, learning, and change. This is a daunting task, in reality,<br />
comprising shifts in organizational culture, systems, and processes, as well<br />
as in staff composition.<br />
The benefits-harms “impact” and “decision” tools help staff to think about<br />
unintended impacts and make the necessary adjustments when it becomes<br />
clear that programs are having significant negative impacts on people’s<br />
overall ability to live with dignity and self worth.<br />
Chapter 6 - Reflective Practice<br />
111
Project Design Handbook<br />
112<br />
Chapter 6 Review:<br />
Reflective Practice<br />
Key concepts Focus questions Notes<br />
6.1 What is reflective<br />
practice?<br />
6.2 The role of reflective<br />
practice in project<br />
design<br />
6.3 Some tools for<br />
promoting reflective<br />
practice<br />
6.4 Incorporating a<br />
Rights-Based<br />
Approach into<br />
reflective practice<br />
• Do you understand what<br />
reflection in-action and<br />
reflection on-action mean?<br />
• Did you incorporate reflective<br />
practice during your project<br />
design process?<br />
• Has such reflection helped<br />
you improve the project<br />
design?<br />
• Are there plans for continued<br />
reflective practice to be used<br />
to periodically refine the<br />
design?<br />
• Reading over the list of tools<br />
are there some that you see<br />
would be helpful in your<br />
project?<br />
• How can these be built into<br />
your project’s M&E plans?<br />
• What can RBA perspectives<br />
add to the reflective practice<br />
in reviewing your project<br />
design process?<br />
• How can these perspectives<br />
be built into your project’s<br />
M&E plans?
Annex 1.1: CARE International Project<br />
Standards<br />
Introduction: 31<br />
These CARE DME standards apply to all CARE programming (including emergencies,<br />
rehabilitation and development) and all forms of interventions (direct service delivery,<br />
working with or through partners, and policy advocacy).<br />
These standards, as well as accompanying guidelines, should be used to guide the work of<br />
project designers; as a checklist for approval of project proposals; as a tool for periodic<br />
project self-appraisal; and as a part of project evaluation. The emphasis should not be only<br />
on enforcement but also on the strengthening of capacity to be able to meet these standards<br />
for programme quality. At the time of initial approval, if a project can not meet one or more<br />
standards, allow for explanation of why, and what will be done about it. More than a<br />
“passed/failed” checklist, these call for a description of how well a project meets each<br />
standard.<br />
Each CARE project 32 should:<br />
1. be consistent with the CARE International Vision and Mission, Programming<br />
Principles and Values.<br />
Projects and programmes should fit comfortably within the spirit and content of the CARE<br />
International (CI) Vision and Mission statements. In other words, CARE projects should<br />
show how they will contribute, ultimately, towards lasting improvements in human wellbeing,<br />
hope, tolerance, social justice, reduction in poverty, and enhanced dignity and security of<br />
people. They should be guided by CI Programming Principles that synthesize and integrate<br />
with central elements of CARE’s evolving programme approaches, including livelihoods,<br />
basic rights, gender and diversity, partnerships and civil society.<br />
2. be clearly linked to a Country Office strategy and/or long term programme<br />
goals.<br />
Projects should not be isolated, but clearly embedded in long-term multi-project programmes<br />
and strategic frameworks that address the underlying conditions and root causes of poverty<br />
and social injustice. Doing so provides a larger framework in which project decisions are<br />
made, but does not preclude strategic innovation and experimentation. CARE's strategies<br />
should be clearly linked to the development efforts of others (e.g., government, multilaterals,<br />
NGOs).<br />
3. ensure the active participation and influence of stakeholders in its analysis,<br />
design, implementation, monitoring and evaluation processes.<br />
31 Original draft developed by CI Design, Monitoring & Evaluation Advisory Committee (DMEAC) in Atlanta October 1999.<br />
Revised version based on recommendations by IEI-II workshop participants in Wood Norton, UK, 31 August 2001 and followup<br />
communications. Endorsed by CARE USA SMT 16 January 2002; by CI Programme Working Group (PWG) 5 April 2002;<br />
officially approved by CARE International Board 24 May 2002.<br />
32 These standards refer specifically to CARE projects (whether implemented directly or through partners). However, where<br />
there are specific longer-term programme plans these standards should apply to them as well.<br />
Annex 1.1<br />
113
Project Design Handbook<br />
114<br />
Every project should be explicit about its process of participation and consultation, aiming<br />
for openness and transparency. “Stakeholders” will be understood to include target<br />
communities, partner organizations, governments, and CARE staff. The interventions of the<br />
various actors should be coordinated and reinforcing and, individually and together, work<br />
together to achieve sustainable impact.<br />
4. have a design that is based on a holistic analysis of the needs and rights of the<br />
target population and the underlying causes of their conditions of poverty and<br />
social injustice. It should also examine the opportunities and risks inherent in<br />
the potential interventions.<br />
The diagnostic assessment and subsequent analysis should be based upon a clear frame of<br />
reference and include an analysis of problems and their causes from a range of<br />
perspectives including institutional as well as opportunity analysis. Social analyses could<br />
examine how needs and rights are related to gender, social class, ethnicity, religion, etc.<br />
The analysis should lead to an understanding of institutional capacity, power relationships,<br />
and the exercise of rights and responsibilities, as well as household level conditions.<br />
5. use a logical framework that explains how the project will contribute to an<br />
ultimate impact upon the lives of members of a defined target population.<br />
The project plan should be clearly summarized in a logical framework that shows how<br />
proposed interventions and anticipated outputs will result in defined effects and impact. It<br />
should specify level of intervention (household, community, institutional, societal) and how<br />
the project will ultimately contribute to sustainable impact for a specific target population. It<br />
should identify key assumptions and provide validation for its central hypothesis.<br />
6. set a significant, yet achievable and measurable final goal.<br />
A project final goal must be achievable and measurable during the life of the project. This<br />
calls for project designers to clearly define what the project will be held accountable for<br />
achieving. It should be practical and do-able, yet be at the outcome level (intermediary<br />
impact or at least effect) rather than output level.<br />
A project final goal must also be clearly and explicitly linked to, and significantly contribute<br />
to, “higher level” programme or strategic goals. Programme goals should address<br />
underlying causes of poverty and social injustice, but their impact – “equitable and durable<br />
improvements in human wellbeing and social justice” – should be ultimately manifest at the<br />
household or individual level.<br />
7. be technically, environmentally, and socially appropriate. Interventions should<br />
be based upon best current practice and on an understanding of the social<br />
context and the needs, rights and responsibilities of the stakeholders.<br />
The project must be designed in a way that is likely to make a significant and positive<br />
difference, with minimal undesired social or environmental consequences. Interventions<br />
must make reference to technical or sectoral experience or standards, developed by CARE<br />
or others, to demonstrate the viability of their approach. Environmental analysis could<br />
include assessment of current status, analysis of potential impact, and regional<br />
environmental issues. These may require technical appraisal by those with expertise in the<br />
relevant professions.
8. indicate the appropriateness of project costs, in light of the selected project<br />
strategies and expected outputs and outcomes.<br />
Programme designers must be able to defend the budget of a project relative to its outputs,<br />
scale and anticipated impact. Also, the M&E plan should include methods for measuring<br />
cost effectiveness, i.e., to demonstrate that the costs of project interventions are reasonable<br />
and commensurate with the outputs and outcomes achieved.<br />
9. develop and implement a monitoring and evaluation plan and system based on<br />
the logical framework that ensures the collection of baseline, monitoring, and<br />
final evaluation data, and anticipates how the information will be used for<br />
decision making; with a budget that includes adequate amounts for<br />
implementing the monitoring and evaluation plan.<br />
M&E plans should provide sufficient detail to clearly identify evaluation design, sources of<br />
data, means of measurement, schedule for measurement, data processing and analysis,<br />
dissemination of information to and utilization by key stakeholders, and responsibilities for<br />
each of these processes. Sufficient budget should be allocated for designated tasks, and<br />
planning should ensure that CARE staff and partners have the capacity required for their<br />
implementation. Monitoring information should be useful and timely to promote reflective<br />
practice, for management decision-making, and for adapting project approaches and<br />
strategies. M&E plans should incorporate methods to measure risks and assumptions and<br />
to track unintended effects.<br />
10. establish a baseline for measuring change in indicators of impact and effect,<br />
by conducting a study or survey prior to implementation of project activities.<br />
There needs to be a distinction between a diagnostic assessment and a baseline study.<br />
The former gathers a little information about many conditions and is used to inform project<br />
design. A baseline study, on the other hand, should focus on measuring indicators of effect<br />
and impact with a level of rigor required for a “before-and-after” comparison with evaluation.<br />
Baseline studies can use qualitative as well as quantitative data, as long as they describe<br />
the initial situation with sufficient precision to be able to clearly measure changes over the<br />
life of the project.<br />
11. use indicators that are relevant, measurable, verifiable and reliable.<br />
Indicators should be capable of yielding data that can be disaggregated to the individual<br />
level according to criteria that reveal vulnerabilities, such as gender, age and social class.<br />
Both qualitative and quantitative measures are acceptable as long as they can illustrate<br />
discernible and significant change. For indicators to be reliable denotes that they are robust<br />
and will be useful and credible throughout the life of the project. CARE should draw upon<br />
the international development community’s great wealth of experience with indicators.<br />
12. employ a balance of evaluation methodologies, assure an appropriate level of<br />
rigor, and adhere to recognized ethical standards.<br />
Evaluation should be incorporated as standard practice as a basis for accountability and for<br />
documented, institutionalized learning. Although various forms of evaluation should be<br />
planned, such as internal or external, formative (mid-term) or summative (final) or even ex<br />
Annex 1.1<br />
115
Project Design Handbook<br />
116<br />
post (to evaluate sustainability), the minimum is that there should be at least a final<br />
evaluation that summarizes the achievements and lessons learned by the project.<br />
Diagnostic assessments, baseline studies, monitoring, and evaluations should utilize a<br />
balance of methodological approaches to ensure triangulation, a richness of data, and<br />
mutual modifications. Evaluations should assure appropriate levels of rigor and precision in<br />
their designs and selection of methodologies. Informant confidentiality should be protected.<br />
Each evaluation event should draw upon previous ones and anticipate subsequent events.<br />
Evaluation processes must be documented and carefully archived, allowing subsequent<br />
project phases to replicate methods and draw upon comparative data.<br />
13. be informed by and contribute to ongoing learning within and outside CARE.<br />
It is critical that relevant research and previous project evaluations inform the initial proposal<br />
preparation stage. More than that, learning should also apply throughout the life of a project<br />
and beyond. The lessons learned from a project should be adequately documented for<br />
utilization in the design of other projects. Project management should support the<br />
documentation of project processes, including re-designs. Reflective practice, such as the<br />
regular use of monitoring data, should be built into every project. Learning should be an<br />
organization-wide priority supported by frequent meta-evaluations.
Annex 2.1: Operating Environment–Analysis Themes<br />
Sectors<br />
Themes<br />
Small business development sector Health sector Agriculture/natural resource management sector Education sector<br />
Target group Demographic Characteristics<br />
Demographic Characteristics<br />
Demographic Characteristics<br />
Demographic Characteristics<br />
Age and Gender;<br />
• Age and Gender<br />
• Age and gender<br />
• Age and Gender<br />
Education and literacy;<br />
• Education and literacy<br />
• Education and literacy<br />
• Education and literacy<br />
Race/religion/ethnic background<br />
Economic Activities<br />
Significant goods and services;<br />
Scope of operations and sales;<br />
Time in operation of businesses<br />
Cultural Characteristics<br />
Business traditions or customs;<br />
Cultural and group cohesion;<br />
Attitudes towards credit, improved<br />
technology, etc.<br />
• Race/religion/ethnic background<br />
• Family status<br />
Economic Status<br />
• Distribution of household wealth/income<br />
• Economic activities and sources of<br />
household income<br />
• Household expenditures<br />
Cultural Characteristics<br />
• Cultural traditions and attitudes regarding<br />
health themes<br />
• Race/religion/ethnic background<br />
• Family status<br />
Economic Characteristics<br />
• Distribution of household wealth/income<br />
• Economic activities and sources of household<br />
income<br />
• Household expenditures<br />
Cultural Characteristics<br />
• Traditions or customs related to agriculture and<br />
natural resources<br />
• Race/religion/ethnic background<br />
• Family status<br />
Economic Status<br />
• Profile/spread/distribution or relative<br />
household wealth/income<br />
• Economic activities and sources of<br />
household income<br />
• Household expenditures<br />
Cultural Characteristics<br />
• Cultural traditions and attitudes<br />
• Customs related to health care and<br />
disease prevention<br />
• Cultural or group cohesion<br />
regarding formal education<br />
Environment Economic Environment<br />
Significant Endemic Diseases<br />
Economic Environment<br />
Accessibility<br />
• Current inflation rate and historic • Diseases and frequency of occurrence • Local markets for farm and forest products • Distance and accessibility to<br />
trends;<br />
• Historic trends<br />
• Access to regional and international markets<br />
educational institutions<br />
• Current economic growth rate and • Demographic groups most affected Agricultural Sector<br />
• Access issues related to gender,<br />
historic trends<br />
Other Major Health Concerns<br />
• Major and secondary crops; cropping system<br />
race or other demographic<br />
Accessibility<br />
• Concerns (e.g., malnutrition, accidental • Water availability and access<br />
characteristics<br />
• Transport and communications<br />
injury, etc.) and frequency of occurrence • Access to fertilizers, pesticides and other inputs School Environment<br />
•<br />
infrastructure;<br />
Urban/rural population densities<br />
•<br />
•<br />
Historic trends<br />
Demographic groups most affected<br />
• Plant pest problems<br />
Livestock Sector<br />
• Physical quality of schools and<br />
infrastructure<br />
Market Environment<br />
• Market structure;<br />
• Local, regional and external<br />
opportunities;<br />
• Cash or barter economy<br />
Government Policies<br />
• Small business regulations;<br />
• Financial sector regulations;<br />
• Subsidies and tax policies;<br />
• Import and export restrictions<br />
• Chief livestock types and husbandry methods<br />
• Animal disease problems<br />
• Uses of animal products; Exploiting fish or game<br />
Forest and Range<br />
• Distance and access to communal forest and<br />
range land<br />
• Distance to and relationship with national parks<br />
or protected areas<br />
• Common plant species and their uses<br />
Government Policies<br />
• Land tenure policies or customs<br />
• Existence and status of libraries,<br />
laboratories, school gardens, etc.<br />
Instruction<br />
• Training and experience of teachers<br />
• Availability of textbooks and other<br />
materials<br />
• Teacher/student ratios<br />
Government Policies<br />
• National attendance and<br />
performance standards<br />
• National curricula and testing<br />
• Restrictions on use of natural resources<br />
Existing Types of Partners<br />
Types of Health-care providers<br />
Types of Partners<br />
Types of Partners<br />
sources of • Non-governmental organizations • Government hospitals and clinics<br />
• Governmental and non-governmental extension • Government schools and<br />
services • Financial institutions<br />
• Private hospitals and clinics<br />
services<br />
educational institutions<br />
• Business or commodity associations • Individual doctors, nurses, midwives • Commodity associations<br />
• Private or religious schools<br />
• Government agencies<br />
• Pharmacies<br />
• Sales outlets of inputs and materials<br />
• Community schools<br />
• Federation of community-based • Traditional healers<br />
• Veterinary services<br />
• Gov’t agencies or NGOs in<br />
organizations (CBOs)<br />
Accessibility of Services<br />
education<br />
Inventory of Services<br />
• Distance, means of transport to care<br />
• Parent-teacher associations<br />
• Government and non-government • Cost of services relative to income levels<br />
Inventory of Services<br />
• Credit institutions<br />
• Availability and cost of key medications<br />
• Assessment of governmental and<br />
non-governmental work in education<br />
Annex 2.1<br />
117
Project Design Handbook<br />
118<br />
Annex 2.2: A Needs Assessment Case Study<br />
A project design team composed of staff from the Laafas Ministry of Health and<br />
CARE/Laafas conducted an analysis of major health problems in rural areas. Preliminary<br />
surveys identified excreta/water-related disease as a significant problem. Among the major<br />
conditions linked to this problem were contaminated water sources, poor personal and<br />
domestic hygiene practices, and under-use of latrines. Before strategies could be<br />
developed to solve the problem and its major causes, the design team conducted a needs<br />
assessment.<br />
The first step in the needs assessment was to establish some sort of national norm against<br />
which to compare conditions in the project areas. To do this, the design team interviewed<br />
Ministry of Health (MOH) officials and reviewed MOH policy documents regarding disease,<br />
water supply and sanitation, and health education. Once norms were established, the<br />
design team decided to gather statistics in order to compare disease rates in the project<br />
areas to similar areas and the national averages. After data from MOH surveys and<br />
previous project documents and evaluations had been collected and analyzed, the following<br />
results of the secondary data review were produced.<br />
Results of secondary data review<br />
Disease Project Region 1 Region 2 National<br />
Amoebic dysentery >50 55 35<br />
Ascariasis >30 48 26<br />
Shigellosis >28 >54 >46 32<br />
Diarrhea >73 >45 >80 39<br />
E. coli >60 >50 >62 45<br />
Giardiasis >46 >45 >50 20<br />
Rotavirus >56 >43 >61 31<br />
Scabies >58 >25 >52 18<br />
Tineas >38 >30 >41 29<br />
Louse-borne Fever >40 >12 >12 7<br />
Conjunctivitis >72 >78 >78 40<br />
Since reliable water-quality data were not available, the planning team sent several field<br />
staff to take water samples from communities in the project area and two adjacent regions.<br />
National averages regarding water quality were not available. Concurrently, also due to the<br />
lack of statistics regarding latrines and hygiene practices, the planning team developed a<br />
short questionnaire and observation guide, trained field staff, and conducted the survey in<br />
the communities mentioned above. For this survey, drinking water stored in a clean and<br />
protected container was used as an indicator of other domestic and hygiene practices. The<br />
data provided represent the results of surveys conducted in villages chosen at random in the<br />
project zone and in Regions 1 and 2.<br />
Results of water survey<br />
Topic Project Region 1 Region 2 National<br />
Water Quality (coliform<br />
bacteria per 100 ml<br />
water)<br />
35,040 (range<br />
from 200 to<br />
100,000)<br />
2,913 (range from<br />
50 to 10,000)<br />
75,600 (range<br />
from 2,000 to<br />
300,000)<br />
% access to latrine 10 35 8 52<br />
% proper water storage 7.4 27.8 4.8 34<br />
N/A
In the last phase of the needs assessment, the design team decided to find out how the<br />
residents of the project areas perceived the problem and its causes. The question was, is<br />
the residents’ perception of the problem the same as the external investigators and do they<br />
see the need to try and solve it? To gather this supplemental data, the team used a<br />
combination of focus group sessions, conversational and open-ended interviewing, and<br />
Knowledge, Attitudes and Practices (KAP) surveys. From the data generated, the team<br />
summarized the answers as follows.<br />
Results of perception and behavior study<br />
GENERAL QUESTION #1: What is the residents’ perception of the importance and<br />
magnitude of the various water- and excreta-related diseases?<br />
A small percentage linked diarrhea to water-based diseases, while most felt that it<br />
was linked to foods being eaten, moods or behavior or acts of God. There was a<br />
significant level of fatalism regarding the community’s ability to solve the problem.<br />
GENERAL QUESTION #2: Do the residents of the project areas believe the water source is<br />
contaminated and causes disease?<br />
Almost all respondents felt that the water was of good quality. The problem for some<br />
was difficult access. They advocated a piped water supply in homes.<br />
GENERAL QUESTION #3: Do residents in the project areas connect poor hygiene practices<br />
to disease?<br />
Poor hygiene was not felt to contribute to disease. In fact, some felt that bathing too<br />
often was bad for your health.<br />
GENERAL QUESTION #4: Do residents think latrines are important in preventing disease<br />
transmission?<br />
No, although many did not like the unpleasant odor caused by public defecation.<br />
Case Study Practice Questions<br />
Before the design team can continue the design process, it must review information from the<br />
National Averages and answer important questions. Pretend the planning team has asked<br />
you to answer the following questions:<br />
• How well does the needs assessment substantiate the problem and identify its<br />
causes in the project areas?<br />
• Is there sufficient need in the project areas to warrant intervention (to address the<br />
problem and its causes)? Why?<br />
• What information has been obtained regarding felt, relative and normative needs,<br />
and how should that information be used in designing a project?<br />
• Based on the results of the needs assessment, what recommendations would you<br />
make to the planning team at this point in the design process?<br />
From: <strong>Caldwell</strong> 1999<br />
Annex 2.2<br />
119
Project Design Handbook<br />
120<br />
Annex 2.3: Wealth Ranking example<br />
Wealth Ranking –from Livelihood Profiles by Chikhutu Village Women<br />
Food/diet Maize husks, okra,<br />
wild vegetables;<br />
1 meal per day<br />
Clothing Wear rags<br />
Category 1 Category 2 Category 3 Category 4<br />
Very poor Poor Better off Well-to-do<br />
Nsima, beans, fish,<br />
vegetables,<br />
1 meal per day<br />
Have one set of clothing<br />
One piece of cloth<br />
Nsima beans,<br />
fish, vegetables,<br />
2 meals per day<br />
Change cloths<br />
Wash clothes<br />
with soap<br />
Livestock None Usually have small chicken One goat<br />
One chicken<br />
Education No education<br />
Not gone to school<br />
House structure Live in abandoned<br />
house<br />
No kitchen, toilet<br />
or bathroom<br />
Bedding Usually cover<br />
themselves with<br />
meal sacks<br />
Access to water Use a clay pot<br />
Get water from<br />
where pigs bath<br />
Size of field Fields usually less<br />
than 1 acre<br />
Yields from<br />
crops<br />
Types of crops<br />
grown<br />
Possessions<br />
(assets)<br />
Very little education<br />
Standard 4/5<br />
House thatched with<br />
grass<br />
One room to sleep in<br />
No kitchen, toilet or<br />
bathroom<br />
Usually cover themselves<br />
with one chitenge which is<br />
also worn during the day<br />
Use can with a hole to<br />
collect water; have to<br />
mend can using mud. Get<br />
water from shallow well<br />
Usually have fields that<br />
are between 1-2 acres<br />
Usually reached<br />
Standard 8<br />
Houses have<br />
kitchen, toilet<br />
and bathroom<br />
Have at least one<br />
blanket<br />
Draw water using<br />
good buckets<br />
Wells are<br />
personal<br />
Usually have<br />
fields that are<br />
between 2-3<br />
acres<br />
No yield A bit or very little Harvest one<br />
granary of maize<br />
per season<br />
No seed<br />
Grow nothing<br />
Have a clay pot<br />
A few plates<br />
Employment Piecework, e.g.,<br />
working on<br />
someone’s farm,<br />
pounding maize.<br />
Grow a bit of maize and<br />
g/nuts<br />
No fertilizer<br />
Have two plates<br />
One cooking pot (small)<br />
Piecework similar to first<br />
category, but more<br />
regular<br />
Grow maize,<br />
tobacco, soya<br />
beans<br />
Have a vegetable<br />
garden<br />
Two cooking pots<br />
At least four<br />
mats<br />
Look after house,<br />
e.g., sweeping and<br />
farming<br />
Food stocks Have no food Same as first category Have very small<br />
granary; Eat<br />
grasshoppers<br />
Nsima, tea, rice porridge<br />
for breakfast, meat, fish,<br />
eggs, vegetables,<br />
2 meals per day<br />
Change clothing<br />
frequently.<br />
Usually have cattle, goats,<br />
pigs, chicks, sheep,<br />
pigeons<br />
Usually reached Form 4<br />
and are working<br />
Roofed with iron sheets<br />
Maintained with cement<br />
Kitchen, bathroom and<br />
toilet<br />
Sleep on a bed with a<br />
mattress and enough<br />
blankets to keep warm<br />
Water from borehole<br />
Personal boreholes<br />
Locked up when not in use<br />
Large piece of land<br />
Have farm, Lots of tools<br />
Have husks to give to the<br />
poor<br />
Harvest variety of crops<br />
Three granaries of maize.<br />
Grow maize, tobacco,<br />
g/nuts, beans, soya, sweet<br />
potatoes, vegetable and a<br />
variety of other crops<br />
Beds for all the family<br />
Ox –cart, Buckets,<br />
Cupboard, Table, Plates,<br />
Bicycle, Other household<br />
items<br />
Several workers, and<br />
house servant<br />
Have 2-3 granaries full of<br />
maize. Have g/nuts,<br />
tobacco, cowpeas, soya<br />
beans, and others in store<br />
CARE Zambia, 1999
Annex 2.4: Glossary of Tools<br />
(From The World Bank Participation Sourcebook)<br />
Each of the methods described in this chapter is a combination of tools, held together by a<br />
guiding principle. Dozens of exercises exist to cultivate collaborative development planning<br />
and action. These are the tools with which social scientists and other development<br />
practitioners encourage and enable stakeholder participation. Some tools are designed to<br />
inspire creative solutions; others are used for investigative or analytic purposes. One tool<br />
might be useful for sharing or collecting information, whereas another is an activity for<br />
transferring that information into plans or actions. These brief descriptions are intended to<br />
provide the reader with a glossary of terminology that practitioners of participatory<br />
development use to describe the tools of their trade.<br />
W Access to resources. A series of participatory exercises that allows development<br />
practitioners to collect information and raises awareness among beneficiaries about the<br />
ways in which access to resources varies according to gender and other important social<br />
variables. This user-friendly tool draws on the everyday experience of participants and is<br />
useful to men, women, trainers, project staff, and field-workers.<br />
W Analysis of tasks. A gender analysis tool that raises community awareness about<br />
the distribution of domestic, market, and community activities according to gender and<br />
familiarizes planners with the degree of role flexibility that is associated with different tasks.<br />
Such information and awareness is necessary to prepare and execute development<br />
interventions that will benefit both men and women.<br />
W Focus group meetings. Relatively low-cost, semi-structured, small group (four to<br />
twelve participants plus a facilitator) consultations used to explore peoples' attitudes,<br />
feelings, or preferences, and to build consensus. Focus group work is a compromise<br />
between participant observation, which is less controlled, lengthier, and more in-depth, and<br />
preset interviews, which are not likely to attend to participants' own concerns.<br />
W Force field analysis. A tool similar to one called "Story With a Gap," which engages<br />
people to define and classify goals and to make sustainable plans by working on thorough<br />
"before and after" scenarios. Participants review the causes of problematic situations,<br />
consider the factors that influence the situation, think about solutions, and create alternative<br />
plans to achieve solutions. The tools are based on diagrams or pictures, which minimize<br />
language and literacy differences and encourage creative thinking.<br />
W Health-seeking behavior. A culturally sensitive tool for generation of data about<br />
health care and health-related activities. It produces qualitative data about the reasons<br />
behind certain practices as well as quantifiable information about beliefs and practices. This<br />
visual tool uses pictures to minimize language and literacy differences.<br />
W Logical Framework or logframe. A matrix that illustrates a summary of a project<br />
design, emphasizing the results that are expected when a project is successfully completed.<br />
These results or outputs are presented in terms of objectively verifiable indicators. The<br />
Logical Framework approach to project planning, developed under that name by the U.S.<br />
Agency for International Development, has been adapted for use in participatory methods<br />
such as ZOPP (in which the tool is called a project planning matrix) and TeamUP.<br />
Annex 2.4<br />
121
Project Design Handbook<br />
122<br />
W Mapping. A generic term for gathering in pictorial form data on a variety of<br />
indicators. This is an excellent starting point for participatory work because it gets people<br />
involved in creating a visual output that can be used immediately to bridge verbal<br />
communication gaps and to generate lively discussion. Maps are useful as verification of<br />
secondary source information, as training and awareness raising tools, for comparison, and<br />
for monitoring of change. Common types of maps include social maps, health maps,<br />
institutional maps (Venn diagrams), and resource maps.<br />
W Needs assessment. A tool that draws out information about people's varied needs,<br />
raises participants' awareness of related issues, and provides a framework for prioritizing<br />
needs. This sort of tool is an integral part of gender analysis to develop an understanding of<br />
the particular needs of both men and women and to do comparative analysis.<br />
W Participant observation. A fieldwork technique used by anthropologists and<br />
sociologists to collect qualitative and quantitative data that leads to an in-depth<br />
understanding of peoples' practices, motivations, and attitudes. Participant observation<br />
entails investigating the project background, studying the general characteristics of a<br />
beneficiary population, and living for an extended period among beneficiaries, during which<br />
interviews, observations, and analyses are recorded and discussed.<br />
W Pocket charts. Investigative tools that use pictures as stimuli to encourage people to<br />
assess and analyze a given situation. Through a "voting' process, participants use the chart<br />
to draw attention to the complex elements of a development issue in an uncomplicated way.<br />
A major advantage of this tool is that it can be put together with whatever local materials are<br />
available.<br />
W Preference ranking. Also called direct matrix ranking, an exercise in which people<br />
identify what they do and do not value about a class of objects (for example, tree species or<br />
cooking fuel types). Ranking allows participants to understand the reasons for local<br />
preferences and to see how values differ among local groups. Understanding preferences<br />
is critical for choosing appropriate and effective interventions.<br />
W Role-playing. Enables people to creatively remove themselves from their usual roles<br />
and perspectives to allow them to understand choices and decisions made by other people<br />
with other responsibilities. Ranging from a simple story with only a few characters to an<br />
elaborate street theater production, this tool can be used to acclimate a research team to a<br />
project setting, train trainers, and encourage community discussions about a particular<br />
development intervention.<br />
W Seasonal diagrams or seasonal calendars. Show the major changes that affect a<br />
household, community, or region within a year, such as those associated with climate,<br />
crops, labor availability and demand, livestock, prices, and so on. Such diagrams highlight<br />
the times of constraints and opportunity, which can be critical information for planning and<br />
implementation.<br />
W Secondary data review. Also called desk review, an inexpensive, initial inquiry that<br />
provides necessary contextual background. Sources include academic theses and<br />
dissertations, annual reports, evaluation reports, archival materials, census data, life<br />
histories, maps, project documents, and so on.
W Semi-structured interviews. Also called conversational interviews, interviews that are<br />
partially structured by a flexible interview guide with a limited number of preset questions.<br />
This kind of guide ensures that the interview remains focused on the development issue at<br />
hand while allowing enough conversation so that participants can introduce and discuss<br />
topics that are relevant to them. These tools are a deliberate departure from survey-type<br />
interviews with lengthy, predetermined questionnaires.<br />
W Sociocultural profiles. Detailed descriptions of the social and cultural dimensions<br />
that in combination with technical, economic, and environmental dimensions serve as a<br />
basis for design and preparation of policy and project work. Profiles include data about the<br />
type of communities, demographic characteristics, economy and livelihood, land tenure and<br />
natural resource control, social organization, factors affecting access to power and<br />
resources, conflict resolution mechanisms, and values and perceptions. Together with a<br />
participation plan, the socio-cultural profile helps ensure that proposed projects and policies<br />
are culturally and socially appropriate and potentially sustainable.<br />
W Surveys. A sequence of focused, predetermined questions in a fixed order, often<br />
with predetermined, limited options for responses. Surveys can add value when they are<br />
used to identify development problems or objectives, narrow the focus or clarify the<br />
objectives of a project or policy, plan strategies for implementation, and monitor or evaluate<br />
participation. Among the survey instruments used in Bank work are firm surveys, sentinel<br />
community surveillance, contingent valuation, and priority surveys.<br />
W Tree diagrams. Multipurpose, visual tools for narrowing and prioritizing problems,<br />
objectives, or decisions. Information is organized into a treelike diagram that includes<br />
information on the main issue, relevant factors, and influences and outcomes of these<br />
factors. Tree diagrams are used to guide design and evaluation systems, to uncover and<br />
analyze the underlying causes of a particular problem, or to rank and measure objectives in<br />
relation to one another.<br />
W Village meetings. Meetings with many uses in participatory development, including<br />
information sharing and group consultation, consensus building, prioritization and<br />
sequencing of interventions, and collaborative monitoring and evaluation. When multiple<br />
tools such as resource mapping, ranking, and focus groups have been used, village<br />
meetings are important venues for launching activities, evaluating progress, and gaining<br />
feedback on analysis.<br />
W Wealth ranking. Also known as wellbeing ranking or vulnerability analysis, a<br />
technique for the rapid collection and analysis of relative data on social stratification at the<br />
community level. This visual tool minimizes literacy and language differences of participants<br />
as they consider factors such as ownership of or use rights to productive assets, lifecycle<br />
stage of members of the productive unit, relationship of the productive unit to locally<br />
powerful people, availability of labor, and indebtedness.<br />
W Workshops. Structured group meetings at which a variety of key stakeholder groups,<br />
whose activities or influence affect a development issue or project, share knowledge and<br />
work toward a common vision. With the help of a workshop facilitator, participants<br />
undertake a series of activities designed to help them progress toward the development<br />
objective (consensus building, information sharing, prioritization of objectives, team building,<br />
and so on). In project as well as policy work, from preplanning to evaluation stages,<br />
stakeholder workshops are used to initiate, establish, and sustain collaboration.<br />
Annex 2.4<br />
123
Project Design Handbook<br />
124<br />
For more information on these and similar M&E tools and methodologies, see the<br />
bibliography at the end of this handbook.
Annex 3.1: Causal Analysis Practice Exercises<br />
Differentiating among problems, causes and consequences 33<br />
For each of the following three exercises, review each of the categories and mark what you<br />
believe to be the problem (P), causes of the problem (CA), and consequences of the<br />
problem (CO). Note that a project should focus on only one problem.<br />
Practice Exercise #1<br />
1. Most people in the village have a very low income. ___<br />
2. Men and older children have access to more nutritious food than women and young<br />
children. ___<br />
3. Most children in the village are malnourished. ___<br />
4. There is no nutrition education program in the village. ___<br />
5. Young children become susceptible to infectious disease, especially diarrhea. ___<br />
6. Many of the men spend their income on alcohol instead of food for the family. ___<br />
7. Children do not develop normal cognitive skills. ___<br />
Practice Exercise #2:<br />
1. Diet is poor and income is low in households headed by single women. ___<br />
2. Children in these households are less likely to attend school. ___<br />
3. Women are excluded from community decision-making. ___<br />
4. Widows do not inherit the lands of their husbands. ___<br />
5. Schools are overcrowded, and girls are usually the last to be enrolled. ___<br />
6. Culture and tradition dictate a male-dominated society. ___<br />
7. Infant mortality is high in women-headed households. ___<br />
33 Note: These exercises are good training tools for use in project design workshops. It is even more useful to put each of the<br />
category statements on a separate card so that the trainees can physically re-arrange them in logical hierarchical order.<br />
Annex 3.1<br />
125
Project Design Handbook<br />
126<br />
Practice Exercise #3<br />
Repeat the exercise with this list. Mark the problem, its causes and consequences with P,<br />
CA, and CO.<br />
1. Community farming is conducted on distant lands, even though water sources are<br />
nearby. ___<br />
2. Plagues and diseases are affecting crops. ___<br />
3. Agricultural work is performed with rudimentary tools. ___<br />
4. Farming plots are small. ___<br />
5. The farming soils are poor. ___<br />
6. Family income is low. ___<br />
7. Young men migrate to the provincial capital. ___<br />
8. Consumption of foods high in protein is deficient. ___<br />
9. Male farmers drink too much. ___<br />
10. The seeds used for planting are of low quality. ___<br />
11. Traders buy the products directly from the farmers at lower than market prices. ___<br />
12. Farmers are not familiar with improved cropping practices. ___<br />
13. Land productivity is low. ___<br />
14. Adequate agricultural credit is not available for these farmers. ___<br />
15. Farmers grow only for household consumption. Little surplus remains for marketing.<br />
___
Practice Exercise #4: Causal Analysis Card Game<br />
This is one of the most successful games for introducing hierarchical causal analysis. Each<br />
team will receive a set of identical cards. On each card is a statement that reflects a<br />
problem, cause or consequence. There is only one problem in the set of cards. 34<br />
Step 1. Lay out all of the cards and try to determine which card reflects the problem.<br />
(To give a hint, the correct problem card could be written in a slightly different<br />
style.)<br />
Step 2. Next, try to separate the cards into conditions, behaviors, knowledge/attitude,<br />
systemic conditions, general factors, and consequences.<br />
Step 3. Determine which cards are consequences of the problem and place them<br />
above the problem.<br />
Step 4. To simplify things for trainees, there should only be three primary causes for<br />
the problem. Ask yourself “What are the most immediate causes<br />
(conditions) that would lead to the problem?” Avoid choosing statements that<br />
leave too much of a logic gap between the condition and the problem.<br />
Step 5. For each primary cause there will be two secondary causes. Keep asking<br />
yourself what is the most immediate cause that would lead to the next highest<br />
level.<br />
Step 6. Repeat this process until you have placed all of the cards on the hierarchy<br />
model. Now check your logic by doing the “If: Then” technique. E.g., If X<br />
were improved and Y assumption held true, then Z (effect) would be<br />
achieved.<br />
34 The categories statements from exercises #1, #2 and #3 could also be used for this group exercise. Or make up your own<br />
exercise, using categories that are typical of those in the kinds of projects the trainees are likely to be involved in designing.<br />
Annex 3.1<br />
127
Project Design Handbook<br />
128<br />
Practice Exercise #5: Creating a Causal Tree<br />
Create a causal tree using the following list of problems, causes and consequences. The<br />
tree can be drawn on a surface such as poster paper or assembled by writing the<br />
statements on index cards and organizing them as appropriate.<br />
1. Most children in the village have diarrhea.<br />
2. The drinking water source is contaminated.<br />
3. Children are not eating properly.<br />
4. Houses do not have screens to keep out flies.<br />
5. There are no latrines in the village.<br />
6. Men and adult women have the first choice of limited food.<br />
7. Insects frequently contaminate food supplies.<br />
8. Excessive family expenses dedicated to hospitals and funerals.<br />
9. Young children lose large amounts of body fluid and become dehydrated.<br />
10. High chronic child mortality.<br />
11. There are no vegetables available in the market for half the year.<br />
12. Villagers do not understand connection between poor hygiene and illness.
Practice Exercise #6: Analyzing Problem Trees<br />
In this handbook and in the above exercises you can find sample problem trees from<br />
different sectors. The information included in these analyses has been adapted from<br />
materials produced during actual causal analyses for projects. These should be similar in<br />
appearance to the problem tree you created in the practical exercise #3. As you peruse<br />
each sample and the problem tree you created ask yourself the following questions.<br />
1. Is each cause-effect link logical?<br />
2. Can causes be identified at each level in the causal analysis hierarchy (i.e., condition,<br />
behavior, knowledge/attitude/belief, and external factors)?<br />
3. Are there causal streams that seem more significant with respect to their contributions to<br />
the problem (Pareto principle)?<br />
4. Do some factors appear as causes in more than one causal stream? Which ones are<br />
they, and what is the significance of this?<br />
Annex 3.1<br />
129
Project Design Handbook<br />
130<br />
Annex 3.2: Applying Appreciative Inquiry<br />
Using Appreciative Analysis for Visioning<br />
Visioning is about moving into the world of what is possible, instead of what chains us down.<br />
We look into the future and see the world as it might be, then step into the future to look<br />
back at the present to see what has to be changed to get there. It is about both revealing<br />
the potential for change, as well as creating the belief that it is achievable.<br />
The purpose of visioning is to encourage communities to recognize their own capacities and<br />
the value of their own resources. The approach differs from standard problem solving in<br />
that it changes the focus from problems to opportunities and validates what is already<br />
available at the community level. It thus reduces the tendency for communities to look to<br />
external help. It changes the tone from one that is negative and paralyzing – one that<br />
focuses on what people don’t have and are unable to achieve – to one that is positive and<br />
creative. This leaves both the programming team and the community feeling more<br />
empowered and energized.<br />
The Appreciative Inquiry process includes four steps:<br />
1) Appreciative: Value the best of what is: what is already there that the community can<br />
build on. This step generates a list of opportunities at the community level.<br />
2) Visioning: Imagine what the community might look like in five years (not a wish list). This<br />
step should develop both individual/household level visions, and community level visions.<br />
The process uses both visual (mapping and diagramming) tools and brainstorming tools to<br />
develop lists of the elements of each vision. Focus on the five-year time frame and make<br />
the transition from individual to community visions help keep the process realistic.<br />
3) Contrasting: Compare the visions with the present reality. What do we need to do to get<br />
to our vision state? This step helps groups assess the key difference between the vision<br />
and the present situation and guides groups into a phase of looking more concretely at what<br />
needs to change in order to attain the vision. Through discussion, groups can develop<br />
tables that compare key elements of the vision to the status of these elements in the present<br />
time. Then move to look at what needs to happen to get from the present to the state<br />
depicted in the vision. Strategies that are developed should be based on initiatives the<br />
community members can take, with specific and targeted outside support.<br />
4) Constructing: Identify first practical steps to attaining the vision. This step involves<br />
developing more detailed action steps on what needs to happen to get from the present to<br />
the state depicted in the vision.<br />
It may be helpful for this exercise to be conducted by sub-groups within a community (e.g.<br />
women, women, young people, older people, different socio-economic groups, etc.) to allow<br />
each to identify visions and strategies that are meaningful to each. At the end of the<br />
exercise, all groups should present their findings and discuss their respective visions.
Annex 4.1: Project Hypothesis<br />
Converting the Problem and its Key Causes to Anticipated Outcomes<br />
Environmental Degradation Example<br />
Problem: High rates of deforestation in Monterrico Province<br />
Primary Causes: Illicit felling of commercially-valued trees<br />
Use of slash and burn agricultural practices<br />
Anticipated outcomes of project:<br />
(1) Deforestation rates will decrease (Problem solved)<br />
(2) Farmers' will change their agricultural practices (Cause #1)<br />
(3) Illicit felling of trees will decline (Cause #2)<br />
Project Hypothesis Diagram (read from bottom up)<br />
Hypothesis Outcomes Assumptions/Key Questions<br />
THEN<br />
Deforestation rates in Monterrico<br />
Province will decline by 2001.<br />
IF Illicit felling of commercially valued<br />
trees decreases.<br />
IF<br />
Cause 1:<br />
THEN<br />
IF<br />
Cause 2:<br />
THEN<br />
AND<br />
Slash and burn cropping decreases.<br />
Land area reforested with fuel wood<br />
species will increase.<br />
New forestry policies are enacted<br />
against illegal felling of trees<br />
Slash and burn cropping will<br />
decrease.<br />
IF Sustainable agricultural practices<br />
adopted.<br />
AND no additional causes of<br />
deforestation appear (assumption)<br />
AND policies are enforced<br />
(assumption)<br />
Annex 4.1<br />
AND there is a sustainable source of<br />
seeds and planting materials (key<br />
question)<br />
131
Project Design Handbook<br />
132<br />
Annex 5.1: Goals and Indicators for an<br />
Agricultural Project<br />
Impact Goal:<br />
<strong>By</strong> the end of 2007, 800 small farm families in the Rio Blanco community will have increased<br />
their incomes by 20%.<br />
Impact Indicator: average income in target households<br />
Effect objective #1:<br />
800 small farmers in the Rio Blanco community will use improved seeds and proper<br />
cropping techniques on potato, and wheat fields by the end of the project.<br />
Indicator #1: % of the farmers that use improved seed and used<br />
recommended cropping techniques for their potato crops.<br />
Indicator #2: % of the farmers that use improved seeds and used<br />
recommended cropping techniques for their wheat crops.<br />
Effect objective #2:<br />
Each community participating in the project organizes and efficiently manages a communal<br />
seed fund by the end of the first year of project intervention.<br />
Indicator #1: # of communities with communal seed funds.<br />
Indicator #2: % of communal fund groups that have prepared and approved<br />
rules<br />
Indicator #3: % of communal fund groups that enforce the rules for communal<br />
fund management.<br />
Indicator #4: % of participating farmers with enough seed to plant at least the<br />
same number of hectares in the following campaign through the<br />
communal fund.<br />
Effect objective #3:<br />
75% of farmers from 9 communities in Rio Blanco Province will have established<br />
agroforestry systems on their lands by December 2004.<br />
Indicator #1: % of farmers who have planted two or more varieties of trees in<br />
their fields.<br />
Indicator #2: % of the trees planted as part of agroforestry systems practices<br />
that are surviving two years after planting<br />
Note: These are aggregate effect indicators. More specific variables (objectively verifiable<br />
indicators) will be needed to know how to measure these with more precision, including<br />
clarity on what the denominator is for each rate (%) indicator.
Annex 5.2: Goals and Indicators for a Small<br />
Business Development Project<br />
Impact Goal:<br />
To increase by 20% the income of 9,000 women members of the Dominica communal<br />
kitchens of the urban marginal zones, by September 2007.<br />
Impact Indicator: % increase in income of the 9,000 project beneficiaries.<br />
Effect objective #1:<br />
Effective Revolving Credit Funds (RCF) are established in selected communes by 2004 in<br />
order to develop small economic initiatives for income generation.<br />
Indicator #1: # of women’s organizations, members of the Dominica<br />
community kitchens, who receive loans through the RCF.<br />
Indicator #2: # of Credit Committees (CC) established to manage the RCFs.<br />
Indicator #3: % of the established CCs that keep a registry of the RCFs<br />
showing clearly recorded and controlled operations.<br />
Indicator #4: % of the participant women who receive approval or denial of<br />
loans 8 days after submitting an application.<br />
Indicator #5 loan repayment rate: % of borrowers who reimburse their loans<br />
on schedule<br />
Effect objective #2:<br />
<strong>By</strong> September 2003, 9,720 women borrowers in enterprise management are effectively<br />
managing their small enterprises.<br />
Indicator #1: % of women borrowers actively engaged in small enterprise.<br />
Indicator #2: % of women able to sell their products in the market.<br />
Indicator #3: Success rate of small enterprises (# of enterprises at end of<br />
project divided by # of enterprises established during project).<br />
Indicator #4: % of enterprises that maintain income and expense records as<br />
part of an adequate enterprise management system.<br />
Indicator #5 % of enterprises reporting profit<br />
Annex 5.2<br />
133
Project Design Handbook<br />
134<br />
Annex 5.3: Indicators at Different Levels in the Project Hierarchy<br />
Sector<br />
IMPACT (fundamental<br />
change in human<br />
condition)<br />
EFFECT (changes in<br />
systems or behaviors)<br />
OUTPUT (goods and<br />
services produced by<br />
the project)<br />
ACTIVITIES (convert<br />
inputs to output)<br />
INPUTS (resources<br />
used)<br />
Reproductive Health<br />
Agriculture and Natural<br />
Resources<br />
% change in fertility rate % households producing<br />
enough food to<br />
cover lean periods<br />
% children
Annex 5.4: CARE’s Project Outcome Model<br />
INPUTS ACTIVITIES OUTPUTS EFFECTS IMPACT!<br />
Resources dedicated<br />
to or consumed by<br />
the project<br />
e.g.,<br />
• money<br />
• staff and staff time<br />
• resources<br />
• facilities<br />
• equipment and<br />
supplies<br />
External factors<br />
(assumptions)<br />
e.g.,<br />
• law, regulations, donor<br />
requirements<br />
• interventions of other<br />
agencies<br />
•<br />
Actions and<br />
processes that<br />
convert inputs into<br />
outputs<br />
e.g.,<br />
• training<br />
• organizing<br />
• advocating<br />
• construction<br />
• counselling<br />
• communications<br />
The goods and<br />
services resulting<br />
from project activities<br />
e.g.,<br />
• latrines constructed<br />
• partner staff trained<br />
• seedlings planted<br />
• CBOs created<br />
• number of pamphlets<br />
distributed<br />
• policy advocacy<br />
statements issued<br />
Changes in human<br />
behavior or in the<br />
existence and<br />
quality of systems<br />
e.g.,<br />
• empowered CBOs<br />
and individuals<br />
• use of acquired<br />
knowledge<br />
• changed attitudes<br />
or values<br />
• modified behaviors<br />
• improved quality of<br />
health care system<br />
• new policies<br />
adopted and<br />
enforced<br />
• duty barers’<br />
fulfillment of their<br />
responsibilities<br />
Equitable and durable<br />
improvements in<br />
human wellbeing and<br />
social justice<br />
e.g.,<br />
• improved HLS<br />
• improved health status<br />
• increased income<br />
• improved condition<br />
• altered status<br />
• empowered<br />
community<br />
• rights fulfilled<br />
Layout After United Way, 1996<br />
Annex 5.4<br />
135<br />
Formatted: Bullets and Numbering
Project Design Handbook<br />
136<br />
Annex 5.5: The United Way’s Program Outcome Model<br />
Resources dedicated<br />
to or consumed by<br />
the program<br />
e.g.,<br />
• money<br />
• staff and staff time<br />
• volunteers and<br />
volunteer time<br />
• facilities<br />
• equipment and<br />
supplies<br />
INPUTS ACTIVITIES OUTPUTS OUTCOMES<br />
Constraints on the<br />
program<br />
e.g.,<br />
• laws<br />
• regulations<br />
• funders’ requirements<br />
What the program does<br />
with the inputs to fulfill<br />
its mission<br />
e.g.,<br />
• feed and shelter<br />
homeless families<br />
• provide job training<br />
• educate the public about<br />
signs of child abuse<br />
• counsel pregnant women<br />
• create mentoring<br />
relationships for youth<br />
The direct products of<br />
program activities<br />
e.g.,<br />
• number of classes<br />
taught<br />
• number of counselling<br />
sessions conducted<br />
• number of educational<br />
materials distributed<br />
• number of hours of<br />
service delivered<br />
• number of participants<br />
served<br />
Benefits for participants<br />
during and after program<br />
activities<br />
e.g.,<br />
• new knowledge<br />
• increased skills<br />
•changed attitudes or<br />
values<br />
• modified behavior<br />
• improved condition<br />
• altered status<br />
United Way, 1996
Annex 5.6: Canadian Performance Framework<br />
Mission Statement: Who does what to whom and why<br />
HOW?<br />
(Resources)<br />
WHO? WHERE?<br />
(Reach)<br />
WHAT do we want? WHY?<br />
(Results)<br />
Activities Outputs Reach Direct Outcomes Ultimate<br />
Impacts<br />
• Program/service<br />
management<br />
• Client management<br />
• Policy & issue<br />
management<br />
• Financial<br />
management<br />
• Human resource<br />
management<br />
• Asset management<br />
Communications<br />
– plans/directives/regulati<br />
ons<br />
– internal communications<br />
– promotion<br />
– info transfer<br />
– consultations<br />
– meetings<br />
– ‘events’<br />
Service outputs<br />
• Primary target<br />
(clients)<br />
• Co-delivery agents<br />
• Other ‘stakeholders’<br />
Influencing factors<br />
Client service:<br />
– addresses needs<br />
– meets/exceeds<br />
expectations<br />
– services satisfaction<br />
Behavioral influence<br />
– awareness<br />
– understanding<br />
– knowledge gain<br />
– attitude/ perception<br />
– decision<br />
– action<br />
Target group<br />
outcomes<br />
Supplier/ industry<br />
Regional outcomes<br />
Economic/<br />
societal outcomes<br />
Montague, 1997<br />
Annex 5.6<br />
137
Project Design Handbook<br />
138<br />
Annex 5.7: Classical 4X4 LogFrame<br />
DFID LogFrame Guide 35<br />
Objectives Measurable indicators Means of verification Important assumptions<br />
GOAL:<br />
Wider problem the project will<br />
help to resolve<br />
PURPOSE:<br />
The immediate impact on the<br />
project area or target group,<br />
i.e., the change or benefit to be<br />
achieved by the project<br />
OUTPUTS:<br />
These are the specifically<br />
deliverable results expected<br />
from the project to attain the<br />
purpose<br />
ACTIVITIES:<br />
These are the tasks to be done<br />
to produce the outputs<br />
35 As received via CARE UK 12/97.<br />
Quantitative ways of measuring<br />
or qualitative ways of judging<br />
claimed achievement of goal<br />
Quantitative ways of measuring<br />
or qualitative ways of judging<br />
claimed achievement of<br />
purpose<br />
Quantitative ways of measuring<br />
or qualitative ways of judging<br />
timed production of outputs<br />
INPUTS:<br />
This is a summary of the<br />
project budget (sub-budgets<br />
and total)<br />
Cost-effective methods and<br />
sources to quantity or assess<br />
indicators<br />
Cost-effective methods and<br />
sources to quantity or assess<br />
indicators<br />
Cost-effective methods and<br />
sources to quantity or assess<br />
indicators<br />
Financial outturn report as<br />
agreed in grant agreement<br />
(Goal to supergoal)<br />
External factors necessary to<br />
sustain objectives in the long<br />
run<br />
(Purpose to Goal)<br />
External conditions necessary<br />
if achieved project purpose is<br />
to contribute to reaching<br />
project goal<br />
(Outputs to Purpose)<br />
Factors out of project control<br />
which, if present, could restrict<br />
progress from outputs to<br />
achieving project purpose<br />
(Activity to Output)<br />
Factors out of project control<br />
which, if present, could restrict<br />
progress from activities to<br />
achieving outputs<br />
Source: DfID
Annex 5.8: USAID Results Framework<br />
If this<br />
Intermediate Result<br />
[Intended Measurable Change]<br />
Key Indicator(s):<br />
Development Partner(s):<br />
Intermediate Result<br />
[Intended Measurable Change]<br />
Key Indicator(s):<br />
Development Partner(s):<br />
and<br />
What are the changes/results necessary and sufficient to<br />
get to the next “higher” level?<br />
How do you achieve the “higher” level of results?<br />
Intermediate Result<br />
[Intended Measurable Change]<br />
Key Indicator(s):<br />
Development Partner(s):<br />
Source: USAID, 1999<br />
Agency Goal<br />
Strategic Objective<br />
[Result: Intended measurable change]<br />
Key Indicators:<br />
Development Partner(s):<br />
Then<br />
and<br />
Intermediate Result<br />
[Intended Measurable Change]<br />
Key Indicator(s):<br />
Development Partner(s):<br />
Intermediate Result<br />
[Intended Measurable Change]<br />
Key Indicator(s):<br />
Development Partner(s):<br />
Causal relationships between results need not always be strictly<br />
hierarchical, i.e., an intermediate result on one “level” can<br />
contribute to the achievement of intermediate result on two or<br />
more “levels.”<br />
Annex 5.8<br />
Intermediate Result<br />
[Intended Measurable Change]<br />
Key Indicator(s):<br />
Development Partner(s):<br />
139
Project Design Handbook<br />
140<br />
Annex 5.9: Information for Monitoring Project Process<br />
CATEGORIES<br />
OF<br />
INFORMATION<br />
Workplan<br />
Activities<br />
Costs and<br />
Expenditures<br />
Staff and<br />
Supervision<br />
Commodities<br />
Results<br />
(Outputs)<br />
WHAT TO<br />
MONITOR<br />
Timing of activities<br />
Availability of<br />
personnel,<br />
resources<br />
Budgeted amounts,<br />
funds on hand and<br />
expenditures<br />
accounted for<br />
Balance in budget by<br />
approved cost<br />
category<br />
Knowledge, attitudes<br />
and skills of staff<br />
Educational level of<br />
staff<br />
Salaries and benefits<br />
Job performance<br />
Stock<br />
Ordering and<br />
shipment status<br />
Procurement regs<br />
No. and type of<br />
services provided<br />
Characteristics of<br />
persons<br />
served/trained<br />
WHAT<br />
RECORDS TO<br />
KEEP<br />
Monthly/Quarterly<br />
workplans<br />
Work schedules<br />
Ledger of expen-<br />
ditures by budget<br />
category<br />
Receipts<br />
Bank transactions<br />
Reports to donors<br />
Performance reviews<br />
Job descriptions<br />
Resumes of staff<br />
Feedback from training<br />
attended<br />
Stock registers<br />
Invoices<br />
Field reports<br />
Client cards/forms<br />
Clinic registers<br />
Field reports<br />
Training reports<br />
WHO<br />
COLLECTS<br />
DATA<br />
Project Manager<br />
Supervisors<br />
Financial<br />
officer/accountant<br />
Project Manager<br />
Supervisors<br />
HR (Personnel )<br />
Director<br />
Trainers<br />
Logistics Manager<br />
Project Manager<br />
CBD workers<br />
Clinic nurse<br />
Field supervisors<br />
WHO USES<br />
DATA<br />
Project Manager<br />
Donor agency<br />
Project Manager<br />
Financial Officer<br />
Auditor<br />
Donor agency<br />
Supervisors<br />
Project Manager<br />
HR Director<br />
Project Manager<br />
Donor agency<br />
Field supervisor<br />
Project Manager<br />
Donor agency<br />
Community<br />
representatives<br />
HOW TO USE<br />
INFORMATION<br />
Ensure staff and other<br />
resources are<br />
available<br />
Ensure proper<br />
sequencing<br />
Ensure funds are<br />
available to execute<br />
activities<br />
Ensure compliance<br />
with funding regs<br />
If fee for service,<br />
determine fee<br />
structure<br />
Motivate staff and<br />
resolve employment<br />
problems<br />
Advise staff on career<br />
Ensure availability of<br />
commodities in stock<br />
and distribution in field<br />
Ensure condition<br />
Ensure goals are<br />
realistic<br />
Assess quality of<br />
services provided<br />
Assess<br />
appropriateness<br />
WHAT<br />
DECISIONS<br />
CAN BE MADE<br />
Reschedule activities<br />
and deployment of<br />
resources as needed<br />
Authorize expenditures<br />
Make budget and<br />
project revisions<br />
Determine need for<br />
other funding sources<br />
Placement<br />
Training needs<br />
Promotions<br />
Disciplinary actions<br />
Quantity to order<br />
When to order<br />
Amount to keep in<br />
stock<br />
Revise objectives<br />
Retrain staff<br />
Revise IEC strategy<br />
Revise project strategy<br />
and approach<br />
Adopted from CEDPA, 1994
Annex 5.10: Practical Exercise: Writing Clear<br />
and Precise Goals<br />
INSTRUCTIONS–Identify the statements below that do not meet the criteria of SMART<br />
(clear) goals. How could they be corrected? Which statements are impact goals? Effect<br />
objectives? Planned outputs?<br />
1. To increase the income of 1,000 rural farmers by 10% by August 2005.<br />
2. To decrease the infant mortality rate by June 2003.<br />
3. To increase the knowledge of 6,000 school children by April 2001.<br />
4. To help 8,000 rural farmers produce more food.<br />
5. To improve the living conditions of the urban population by 2001.<br />
6. To strengthen the support system of 800 rural mothers by 2002.<br />
7. To reduce the incidence of pertussis in the department of San Marcos from 70/1000<br />
to 40/1000 by May 2004.<br />
8. To establish 30 self-sustaining fishery cooperatives in the departments of<br />
Chimaltenango, Escuintla, and Livingston by January 2010.<br />
9. To build 30 fish ponds to increase the income of 60 rural farmers by 10% by May<br />
2004.<br />
10. To decrease the incidence of measles in children under 5 in the department of Santa<br />
Rosa from 36/1000 to 15/1000 so as to decrease the infant mortality rate by 15% by<br />
2006.<br />
11. To teach 86 rural health promoters to prepare and give oral rehydration salts to<br />
dehydrated children by May 2001.<br />
12. To teach 86 rural health promoters in the district of Jalpatagua to prepare and<br />
administer oral rehydration solution to dehydrated children under 6 years of age,<br />
following to standards set by the WHO, by September 2002.<br />
13. To build 6 paved roads in the department of Santa Rosa.<br />
14. To increase the number of farmers in the Department of Zacapa who use fertilizer on<br />
their corn from 300 to 10,000 by December 2001.<br />
Annex 5.10<br />
141
Project Design Handbook<br />
142<br />
Annex 5.11: Goal Statements and Operational<br />
Definitions<br />
Example from a water project<br />
Goal Statements<br />
PROGRAM IMPACT: Improved health status of inhabitants of Central Province<br />
PROJECT IMPACT: Water-related diseases among 5,000 rural inhabitants of<br />
Central Province will be reduced from X% to Y% by 2010.<br />
EFFECT: Community-managed hygiene education programs are established and<br />
functioning in seven villages in Central Province by 2006.<br />
Operational Definitions<br />
Improved Health Status - A decrease in infection rates for significant endemic diseases. In<br />
this context, water related diseases are known to be most significant.<br />
Water-related diseases - Infectious diseases that are caused by water quality and supply.<br />
They are classified into the following categories:<br />
a) Waterborne - Infections spread through water supplies.<br />
b) Water-washed - Diseases caused by the lack of water for personal hygiene.<br />
c) Water-based - Infections transmitted through aquatic invertebrates.<br />
d) Water-related - Infections transmitted by insects dependent on water for a part of their<br />
life cycle.<br />
Community-managed - Designated community members have control over the resources<br />
and processes necessary to sustain the system.<br />
Hygiene education program - A planned group of integrated activities designed to address<br />
individual, household, and community-level behaviors to improve health status.<br />
Established and Functioning - Programs are said to be established and functioning when<br />
they are conducted following a set plan and according to a schedule, when they have a<br />
sustainable source of inputs, and when they are effectively producing outputs that lead to<br />
desired outcomes.
Annex: Glossary of Definitions & Acronyms<br />
Definitions given in this Project Design Handbook<br />
Assumption<br />
Circumstances or conditions important for the success of the project but<br />
beyond direct control by the project. This may include beliefs, essentially<br />
improvable, held by the design team about the environment in which the<br />
project takes place. It can also include assumptions that other agencies will<br />
do their part to address related causes. (Note that such assumptions should<br />
be monitored during the life of a project.)<br />
Benchmarks<br />
Expected values or levels of achievement at specified periods of time.<br />
Causal Analysis Causal Analysis is a systematic process used to determine causes and<br />
consequences of a problem and to link them based on cause effect<br />
relationships.<br />
Causal Streams A sequence of conditions or factors, linked by cause-effect logic, that<br />
contributes to a pre-defined problem. Can also be referred to as causeeffect<br />
linkages.<br />
Comparative<br />
Capacity of an organization in terms of skills, experience and other<br />
Advantage<br />
resources.<br />
Conditions<br />
Factors that exist in the household, community, or external environment<br />
which contribute to a problem.<br />
Consequences Social, political, or economic conditions that result from a problem. A causeeffect<br />
linkage where the consequence is the effect and the problem is the<br />
cause.<br />
Diagnostics<br />
A systematic set of procedures undertaken for the purpose of gathering and<br />
analyzing information needed for setting priorities and making decisions<br />
about project or program direction and allocation of resources.<br />
Differentiation / Techniques used to identify different socio-economic groups within a<br />
Disaggregation community based on a set of criteria; a means by which to identify a specific<br />
target population or audience.<br />
Evaluation<br />
An assessment of the extent to which a project is achieving or has achieved<br />
its stated outcome goals.<br />
Force field<br />
Force field analysis is used in change management to help understand most<br />
analysis<br />
change processes in organizations. In force field analysis, change is<br />
characterized as a state of imbalance between driving forces (e.g., new<br />
personnel, changing markets, new technology) and restraining forces (e.g.,<br />
individuals’ fear of failure, organizational inertia).<br />
Household<br />
HLS is a multi-sectoral design framework employed by CARE and<br />
Livelihood Security other development organizations. It can be defined as “adequate and<br />
(HLS)<br />
sustainable access to assets and resources necessary to satisfy basic<br />
human needs.” HLS emphasizes households as the focus of analysis<br />
because they are the social and economic units within which resources<br />
are organized and allocated to meet the basic needs of the household<br />
members.<br />
Annex: Glossary<br />
143
Project Design Handbook<br />
144<br />
Hypothesis Presumed correlations between outputs and effect objectives, or between<br />
effect objectives and impact goal. The hypothesis is either accepted (from,<br />
for example, a secondary literature review) or tested during project<br />
implementation.<br />
Indicators /<br />
Aggregate<br />
Indicators /<br />
Operational<br />
Institutional<br />
Assessment<br />
Intervention<br />
Key Question<br />
Monitoring<br />
Monitoring and<br />
Evaluation Plan<br />
Needs (categories)<br />
Indicators that broadly describe progress toward a goal. They are useful as<br />
an intermediate step to defining and summarizing more specific and<br />
measurable indicators or variables.<br />
Variables that reflect a sub-set of the aggregate indicator. They are more<br />
specific in terms of what to measure and are based on the criteria developed<br />
for the aggregate indicator.<br />
A group activity to look at the organizational capacities of CARE and other<br />
institutional stakeholders; processes used to make key choices on with whom<br />
we are likely to seek collaboration, and how we make decisions about the<br />
respective roles of other organizations and CARE.<br />
A discrete package of actions and procedures that are developed and<br />
implemented. They are designed to directly (or less often indirectly) address<br />
a cause of an identified problem.<br />
All questions you can and should answer during the design of a project.<br />
Differs from an assumption in that it can lead to action. Key questions are<br />
also used to guide evaluations.<br />
The process of routinely gathering information on the process of project<br />
implementation.<br />
Describes what steps will be taken to monitor its process and evaluate the<br />
progress towards achieving effect and impact goals.<br />
Normative Needs<br />
Professional, expert, or policy judgment regarding “desirable” conditions<br />
based on national or international standards.<br />
Felt Needs<br />
Needs based on people’s perceptions and attitudes.<br />
Relative Needs<br />
Need in one area in comparison to the same need in other communities,<br />
locations, or even points in time.<br />
Needs Assessment A specific data collection activity that focuses on identifying unmet needs of<br />
the project participants. Needs are often categorized according to felt,<br />
relative and normative. Needs assessment helps identify the problems and<br />
causes the project will address, the existing local resources and<br />
opportunities for action, and constraints that have prevented the target<br />
population from solving their problem.<br />
Operating<br />
Environment<br />
Operational<br />
Definition<br />
The operating environment consists of the characteristics of a setting in<br />
which livelihoods are conducted. It includes the elements that define the<br />
context for a project and which can have a positive or negative effect on its<br />
success. The key elements that make up the operating environment include:<br />
People, Environment, Public/private Infrastructure, Beliefs and Practices,<br />
Economics, Institutions<br />
Describes specifically the terms used in goal statements and indicators to<br />
simplify and shorten those statements and provide practice in selecting<br />
appropriate indicators.<br />
Participant Group A population of individuals or institutions directly affected by a problem and<br />
which might benefit from a proposed intervention.
Partnership Partnerships are relationships that result from putting into practice a set of<br />
principles that create trust and mutual accountability. Partnerships are<br />
based on shared vision, values, objectives, risk, benefit, control and learning,<br />
as well as joint contribution of resources. The degree of interdependence is<br />
unique to each relationship, depends on context, and evolves over time.<br />
Problem<br />
A condition or set of conditions that affect people in a negative way (e.g.,<br />
death, infectious diseases, poverty, low income, low agricultural production,<br />
inadequate housing).<br />
Programming<br />
Principles<br />
Frameworks that can be used to define appropriate problems to address.<br />
These frameworks also help clarify a project’s context and how a project<br />
links to larger program goals.<br />
Project Design The collaborative and systematic identification and prioritization of problems<br />
and opportunities and the planning of solutions and ways of assessing project<br />
outcomes, which together will promote fundamental and sustainable change in<br />
target populations and institutions.<br />
Reflective practice The art of continual self-reflection, which enables us to routinely assess<br />
whether we are on course to achieve our goals.<br />
Rights-Based<br />
Approach (RBA)<br />
Stakeholder<br />
Analysis<br />
Rights-based approaches deliberately and explicitly focus on people achieving<br />
the minimum conditions for living with dignity (i.e., achieving their human<br />
rights). They do so by exposing the roots of vulnerability and marginalization<br />
and expanding the range of responses. They empower people to claim and<br />
exercise their rights and fulfil their responsibilities. A rights-based<br />
approach recognizes poor, displaced, and war-affected people as having<br />
inherent rights essential to livelihood security – rights that are validated by<br />
international law.<br />
An analysis of individuals and/or organizations that are involved in or may be<br />
affected by project activities.<br />
Strategy Based on the cause-effect logic of problem analysis, the strategy is the<br />
approach through which project inputs and resulting outputs bring about the<br />
desired changes leading to sustainable impact on human wellbeing.<br />
Underlying Causes Major causes of problems that are often the effects of other causes and<br />
must be defined during the synthesis stage of design.<br />
Acronyms used in this handbook<br />
CBO Community-Based Organization<br />
CI CARE International<br />
DME Design, Monitoring and Evaluation<br />
HLS Household Livelihood Security<br />
IEC Information, Education, Communication<br />
NGO Non-Governmental Organization<br />
RBA Rights-Based Approach(es)<br />
Annex: Glossary<br />
145
Project Design Handbook<br />
146<br />
Annex: Bibliography and Suggested Reading<br />
Chapter 1: Overall Design Issues<br />
CARE International (2001) CARE International Design, Monitoring and Evaluation Basic<br />
Standards. Draft. Wood Norton Conference.<br />
Carney, Diane (ed.) (1998) Sustainable Rural Livelihoods: What contribution can we make?,<br />
DFID, London<br />
Chambers, Robert and Gordon Conway (1992) Sustainable Rural Livelihoods: Practical<br />
Concepts for the 21st Century. IDS Discussion Paper 296. Brighton, Institute for<br />
Development Studies.<br />
Frankenberger, Timothy and Michael Drinkwater (1999) Household Livelihood Security: A<br />
holistic approach for addressing poverty and vulnerability, CARE.<br />
Frankenberger, Timothy R., Michael Drinkwater and Daniel Maxwell (2000) Operationalizing<br />
Household Livelihood Security. A Holistic Approach for Addressing Poverty and<br />
Vulnerability. CARE/FAO Publication.<br />
Frankenberger, T.R. and M. Katherine McCaston (1988) From Food Security to Livelihood<br />
Security: The Evolution of Concepts. CARE USA.<br />
Jones, Andrew (2001) Incorporation of a Rights-Based Approach into CARE’s Program<br />
Cycle: A Discussion Paper for CARE’s Program Staff. CARE, Atlanta, GA.<br />
Kirkpatrick, Colin and Weiss, John (1996) Benefit-Cost Analysis and Project Appraisal in<br />
Developing Countries. Cheltenham, UK: Edward Elgar.<br />
Valadez, Joseph and Bamberger, Michael (eds.) (1994) Monitoring and Evaluating Social<br />
Programs in Developing Countries. The World Bank. Washington, DC<br />
Chapter 2: Appraisal<br />
AusAID (2000) The Logical Framework Approach: Stakeholder Analysis. in AusGuidelines.<br />
2000. AusAID-Commonwealth of Australia.<br />
Blohm, Judee (1996) PACA: Participatory Analysis for Community Action. U.S. Peace<br />
Corps, Washington, DC.<br />
CARE Malawi (1998) Malawi Participatory Livelihood Assessment Exercise. Synthesis<br />
Report. Lilongwe.<br />
<strong>Caldwell</strong>, <strong>Richard</strong> (1999) Project Design Training Guidelines. CARE-USA.
Annex: Bibliography<br />
<strong>Caldwell</strong>, <strong>Richard</strong>; Ronald V. Curtis, Timothy Frankenberger, and Todd Lofgren (2001) A<br />
Sustainable Livelihood Approach for Natural Resource Management. Prepared for<br />
UN-WFP. TANGO International, Inc.<br />
Drinkwater, Michael and Tamara Rusinow (1999) Application of CARE’s Livelihoods<br />
Approach. Presentation for NRAC ’99. CARE.<br />
Frankenberger, Timothy R. (2000) A Brief Overview of Sustainable Livelihood Approaches.<br />
CARE-USA. Atlanta, GA<br />
Frankenberger, T. and K. McCaston (1999) Rapid Food and Livelihood Security<br />
Assessments: A comprehensive approach for diagnosing nutritional security. In: T.<br />
Marchione (Ed.) Scaling Up Scaling Down: Overcoming Malnutrition in Developing<br />
Countries. Amsterdam: Overseas Publishers Association.<br />
IDRC (1998) Social Science Resource Kit, Volume 7: Stakeholder Analysis. IDRC.<br />
IIDS (1996) Participatory Research for Sustainable Livelihoods: A guide for field projects on<br />
adaptive strategies. IIDS.<br />
McCaston, K. (1998) Tips for Collecting, Reviewing, and Analyzing Secondary Data. CARE-<br />
USA. Atlanta, GA<br />
Maxwell, D. and R. Rutahakana (1997) Dar es Salaam Urban Livelihood Security<br />
Assessment: design, background, strategy data collection and analysis<br />
methodology. Dar es Salaam: CARE-Tanzania.<br />
Pareja, M. (1997) Preparing for a Rapid Livelihood Security Assessment. Nairobi: CARE-<br />
East Africa.<br />
Gillespie, Stuart (2001) Strengthening capacity to improve nutrition. FCND Discussion<br />
Paper No. 106. International Food Policy Research Institute. Washington, D.C.<br />
Reitbergen-McCracken, J. and D. Narayan (1997) “Stakeholder Analysis, Module II", in:<br />
Participatory Tools and Techniques: A resource kit for participation and social<br />
assessment. The World Bank: Social Policy and Resettlement Division, Environment<br />
Department.<br />
Stuckey, Joseph D., Barbara Durr and Gwen M. Thomas (2000) Promising Practices: A<br />
Case Study Review of Partnership. Lessons and Issues: What we are learning in<br />
CARE. CARE USA. Partnership and Household Livelihood Security Unit. Working<br />
Draft.<br />
Witkin, B.R. and J.W. Altschuld (1995) Planning and Conducting Needs Assessments.<br />
London: Sage Publications.<br />
World Bank (1996) World Bank Participation Sourcebook. Washington, DC<br />
147
Project Design Handbook<br />
148<br />
Chapter 3: Analysis and Synthesis<br />
Baker, Sunny and Kim Baker (1998) The Complete Idiot’s Guide to Project Management.<br />
Alpha Books, New York.<br />
Blohm, Judee (1996) PACA: Participatory Analysis for Community Action. U.S. Peace<br />
Corps, Washington, DC.<br />
Bro, Enrique (1995) Design, Monitoring and Evaluation of Technical Cooperation<br />
Programmes and Projects. International Labour Office, Geneva.<br />
Dale, Reidar (1998) Evaluation Frameworks for Development Programmes and Projects.<br />
Sage Publications, New Delhi, India.<br />
Davis-Case, D’Arcy (1990) The Idea, Methods and Tools for Participatory Assessment,<br />
Monitoring and Evaluation in Community Forestry. Community Forestry Field<br />
Manual #2. Food and Agricultural Organization of the United Nations, Rome.<br />
Juran, J.M. and F.M. Gyrna (eds.) (1988) Juran’s Quality Control Handbook (4 th ed.). New<br />
York: McGraw Hill.<br />
Witkin, B.R. and J.W. Altschuld (1995) Planning and Conducting Needs Assessments.<br />
London: Sage Publications.<br />
Chapter 4: Focused Strategy<br />
AusAID (1998) The Logical Framework Approach (LFA). Handbook for Objectives-oriented<br />
Project Planning.<br />
CDIE (1987) The Logical Framework Approach to Portfolio Design, Review and Evaluation<br />
in A.I.D.<br />
CIDA (1989) Guide for the use of the Logical Framework Approach in the Management and<br />
Evaluation of CIDA’s International Projects. Evaluation Division.<br />
Corbeil, R. (1986) Logic on Logic Models. Evaluation Newsletter. Ottawa, Canada: Office<br />
of the Comptroller General of Canada.<br />
Jones, Andrew (2001) Incorporation of a Rights-Based Approach into CARE’s Program<br />
Cycle: A Discussion Paper for CARE’s Program Staff. CARE, Atlanta, GA.<br />
Meadows, Donella (1999) Leverage Points: Places to intervene in a system. The<br />
Sustainability Institute. Hartland 4 Corners, VT<br />
TEAM Technologies, Inc. (1998) PC/LogFrame (tm) 1988-1992. Results Oriented<br />
Assistance Sourcebook, USAID.<br />
USAID (1999) Results Framework. (see following URLs)
Annex: Bibliography<br />
• Introduction/context for planning system,<br />
http://www.info.usaid.gov/pubs/sourcebook/usgov/mfr.html ;<br />
• Material developed by MSI for training in the new strategic planning system,<br />
http://www.afrsd.org:8000/reson/Training/RF%20materials/RF%20contents.ht<br />
m;<br />
• Excerpt from “Reaching 4 Results” training program,<br />
http://www.info.usaid.gov/pubs/r4workshop/STRATEG6/ .<br />
Chapter 5: Coherent Information Systems<br />
Barton, Tom (1997) How Are We Doing? M&E Guidelines for CARE Uganda. CARE-USA.<br />
Atlanta, GA<br />
CARE International (1999) CARE Impact Guidelines.<br />
CEDPA (1994) Project Design for Program Managers: conducting a workshop on planning<br />
community-based approaches.<br />
ODA [now DfID] (1995) A Guide to Appraisal, Design, Monitoring, Management and Impact<br />
Assessment of Health & Population Projects.<br />
Montague, S. (1997) Evaluators and performance measurement: bringing the logic model to<br />
the manager. Canadian Evaluation Society Newsletter, Vol. 17, No. 2.<br />
Montague, S. (1997) The Three R’s of Performance: Core Concepts for Planning,<br />
Measurement, and Management. Ottawa, Canada: Performance Management<br />
Network, Inc.<br />
United Way of America (1996) Measuring Program Outcomes: A Practical Approach.<br />
Arlington, VA: United Way of America.<br />
Chapter 6: Reflective Practice<br />
Peters, J. (1991) "Strategies for Reflective Practice." In Professional Development for<br />
Educators of Adults. New Directions for Adult and Continuing Education, No. 51,<br />
edited by R. Brockett. San Francisco: Jossey-Bass.<br />
Ross, D.D. (1990) Programmatic structures for the preparation of reflective teachers. In<br />
R.T. Clift, Houston, W.R., & Pugach, M.C. (Ed.), Encouraging Reflective Practice in<br />
Education (pp. 97-118). New York: Teachers College Press.<br />
Roth, R.A. (1989) Preparing the Reflective Practitioner: Transforming the Apprentice<br />
through the Dialectic. Journal of Teacher Education 40, No. 2.<br />
Schon, D. (1983) The Reflective Practitioner. New York: Basic Books.<br />
149
Project Design Handbook<br />
150<br />
Schon, D. (1985) The Design Studio. London: RIBA Publications Limited.<br />
Schon, D. (1987) Educating the reflective practitioner: Toward a new design for teaching<br />
and learning in the professions. San Francisco: Jossey-Bass.<br />
Schon, D. (1988) Educating the Reflective Practitioner. San Francisco: Jossey-Bass.<br />
Additional Highly Recommended References and<br />
links to many more:<br />
CARE (Paul O’Brien) (2001) Benefits-Harms Handbook. For copies contact Paul O’Brien<br />
pobrien@care.org.<br />
CARE (Sofia Sprechmann and Emily Pelton) (2001) Advocacy Tools and Guidelines:<br />
Promoting Policy Change – A Resource Manual for CARE Program Managers.<br />
Web pages with useful resources for Project Design:<br />
Earl, Sarah, Fred Carden and Terry Smutylo (2001) Outcome Mapping: Building Learning<br />
and Reflection into Development Programs. Sterling, VA: IDRC / Stylus Publishing<br />
Inc. http://www.idrc.ca/booktique or http://www.idrc.ca/evaluation<br />
den Heyer, Molly (2001) Literature Review from: The Development of a Temporal Logic<br />
Model Ottawa: IDRC. http://www.idrc.ca/evaluation<br />
Appreciative Inquiry: http://appreciativeinquiry.cwru.edu/<br />
USAID has many resources. See especially Performance Monitoring & Evaluation TIPS:<br />
http://www.dec.org/usaid_eval/#004<br />
Main web page for finding CARE and other DME resources:<br />
http://www.kcenter.com/care/dme/