d - Mahratta Chamber Of Commerce Industries & Agriculture Pune
d - Mahratta Chamber Of Commerce Industries & Agriculture Pune
d - Mahratta Chamber Of Commerce Industries & Agriculture Pune

You also want an ePaper? Increase the reach of your titles
YUMPU automatically turns print PDFs into web optimized ePapers that Google loves.
(around 6000) that have both<br />
employment as well as poverty<br />
implications.<br />
Contribution of MSE Sector<br />
The MSE sector no doubt is a vital part<br />
of Indian Economy. According to<br />
Eleventh Five Year Plan (Vol. III, P 195)<br />
the MSE sector accounts for “…… 95%<br />
of the industrial units …………. and 34%<br />
of exports. They manufacture over 6000<br />
product ranging from handloom sarees,<br />
carpets, soaps to pickles, papads and<br />
machine parts for large industries.” The<br />
plan further states that (p. 199), “Non<br />
traditional products account for more<br />
that 95% of the SSI exports. The<br />
performance of garments, leather and<br />
gems and jewelry units has been<br />
remarkable in the last decade…. sector<br />
dominates in export of sports goods,<br />
ready made garments, woollen<br />
garments and knitwear, plastic<br />
products, processed foods and leather<br />
products.”<br />
One is not sure as to how far the<br />
performance of small sized enterprises<br />
in India is shaped by an elaborate<br />
package of promotional and protective<br />
devices. It is difficult to establish even a<br />
rough correspondence between the<br />
instruments of policy and their outcome.<br />
However, an essential step towards<br />
understanding the various facets of<br />
small firm growth would be to have an<br />
assessment of the relative importance<br />
of these enterprises as part of the<br />
industrial system. It may be noted that<br />
the information lacks precision and<br />
diverse data sources depicting size<br />
class changes often lack mutual<br />
consistency. In addition, several studies<br />
point out that small enterprises tend to<br />
conceal income and employment and<br />
the large size units often use MSE<br />
Sector as ‘Parking Place’ to take<br />
advantage of concessions meant for<br />
small size units.<br />
Contribution to National Income<br />
Given this caveat, the relative share of<br />
small-sized enterprises can be<br />
assessed in terms of its contribution to<br />
value added and employment. In both<br />
cases we study, to the extent possible,<br />
the relative share of MSE sector as part<br />
of the industrial economy, which in turn<br />
is treated as part of the total economy. It<br />
is seen that the relative share of the<br />
secondary sector (manufacturing,<br />
construction and power generation) in<br />
terms of value added rose rapidly up to<br />
the mid-1960s from 14.0 per cent to<br />
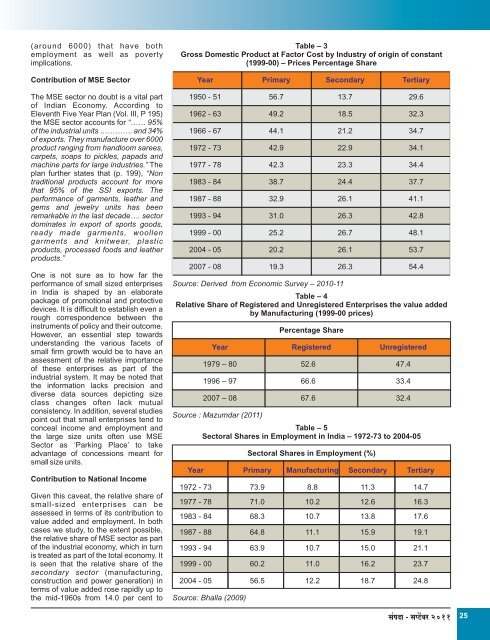
Table – 3<br />
Gross Domestic Product at Factor Cost by Industry of origin of constant<br />
(1999-00) – Prices Percentage Share<br />
Year Primary Secondary Tertiary<br />
1950 - 51 56.7 13.7 29.6<br />
1962 - 63 49.2 18.5 32.3<br />
1966 - 67 44.1 21.2 34.7<br />
1972 - 73 42.9 22.9 34.1<br />
1977 - 78 42.3 23.3 34.4<br />
1983 - 84 38.7 24.4 37.7<br />
1987 - 88 32.9 26.1 41.1<br />
1993 - 94 31.0 26.3 42.8<br />
1999 - 00 25.2 26.7 48.1<br />
2004 - 05 20.2 26.1 53.7<br />
2007 - 08 19.3 26.3 54.4<br />
Source: Derived from Economic Survey – 2010-11<br />
Table – 4<br />
Relative Share of Registered and Unregistered Enterprises the value added<br />
by Manufacturing (1999-00 prices)<br />
Percentage Share<br />
Year Registered Unregistered<br />
1979 – 80 52.6 47.4<br />
1996 – 97 66.6 33.4<br />
2007 – 08 67.6 32.4<br />
Source : Mazumdar (2011)<br />
Table – 5<br />
Sectoral Shares in Employment in India – 1972-73 to 2004-05<br />
Sectoral Shares in Employment (%)<br />
Year Primary Manufacturing Secondary Tertiary<br />
1972 - 73 73.9 8.8 11.3 14.7<br />
1977 - 78 71.0 10.2 12.6 16.3<br />
1983 - 84 68.3 10.7 13.8 17.6<br />
1987 - 88 64.8 11.1 15.9 19.1<br />
1993 - 94 63.9 10.7 15.0 21.1<br />
1999 - 00 60.2 11.0 16.2 23.7<br />
2004 - 05 56.5 12.2 18.7 24.8<br />
Source: Bhalla (2009)<br />
g§nXm - gßQ>|~a 20125