MARKET RESPONSE TO A MAJOR POLICY CHANGE IN THE ...
MARKET RESPONSE TO A MAJOR POLICY CHANGE IN THE ...
MARKET RESPONSE TO A MAJOR POLICY CHANGE IN THE ...

Create successful ePaper yourself
Turn your PDF publications into a flip-book with our unique Google optimized e-Paper software.
<strong>MARKET</strong> <strong>RESPONSE</strong> <strong>TO</strong> A <strong>MAJOR</strong> <strong>POLICY</strong> <strong>CHANGE</strong> <strong>IN</strong> <strong>THE</strong> <strong>MARKET</strong><strong>IN</strong>G MIX:<br />
LEARN<strong>IN</strong>G FROM P&G’S VALUE PRIC<strong>IN</strong>G STRATEGY<br />
By<br />
Kusum L. Ailawadi *<br />
Donald R. Lehmann **<br />
and<br />
Scott A. Neslin ***<br />
* Associate Professor of Business Administration<br />
Amos Tuck School of Business Administration<br />
Dartmouth College<br />
Hanover, NH 03755<br />
e-mail: Kusum.L.Ailawadi@Dartmouth.edu<br />
Tel: (603) 646-2845<br />
** George E. Warren Professor of Business<br />
Graduate School of Business<br />
Columbia University<br />
*** Albert Wesley Frey Professor of Marketing<br />
Amos Tuck School of Business Administration<br />
Dartmouth College<br />
Note: Authors are listed in alphabetical order to reflect their equal contribution to this research.<br />
Acknowledgements:<br />
The authors are grateful to Paul O'Connor and Jeannie Newton for their invaluable assistance<br />
with data compilation, and to Pete Fader, Jeff Inman, Chris Moorman, and the University of<br />
Chicago Marketing Department for making some of the data used in this paper available. They<br />
also thank Frank Bass, Paul Farris, Karen Gedenk, Sunil Gupta, Kevin Keller, Punam Keller,<br />
Praveen Kopalle, Carl Mela, Vithala Rao, Robert Shoemaker, Frederick Webster Jr., and<br />
participants at the 1999 <strong>IN</strong>FORMS Marketing Science Conference, the 1999 Northeast<br />
Marketing Consortium, and seminars at the University of North Carolina at Chapel Hill, Boston<br />
University, and the Tuck School for helpful comments. Finally, the authors thank the JM Editor,<br />
Dave Stewart, and four anonymous reviewers for their suggestions. This research was supported<br />
by the Tuck Associates Program.
<strong>MARKET</strong> <strong>RESPONSE</strong> <strong>TO</strong> A <strong>MAJOR</strong> <strong>POLICY</strong> <strong>CHANGE</strong> <strong>IN</strong> <strong>THE</strong> <strong>MARKET</strong><strong>IN</strong>G MIX:<br />
LEARN<strong>IN</strong>G FROM P&G’S VALUE PRIC<strong>IN</strong>G STRATEGY<br />
EXECUTIVE SUMMARY<br />
Most research on how consumers and competitors respond to advertising and promotion focuses<br />
on response to short-term changes in these marketing instruments. In contrast, this paper uses<br />
Procter & Gamble’s value pricing strategy as an opportunity to study consumer and competitor<br />
response to a major, sustained change in marketing mix strategy. We compile data for 118<br />
brands across 24 product categories where P&G is a player, covering a seven-year period from<br />
1990-1996 when P&G initiated and broadly implemented its value pricing strategy in the U.S.<br />
During this period, the company instituted major cuts in deals and coupons and substantial<br />
increases in advertising across its product line. We use regression-based models to examine how<br />
consumers and competitors reacted to these changes, and trace the net impact on market share.<br />
Our consumer response model decomposes market share into penetration, share of requirements,<br />
and category usage among the brand’s customers. For the average brand, we find that deals and<br />
coupons increase penetration and, somewhat surprisingly, have little effect on customer retention<br />
as measured by SOR and USE. For the average brand, advertising also works primarily by<br />
increasing penetration but its effect is weaker than that of promotion. We find little evidence that<br />
advertising increases SOR or USE among a brand’s existing users. Overall, advertising is more<br />
beneficial for small brands while promotion is more beneficial for large brands. Our competitor
esponse model shows that response is related to how strongly the competitor’s market share is<br />
affected by the change in P&G’s marketing mix (through cross-elasticities) and how strongly its<br />
own reaction will affect its share (through self-elasticities). Competitors also respond differently<br />
due to structural factors such as market share position and multi-market contact, and due to firm-<br />
specific effects. Competitors do not react the same way on all marketing instruments. They<br />
tended to decrease advertising and coupons but used deals to gain market share even when they<br />
were benefiting from P&G's policy change. We find that the net impact of consumer and<br />
competitor response is a decrease in market share for the initiating company, although it is<br />
plausible that its profits increased. The loss in penetration resulting from promotion cuts is not<br />
offset by increases in SOR or by competitive reactions. It appears that cuts in promotion, even if<br />
coupled with increases in advertising, will not grow market share for the average established<br />
brand in mature consumer goods categories. We discuss the implications of these and other<br />
findings for both researchers and practitioners.<br />
2
1. Introduction<br />
In the last decade, researchers have made important advances in understanding both consumer<br />
and competitive response to advertising and promotion. Researchers have quantified consumer<br />
response to promotion in terms of brand switching, repeat purchase, stockpiling, and<br />
consumption (Gupta 1988; Ailawadi and Neslin 1998; Bell, Chiang, and Padmanabhan 1999),<br />
and investigated the extent to which advertising attracts new users and retains loyal customers<br />
(Tellis 1988; Deighton, Henderson, and Neslin 1994). In studying competitor response,<br />
researchers have assessed the role of marketing mix elasticities (Leeflang and Wittink 1996;<br />
Putsis and Dhar 1998) and begun to unravel the game-theoretic structure of competition<br />
(Cotterill, Putsis, and Dhar 1999; Kadiyali, Vilcassim, and Chintagunta 1999).<br />
While these studies have enhanced our understanding of how consumers and competitors<br />
respond to advertising and promotion, they typically focus on response to short-term changes in<br />
these marketing instruments. Rarely have researchers studied the effects of major policy changes.<br />
The purpose of this paper is to examine market response to a major and sustained change in<br />
advertising and promotion policy. We use P&G’s value pricing strategy to examine consumer<br />
and competitive response, and to trace how this response ultimately affects market share.<br />
Starting in 1991-92, P&G instituted major reductions in promotion and increases in advertising<br />
in an effort to reduce operating costs and strengthen brand loyalty (Shapiro 1992). This new<br />
policy ran counter to the general trend of promotion increases at the expense of advertising that<br />
prevailed in the packaged goods industry during the eighties and early nineties (Donnelley<br />
Marketing 1997).
Analysis of market response to such a major policy change offers several advantages. First, it<br />
provides substantial variation in marketing mix variables instead of week-to-week movement<br />
around a fairly stable level. This provides better estimates of the impact of marketing mix<br />
variables. For example, Deighton, Henderson, and Neslin (1994) find that advertising attracts<br />
consumers to the brand but does not increase purchase probabilities among current users. They<br />
note, however, that this finding may not be applicable beyond the range of their data.<br />
Second, the sustained policy change allows us to evaluate the effectiveness of advertising and<br />
promotion in a long-term setting. Studies based on short-term changes in advertising and<br />
promotion often find that promotion has a much stronger effect on market share than advertising<br />
(e.g., Tellis 1988; Sethuraman and Tellis 1991; Deighton, Henderson, and Neslin 1994).<br />
However, Farris and Quelch (1987, p. 91) note that the effects of relatively minor changes in<br />
advertising are hard to detect and recommend that advertising experiments should be long<br />
enough for measurable effects to occur.<br />
Third, it also allows us to study competitor response in a long-term setting. The reaction of<br />
competitors to marketing mix changes by a market leader depends, at least to some extent, on<br />
consumer response elasticities (Gatignon, Anderson, and Helsen 1989; Leeflang and Wittink<br />
1996). Thus, if consumer response to sustained marketing mix changes differs from short-term<br />
response, competitor response is likely to be different.<br />
2
Fourth, researchers have recently called for studying responses to fundamental policy changes<br />
that are of strategic importance to senior management, not just the tactical changes that are made<br />
in the short-term (e.g., Abeele 1994).<br />
Fifth, the fact that P&G is the clear leader in this setting simplifies the analysis of competitive<br />
response in that we don’t have to first determine who, if anyone, is the leader (see, for example,<br />
Leeflang and Wittink 1996; Kadiyali, Vilcassim, and Chintagunta 1999).<br />
Finally, P&G’s policy change is broad-based. Our data and analysis encompass 118 brands in 24<br />
product categories in the packaged goods industry. This should make our results more<br />
generalizeable than those of other market response studies that are based on one or two product-<br />
markets.<br />
We use the sustained policy change enacted in P&G’s value pricing move to investigate three<br />
major research questions:<br />
• What are the roles of advertising and promotion in attracting and retaining customers?<br />
• To what extent are competitor reactions determined by market share response elasticities<br />
and structural factors versus firm-specific strategy?<br />
• How do consumer and competitive responses combine to determine the overall effect of a<br />
sustained change in advertising and promotion on market share?<br />
Our study is unique in integrating both consumer and competitor response to a substantial,<br />
sustained change in advertising and promotion, and in doing so across a large number of brands<br />
and product categories.<br />
3
The paper is organized as follows. First, we discuss previous work relevant to the central<br />
questions of this research, and present our conceptual model for analyzing them. In Section 3, we<br />
describe the data and provide an overview of P&G's Value Pricing strategy. Sections 4 and 5<br />
present results for consumer and competitor response. Section 6 shows how these responses<br />
combine to determine the overall impact on market share. In Section 7, we summarize our<br />
findings and discuss implications for researchers and managers.<br />
2. Theoretical Background and Conceptual Model<br />
In this section, we summarize the theoretical and empirical literature on consumer and<br />
competitor response to advertising and promotion that is most relevant for our research<br />
questions, and use it to develop our conceptual model.<br />
2.1 Consumer Response<br />
A firm’s advertising and promotion policy influences its ability to attract and retain customers by<br />
inducing more of them to (a) switch to the firm’s brand, (b) repeat-purchase it more often, or (c)<br />
consume larger quantities.<br />
(a) Brand Switching: As described by Blattberg and Neslin (1990), promotions induce<br />
consumers to switch into a brand by improving short-term attitudes toward it, conditioning<br />
consumers to respond to promotions, simplifying the purchase decision, and reducing perceived<br />
risk. These theories are supported by several empirical studies showing that promotions result in<br />
a large brand switching effect (e.g., Gupta 1988; Bell, Chiang, and Padmanabhan 1999).<br />
4
Advertising can induce brand switching either through raising awareness or improving consumer<br />
attitudes (Vakratsas and Ambler 1999). While there is ample evidence that advertising influences<br />
awareness and attitudes, there is less evidence that it exerts a significant effect on brand<br />
switching. Deighton et al. (1994), and Lodish et al. (1995a, b) find that advertising helps small or<br />
new brands, presumably by attracting new users.<br />
(b) Repeat Purchasing: Three theories point to a negative relationship between promotion and<br />
repeat purchasing. First, self-perception and attribution theories suggest that steep price cuts<br />
encourage consumers to attribute their purchase of the brand to the promotion, not to underlying<br />
preferences (Dodson, Tybout, and Sternthal 1978). Second, behavioral learning theory indicates<br />
that promotions train the consumer to buy on deal rather than repeat-purchase the brand<br />
(Rothschild 1987). Third, promotion can reduce the consumer’s reference price for the brand,<br />
causing “sticker shock” on the next purchase (Winer 1986).<br />
Theoretical support also exists for a positive effect of promotions. Promotions can be used to<br />
“shape” brand loyalty, thus increasing repeat rates (Rothschild and Gaidis 1981). Promotions can<br />
increase repeat rates in a competitive environment because they preempt current users from<br />
taking advantage of other brands’ promotions and therefore increase purchase probabilities not<br />
only among new triers but among current users as well.<br />
Empirical research on promotion and repeat purchasing has produced a range of findings,<br />
including a negative association (Dodson, Tybout, and Sternthal 1978), no association<br />
(Ehrenberg, Hammond, and Goodhardt 1994), and both positive and negative associations<br />
(Gedenk and Neslin 2000).<br />
5
Theory regarding the role of advertising in repeat purchasing centers on attitudes and framing.<br />
Advertising enhances beliefs, thereby improving attitudes and encouraging higher repeat rates.<br />
Framing theory suggests that advertising does not immediately persuade the consumer but it does<br />
predispose him or her toward a favorable consumption experience.<br />
Empirical evidence on the role of advertising in repeat purchasing is mixed. Deighton (1984)<br />
provides evidence for framing, and Tellis (1994) finds that advertising increases repeat<br />
purchasing. On the other hand, Deighton et al. (1994) find that advertising serves more to induce<br />
brand switching than to reinforce repeat purchasing. Lodish et al.’s (1995a, b) findings also<br />
suggest that advertising primarily influences brand switching rather than repeat purchasing<br />
(small and new brands have more customers to attract and fewer to retain).<br />
(c) Consumption: Promotion can increase the consumption rate among a brand’s users by<br />
inducing them to load up on the brand and then consume it faster (Folkes, Martin, and Gupta<br />
1993; Wansink and Deshpande 1994; Ailawadi and Neslin 1998). However, promotion may also<br />
decrease consumption among a brand’s users because many of these users have bought only<br />
because of the promotion, and may buy smaller sizes because of perceived risk (Blattberg and<br />
Neslin 1990, pg. 49). Wansink (1994) and Wansink and Ray (1996) provide theoretical and<br />
experimental evidence that advertising can induce higher category consumption by suggesting<br />
new usage situations.<br />
(d) Moderators of Consumer Response: Researchers have found that advertising and promotion<br />
elasticities differ by brand as well as by product category. Probably the most important brand<br />
characteristic found to influence market share elasticities is brand market share: high share<br />
6
ands have weaker elasticities than low share brands (Ghosh, Neslin, and Shoemaker 1983;<br />
Bolton 1989; Danaher and Brodie 1999). Additional characteristics that have been found to<br />
influence elasticities include promotional and advertising activity, stockpileability, average<br />
purchase cycle, salesforce, distribution, and advertising copy (Ghosh, Neslin, and Shoemaker<br />
1983; Litvack, Calantone, and Warshaw 1985; Bolton 1989; Gatignon 1993; Kaul and Wittink<br />
1995; Narasimhan, Neslin, and Sen 1996; Bell, Chiang, and Padmanabhan 1999).<br />
2.2 Competitor Response<br />
There are two streams of competitor response research. The micro approach studies the nature of<br />
competitive interactions in established markets using weekly or monthly data (e.g., Leeflang and<br />
Wittink 1996; Putsis and Dhar 1998; Kadiyali et al. 1999). The macro approach focuses on the<br />
response of incumbent firms to new entrants in the market (e.g., Robinson 1988; Gatignon et al.<br />
1989; Ramaswamy, Gatignon, and Reibstein 1994; Shankar 1998). Both streams draw on the<br />
economics, industrial organization, and/or strategy literature to identify three sets of factors that<br />
influence competitor response: (a) market share elasticities, (b) structural factors, and (c) firm-<br />
specific effects.<br />
(a) Market Share Response Elasticities: Economic theory posits that competitor response to a<br />
firm’s change in advertising and promotion is governed by cross-elasticities (how strongly the<br />
competitor’s share is affected by the firm’s move) and self-elasticities (how easily the competitor<br />
can recover lost share). For instance, Leeflang and Wittink (1996) show that competitors should<br />
react more strongly to preserve their market shares if their cross-elasticities are high. Although<br />
self- and cross-elasticities should determine whether a competitor reacts, the empirical literature<br />
shows that it is more difficult to predict their effect on how the competitor will react. For<br />
7
instance, Gatignon, Anderson, and Helsen (1989), Putsis and Dhar (1998), and Shankar (1998)<br />
show that firms compete more strongly with effective weapons, i.e., with variables for which<br />
they have strong self-elasticities. However, Brodie, Bonfrer, and Cutler (1996) and Leeflang and<br />
Wittink (1996) find that competitors often either over-react or under-react; Bell and Carpenter<br />
(1992) show that competitor response is different depending upon the objectives sought; and<br />
Putsis and Dhar (1998) note that responses to cooperative versus competitive moves can be very<br />
different.<br />
(b) Structural Factors: Industrial organization theory suggests that market structure influences<br />
competitive interaction (Scherer and Ross 1990). Concentration of the market, market share<br />
position, and multi-market contact of competitors with the initiating firm have been identified as<br />
key structural determinants of competitor response. As with elasticities, however, it is difficult to<br />
predict the direction of their influence. For instance, some researchers believe that multi-market<br />
contact increases competitive rivalry (Porter 1980), while others argue that it leads to mutual<br />
forbearance and dampens rivalry because the competing firms have a high stake in many shared<br />
markets (Bernheim and Whinston 1990; Shankar 1999). Dominant competitors are expected to<br />
react differently from fringe firms, although it is not clear what the differences are (e.g., Spiller<br />
and Favaro 1984; Putsis and Dhar 1998; Shankar 1999). Market concentration is expected to<br />
increase cooperative behavior because monitoring is easier, signaling is more likely to be<br />
perceived, and firms are less likely to compete away high margins (e.g., Qualls 1974; Scherer<br />
and Ross 1990; Ramaswamy, Gatignon and Reibstein 1994).<br />
(c) Firm-Specific Effects: The resource-based view conceptualizes the firm as a unique entity<br />
with specific core competencies, leadership, culture, and resources that determine its actions<br />
(Wernerfelt 1984; Barney 1991; Collis 1991; Chen 1996). Not surprisingly, the marketing<br />
8
literature focuses on identifying and measuring the marketing resources of firms, e.g., brand<br />
equity, sales force, advertising and general marketing expertise, and market orientation (e.g.,<br />
Capron and Hulland 1999). While market share position and marketing mix elasticities may be<br />
imperfect surrogates for resources like brand equity and marketing expertise, other resources and<br />
competencies are unobserved or difficult to measure and are accounted for through a firm-<br />
specific effect (e.g., Boulding and Staelin 1993).<br />
2.3 Conceptual Framework<br />
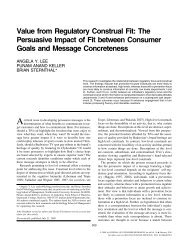
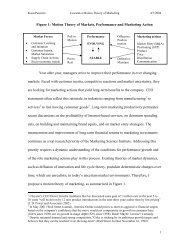
Based on this literature, we have developed the framework in Figure 1 to answer our research<br />
questions. The consumer response portion of this framework decomposes market share into three<br />
components and considers the effects of own and competitive marketing mix on these<br />
components. These effects are moderated by brand and category characteristics. The competitive<br />
response portion posits that market share elasticities, structural factors, and firm-specific effects<br />
determine competitor reaction. Finally, the net impact of a policy change by a brand comes both<br />
directly, from consumer response to its own policy change, and indirectly, through competitors’<br />
reactions to the policy change and consumers’ response to the competitors’ reactions.<br />
<br />
(a) Decomposition of Market Share: Market share, the central focus of our study, is the product<br />
of three components: penetration (PEN), share-of-category-requirements (SOR), and category<br />
usage (USE). These three components correspond to brand switching, repeat purchasing, and<br />
consumption effects, respectively, as the means by which advertising and promotion attract and<br />
retain customers. PEN is the proportion of category users who purchase the brand at least once.<br />
SOR is the proportion of the brand’s customers’ category purchases accounted for by the brand.<br />
9
USE is the average category purchase volume of the brand's customers compared to the average<br />
category purchases of all households buying the category. Market share equals PEN times SOR<br />
times USE. 1 For example, P&G is purchased by 55% of all bar soap buyers. Buyers of P&G are<br />
somewhat heavier users of bar soap. Their use of the category is 1.30 times that of the average<br />
category user. Only 49% of their bar soap purchases are accounted for by P&G, so they are not<br />
very loyal to P&G. Therefore, P&G's share in the bar soap category is 0.55 (PEN) times 1.30<br />
(USE) times .49 (SOR), which is 0.3504, or 35.04% market share.<br />
PEN is a measure of customer attraction because it reflects what proportion of category users are<br />
attracted to the brand at least once. SOR is a measure of customer retention because it reflects<br />
how much of the brand consumers buy once they have purchased it an initial time. SOR is used<br />
as a measure of brand health, even loyalty, by practitioners (Hume 1992; Bhattacharya et al.<br />
1996; Kristofferson and Lal 1996a, b). It reflects how well the brand retains its customers, and is<br />
particularly relevant in the context of P&G’s value pricing strategy because one of the stated<br />
goals of the strategy is to improve customer loyalty.<br />
1 To see this algebraically, let<br />
SB = Unit brand sales.<br />
SC = Unit category sales.<br />
MS = Market share of the brand.<br />
NC = Number of households that buy the category.<br />
NB = Number of households that buy the brand.<br />
CC = Average category unit sales per household that buys the category.<br />
CB = Average category unit sales per household that buys the brand.<br />
Then:<br />
SC = NC*CC MS = SB/SC PEN = NB/NC SOR = SB/(NB*CB) USE = CB/CC 10
(b) Effect of Advertising and Promotion: Our theoretical discussion suggests that both advertising<br />
and promotion should increase PEN by encouraging more consumers to switch into the brand,<br />
although previous empirical research suggests that the advertising effect is much weaker than the<br />
promotion effect. Advertising should have a positive effect on SOR because it should enhance<br />
repeat purchasing. Promotion could have a negative or a positive effect on SOR. Advertising<br />
should have a positive effect on USE to the extent that it suggests new product uses. Promotion<br />
could have a negative or positive effect, depending on whether it creates new usage occasions<br />
and increases the consumption rate, or brings in consumers who purchase smaller quantities to<br />
mitigate perceived risk.<br />
(c) Moderators of Advertising and Promotion Effects: Consumer response elasticities differ<br />
systematically from category to category and brand to brand. These cross-sectional differences<br />
are not of direct interest for our research, but it is necessary to control for them in order to obtain<br />
valid estimates on average. We allow market share position, stockpileability, purchase cycle,<br />
deal intensity, and advertising intensity to moderate self- and cross-elasticities in the consumer<br />
response model. While we do not have data on all possible moderators (e.g., advertising copy),<br />
the research cited in section 2.1 suggests that the factors we include explain a significant portion<br />
of cross-sectional variation in elasticities.<br />
(d) Competitor Response: Competitor response also differs from category to category and brand<br />
to brand. It is moderated by market share elasticities and the structural and firm-specific factors<br />
suggested in the literature. Since market share elasticities are estimated in the consumer response<br />
model, there is an important link between consumer response and competitor response. The<br />
11
structural factors are market concentration, market share position, and multi-market contact.<br />
Firm-specific factors over and above these are represented by dummy variables. 2<br />
3. Method<br />
3.1 Data<br />
We study changes in the market between 1990 and 1996. P&G introduced their value pricing<br />
program in 1991 and implemented it over multiple years (Shapiro 1992; Kristofferson and Lal<br />
1996a, b), and we look at the market before, during, and after implementation of the strategy.<br />
Our data are primarily from IRI's annual Market Fact Book. We select 24 product categories in<br />
which P&G participates, and compile data on price, promotion frequency and depth, as well as<br />
market share, PEN, SOR, and USE for several brands in each category. Whenever possible, we<br />
include P&G, three of its largest competitors, and at least one small competitor. The analysis is<br />
at the level of a manufacturer within a product category. That is, for a manufacturer with more<br />
than one brand within a product category, we combine the brands into one umbrella "brand". 3<br />
This results in data on 118 brands across the 24 product categories, although data for some<br />
brands are missing for one or more of the seven years. The advertising data are compiled from<br />
the Leading National Advertisers publication of annual media advertising. All the moderators in<br />
the consumer and competitor response models are derived from these data, with the exception of<br />
category stockpileability, which we obtain from Narasimhan, Neslin, and Sen (1996). Appendix<br />
1 defines all the variables, and Appendix 2 lists the 24 product categories.<br />
2 We do not include structural or firm-specific variables other than market share position as moderators in the<br />
consumer response model because they are not relevant to consumers. For example, consumers would not be<br />
expected to react differently to a given brand’s advertising because that brand competes with another brand in<br />
multiple markets.<br />
12
We note that our data reflect changes observed at the retail level, so we cannot separately<br />
measure the change in P&G’s strategy towards the trade and the consequent change in strategy<br />
of the trade. Also, these data represent activity only in US grocery stores and therefore do not<br />
speak to changes in other countries or in other channels such as mass merchandisers. However,<br />
the Market Fact Book covers a large number of packaged goods product categories and markets,<br />
and has been used to gain important insights by researchers like Fader and Lodish (1990), and<br />
Lal and Padmanabhan (1995). Our compilation is particularly valuable because we cover a<br />
period of seven years, include most of the product categories that P&G plays a role in, and<br />
augment the Market Fact Book data with media advertising data.<br />
These data allow us to undertake a broad-based pooled time series, cross sectional analysis. This<br />
is a well-established approach in the econometric literature (Hsiao 1986), that has produced<br />
several important papers in the marketing literature (e.g., Jacobson and Aaker 1985; Hagerty,<br />
Carman, and Russell 1988; Jacobson 1990; Boulding and Staelin 1990 and 1993; and Boulding,<br />
Lee, and Staelin 1994). The advantage of this approach is that it permits broad and<br />
generalizeable analyses that span several brands, categories, or industries. The challenge is to<br />
control for cross-sectional differences so they are not confounded with longitudinal effects. We<br />
model changes over time to control for cross-sectional main effects, and incorporate moderators<br />
of both consumer and competitor response to control for cross-sectional interaction effects.<br />
_____________________<br />
3 This is consistent with the emphasis of packaged goods manufacturers on category management and with the<br />
strategic emphasis of our research. It allows us to assess a firm's category performance as a function of its<br />
advertising and promotion policy in that category.<br />
13
3.2 Value Pricing: An Overview<br />
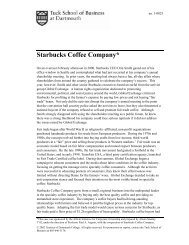
Table 1 depicts the average percent changes in price, advertising, and promotion made by P&G<br />
and its competitors between 1990 and 1996, across the 24 product categories. Figure 2 depicts<br />
percent changes each year indexed to their values in 1990, which serves as the base year.<br />
<br />
Did P&G’s publicized policy change actually affect retail activity? The answer to this is a clear<br />
yes. P&G increased advertising expenditures in the neighborhood of 20% over the seven years. It<br />
also reduced promotion activities: deal frequency declined 15.7% and coupon frequency declined<br />
54.3%. As a result of the cuts in P&G’s promotion, the net price paid by consumers increased by<br />
about 20%. Figure 2 also shows that these changes occurred gradually over several years<br />
although price and deals had stabilized by 1995-96.<br />
How did competitors respond? For advertising and coupons, they followed P&G directionally<br />
but not completely, and for deals, they did not follow P&G at all. Competitor advertising<br />
increased, but only by 6.2%; coupon frequency decreased, but only by 17.3%; and deal<br />
frequency actually increased by 12.6%. As a result, the net price paid by consumers for<br />
competitor brands increased, but only by 8.4%. Overall, then, competitors only partly went along<br />
with P&G’s policy change. Table 1 shows the significant differences in the reactions of different<br />
companies. Colgate and Gillette were more competitive than Unilever. 4 Both companies<br />
4 We refer to price decreases and advertising, deal, and coupon increases as "competitive" because these actions are<br />
intended to take share away from P&G. Analogously, we refer to price increases and advertising, deal, and coupon<br />
cuts as "cooperative." This terminology takes into account the inherent asymmetry noted by Ramaswamy,<br />
Gatignon, and Reibstein (1994), and Putsis and Dhar (1998), who point out, for instance, that following a price<br />
increase may be cooperative but following a price decrease is not.<br />
14
strongly increased advertising and promotion. Lever, on the other hand, cut coupons while<br />
instituting very small increases in advertising and deals. We examine later how much of this<br />
difference in reaction across competitors is due to economic and structural factors and how much<br />
is firm-specific effects.<br />
What was the net consequence of the strategy change and competitive reaction for P&G's market<br />
share? Our data show that, during this period, P&G lost about 18% of its share on average<br />
across these 24 categories (about 5 points per category). In line with changes in the marketing<br />
mix variables, this share loss occurred gradually over several years, and stabilized somewhat<br />
during 1995-1996.<br />
Although this overview provides a broad picture of P&G's initiative, our purpose is to gain an in-<br />
depth understanding of the market response to the policy change. In the next two sections, we<br />
estimate econometric models of consumer and competitor response that allow us to examine not<br />
just what happened but also why it happened. Specifically, we are able to (a) quantify the<br />
individual effects of advertising and promotion on penetration, share of requirements, and<br />
category usage; (b) account for differences across brands and categories; (c) determine the role<br />
of elasticities, structural, and firm-specific factors in competitive response; and (d) attribute the<br />
total impact on P&G’s market share to changes in each of its own marketing mix variables and to<br />
competitors’ reactions.<br />
4. The Consumer Response Model<br />
4.1 Model Specification<br />
15
We model market share as a multiplicative function of marketing mix variables, similar to<br />
Wittink et al. (1987) and Leeflang and Wittink (1996). Specifically:<br />
where:<br />
Share ict = Market share of brand i in category c in year t relative to 1990;<br />
Price ict = Net price paid per unit volume for brand i in category c in year t relative to 1990;<br />
Advt ict = Advertising (in tens of millions of dollars) for brand i in category c in year t<br />
relative to 1990;<br />
Deal ict = Percent of total sales of brand i in category c sold on deal in year t relative to<br />
1990;<br />
Coup ict = Percent of total sales of brand i in category c sold with manufacturer's coupons in<br />
year t relative to 1990;<br />
= Average (volume-weighted) "Price" of brand i's competitors in category c in year<br />
t relative to 1990;<br />
= Average (volume-weighted) "Advt" of brand i's competitors in category c in year t<br />
relative to 1990;<br />
= Average (volume-weighted) "Deal" of brand i's competitors in category c in year t<br />
relative to 1990;<br />
= Average (volume-weighted) "Coup" of brand i's competitors in category c in year<br />
t relative to 1990;<br />
Note that the dependent and independent variables in the model are ratios with respect to the<br />
base year, 1990. 5 This indexing is similar in spirit to Wittink et al. (1987) and controls for brand-<br />
5 When data are missing for 1990, we use 1991 as the base year.<br />
16<br />
(1)
specific main effects. As discussed in Section 2, market share position and four category<br />
characteristics moderate consumer response elasticities, so different brands in different<br />
categories have their own elasticities, even though data for all categories and brands are pooled<br />
to estimate the model. This results in a “process function” for elasticities (Gatignon 1993):<br />
where:<br />
β kic = Elasticity for variable k in equation (1) for brand i of category c;<br />
Small ic = 1 if brand i in category c accounts for less than 5% of the sales of the top 3<br />
brands in the category in 1990, 0 otherwise; 6<br />
Mid ic = 1 if brand i in category c accounts for 5% to 40% of the sales of the top 3<br />
brands in the category in 1990, 0 otherwise;<br />
AvgDeal c = Average percent sold on deal in category c;<br />
AvgAdvtg c = Average advertising expenditure in category c;<br />
AvgCycle c = Average length of purchase cycle for category c;<br />
Stock c = Stockpileability of category c.<br />
We take logarithms of both sides and estimate the following log-linear model using OLS: 7<br />
6 We use a three-part classification of market share position (small, middle, and high) to allow for nonlinear or nonmonotonic<br />
relationships between market share and consumer response. We include dummy variables for small and<br />
middle; high is the omitted category. In our sample, the lowest quartile of market share relative to the top three<br />
brands is about 7%, and the highest quartile is about 38%. We use slightly more extreme cutoffs of 5% and 40% to<br />
separate the really small/fringe and really big/powerful brands from the majority in the middle.<br />
7 We correct for serial correction that may be caused by indexing to a base year and find that the estimated<br />
elasticities are not substantively different from those obtained using OLS. We thank Vithala Rao for bringing the<br />
serial correlation issue to our attention. We also estimate the consumer response model using lagged values of the<br />
independent variables as instruments in order to control for possible simultaneity, and again find few substantive<br />
differences in estimated elasticities. Therefore, we report the OLS results here for simplicity.<br />
17<br />
(2)
We estimate this consumer response model using market share as well as the three components<br />
of market share, PEN, SOR, and USE, as dependent variables. Given the definitional identity<br />
relating market share to PEN, SOR, and USE, each coefficient estimate in the market share<br />
model equals the sum of the corresponding coefficient estimates from the models for the three<br />
components (see Farris, Parry, and Ailawadi 1992). As a result, the market share elasticity with<br />
respect to advertising equals the penetration elasticity with respect to advertising plus the SOR<br />
elasticity plus the USE elasticity.<br />
4.2 Results<br />
Table 2 summarizes the fit of the consumer response model for market share and its three<br />
components. Adjusted R 2 s are quite strong, showing that changes in the marketing mix are<br />
significantly related to changes in market share and its components. Further, the F-tests show<br />
that both brand and category characteristics have a significant influence on consumer response. 8<br />
<br />
Table 3 presents estimated elasticities for the average brand which suggest that:<br />
8 Although the multiplicative model does not force market share predictions to lie between 0 and 100%, there are no<br />
instances in our sample of either negative predicted market share or of market shares within a category summing to<br />
more than 100%.<br />
18<br />
(3)
• Price paid is negatively associated with market share, primarily through SOR and USE. That<br />
is, lower prices enhance SOR and USE. Since our price variable is net price paid, this effect<br />
includes the impact of promotional price cuts.<br />
• Deals and coupons have similar share elasticities, exerted mostly through PEN. Both<br />
elasticities are fairly strong even though they represent just the “signaling” aspect of<br />
promotions (the impact of price cuts themselves is included in the price variable). 9<br />
• The overall effect of promotion includes the signaling effect captured by the deal and coupon<br />
variables, plus the price effect captured by the price variable. Looking at how these effects<br />
combine, we conclude that promotion clearly increases PEN, since the signs of the deal and<br />
coupon variables are positive, and the sign of the price variable is negative (meaning that<br />
price cuts increase penetration). For SOR and USE, the signs of the deal and coupon<br />
variables are negative, but the signs of the price variable are also negative (meaning the price<br />
cuts associated with deals would increase SOR and USE). Even though the price coefficients<br />
are much larger than the deal coefficients, these balance out to mean that promotion has little<br />
effect on SOR and USE. This is because a fairly large percentage increase in deal frequency<br />
decreases net price paid by only a small percentage. 10<br />
• Advertising has a relatively weak relationship with market share. Its biggest<br />
9 We also estimate the model using regular price, calculated as shown in Appendix 1. As might be expected, price<br />
elasticities are weaker and deal and coupon elasticities are stronger in that model. We report the results based on net<br />
price to be consistent with most other scanner data based studies (e.g., Fader and Lodish 1990; Bucklin and Lattin<br />
1991; Chintagunta 1992 and 1993; Mela, Gupta, and Lehmann 1997), and because overall model fit is better with<br />
net price.<br />
10 For example, consider a brand with a regular price of $2 and a promotion price of $1.40. Currently 70% of<br />
purchases are at regular price, and 30% are at the deal price. This yields a current net price paid of $1.82. Consider<br />
an increase in deal frequency, so that now 40% of purchases will be at the deal price. This is a 33.3% increase in the<br />
deal variable. The average price paid will then be $1.76, a 3.3% decrease in the price variable. Assuming the<br />
average elasticities as in Table 3, the new SOR compared with the current SOR will be (0.967) -0.266 x(1.333) -0.053 =<br />
0.9937, a marginal 0.63% decrease in SOR.<br />
19
association is with PEN, but it has very little association with SOR. 11<br />
• Competitive price cuts lead to lower share, mostly through a negative impact on SOR.<br />
• Competitive advertising is associated with lower market share through PEN and SOR. In<br />
other words, competitive advertising makes it more difficult to attract and retain customers.<br />
• Competitive deals and coupons are also associated with lower market share, largely through<br />
PEN and SOR.<br />
Of course, elasticities vary for different brands in different product categories, as would be<br />
expected from the significant impact of brand and category characteristics shown in Table 2. For<br />
instance, the market share model estimates in Table 4 show that heavily advertised categories are<br />
less price-elastic, consistent with the role of advertising in product differentiation (e.g., Ghosh,<br />
Neslin, and Shoemaker 1983; Kaul and Wittink 1995). They are also less advertising- elastic,<br />
consistent with a saturation effect (e.g., Bolton 1989). Similarly, heavily promoted categories are<br />
less deal- and coupon-elastic, also consistent with a saturation effect. And, categories with long<br />
purchase cycles are less deal-elastic, consistent with the findings of Narasimhan, Neslin, and Sen<br />
(1996), but more advertising-elastic. In terms of brand differences, small brands have the<br />
strongest advertising elasticities, consistent with earlier work by Deighton et al. (1994), Lodish et<br />
al. (1995a), and Batra et al. (1995). They are also the most vulnerable to competitive price cuts<br />
and advertising, consistent with the literature on asymmetric effects (e.g., Blattberg and<br />
Wisniewski 1989). Interestingly, large brands have the strongest promotion (both deal and<br />
11 We estimate a model with current as well as lagged effects of all advertising variables (main and interaction<br />
effects) to test for carry-over effects of advertising and cannot reject the null hypothesis that all lagged coefficients<br />
are zero. These results are consistent with Lodish et al. (1995a), who find that, if advertising does not have an effect<br />
in the first year, it does not have any effect in subsequent years either.<br />
20
coupon) elasticities. Table 5 provides mean elasticities for small, mid-sized, and large brands in<br />
our sample.<br />
<br />
4.3 Validation With Disaggregate Data<br />
Although these findings are consistent with the theoretical and empirical literature, they are<br />
based on aggregate data. In order to ensure that our results are not an artifact of category or<br />
temporal aggregation, we validate our market share model with more disaggregate data.<br />
Specifically, we compile quarterly market share, price, and promotion data over the 1990-1996<br />
period for 26 brands in six product categories from a dataset on the Chicago stores of the<br />
Dominicks grocery chain. The product categories are automatic dishwasher detergent,<br />
dishwashing liquid, laundry detergent (powder and liquid combined), toilet tissue, toothpaste,<br />
and toothbrushes. We obtain quarterly advertising data from Leading National Advertisers.<br />
Although the advertising data are national, there is no reason to believe that changes in the<br />
Chicago market would be systematically different from nationwide changes.<br />
To allay concerns about aggregation over time, brands, and categories, we estimate our<br />
multiplicative market share model separately for each brand in each category instead of pooling<br />
data across brands and categories and using moderators. Thus, we obtain 26 sets of elasticity<br />
estimates. As Table 6 shows, the pattern of elasticities from this disaggregate analysis is<br />
consistent with those obtained from the aggregate analysis. Overall, price elasticities are the<br />
strongest, followed by promotion elasticities, while advertising elasticities are quite weak. A<br />
comparison of Table 6 with Table 5 shows that differences in elasticities among small, mid-<br />
21
sized, and large brands are also similar to the aggregate results. Small brands have the strongest<br />
advertising elasticities and are the most vulnerable to competitive price cuts and advertising. 12 In<br />
summary, this disaggregate analysis corroborates the findings from our aggregate data,<br />
suggesting that the latter are not an artifact of aggregation.<br />
<br />
5. Competitive Reactions<br />
5.1 Model Specification<br />
The competitive response model consists of four equations, one for each of the four marketing<br />
mix variables. The dependent variable in each equation is the change in the marketing mix<br />
variable of a given P&G competitor from the base year to the current period. 13 As discussed in<br />
Section 2, competitor response should depend upon how strongly P&G's strategy change affects<br />
the market share of the competitor. Therefore, we model competitive marketing mix reaction,<br />
Mmixchg, as a function of Shreff, the predicted effect that P&G’s strategy change would have on<br />
the competitor’s market share if the competitor does not change its strategy: 14<br />
We model predicted share change based on the four marketing mix variables:<br />
12 We also estimate the basic MCI attraction model (Cooper and Nakanishi 1988) for each category and find that the<br />
estimated elasticities are generally consistent with those from the multiplicative model.<br />
13 We index competitive reaction to the base year (1990) for the same reason as in the consumer response model.<br />
Further we consider magnitude changes in a linear model rather than percent changes in a log-linear model because<br />
the fit of the former is significantly better for the advertising and coupon equations.<br />
14 Shreff combines the impact of all four of P&G's marketing mix variables. We do not model reaction to each of<br />
P&G's marketing mix variables separately because there is strong multicollinearity among them. One option is to<br />
follow other researchers and model reactions only in kind (e.g., model competitive price changes as function of<br />
P&G's price alone, not its other marketing mix variables). We believe combining the impact of all of P&G's mix<br />
variables into a single Shreff variable is a better alternative because reactions may not occur only in kind (e.g.,<br />
Leeflang and Wittink 1992, 1996).<br />
22<br />
(4)
where:<br />
Mmixchg kict = Change in marketing mix variable k for brand i in category c in year t<br />
relative to 1990;<br />
Shreff ict = Predicted number of share points by which the market share of brand i in<br />
category c would change in year t relative to 1990 as a result of P&G’s<br />
strategy change if there is no reaction;<br />
Share ic90 = Market share of brand i in category c in the base year 1990;<br />
Cross kic = Cross-elasticity of brand i in category c with respect to variable k estimated<br />
in the market share response model;<br />
= Percent change in the average (volume-weighted) "Price" of brand i's<br />
competitors in category c from 1990 to year t, assuming P&G’s actual<br />
change in price from year 1990 to year t and no change for other<br />
competitors. Analogous definitions are used for the other marketing mix<br />
variables.<br />
α k represents the change in competition's marketing mix variable k even if Shreff is zero,<br />
reflecting general trends in the market and/or an overall cooperative or competitive stance by<br />
competitors. β k indicates how competitors change variable k in response to Shreff. A positive<br />
sign for k = Price means that competitors increase their prices as P&G’s move increases their<br />
share. A negative sign means that competitors decrease their prices as P&G’s move increases<br />
their share.<br />
_____________________<br />
23<br />
(5)
Since competitor response is moderated by market share elasticities, structural factors, and firm-<br />
specific effects, we allow for both intercept and slope shifts by these factors. 15 In order to<br />
control for other category characteristics that may moderate competitive response, we also group<br />
the categories into five broad classes, health remedies, cleaners, personal care products, paper<br />
products, and food products, and include intercept and slope dummies for them: 16<br />
where:<br />
Self kic<br />
Conc c<br />
Nummkt ic<br />
Col ic<br />
Lev ic<br />
Gil ic<br />
Health c<br />
Cleaner c<br />
Personal c<br />
Paper c<br />
= Self-elasticity of firm i in category c with respect to marketing mix variable k,<br />
estimated from the market share response model;<br />
= Concentration of category c, equal to market share of top three firms;<br />
= Number of product categories in which firm i competes with P&G;<br />
= 1 if firm i in category c is Colgate Palmolive, 0 otherwise;<br />
= 1 if firm i in category c is Unilever, 0 otherwise;<br />
= 1 if firm i in category c is Gillette, 0 otherwise;<br />
= 1 if category c is a health remedy, 0 otherwise;<br />
= 1 if category c is a cleaning product, 0 otherwise;<br />
= 1 if category c is a personal care product, 0 otherwise;<br />
= 1 if category c is a paper product, 0 otherwise.<br />
15 To ensure that we have enough observations to reliably estimate a company effect, we include dummy variables<br />
only for companies that participate in at least 5 of the product categories in our study.<br />
24<br />
(6)
5.2 Results<br />
The system of four competitive reaction equations is estimated using observations on P&G's<br />
competitors in all the product categories. We use seemingly unrelated regression since the error<br />
terms across the four equations may be correlated (Johnston and DiNardo 1997). The system-<br />
weighted R 2 for the four equations is 0.23. 17 Table 7 summarizes the results of tests to<br />
determine whether market share elasticities, structural, firm-specific, and category class-specific<br />
factors have significant explanatory power. Each of these groups of factors is significant in all<br />
four competitive reaction equations, with the exception of the firm-specific effect in the<br />
advertising reaction equation. Thus while a significant portion of competitor response is due to<br />
self- and cross-elasticities and structural factors, a significant portion is also firm-specific.<br />
<br />
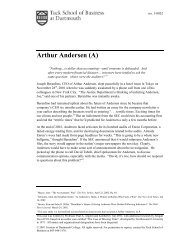
Figure 3 shows the response of the average competitor as a function of Shreff. The length of the<br />
line represents the range of Shreff in the sample. The fact that the price, advertising, and coupon<br />
intercepts are close to zero shows that competitors did not change these variables much during<br />
the period of study if they were unaffected by P&G's policy change. The deal intercept, however,<br />
is strongly positive, showing that competitors generally increased deals during this period even if<br />
they were unaffected by P&G.<br />
<br />
_____________________<br />
16 We thank an anonymous reviewer for suggesting that we add these dummy variables.<br />
17 We also estimate the competitive reaction model using one-year lags. There is no improvement in overall model<br />
fit and none of the coefficient estimates change significantly.<br />
25
The non-zero slopes show that competitors generally respond depending on how strongly they<br />
are affected by P&G. Interestingly, competitors are competitive on deals, increasingly so when<br />
they benefit from P&G's policy change. This is also reflected in price response: competitors'<br />
prices decrease as they benefit from P&G's policy change. Companies appear to use price and<br />
deals to take advantage of an opportunity for increasing market share. Response on advertising<br />
and coupons is quite different. Competitors cut advertising and coupons if they benefit from<br />
P&G's policy change, perhaps using the opportunity to save money.<br />
<br />
Table 8 shows several interesting differences in competitive response due to structural and firm-<br />
specific factors. For instance, competitors who have multi-market contact with P&G tend to<br />
follow P&G’s lead on price and advertising more than others when they benefit from P&G’s<br />
move. Small competitors react in the opposite way, however. They reduce price and advertising<br />
more than others if they are affected positively. 18 In addition, small brands are more likely than<br />
others to increase deals when they benefit from P&G’s move. These findings suggest that small<br />
brands are less likely to follow P&G’s move, whereas firms with multi-market contacts are more<br />
likely to follow. Over and above the differences in response that can be accounted for by market<br />
share elasticities and structural factors, response differs by company, lending support to the<br />
resource-based view of the firm. For instance, Gillette’s reactions are less related to how much it<br />
is affected by P&G’s policy change than Lever and Colgate’s reactions, particularly on price and<br />
advertising.<br />
18 This is partly attributable to the fact that a given share point change translates to a much larger percentage of a<br />
small brand's market share than a large brand's market share.<br />
26
In summary, theory tells us that market share elasticities, structural factors, and firm-specific<br />
effects matter, and they do. Theory does not predict the direction of influence of these factors,<br />
and we find that there are several interesting differences in their influence across marketing mix<br />
variables. These differences may be partly due to the fact that the initiating firm’s move is<br />
cooperative on some variables (deals and coupons), and competitive on others (advertising).<br />
There may be other issues at play, however, such as the costs and profitability of various<br />
marketing mix variables. Our research points to the need for further theory development to better<br />
understand how elasticities, structural factors, and firm-specific factors influence competitive<br />
response.<br />
6. Net Impact of a Sustained Change in Advertising and Promotion Policy<br />
6.1 Impact on Market Share<br />
In order to understand the impact of the value pricing strategy on P&G's market share more fully,<br />
we use P&G's elasticities, obtained from the consumer response model, together with the<br />
changes made by P&G and the competition in each of the four marketing mix variables, to<br />
formally trace the overall impact on the three components of P&G's market share -- PEN, SOR,<br />
and USE. Table 9 suggests the following:<br />
<br />
• On average, P&G suffered a predicted 16% loss in market share across the 24 categories in<br />
our study. 19 The decrease in share is due mainly to a predicted 17% decrease in penetration.<br />
SOR and USE are virtually unchanged. The hoped-for increase in SOR to offset the loss in<br />
penetration did not materialize.<br />
19 The actual loss was 18%, so the model represents share changes pretty well.<br />
27
• The loss in penetration is attributable to P&G's severe cuts in coupons and deals, and the<br />
consequent increase in net price.<br />
• The increase in net price hurt SOR and USE. The deal and coupon cuts did not increase SOR<br />
as might have been expected if cutting promotions strengthened customer loyalty.<br />
• The increase in deals by competitors exacerbated P&G's loss in penetration and also had a<br />
negative impact on SOR. This negative impact of competitor deal increases is just as strong<br />
as the negative impact of P&G's own deal cuts.<br />
• The competition’s cuts in couponing and increases in net price helped P&G’s SOR, and<br />
offset the decrements in SOR resulting from P&G’s increase in net price. But, the<br />
competition’s coupon cuts did not help enough, and P&G still lost penetration.<br />
• Neither P&G's own advertising spending increases nor the competition's smaller increases<br />
had much effect, since both self- and cross-advertising elasticities are quite weak.<br />
6.2 Profit Implications<br />
We use our findings, along with some assumptions, to examine the potential profit impact of<br />
Value Pricing. Our goal is not to evaluate P&G’s strategy, but to explore consequences other<br />
than market share that follow from a prolonged increase in advertising and decrease in<br />
promotion. We use a simple margin calculation as in Hoch, Dreze, and Purk (1994):<br />
Profit = Total Revenue - Total Variable Costs - Fixed Costs (7)<br />
= [(Manufacturer Price)(Unit Sales)] - [(Variable Cost per unit)(Unit Sales)] - [Fixed Costs]<br />
28
First, the percentage changes in price and market share in Tables 1 and 9 show that total revenue<br />
should remain almost unchanged: 20<br />
Total Revenue 96 = [(0.818)(Sales 90)] [(1.204)(Price 90)] = (0.9849)(Total Revenue 90) (8)<br />
Second, under the conservative scenario that variable costs per unit do not change, the 18.2%<br />
reduction in total units sold leads to a corresponding reduction in total variable costs: 21<br />
Total Variable Costs 96 = (0.818)(Variable Cost per Unit)(Sales 90) (9)<br />
Thus the gross margins in 1990 and 1996 respectively would be:<br />
Gross Margin 90 = (Sales 90)(Price 90) - (Variable Cost per Unit)(Sales 90) (10)<br />
Gross Margin 96 = (0.9849)(Sales 90)(Price 90) - (0.818)(Variable Cost per Unit)(Sales 90) (11)<br />
Equation (11) shows that gross margin in 1996 would be higher than in 1990, especially if<br />
variable costs are large.<br />
One question is whether this increase in gross margin would be enough to cover the increased<br />
fixed costs of advertising. We obtained information about P&G's financials from<br />
COMPUSTAT's annual data file. P&G's worldwide sales and advertising were about $24 billion<br />
and $2 billion respectively in 1990, with the US accounting for 62% of sales, i.e., $15 billion.<br />
Further, P&G's cost of goods sold as a percent of revenue was approximately 57% in 1990. Thus,<br />
20 This assumes that total category sales in the market does not change (a reasonable assumption for mature<br />
categories) and the percentage change in retail selling price is equal to the percentage change in P&G's manufacturer<br />
selling price.<br />
21 It is likely, of course, that variable costs per unit did decrease due to operating efficiencies.<br />
29
we can estimate variable cost per unit as 0.57 times the 1990 price, and gross margins in 1990<br />
and 1996 can be written as:<br />
Gross Margin 90 = (Sales 90)(Price 90) – (0.57)( Sales 90)(Price 90) = (0.43)(Sales 90)(Price 90) (12)<br />
Gross Margin 96 = (0.9849)(Sales 90)(Price 90) - (0.818)(0.57)(Sales 90)(Price 90)<br />
= (0.519)(Sales 90)(Price 90) = (1.21)(Gross Margin 90) (13)<br />
Thus, P&G's US gross margin can be expected to have increased by about $1.35 billion as a<br />
result of value pricing (0.21 times 0.43 times $15 B). Assuming that the ratio of US to worldwide<br />
advertising is the same as the ratio of sales, US advertising in 1990 would be about $1.24 billion<br />
(0.62 times $2 B), and the increase in fixed costs due to a 21% increase in advertising would be<br />
$0.26 billion (0.21 times $1.24 B). Thus, the increase in gross margin would be more than<br />
enough to cover the increase in fixed advertising costs. According to our calculations, net profit<br />
would increase by $1.09 billion ($1.35 B minus $0.26 B). 22 In short, it is quite plausible that<br />
P&G gave up share points in return for profits.<br />
7. Conclusion<br />
We have used Procter & Gamble’s value pricing strategy to study the impact of a major and<br />
sustained change in advertising and promotion policy. We focus on the role of advertising and<br />
promotion in attracting and retaining customers, on the factors that influence competitive<br />
response, and on how these effects combine to determine overall market share impact. Based on<br />
previous theory and empirical work, we develop a framework for assessing this impact that<br />
22 We do not compare these figures with P&G's reported earnings because our data cover only U.S. grocery channel<br />
sales for these 24 categories and also because we do not have information on cost cutting and other activities that<br />
P&G undertook during this period.<br />
30
integrates both consumer and competitive response. We test this framework using data on 118<br />
brands in 24 categories in which P&G competed over a seven-year period.<br />
7.1 Summary of Findings<br />
Our first research question relates to how advertising and promotion work in attracting and<br />
retaining customers. We find the following:<br />
• Deals and coupons increase penetration and have a zero or somewhat positive impact on<br />
customer retention as measured by SOR and USE.<br />
• Advertising appears to work primarily by increasing penetration but the effect is weaker than<br />
that of promotion. We find little evidence that advertising increases SOR or USE among the<br />
average brand’s existing users.<br />
• Promotion has a stronger direct impact on share than advertising for the average packaged<br />
goods brand. This is a common finding in both micro and macro short-term studies (e.g.,<br />
Tellis 1988; Boulding, Lee, and Staelin 1994), that has not been demonstrated previously in<br />
the case of a major and sustained policy change.<br />
Our second research question concerns the relative roles of market share response, structural<br />
factors, and firm-specific effects in determining competitor response. We find:<br />
• Competitors' reactions to a sustained change in advertising and promotion policy by a market<br />
leader vary with the degree to which their market share is affected. Reactions also vary by<br />
structural factors such as the market share position of the competitor and the number of<br />
markets in which it competes with the initiator of the policy change.<br />
• Even after accounting for market share response elasticities and structural factors, there are<br />
still firm-specific effects in competitor reactions.<br />
31
• Competitors do not react the same way on all marketing instruments. In this case,<br />
competitors tended to decrease advertising and coupons but used deals to gain market share<br />
even when they were benefiting from P&G's policy change.<br />
Our third question is how consumer and competitor response combine to determine overall<br />
market share impact. We find that the net impact is a decrease in market share for the initiating<br />
company, although it is plausible that its profits increased. The loss in penetration resulting from<br />
promotion cuts is not offset by increases in SOR or by competitive reactions. The effect of<br />
promotion on share is greater than that of advertising for established brands, though the reverse<br />
is true for small brands. The implication is that cuts in promotion, even if coupled with increases<br />
in advertising, will not grow market share for the average established brand in mature consumer<br />
goods categories.<br />
7.2 Limitations and Further Research<br />
While these findings are both important and stimulating, our study does have some limitations.<br />
First, we focus on a policy change that involves significant changes in advertising and<br />
promotion. We do not have data on any changes P&G may have made in variables such as<br />
product assortment or new product development, so we cannot speak to their impact. Similarly,<br />
data limitations preclude the use of moderators such as sales force, distribution, and ad copy in<br />
our consumer response model (see Gatignon 1993). While our purpose is not to study these<br />
moderators per se, including them might have generated additional insights. Nor do we have<br />
measures of firm-specific factors such as culture and management skill, although the statistical<br />
32
significance of the dummy variable surrogates we use for these factors should encourage future<br />
research in this area.<br />
Second, we cannot make conclusive statements about the impact of the strategy change on<br />
profitability in the absence of data on P&G's manufacturer price and cost data. This would be an<br />
important area for future research if relevant data become available. Still, sales are a key<br />
objective for most companies including P&G (see Kristofferson and Lal 1996 a, b; Brooker<br />
1999; Fairclough 1999), so we believe our analysis of market share is important.<br />
Third, as noted earlier, our analysis pertains to sales made through the US grocery channel, and<br />
alternative channels such as mass and discount merchandisers have become more important in<br />
recent years. We note, however, that the shift to alternative channels is occurring for other large<br />
competitors as well.<br />
Fourth, we assume that P&G’s adoption and consistent application of Value Pricing is<br />
exogenous, i.e., P&G did not react to competition. With only seven time series data points, we<br />
cannot investigate this issue. Trends in P&G’s marketing mix over the seven-year period,<br />
however, do not reveal any major pattern shifts or reversals. If a reversal in strategy does occur<br />
in the future, it would provide another valuable opportunity to examine market response.<br />
Finally, our analysis is based on aggregate data. There is a trade-off between the micro approach<br />
to examining individual brands, categories, or markets, and the broad-based, strategic view<br />
provided by our analysis and others like it. We believe both approaches contribute to<br />
33
understanding market response and should be viewed as complementing one another.<br />
Importantly, many of our results are consistent with micro studies, and the product categories in<br />
which we are able to replicate our analysis with disaggregate quarterly data also corroborate our<br />
findings. Still, it would be valuable to examine differences between our conclusions and those<br />
based on more disaggregate data, should those data be available. Such data would also enable<br />
researchers to study brand and category differences in market response in more detail and to<br />
study interactions between marketing mix variables, e.g., the effect of a brand's advertising and<br />
promotion on its price elasticity (e.g., Gatignon 1993; Jedidi, Mela, and Gupta 1999).<br />
7.3 Implications for Researchers and Managers<br />
While acknowledging these limitations, we believe our results are provocative and raise several<br />
important questions and implications for researchers and managers:<br />
• What is the correspondence between share of requirements and brand loyalty? A sustained<br />
decrease in promotion and increase in advertising should have enhanced P&G's SOR through<br />
increased brand loyalty. However, advertising did not improve SOR. Further, the net impact<br />
of cutting deals and coupons, and the concomitant increase in net price paid, was to decrease<br />
SOR. We believe this is due to the “retention” role of price promotions – in a competitive<br />
environment, an existing user is more likely to re-purchase the brand when it is on promotion<br />
than when it is not. But, even if promotions do not hurt SOR, underlying attitudinal loyalty<br />
could be diminishing. It is important for researchers to investigate this further (e.g., Kopalle,<br />
Mela, and Marsh 1999), since SOR is a commonly used indicator of brand loyalty (e.g.,<br />
Bhattacharya et al. 1996; Bhattacharya 1997).<br />
34
• What does advertising do? We find that the direct effect of advertising on the components of<br />
market share is weak for all but small brands. This lack of effectiveness could be attributable<br />
to execution (e.g., Lodish et al. 1995a) or to the way advertising works for established brands<br />
in mature markets. It is important to have a base level of advertising, but even substantial<br />
increases over that base level may not generate dramatic gains in market share for established<br />
brands. Our results are consistent with Tellis (1988), Deighton, Henderson, and Neslin<br />
(1994), and Batra et al. (1995) even though we were working with a substantial increase in<br />
advertising. In any event, more research is needed on how and in what circumstances<br />
advertising works.<br />
• Market share elasticities, structural, and firm-specific factors play a role in competitor<br />
response. Managers who try to anticipate competitor response must not only know how their<br />
policy change will affect competitors' market share, but also consider structural issues such<br />
as the market share position of their competitors and in how many markets they compete.<br />
Further, competitor-specific resources, capabilities, and culture also determine the response.<br />
Our findings strongly suggest the need for theory that can predict not only the factors that<br />
determine competitive response but also the direction of their influence.<br />
• Competitors' response to policy changes is not uniform across marketing instruments. The<br />
reasons for this need to be sorted out. An obvious potential explanation would be differences<br />
in profitability across marketing instruments, but there may also be some organizational<br />
factors at work. For example, it may be easier for managers to reallocate their total marketing<br />
budgets than to change them drastically.<br />
• Researchers should make use of major policy changes. Dekimpe and Hanssens (1995) note<br />
that most markets are stationary which precludes the finding of persistent effects of<br />
35
marketing mix variables. The substantial changes in marketing mix variables as well as<br />
market share that accompany a major policy change provide a valuable opportunity to test for<br />
persistence. Jedidi, Mela, and Gupta (1999) do not find significant long-term effects of<br />
advertising on price or promotion sensitivity. Perhaps such effects can be detected with more<br />
substantial variation in advertising. The P&G Value Pricing policy is one example of a policy<br />
change, as are the Post Cereal price rollback of 1998, and Marlboro’s earlier price cutback.<br />
We conclude with a call for making use of these strategic policy changes to better understand<br />
the impact of marketing strategy.<br />
36
Marketing Mix<br />
Variable<br />
TABLE 1<br />
VALUE PRIC<strong>IN</strong>G: AN OVERVIEW<br />
% Change in Average from 1990 to 1996 for<br />
P&G All<br />
Competition<br />
Colgate Unilever Gillette<br />
Advertising +20.7% +6.2% +67.3% +9.0% +68.8%<br />
Deals -15.7% +12.6% +39.7% +2.2% +11.5%<br />
Coupons -54.3% -17.3% +24.0% -32.0% +127.8%<br />
Net Price +20.4% +8.4% +2.5% +11.5% -7.7%<br />
TABLE 2<br />
CONSUMER <strong>RESPONSE</strong> MODEL: SUMMARY<br />
(569 observations)<br />
Statistic No. of<br />
Coefficients<br />
Adjusted R 2 for Full<br />
Model<br />
F-Stat for Full Model<br />
F-Stat for Category<br />
Characteristics<br />
F-Stat for Brand<br />
Market Share Position<br />
Dependent Variable<br />
PEN USE SOR Share<br />
56 0.447 0.354 0.430 0.435<br />
56 9.19 * 6.55 * 8.64 * 8.82 *<br />
32 4.31 * 2.97 * 6.73 * 3.48 *<br />
16 9.51 * 5.59 * 6.05 * 10.81 *<br />
* p < 0.01
TABLE 3<br />
AVERAGE <strong>MARKET</strong> SHARE ELASTICITIES OF SAMPLE*<br />
Independent Variable<br />
2<br />
Average Elasticities for<br />
PEN USE SOR Share<br />
Price -0.065 -0.210 -0.266 -0.541<br />
Advertising 0.044 0.005 -0.010 0.039<br />
Deals 0.162 -0.017 -0.053 0.092<br />
Coupons 0.133 -0.001 -0.007 0.125<br />
Competitor Price -0.027 0.128 0.665 0.766<br />
Competitor Advertising -0.065 -0.003 -0.059 -0.127<br />
Competitor Deals -0.106 0.063 -0.081 -0.124<br />
Competitor Coupons -0.116 0.035 -0.124 -0.205<br />
* Averaged across 118 brands in 24 categories.
FIGURE 2<br />
OVERVIEW OF VALUE PRIC<strong>IN</strong>G<br />
7
FIGURE 3<br />
AVERAGE COMPETITIVE REACTIONS<br />
8
APPENDIX 1<br />
VARIABLES AND <strong>THE</strong>IR DEF<strong>IN</strong>ITIONS<br />
I. Variables Obtained Directly From IRI Market Fact Book:<br />
• Market Share: % Share of Category Volume.<br />
• Household Penetration: % of all households that made at least one purchase of the brand.<br />
• Share of Category Requirements (SOR): Among households that bought the brand, the<br />
percentage of their total category purchases represented by the brand.<br />
• Net Price Per Unit Volume: The average price paid per unit volume, reflecting all<br />
promotional activity.<br />
• % Volume on Deal: % of brand sales that were accompanied by some kind of deal, e.g.,<br />
display, feature, temporary price reduction (TPR).<br />
• % Volume with Manufacturer Coupon: % of brand sales that were made with a<br />
manufacturer coupon.<br />
• Average % Price Cut: The average savings due to TPR or coupon redemption.<br />
II. New Variables Computed From IRI Market Fact Book Data:<br />
• Shelf Price:<br />
• Penetration Index (PEN): Brand Penetration/Category Penetration.<br />
• Category Usage (USE): Average Category Purchase per Brand Buyer/Average Category<br />
Purchase per Category Buyer.<br />
• Market Concentration: Share of Top Three Brands in the Market.<br />
• Number of Market Contacts: Number of product categories (out of 24) in which a firm<br />
competes with P&G.<br />
III. Media Advertising Spending from Leading National Advertisers: In tens of millions of<br />
dollars. Minimum of advertising spending from remaining years used if company not found in<br />
LNA in a given year.<br />
IV. Category Stockpileability: Factor scores for each category provided by Narasimhan,<br />
Neslin, and Sen (1996).<br />
9
• HEALTH REMEDIES<br />
1. COLD/ALLERGY/S<strong>IN</strong>US LIQUID<br />
2. COLD/ALLERGY/S<strong>IN</strong>US TABLETS<br />
3. COUGH SYRUP<br />
• CLEANERS<br />
4. DISHWASHER DETERGENT<br />
5. DISHWASH<strong>IN</strong>G LIQUID<br />
6. DRY BLEACH<br />
7. LIQUID LAUNDRY DETERGENT<br />
8. PWD LAUNDRY DETERGENT<br />
• PERSONAL CARE<br />
9. HAIR CONDITIONER<br />
10. HAIR SPRAY<br />
11. SHAMPOO<br />
12. BARSOAP<br />
13. LIQUID SOAP<br />
14. MOUTHWASH<br />
15. <strong>TO</strong>OTHPASTE<br />
16. <strong>TO</strong>OTHBRUSHES<br />
• PAPER<br />
17. PAPER <strong>TO</strong>WELS<br />
18. DIAPERS<br />
19. FACIAL TISSUE<br />
20. <strong>TO</strong>ILET TISSUE<br />
• FOOD<br />
21. POTA<strong>TO</strong> CHIPS<br />
22. FROST<strong>IN</strong>G<br />
23. BROWNIE MIX<br />
24. SHORTEN<strong>IN</strong>G<br />
APPENDIX 2<br />
LIST OF PRODUCT CATEGORIES<br />
10
REFERENCES<br />
Abeele, Piet Vanden (1994), "Commentary on Diagnosing Competition: Developments and<br />
Findings," in Research Traditions in Marketing, edited by Gilles Laurent, Gary Lilien, and<br />
Bernard Pras, Kluwer Academic Publishers, Boston.<br />
Ailawadi, Kusum L., and Scott A. Neslin (1998), "The Effect of Promotion on Consumption:<br />
Buying More and Consuming it Faster," Journal of Marketing Research, Vol. 35 (August), 390-<br />
398.<br />
Barney, J.B. (1991), "Firm Resources and Sustained Competitive Advantage," Journal of<br />
Management, Vol. 17, 99-120.<br />
Bass, Frank M., Moshe M. Givon, Manohar U. Kalwani, David Reibstein, and Gordon P. Wright<br />
(1984), "An Investigation into the Order of the Brand Choice Process," Marketing Science, Vol.<br />
3 (4), 267-287.<br />
Batra, Rajeev, Donald Lehmann, Joanne Burke, and Jae Pae (1995), "When Does Advertising<br />
Have an Impact? A Study of Tracking Data," Journal of Advertising Research, September-<br />
October, 19-32.<br />
Bell, David R., Jeongwen Chiang, and V. Padmanabhan (1999), "The Decomposition of<br />
Promotional Response: An Empirical Generalization," Marketing Science, Vol. 18 (4), 504-526.<br />
11
Bell, Stephen S., and Gregory S. Carpenter (1992), "Optimal Multiple-Objective Marketing<br />
Strategies," Marketing Letters, 3 (4), 383-393.<br />
Bernheim, B.D., and M.D. Whinston (1990), "Multimarket Contact and Collusive Behavior,"<br />
RAND Journal of Economics, 21 (1), 1-26.<br />
Bhattacharya, C.B. (1997), “Is Your Brand’s Loyalty Too Much, Too Little, or Just Right?:<br />
Explaining Deviations in Loyalty from the Dirichlet Norm,” International Journal of Research<br />
in Marketing, 14 (5), 421-435.<br />
_____, Peter S. Fader, Leonard M. Lodish, and Wayne S. Desarbo (1996), "The Relationship<br />
Between the Marketing Mix and Share of Category Requirements," Marketing Letters, 7 (1), 5-<br />
18.<br />
Blattberg, Robert C., and Scott A. Neslin (1990), Sales Promotion: Concepts, Methods, and<br />
Strategies, Prentice-Hall, Engleweood Cliffs, NJ.<br />
_____, and Kenneth Wisniewski (1989), "Price-Induced Patterns of Competition," Marketing<br />
Science, 8 (Fall), 291-309.<br />
12
Bolton, Ruth (1989), "The Relationship Between Market Characteristics and Promotional Price<br />
Elasticities," Marketing Science, 8 (2), 153-169.<br />
Boulding, William, Eunkyu Lee, and Richard Staelin (1994), "Mastering the Mix: Do<br />
Advertising, Promotion, and Sales Force Activities Lead to Differentiation?" Journal of<br />
Marketing Research, 31 (May), 159-172.<br />
_____, and Richard Staelin (1990), “Environment, Market Share and Market Power,” Management<br />
Science, 36 (10), 1160-1177.<br />
_____ (1993), “A Look on the Cost Side: Market Share and the Competitive Environment,”<br />
Marketing Science, 12 (2), 144-166.<br />
Brodie, Roderick J., Andre Bonfrer, and Justine Cutler (1996), "Do Managers Overreact to Each<br />
Others' Promotional Activity? Further Empirical Evidence," International Journal of Research in<br />
Marketing, 13, 379-387.<br />
Brooker, Katrina (1999), "Can Procter & Gamble Change its Culture, Protect its Market Share,<br />
and Find the Next Tide?" Fortune Magazine, April 26, 146-152.<br />
Bucklin, Randolph, and James Lattin (1991), "A Two-State Model of Purchase Incidence and<br />
Brand Choice," Marketing Science, 10 (1), 24-39.<br />
13
Capron, Laurence, and John Hulland (1999), "Redeployment of Brands, Sales Forces, and<br />
General Marketing Management Expertise Following Horizontal Acquisitions: A Resource-<br />
Based View," Journal of Marketing, 63 (2), 41-54.<br />
Chen, M. (1996), "Competitor Analysis and Interfirm Rivalry: Toward a Theoretical<br />
Integration," Academy of Management Review, 21 (1), 100-134.<br />
Chintagunta, Pradeep (1992), "Estimating a Multinomial Probit Model of Brand Choice Using<br />
the Method of Simulated Moments," Marketing Science, 11 (4), 386-407.<br />
______ (1993), "Investigating Purchase Incidence, Brand Choice, and Purchase Quantity<br />
Decisions of Households," Marketing Science, 12 (2), 184-208.<br />
Collis, D.J. (1991), "A Resource-Based Analysis of Global Competition: The Case of the<br />
Bearings Industry," Strategic Management Journal, 12, 49-68.<br />
Cooper, Lee G., and Masao Nakanishi (1988), Market Share Analysis, International Series in<br />
Quantitative Marketing, Kluwer Academic Publishers.<br />
Cotterill, Ronald W., William P. Putsis, and Ravi Dhar (1999), "Assessing the Competitive<br />
Interaction Between Private Labels and National Brands," Journal of Business (forthcoming).<br />
14
Danaher, Peter J. and Roderick J. Brodie (1999), "Understanding the Characteristics of Price<br />
Elasticities for Frequently Purchased Packaged Goods," University of Auckland Working Paper.<br />
Deighton, John (1984), "The Interaction of Advertising and Evidence," Journal of Consumer<br />
Research, 11 (December), 763-770.<br />
_____, Caroline Henderson, and Scott Neslin (1994), “The Effects of Advertising on Brand<br />
Switching and Repeat Purchasing,” Journal of Marketing Research, 31 (1), 28-43.<br />
Dekimpe, Marnik G., and Dominique Hanssens (1995), "Empirical Generalizations About<br />
Market Evolution and Stationarity," Marketing Science, 14, G109-G121.<br />
Dodson, Joe A., Alice M. Tybout, and Brian Sternthal (1978), "Impact of Deals and Deal<br />
Retraction on Brand Switching," Journal of Marketing Research, 15 (1), 72-81.<br />
Donnelley Marketing Inc. (1997), 17 th Annual Survey of Promotional Practices.<br />
Ehrenberg, A.S.C., Kathy Hammond, and G.J. Goodhardt (1994), “The After-Effects of Price-<br />
Related Consumer Promotions,” Journal of Advertising Research, 34 (July/August), 11-21.<br />
Fader, Peter, and Leonard Lodish (1990), "A Cross-Category Analysis of Category Structure and<br />
Promotional Activity for Grocery Products," Journal of Marketing, 54, 52-65.<br />
15
Fairclough, Gordon (1999), "Wall Street Focuses on What P&G CEO Will Say on Sales," The<br />
Wall Street Journal, June 6 th , B6.<br />
Farris, Paul W., Mark E. Parry, and Kusum L. Ailawadi (1992), "Structural Analyses of Models<br />
With Composite Dependent Variables," Marketing Science, 11 (Winter), 73-94.<br />
_____, and John A. Quelch (1987), Advertising and Promotion Management: A Manager’s<br />
Guide to Theory and Practice, Robert E. Krieger Publishing Company, Florida.<br />
Folkes, Valerie S., Ingrid M. Martin, and Kamal Gupta (1993), “When to Say When: Effects of<br />
Supply on Usage,” Journal of Consumer Research, 20 (3), 467-477.<br />
Gatignon, Hubert (1993), "Marketing Mix Models," in Handbooks in Operations Research and<br />
Management Science, Volume 5, Marketing, editors J. Eliashberg and G.L. Lilien, Chapter 15,<br />
697-732, North Holland Publishers.<br />
____, Erin Anderson, and Kristiaan Helsen (1989), "Competitive Reactions to Market Entry:<br />
Explaining Interfirm Differences," Journal of Marketing Research, 26 (February), 44-55.<br />
Gedenk, Karen, and Scott Neslin (2000), “The Role of Retail Promotion in Determining Future<br />
Brand Loyalty: Its Effect on Purchase Event Feedback,” Journal of Retailing (forthcoming).<br />
16
Ghosh, Avijit, Scott A. Neslin, and Robert W. Shoemaker (1983), "Are There Associations<br />
Between Price Elasticity and Brand Characteristics?" in Patrick E. Murphy et al. (Eds.), 1983<br />
Educators' Conference Proceedings, Chicago, IL: American Marketing Association, 226-230.<br />
Gupta, Sunil (1988) “Impact of Sales Promotions on When, What, and How Much to Buy,”<br />
Journal of Marketing Research, 25 (November), 342-355.<br />
Hagerty, Michael, James Carman, and Gary Russell (1988), “Estimating Elasticities with PIMS<br />
Data: Methodological Issues and Substantive Implications,” Journal of Marketing Research,<br />
Vol. 25 (February), 1-9.<br />
Hoch, Stephen J., Xavier Dreze, and Mary E. Purk (1994), “EDLP, Hi-LO, and Margin<br />
Arithmetic,” Journal of Marketing, 58 (October), 16-27.<br />
Hsiao, C. (1986), Analysis of Panel Data, Cambridge University Press, Cambridge.<br />
Hume, Scott (1992), "Brand Loyalty Steady," Advertising Age, March 2, 19.<br />
Jacobson, Robert (1990), “Unobservable Effects and Business Performance,” Marketing Science, 9,<br />
74-85.<br />
______, and David A. Aaker (1985), “Is Market Share All That It's Cracked Up To Be?” Journal of<br />
Marketing, 49, 11-22.<br />
17
Jedidi, Kamel, Carl F. Mela, and Sunil Gupta (1999), "Managing Advertising and Promotion for<br />
Long-run Profitability," Marketing Science, 18 (1), 1-22.<br />
Johnston, Jack, and John DiNardo (1997), Econometric Methods, 4 th edition, McGraw Hill<br />
Publishers, New York.<br />
Kadiyali, Vrinda, Naufel J. Vilcassim, and Pradeep K. Chintagunta (1999), "Empirical Analysis<br />
of Competitive Product Line Pricing Decisions: Lead, Follow, or Move Together?" Journal of<br />
Business, 69 (4), 459-487.<br />
Kaul, Anil, and Dick Wittink (1995), "Empirical Generalizations About the Impact of<br />
Advertising on Price Sensitivity and Price," Marketing Science, 14 (3), Part 2 of 2, G151-G160.<br />
Kopalle, Praveen, Carl Mela, and Lawrence Marsh (1999), “The Dynamic Effect of Discounting<br />
on Sales: Empirical Analysis and Normative Pricing Implications,” Marketing Science, 18 (3),<br />
317-332.<br />
Kristofferson, Mitchell, and Rajiv Lal (1996a), "Value Pricing at Procter & Gamble (A)", Case<br />
Number M-284A, Graduate School of Business, Stanford University.<br />
_____, and _____ (1996b), "Value Pricing at Procter & Gamble (B)", Case Number M-284B,<br />
Graduate School of Business, Stanford University.<br />
18
Lal, Rajiv, and V. Padmanabhan (1995), "Competitive Response and Equilibria," Marketing<br />
Science, 14 (3), Part 2 of 2, G101-G108.<br />
Leeflang, Peter S.H., and Dick R. Wittink (1992), "Diagnosing Competitive Reactions Using<br />
(Aggregated) Scanner Data," International Journal of Research in Marketing, 9, 39-57.<br />
_____, and _____ (1996), “Competitive Reaction versus Consumer Response: Do Managers<br />
Overreact,” International Journal of Research in Marketing, 13, 103-119.<br />
Litvack, David S., Roger J. Calantone, and Paul R. Warshaw (1985), "An Examination of Short-<br />
Term Retail Grocery Price Effects," Journal of Retailing, 61 (3), 9-25.<br />
Lodish, Leonard M., Magid M. Abraham, Stuart Kalmenson, Jeanne Livelsberger, Beth<br />
Lubetkin, Bruce Richardson, and Mary Ellen Stevens (1995a), "How TV Advertising Works: A<br />
Meta-Analysis of 389 Real World Split Cable TV Advertising Experiments," Journal of<br />
Marketing Research, Vol. 32 (May), 125-139.<br />
_____, _____, Jeanne Livelsberger, Beth Lubetkin, Bruce Richardson, and Mary Ellen Stevens<br />
(1995b), "A Summary of Fifty-five In-market Experimental Estimates of the Long-term Effect of<br />
TV Advertising," Marketing Science, 14 (3), Part 2 of 2, G133-G140.<br />
19
Mela, Carl F., Sunil Gupta, and Donald R. Lehmann (1997), “The Long-Term Impact of<br />
Promotions and Advertising on Consumer Brand Choice,” Journal of Marketing Research, 34<br />
(May), 248-261.<br />
Narasimhan, Chakravarthi, Scott A. Neslin, and Subrata Sen (1996), "Promotional Elasticities<br />
and Category Characteristics," Journal of Marketing, 60 (April), 17-30.<br />
Porter, M.E. (1980), Competitive Strategy: Techniques for Analyzing Industries and<br />
Competitors, New York, The Free Press.<br />
Putsis, William, and Ravi Dhar (1998), "The Many Faces of Competition," Marketing Letters, 9<br />
(August), 269-284.<br />
Qualls, David (1974), 'Stability and Persistence of Economic Profit Margins in Highly<br />
Concentrated Industries," Southern Economic Journal, 40, 604-612.<br />
Ramaswamy, Venkatram, Hubert Gatignon, and David J. Reibstein (1994), "Competitive<br />
Marketing Behavior in Industrial Markets," Journal of Marketing, 58 (2), 45-<br />
Rao, Ram C., Ramesh V. Arjunji, and B.P.S. Murthi (1995), "Game Theory and Empirical<br />
Generalizations Concerning Competitive Promotions," Marketing Science, 14 (3), Part 2 of 2,<br />
G89-G100.<br />
20
Robinson, William T. (1988), "Marketing Mix Reaction to Entry," Marketing Science, 7 (3),<br />
368-385.<br />
Rothschild, Michael L. (1987), “A Behavioral View of Promotion's Effects on Brand Loyalty,”<br />
in Advances in Consumer Research, Vol. XIV, eds. Melanie Wallendorf and Paul Anderson,<br />
119-120, Provo, UT: Association for Consumer Research.<br />
______, and William Gaidis (1981), “Behavioral Learning Theory: Its Relevance to Marketing<br />
and Promotions,” Journal of Marketing, 45 (2), 70-78.<br />
Scherer, F.M., and David Ross (1990), Industrial Market Structure and Economic Performance,<br />
Houghton Mifflin Company, Boston.<br />
Sethuraman, Raj, and Gerard Tellis (1991), "An Analysis of the Tradeoff Between Advertising<br />
and Price Discounting," Journal of Marketing Research, Vol. 28 (May), 160-174.<br />
Shankar, Venkatesh (1999), “New Product Introduction and Incumbent Response Strategies:<br />
Their Interrelationship and the Role of Multimarket Contact,” Journal of Marketing Research, 36<br />
(3), 327-344.<br />
Shapiro, Eben (1992), "P&G Takes On the Supermarkets With Uniform Pricing," The New York<br />
Times, April 26.<br />
21
Spiller, Pablo T., and Edgardo Favaro (1984), "The Effects of Entry Regulation on Oligopolistic<br />
Interaction: The Uruguayan Banking Sector," Rand Journal of Economics, 15 (2), 244-254.<br />
Tellis, Gerard (1988), "Advertising Exposure, Loyalty, and Brand Purchase: A Two-Stage Model<br />
of Choice,” Journal of Marketing Research, 25 (May), 134-144.<br />
______ (1998), Advertising and Sales Promotion Strategy, Addison-Wesley Educational<br />
Publishers, MA.<br />
Vakratsas, Demetrios, and Tim Ambler (1999), “How Advertising Works: What Do We Really<br />
Know?” Journal of Marketing, 63 (1), 26-43.<br />
Wansink, Brian (1994), “Antecedents and Mediators of Eating Bouts,” Family and Consumer<br />
Sciences Research Journal, 23 (2), 166-182.<br />
_____ and Rohit Deshpandé (1994), “Out of Sight, Out of Mind: Pantry Stockpiling and Brand-<br />
Usage Frequency,” Marketing Letters, 5 (January), 91-100.<br />
_____ and Michael L. Ray (1996), "Advertising Strategies to Increase Usage Frequency,"<br />
Journal of Marketing, Vol. 60 (1), 31-46.<br />
Wernerfelt, Birger (1984), "A Resource Based View of the Firm," Strategic Management<br />
Journal, 5, 171-180.<br />
22
Winer, Russell (1986), “A Reference Price Model of Brand Choice for Frequently Purchased<br />
Products,” Journal of Consumer Research, 13 (September), 250-256.<br />
Wittink, Dick, M. Addona, W. Hawkes, and J.C. Porter (1987), "SCAN*PRO: The Estimation,<br />
Validation, and Use of Promotional Effects Based on Scanner Data," Working Paper, Johnson<br />
Graduate School of Management, Cornell University.<br />
23
TABLE 9<br />
<strong>THE</strong> NET IMPACT ON P&G's <strong>MARKET</strong> SHARE<br />
Variable Change Ratio PEN USE SOR Share<br />
(1996/1990) Elasticity Impact Elasticity Impact Elasticity Impact Elasticity Impact<br />
P&G Price 1.204 -0.129 0.976 -0.124 0.977 -0.295 0.947 -0.548 0.903<br />
P&G Advertising 1.207 0.026 1.005 -0.001 1.000 -0.020 0.996 0.005 1.001<br />
P&G Deals 0.843 0.178 0.970 -0.021 1.004 0.012 0.998 0.169 0.972<br />
P&G Coupons 0.457 0.161 0.882 0.008 0.994 0.008 0.994 0.177 0.871<br />
Competitor Price 1.100 -0.161 0.985 0.026 1.003 0.439 1.043 0.304 1.029<br />
Competitor Advtg. 1.063 -0.011 0.999 -0.012 0.999 -0.038 0.998 -0.061 0.996<br />
Competitor Deals 1.131 -0.145 0.982 0.032 1.004 -0.087 0.989 -0.200 0.976<br />
Competitor Coupons 0.829 -0.080 1.015 0.026 0.995 -0.101 1.019 -0.155 1.030<br />
Intercept (e α ) -- 1.015 1.015 1.022 1.022 1.030 1.030 1.068 1.068<br />
Predicted Change Ratio 0.835 0.997 1.010 0.841<br />
5
Own<br />
Price<br />
Advertising<br />
Deals<br />
Coupons<br />
FIGURE 1<br />
CONCEPTUAL FRAMEWORK<br />
• Brand Market Share Position<br />
• Category Characteristics<br />
6<br />
Market Share<br />
PEN x SOR x USE<br />
• Market Share Elasticities<br />
• Structural Factors<br />
• Firm-Specific Effects<br />
Competitors'<br />
Price<br />
Advertising<br />
Deals<br />
Coupons
TABLE 5<br />
AVERAGE <strong>MARKET</strong> SHARE ELASTICITIES BY SIZE<br />
Average Market Share Elasticities For<br />
Independent Variable Small Brands Mid-Sized Brands Large Brands<br />
Own Price -0.696 -0.481 -0.517<br />
Own Advertising 0.117 0.024 -0.017<br />
Own Deals 0.078 0.018 0.327<br />
Own Coupons -0.001 0.132 0.266<br />
Comp. Price 3.220 -0.061 0.058<br />
Comp. Advtg. -0.428 -0.038 -0.001<br />
Comp. Deals 0.377 -0.312 -0.210<br />
Comp. Coupons -0.500 -0.090 -0.166<br />
Elasticity<br />
TABLE 6<br />
<strong>MARKET</strong> SHARE ELASTICITIES: DISAGGREGATE DATA<br />
Mean Value for<br />
Entire Sample Small Brands Mid-Sized Brands Large Brands<br />
Own Price -1.119 -2.129 -0.927 -0.916<br />
Own Promotion 0.139 0.129 0.167 0.127<br />
Own Advertising 0.035 0.076 0.034 0.016<br />
Competitive Price 1.700 4.274 1.570 0.617<br />
Competitive Promotion -0.143 0.061 -0.236 -0.157<br />
Competitive Advertising -0.048 -0.196 -0.016 -0.012
TABLE 7<br />
COMPETITIVE REACTION MODEL: SUMMARY<br />
(376 observations)<br />
F-stat for Impact of No of<br />
Coefficients<br />
2<br />
Competitive Reaction Variable<br />
Price Advertising Deals Coupons<br />
Market Share Elasticities 14 4.55* 3.12* 2.54* 1.44***<br />
Structural Factors 8 4.34* 2.81* 5.59* 5.79*<br />
Firm-Specific 6 3.71* 0.95 3.21* 5.47*<br />
Category Class-Specific 8 6.26* 2.61* 6.32* 2.94*<br />
* p < 0.05; ** p < 0.10; *** p < 0.15
TABLE 8<br />
ESTIMATES OF COMPETITIVE REACTION MODEL<br />
Dependent Variable #<br />
Independent Variable Price Change Advertising Deal Change Coupon<br />
Change<br />
Change<br />
Intercept 0.148 -0.137 8.198 * 4.514<br />
Self Elasticity 0.150 ** -3.223 * 9.586 * 16.400 ***<br />
Colgate 0.015 -0.106 10.592 * 16.527 *<br />
Lever 0.124 -0.283 6.293 18.857 *<br />
Gillette -0.136 -0.240 7.195 * 18.855 *<br />
Small 0.194 * 0.350 *** 5.358 * 4.721 ***<br />
Medium 0.046 -0.029 1.697 5.195 *<br />
Health Remedies 0.327 * 0.378 ** -11.193 * -6.002 ***<br />
Cleaners -0.004 -0.312 ** -1.921 5.511 **<br />
Personal Care -0.026 0.076 -10.032 * 0.337<br />
Paper -0.034 0.025 -5.092 * 1.480<br />
No. of Market Contacts -0.011 0.063 -0.452 -3.477 *<br />
Concentration -0.002 0.001 -0.028 -0.074 ***<br />
Shreff -0.021 -0.023 8.797 * -3.176<br />
Self Elasticity x Shreff -0.131 ** -0.370 2.161 7.261<br />
Colgate x Shreff -0.374 * -0.515 * 2.447 -3.306<br />
Lever x Shreff -0.760 * -0.743 ** 0.477 -2.765<br />
Gillette x Shreff -0.058 -0.045 2.061 -2.886<br />
Small x Shreff -0.308 * -0.952 * 11.287 * -0.171<br />
Medium x Shreff -0.105 * -0.176 * -0.731 2.641 **<br />
Health Remedies x Shreff -0.142 * -0.206 *** -2.716 ** 0.478<br />
Cleaners x Shreff 0.067 -0.066 0.160 -3.256<br />
Personal Care x Shreff -0.255 * -0.218 -2.920 -2.328<br />
Paper x Shreff 0.048 0.083 -1.950 -2.706<br />
No. of Contacts x Shreff 0.110 * 0.120 * -0.317 0.406<br />
Concentration x Shreff -0.003 -0.001 -0.079 ** 0.027<br />
#<br />
Magnitude Change in Competitor's Marketing Mix Variable from 1990 to current year<br />
* ** ***<br />
p < 0.05; p < 0.10; p < 0.15<br />
3
Marketing Mix Variable<br />
TABLE 4<br />
ESTIMATES OF <strong>MARKET</strong> SHARE <strong>RESPONSE</strong> MODEL<br />
Main Effect Small<br />
Brands<br />
Mid-Sized<br />
Brands<br />
Interaction With<br />
Cat. Advtg Cat. Deals Stockpiling Purchase<br />
Cycle<br />
Own Price 0.327 -0.230 0.033 0.133*** -0.010 1.281** -0.012<br />
Own Advertising -0.289** 0.141* 0.039 -0.014*** 0.001 -0.074** 0.003**<br />
Own Deal 2.099* -0.236 -0.270*** 0.147* -0.018* -0.011 -0.016*<br />
Own Coupon 0.373*** -0.266* -0.143** 0.024* -0.005** 0.253* -0.000<br />
Comp. Price -1.036 3.169* -0.186 -0.319* 0.021 -1.042 0.014<br />
Comp. Advertising 0.357 -0.428* -0.026 0.021 -0.002 -0.065 -0.004<br />
Comp. Deal -0.507 0.606** -0.090 0.005 0.001 -0.291 0.004<br />
Comp. Coupon -0.473 -0.311* 0.108 0.038 0.002 -0.382* 0.003<br />
* p < 0.01; ** p < 0.05; *** p < 0.10.
TABLE 5<br />
AVERAGE <strong>MARKET</strong> SHARE ELASTICITIES BY SIZE<br />
Average Market Share Elasticities For<br />
Independent Variable Small Brands Mid-Sized Brands Large Brands<br />
Own Price -0.696 -0.481 -0.517<br />
Own Advertising 0.117 0.024 -0.017<br />
Own Deals 0.078 0.018 0.327<br />
Own Coupons -0.001 0.132 0.266<br />
Comp. Price 3.220 -0.061 0.058<br />
Comp. Advtg. -0.428 -0.038 -0.001<br />
Comp. Deals 0.377 -0.312 -0.210<br />
Comp. Coupons -0.500 -0.090 -0.166<br />
Elasticity<br />
TABLE 6<br />
<strong>MARKET</strong> SHARE ELASTICITIES: DISAGGREGATE DATA<br />
Mean Value for<br />
Entire Sample Small Brands Mid-Sized Brands Large Brands<br />
Own Price -1.119 -2.129 -0.927 -0.916<br />
Own Promotion 0.139 0.129 0.167 0.127<br />
Own Advertising 0.035 0.076 0.034 0.016<br />
Competitive Price 1.700 4.274 1.570 0.617<br />
Competitive Promotion -0.143 0.061 -0.236 -0.157<br />
Competitive Advertising -0.048 -0.196 -0.016 -0.012
TABLE 7<br />
COMPETITIVE REACTION MODEL: SUMMARY<br />
(376 observations)<br />
F-stat for Impact of No of<br />
Coefficients<br />
2<br />
Competitive Reaction Variable<br />
Price Advertising Deals Coupons<br />
Market Share Elasticities 14 4.55* 3.12* 2.54* 1.44***<br />
Structural Factors 8 4.34* 2.81* 5.59* 5.79*<br />
Firm-Specific 6 3.71* 0.95 3.21* 5.47*<br />
Category Class-Specific 8 6.26* 2.61* 6.32* 2.94*<br />
* p < 0.05; ** p < 0.10; *** p < 0.15
TABLE 8<br />
ESTIMATES OF COMPETITIVE REACTION MODEL<br />
Dependent Variable #<br />
Independent Variable Price Change Advertising Deal Change Coupon<br />
Change<br />
Change<br />
Intercept 0.148 -0.137 8.198 * 4.514<br />
Self Elasticity 0.150 ** -3.223 * 9.586 * 16.400 ***<br />
Colgate 0.015 -0.106 10.592 * 16.527 *<br />
Lever 0.124 -0.283 6.293 18.857 *<br />
Gillette -0.136 -0.240 7.195 * 18.855 *<br />
Small 0.194 * 0.350 *** 5.358 * 4.721 ***<br />
Medium 0.046 -0.029 1.697 5.195 *<br />
Health Remedies 0.327 * 0.378 ** -11.193 * -6.002 ***<br />
Cleaners -0.004 -0.312 ** -1.921 5.511 **<br />
Personal Care -0.026 0.076 -10.032 * 0.337<br />
Paper -0.034 0.025 -5.092 * 1.480<br />
No. of Market Contacts -0.011 0.063 -0.452 -3.477 *<br />
Concentration -0.002 0.001 -0.028 -0.074 ***<br />
Shreff -0.021 -0.023 8.797 * -3.176<br />
Self Elasticity x Shreff -0.131 ** -0.370 2.161 7.261<br />
Colgate x Shreff -0.374 * -0.515 * 2.447 -3.306<br />
Lever x Shreff -0.760 * -0.743 ** 0.477 -2.765<br />
Gillette x Shreff -0.058 -0.045 2.061 -2.886<br />
Small x Shreff -0.308 * -0.952 * 11.287 * -0.171<br />
Medium x Shreff -0.105 * -0.176 * -0.731 2.641 **<br />
Health Remedies x Shreff -0.142 * -0.206 *** -2.716 ** 0.478<br />
Cleaners x Shreff 0.067 -0.066 0.160 -3.256<br />
Personal Care x Shreff -0.255 * -0.218 -2.920 -2.328<br />
Paper x Shreff 0.048 0.083 -1.950 -2.706<br />
No. of Contacts x Shreff 0.110 * 0.120 * -0.317 0.406<br />
Concentration x Shreff -0.003 -0.001 -0.079 ** 0.027<br />
#<br />
Magnitude Change in Competitor's Marketing Mix Variable from 1990 to current year<br />
* ** ***<br />
p < 0.05; p < 0.10; p < 0.15<br />
3
TABLE 9<br />
<strong>THE</strong> NET IMPACT ON P&G's <strong>MARKET</strong> SHARE<br />
Variable Change Ratio PEN USE SOR Share<br />
(1996/1990) Elasticity Impact Elasticity Impact Elasticity Impact Elasticity Impact<br />
P&G Price 1.204 -0.129 0.976 -0.124 0.977 -0.295 0.947 -0.548 0.903<br />
P&G Advertising 1.207 0.026 1.005 -0.001 1.000 -0.020 0.996 0.005 1.001<br />
P&G Deals 0.843 0.178 0.970 -0.021 1.004 0.012 0.998 0.169 0.972<br />
P&G Coupons 0.457 0.161 0.882 0.008 0.994 0.008 0.994 0.177 0.871<br />
Competitor Price 1.100 -0.161 0.985 0.026 1.003 0.439 1.043 0.304 1.029<br />
Competitor Advtg. 1.063 -0.011 0.999 -0.012 0.999 -0.038 0.998 -0.061 0.996<br />
Competitor Deals 1.131 -0.145 0.982 0.032 1.004 -0.087 0.989 -0.200 0.976<br />
Competitor Coupons 0.829 -0.080 1.015 0.026 0.995 -0.101 1.019 -0.155 1.030<br />
Intercept (e α ) -- 1.015 1.015 1.022 1.022 1.030 1.030 1.068 1.068<br />
Predicted Change Ratio 0.835 0.997 1.010 0.841<br />
5
Own<br />
Price<br />
Advertising<br />
Deals<br />
Coupons<br />
FIGURE 1<br />
CONCEPTUAL FRAMEWORK<br />
• Brand Market Share Position<br />
• Category Characteristics<br />
6<br />
Market Share<br />
PEN x SOR x USE<br />
• Market Share Elasticities<br />
• Structural Factors<br />
• Firm-Specific Effects<br />
Competitors'<br />
Price<br />
Advertising<br />
Deals<br />
Coupons
FIGURE 2<br />
OVERVIEW OF VALUE PRIC<strong>IN</strong>G<br />
7
FIGURE 3<br />
AVERAGE COMPETITIVE REACTIONS<br />
8
APPENDIX 1<br />
VARIABLES AND <strong>THE</strong>IR DEF<strong>IN</strong>ITIONS<br />
I. Variables Obtained Directly From IRI Market Fact Book:<br />
• Market Share: % Share of Category Volume.<br />
• Household Penetration: % of all households that made at least one purchase of the brand.<br />
• Share of Category Requirements (SOR): Among households that bought the brand, the<br />
percentage of their total category purchases represented by the brand.<br />
• Net Price Per Unit Volume: The average price paid per unit volume, reflecting all<br />
promotional activity.<br />
• % Volume on Deal: % of brand sales that were accompanied by some kind of deal, e.g.,<br />
display, feature, temporary price reduction (TPR).<br />
• % Volume with Manufacturer Coupon: % of brand sales that were made with a<br />
manufacturer coupon.<br />
• Average % Price Cut: The average savings due to TPR or coupon redemption.<br />
II. New Variables Computed From IRI Market Fact Book Data:<br />
• Shelf Price:<br />
• Penetration Index (PEN): Brand Penetration/Category Penetration.<br />
• Category Usage (USE): Average Category Purchase per Brand Buyer/Average Category<br />
Purchase per Category Buyer.<br />
• Market Concentration: Share of Top Three Brands in the Market.<br />
• Number of Market Contacts: Number of product categories (out of 24) in which a firm<br />
competes with P&G.<br />
III. Media Advertising Spending from Leading National Advertisers: In tens of millions of<br />
dollars. Minimum of advertising spending from remaining years used if company not found in<br />
LNA in a given year.<br />
IV. Category Stockpileability: Factor scores for each category provided by Narasimhan,<br />
Neslin, and Sen (1996).<br />
9
• HEALTH REMEDIES<br />
1. COLD/ALLERGY/S<strong>IN</strong>US LIQUID<br />
2. COLD/ALLERGY/S<strong>IN</strong>US TABLETS<br />
3. COUGH SYRUP<br />
• CLEANERS<br />
4. DISHWASHER DETERGENT<br />
5. DISHWASH<strong>IN</strong>G LIQUID<br />
6. DRY BLEACH<br />
7. LIQUID LAUNDRY DETERGENT<br />
8. PWD LAUNDRY DETERGENT<br />
• PERSONAL CARE<br />
9. HAIR CONDITIONER<br />
10. HAIR SPRAY<br />
11. SHAMPOO<br />
12. BARSOAP<br />
13. LIQUID SOAP<br />
14. MOUTHWASH<br />
15. <strong>TO</strong>OTHPASTE<br />
16. <strong>TO</strong>OTHBRUSHES<br />
• PAPER<br />
17. PAPER <strong>TO</strong>WELS<br />
18. DIAPERS<br />
19. FACIAL TISSUE<br />
20. <strong>TO</strong>ILET TISSUE<br />
• FOOD<br />
21. POTA<strong>TO</strong> CHIPS<br />
22. FROST<strong>IN</strong>G<br />
23. BROWNIE MIX<br />
24. SHORTEN<strong>IN</strong>G<br />
APPENDIX 2<br />
LIST OF PRODUCT CATEGORIES<br />
10
REFERENCES<br />
Abeele, Piet Vanden (1994), "Commentary on Diagnosing Competition: Developments and<br />
Findings," in Research Traditions in Marketing, edited by Gilles Laurent, Gary Lilien, and<br />
Bernard Pras, Kluwer Academic Publishers, Boston.<br />
Ailawadi, Kusum L., and Scott A. Neslin (1998), "The Effect of Promotion on Consumption:<br />
Buying More and Consuming it Faster," Journal of Marketing Research, Vol. 35 (August), 390-<br />
398.<br />
Barney, J.B. (1991), "Firm Resources and Sustained Competitive Advantage," Journal of<br />
Management, Vol. 17, 99-120.<br />
Bass, Frank M., Moshe M. Givon, Manohar U. Kalwani, David Reibstein, and Gordon P. Wright<br />
(1984), "An Investigation into the Order of the Brand Choice Process," Marketing Science, Vol.<br />
3 (4), 267-287.<br />
Batra, Rajeev, Donald Lehmann, Joanne Burke, and Jae Pae (1995), "When Does Advertising<br />
Have an Impact? A Study of Tracking Data," Journal of Advertising Research, September-<br />
October, 19-32.<br />
Bell, David R., Jeongwen Chiang, and V. Padmanabhan (1999), "The Decomposition of<br />
Promotional Response: An Empirical Generalization," Marketing Science, Vol. 18 (4), 504-526.<br />
11
Bell, Stephen S., and Gregory S. Carpenter (1992), "Optimal Multiple-Objective Marketing<br />
Strategies," Marketing Letters, 3 (4), 383-393.<br />
Bernheim, B.D., and M.D. Whinston (1990), "Multimarket Contact and Collusive Behavior,"<br />
RAND Journal of Economics, 21 (1), 1-26.<br />
Bhattacharya, C.B. (1997), “Is Your Brand’s Loyalty Too Much, Too Little, or Just Right?:<br />
Explaining Deviations in Loyalty from the Dirichlet Norm,” International Journal of Research<br />
in Marketing, 14 (5), 421-435.<br />
_____, Peter S. Fader, Leonard M. Lodish, and Wayne S. Desarbo (1996), "The Relationship<br />
Between the Marketing Mix and Share of Category Requirements," Marketing Letters, 7 (1), 5-<br />
18.<br />
Blattberg, Robert C., and Scott A. Neslin (1990), Sales Promotion: Concepts, Methods, and<br />
Strategies, Prentice-Hall, Engleweood Cliffs, NJ.<br />
_____, and Kenneth Wisniewski (1989), "Price-Induced Patterns of Competition," Marketing<br />
Science, 8 (Fall), 291-309.<br />
12
Bolton, Ruth (1989), "The Relationship Between Market Characteristics and Promotional Price<br />
Elasticities," Marketing Science, 8 (2), 153-169.<br />
Boulding, William, Eunkyu Lee, and Richard Staelin (1994), "Mastering the Mix: Do<br />
Advertising, Promotion, and Sales Force Activities Lead to Differentiation?" Journal of<br />
Marketing Research, 31 (May), 159-172.<br />
_____, and Richard Staelin (1990), “Environment, Market Share and Market Power,” Management<br />
Science, 36 (10), 1160-1177.<br />
_____ (1993), “A Look on the Cost Side: Market Share and the Competitive Environment,”<br />
Marketing Science, 12 (2), 144-166.<br />
Brodie, Roderick J., Andre Bonfrer, and Justine Cutler (1996), "Do Managers Overreact to Each<br />
Others' Promotional Activity? Further Empirical Evidence," International Journal of Research in<br />
Marketing, 13, 379-387.<br />
Brooker, Katrina (1999), "Can Procter & Gamble Change its Culture, Protect its Market Share,<br />
and Find the Next Tide?" Fortune Magazine, April 26, 146-152.<br />
Bucklin, Randolph, and James Lattin (1991), "A Two-State Model of Purchase Incidence and<br />
Brand Choice," Marketing Science, 10 (1), 24-39.<br />
13
Capron, Laurence, and John Hulland (1999), "Redeployment of Brands, Sales Forces, and<br />
General Marketing Management Expertise Following Horizontal Acquisitions: A Resource-<br />
Based View," Journal of Marketing, 63 (2), 41-54.<br />
Chen, M. (1996), "Competitor Analysis and Interfirm Rivalry: Toward a Theoretical<br />
Integration," Academy of Management Review, 21 (1), 100-134.<br />
Chintagunta, Pradeep (1992), "Estimating a Multinomial Probit Model of Brand Choice Using<br />
the Method of Simulated Moments," Marketing Science, 11 (4), 386-407.<br />
______ (1993), "Investigating Purchase Incidence, Brand Choice, and Purchase Quantity<br />
Decisions of Households," Marketing Science, 12 (2), 184-208.<br />
Collis, D.J. (1991), "A Resource-Based Analysis of Global Competition: The Case of the<br />
Bearings Industry," Strategic Management Journal, 12, 49-68.<br />
Cooper, Lee G., and Masao Nakanishi (1988), Market Share Analysis, International Series in<br />
Quantitative Marketing, Kluwer Academic Publishers.<br />
Cotterill, Ronald W., William P. Putsis, and Ravi Dhar (1999), "Assessing the Competitive<br />
Interaction Between Private Labels and National Brands," Journal of Business (forthcoming).<br />
14
Danaher, Peter J. and Roderick J. Brodie (1999), "Understanding the Characteristics of Price<br />
Elasticities for Frequently Purchased Packaged Goods," University of Auckland Working Paper.<br />
Deighton, John (1984), "The Interaction of Advertising and Evidence," Journal of Consumer<br />
Research, 11 (December), 763-770.<br />
_____, Caroline Henderson, and Scott Neslin (1994), “The Effects of Advertising on Brand<br />
Switching and Repeat Purchasing,” Journal of Marketing Research, 31 (1), 28-43.<br />
Dekimpe, Marnik G., and Dominique Hanssens (1995), "Empirical Generalizations About<br />
Market Evolution and Stationarity," Marketing Science, 14, G109-G121.<br />
Dodson, Joe A., Alice M. Tybout, and Brian Sternthal (1978), "Impact of Deals and Deal<br />
Retraction on Brand Switching," Journal of Marketing Research, 15 (1), 72-81.<br />
Donnelley Marketing Inc. (1997), 17 th Annual Survey of Promotional Practices.<br />
Ehrenberg, A.S.C., Kathy Hammond, and G.J. Goodhardt (1994), “The After-Effects of Price-<br />
Related Consumer Promotions,” Journal of Advertising Research, 34 (July/August), 11-21.<br />
Fader, Peter, and Leonard Lodish (1990), "A Cross-Category Analysis of Category Structure and<br />
Promotional Activity for Grocery Products," Journal of Marketing, 54, 52-65.<br />
15
Fairclough, Gordon (1999), "Wall Street Focuses on What P&G CEO Will Say on Sales," The<br />
Wall Street Journal, June 6 th , B6.<br />
Farris, Paul W., Mark E. Parry, and Kusum L. Ailawadi (1992), "Structural Analyses of Models<br />
With Composite Dependent Variables," Marketing Science, 11 (Winter), 73-94.<br />
_____, and John A. Quelch (1987), Advertising and Promotion Management: A Manager’s<br />
Guide to Theory and Practice, Robert E. Krieger Publishing Company, Florida.<br />
Folkes, Valerie S., Ingrid M. Martin, and Kamal Gupta (1993), “When to Say When: Effects of<br />
Supply on Usage,” Journal of Consumer Research, 20 (3), 467-477.<br />
Gatignon, Hubert (1993), "Marketing Mix Models," in Handbooks in Operations Research and<br />
Management Science, Volume 5, Marketing, editors J. Eliashberg and G.L. Lilien, Chapter 15,<br />
697-732, North Holland Publishers.<br />
____, Erin Anderson, and Kristiaan Helsen (1989), "Competitive Reactions to Market Entry:<br />
Explaining Interfirm Differences," Journal of Marketing Research, 26 (February), 44-55.<br />
Gedenk, Karen, and Scott Neslin (2000), “The Role of Retail Promotion in Determining Future<br />
Brand Loyalty: Its Effect on Purchase Event Feedback,” Journal of Retailing (forthcoming).<br />
16
Ghosh, Avijit, Scott A. Neslin, and Robert W. Shoemaker (1983), "Are There Associations<br />
Between Price Elasticity and Brand Characteristics?" in Patrick E. Murphy et al. (Eds.), 1983<br />
Educators' Conference Proceedings, Chicago, IL: American Marketing Association, 226-230.<br />
Gupta, Sunil (1988) “Impact of Sales Promotions on When, What, and How Much to Buy,”<br />
Journal of Marketing Research, 25 (November), 342-355.<br />
Hagerty, Michael, James Carman, and Gary Russell (1988), “Estimating Elasticities with PIMS<br />
Data: Methodological Issues and Substantive Implications,” Journal of Marketing Research,<br />
Vol. 25 (February), 1-9.<br />
Hoch, Stephen J., Xavier Dreze, and Mary E. Purk (1994), “EDLP, Hi-LO, and Margin<br />
Arithmetic,” Journal of Marketing, 58 (October), 16-27.<br />
Hsiao, C. (1986), Analysis of Panel Data, Cambridge University Press, Cambridge.<br />
Hume, Scott (1992), "Brand Loyalty Steady," Advertising Age, March 2, 19.<br />
Jacobson, Robert (1990), “Unobservable Effects and Business Performance,” Marketing Science, 9,<br />
74-85.<br />
______, and David A. Aaker (1985), “Is Market Share All That It's Cracked Up To Be?” Journal of<br />
Marketing, 49, 11-22.<br />
17
Jedidi, Kamel, Carl F. Mela, and Sunil Gupta (1999), "Managing Advertising and Promotion for<br />
Long-run Profitability," Marketing Science, 18 (1), 1-22.<br />
Johnston, Jack, and John DiNardo (1997), Econometric Methods, 4 th edition, McGraw Hill<br />
Publishers, New York.<br />
Kadiyali, Vrinda, Naufel J. Vilcassim, and Pradeep K. Chintagunta (1999), "Empirical Analysis<br />
of Competitive Product Line Pricing Decisions: Lead, Follow, or Move Together?" Journal of<br />
Business, 69 (4), 459-487.<br />
Kaul, Anil, and Dick Wittink (1995), "Empirical Generalizations About the Impact of<br />
Advertising on Price Sensitivity and Price," Marketing Science, 14 (3), Part 2 of 2, G151-G160.<br />
Kopalle, Praveen, Carl Mela, and Lawrence Marsh (1999), “The Dynamic Effect of Discounting<br />
on Sales: Empirical Analysis and Normative Pricing Implications,” Marketing Science, 18 (3),<br />
317-332.<br />
Kristofferson, Mitchell, and Rajiv Lal (1996a), "Value Pricing at Procter & Gamble (A)", Case<br />
Number M-284A, Graduate School of Business, Stanford University.<br />
_____, and _____ (1996b), "Value Pricing at Procter & Gamble (B)", Case Number M-284B,<br />
Graduate School of Business, Stanford University.<br />
18
Lal, Rajiv, and V. Padmanabhan (1995), "Competitive Response and Equilibria," Marketing<br />
Science, 14 (3), Part 2 of 2, G101-G108.<br />
Leeflang, Peter S.H., and Dick R. Wittink (1992), "Diagnosing Competitive Reactions Using<br />
(Aggregated) Scanner Data," International Journal of Research in Marketing, 9, 39-57.<br />
_____, and _____ (1996), “Competitive Reaction versus Consumer Response: Do Managers<br />
Overreact,” International Journal of Research in Marketing, 13, 103-119.<br />
Litvack, David S., Roger J. Calantone, and Paul R. Warshaw (1985), "An Examination of Short-<br />
Term Retail Grocery Price Effects," Journal of Retailing, 61 (3), 9-25.<br />
Lodish, Leonard M., Magid M. Abraham, Stuart Kalmenson, Jeanne Livelsberger, Beth<br />
Lubetkin, Bruce Richardson, and Mary Ellen Stevens (1995a), "How TV Advertising Works: A<br />
Meta-Analysis of 389 Real World Split Cable TV Advertising Experiments," Journal of<br />
Marketing Research, Vol. 32 (May), 125-139.<br />
_____, _____, Jeanne Livelsberger, Beth Lubetkin, Bruce Richardson, and Mary Ellen Stevens<br />
(1995b), "A Summary of Fifty-five In-market Experimental Estimates of the Long-term Effect of<br />
TV Advertising," Marketing Science, 14 (3), Part 2 of 2, G133-G140.<br />
19
Mela, Carl F., Sunil Gupta, and Donald R. Lehmann (1997), “The Long-Term Impact of<br />
Promotions and Advertising on Consumer Brand Choice,” Journal of Marketing Research, 34<br />
(May), 248-261.<br />
Narasimhan, Chakravarthi, Scott A. Neslin, and Subrata Sen (1996), "Promotional Elasticities<br />
and Category Characteristics," Journal of Marketing, 60 (April), 17-30.<br />
Porter, M.E. (1980), Competitive Strategy: Techniques for Analyzing Industries and<br />
Competitors, New York, The Free Press.<br />
Putsis, William, and Ravi Dhar (1998), "The Many Faces of Competition," Marketing Letters, 9<br />
(August), 269-284.<br />
Qualls, David (1974), 'Stability and Persistence of Economic Profit Margins in Highly<br />
Concentrated Industries," Southern Economic Journal, 40, 604-612.<br />
Ramaswamy, Venkatram, Hubert Gatignon, and David J. Reibstein (1994), "Competitive<br />
Marketing Behavior in Industrial Markets," Journal of Marketing, 58 (2), 45-<br />
Rao, Ram C., Ramesh V. Arjunji, and B.P.S. Murthi (1995), "Game Theory and Empirical<br />
Generalizations Concerning Competitive Promotions," Marketing Science, 14 (3), Part 2 of 2,<br />
G89-G100.<br />
20
Robinson, William T. (1988), "Marketing Mix Reaction to Entry," Marketing Science, 7 (3),<br />
368-385.<br />
Rothschild, Michael L. (1987), “A Behavioral View of Promotion's Effects on Brand Loyalty,”<br />
in Advances in Consumer Research, Vol. XIV, eds. Melanie Wallendorf and Paul Anderson,<br />
119-120, Provo, UT: Association for Consumer Research.<br />
______, and William Gaidis (1981), “Behavioral Learning Theory: Its Relevance to Marketing<br />
and Promotions,” Journal of Marketing, 45 (2), 70-78.<br />
Scherer, F.M., and David Ross (1990), Industrial Market Structure and Economic Performance,<br />
Houghton Mifflin Company, Boston.<br />
Sethuraman, Raj, and Gerard Tellis (1991), "An Analysis of the Tradeoff Between Advertising<br />
and Price Discounting," Journal of Marketing Research, Vol. 28 (May), 160-174.<br />
Shankar, Venkatesh (1999), “New Product Introduction and Incumbent Response Strategies:<br />
Their Interrelationship and the Role of Multimarket Contact,” Journal of Marketing Research, 36<br />
(3), 327-344.<br />
Shapiro, Eben (1992), "P&G Takes On the Supermarkets With Uniform Pricing," The New York<br />
Times, April 26.<br />
21
Spiller, Pablo T., and Edgardo Favaro (1984), "The Effects of Entry Regulation on Oligopolistic<br />
Interaction: The Uruguayan Banking Sector," Rand Journal of Economics, 15 (2), 244-254.<br />
Tellis, Gerard (1988), "Advertising Exposure, Loyalty, and Brand Purchase: A Two-Stage Model<br />
of Choice,” Journal of Marketing Research, 25 (May), 134-144.<br />
______ (1998), Advertising and Sales Promotion Strategy, Addison-Wesley Educational<br />
Publishers, MA.<br />
Vakratsas, Demetrios, and Tim Ambler (1999), “How Advertising Works: What Do We Really<br />
Know?” Journal of Marketing, 63 (1), 26-43.<br />
Wansink, Brian (1994), “Antecedents and Mediators of Eating Bouts,” Family and Consumer<br />
Sciences Research Journal, 23 (2), 166-182.<br />
_____ and Rohit Deshpandé (1994), “Out of Sight, Out of Mind: Pantry Stockpiling and Brand-<br />
Usage Frequency,” Marketing Letters, 5 (January), 91-100.<br />
_____ and Michael L. Ray (1996), "Advertising Strategies to Increase Usage Frequency,"<br />
Journal of Marketing, Vol. 60 (1), 31-46.<br />
Wernerfelt, Birger (1984), "A Resource Based View of the Firm," Strategic Management<br />
Journal, 5, 171-180.<br />
22
Winer, Russell (1986), “A Reference Price Model of Brand Choice for Frequently Purchased<br />
Products,” Journal of Consumer Research, 13 (September), 250-256.<br />
Wittink, Dick, M. Addona, W. Hawkes, and J.C. Porter (1987), "SCAN*PRO: The Estimation,<br />
Validation, and Use of Promotional Effects Based on Scanner Data," Working Paper, Johnson<br />
Graduate School of Management, Cornell University.<br />
23