Simon & Schuster - Mba Tuck Dartmouth - Dartmouth College
Simon & Schuster - Mba Tuck Dartmouth - Dartmouth College
Simon & Schuster - Mba Tuck Dartmouth - Dartmouth College

You also want an ePaper? Increase the reach of your titles
YUMPU automatically turns print PDFs into web optimized ePapers that Google loves.
<strong>Simon</strong> & <strong>Schuster</strong><br />
<br />
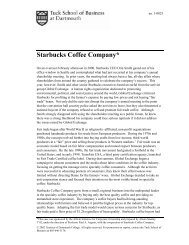
It was the spring of 2001 and the sun was setting. Jonathan Newcomb (D’68), Chairman and<br />
Chief Executive Officer of <strong>Simon</strong> & <strong>Schuster</strong>, turned in his chair and looked out his office<br />
window in Rockefeller Center in New York City. Darkness was enveloping the nearby<br />
buildings and Newcomb was in a pensive mood.<br />
Newcomb realized that he would soon have to make major strategic decisions that would<br />
determine the future of <strong>Simon</strong> & <strong>Schuster</strong>. He thought about the company’s gilded past, the<br />
state of the industry and the radical changes that had made the future so uncertain.<br />
The Company<br />
<strong>Simon</strong> & <strong>Schuster</strong> (S&S) was one of the world’s preeminent publishers of consumer books<br />
in a wide variety of genres and formats. S&S was founded in 1924 by Richard <strong>Simon</strong> and<br />
Lincoln “Max” <strong>Schuster</strong>. They started the business with $5,000 (mostly borrowed) and their<br />
initial project was the first ever crossword puzzle book. The book became a runaway best<br />
seller and by the end of S&S’s first year of operations, the company had sold nearly one<br />
million books and generated profits of $100,000.<br />
From the 1930’s to the 1970’s, S&S grew to become one of the leading publishers in the US.<br />
It developed a reputation for innovation in the industry. In addition to the first crossword<br />
puzzle book, S&S was the first to apply mass market production and distribution techniques<br />
to books. It launched the US paperback revolution in 1939. S&S was also the first to offer<br />
retail booksellers the right to return unsold copies for credit.<br />
In 1976, S&S was sold to Gulf + Western. The parent company, through a succession of<br />
mergers and name changes, eventually became Paramount Communications. In the<br />
meantime, during the 1980’s and 90’s, S&S expanded by adding significant educational,<br />
professional and reference imprints. It acquired top brands such as Prentice-Hall, with its<br />
This case was prepared by Fred Wainwright (T'02) of the <strong>Tuck</strong> School of Business at <strong>Dartmouth</strong> under the<br />
supervision of Professor Richard A. D’Aveni. We thank Jonathan Newcomb and the staff at <strong>Simon</strong> & <strong>Schuster</strong><br />
for their valuable insights. The case was written as a basis for class discussion and not to illustrate effective or<br />
ineffective strategic management. The authors gratefully acknowledge the support of the Glassmeyer/McNamee<br />
Center for Digital Strategies, which funded the development of this case. CDS Case #01004. Version: April,<br />
2001.<br />
© 2001 Trustees of <strong>Dartmouth</strong> <strong>College</strong>. All rights reserved. For permission to reprint, contact the Center for<br />
Digital Strategies at 603-646-0899.
<strong>Simon</strong> & <strong>Schuster</strong><br />
no. 6-0004<br />
large international operations, and Macmillan, with its strong juvenile and computer book<br />
businesses. In 1994, S&S’s parent Paramount was acquired by Viacom, a diversified<br />
entertainment company.<br />
In 1997, Viacom made a strategic decision to focus on consumer entertainment and at the<br />
same time pay down debt. In a highly publicized auction process, Viacom unwound the S&S<br />
acquisitions of the previous years, selling off the education, professional, reference and<br />
international operations to Pearson plc, a UK-based media conglomerate, for $4.6 billion.<br />
Although S&S remained a global publishing powerhouse valued at over $600 million, S&S<br />
had returned to its origins, focusing exclusively on consumer books.<br />
Innovation remained a part of the S&S ethos. In March of 2000, S&S brought worldwide<br />
attention to the phenomenon of electronic publishing. Stephen King’s 66-page novella,<br />
Riding The Bullet, an original and exclusively electronic publication, was downloaded over<br />
400,000 times within 48 hours of its release.<br />
In 2001, S&S was a multi-faceted, multi-format global publishing company that generated<br />
over 2,100 titles per year. Over time, some of the S&S best selling authors and titles were:<br />
Stephen King – Dreamcatcher, Bag of Bones<br />
Frank McCourt – Angela’s Ashes, ‘Tis<br />
Ernest Hemingway – Snows of Kilimanjaro, A Farewell To Arms<br />
Mary Higgins Clark – You Belong To Me, All Through The Night<br />
Jackie Collins – Hollywood Wives, Dangerous Kiss<br />
Iyanla Vanzant – Yesterday I Cried, One Day My Soul Just Opened Up<br />
Marion Rombauer Becker, Ethan Becker and Irma Rombauer – Joy of Cooking<br />
Joseph Heller – Catch-22, God Knows<br />
Clive Cussler – Shockwave, Atlantis Found<br />
Michael Porter – Competitive Strategy, Competitive Advantage of Nations<br />
Richard Marcinko – Rogue Warrior, Leadership Secrets Of The Rogue Warrior<br />
David McCullough – Truman, John Adams<br />
Bob Woodward – All The President’s Men (with Carl Bernstein), Shadow<br />
Stephen Covey – Seven Habits of Highly Effective People, First Things First<br />
S&S was well known in the industry for the success of its fiction, historical non-fiction and<br />
political non-fiction authors. S&S also focused significant efforts in children’s publishing,<br />
audiobooks and interactive media products.<br />
<strong>Tuck</strong> School of Business at <strong>Dartmouth</strong>—Glassmeyer/McNamee Center for Digital Strategies 2
<strong>Simon</strong> & <strong>Schuster</strong><br />
no. 6-0004<br />
S&S’s parent, Viacom, owned cable network, television, motion pictures, video rental, radio,<br />
outdoor advertising, websites, and publishing companies. Some of Viacom’s best-known<br />
brands were: CBS, MTV, Nickelodeon, Showtime, Blockbuster Video, Comedy Central,<br />
UPN, Black Entertainment Television, Paramount Pictures, Paramount Parks and<br />
Marketwatch.com. S&S had developed joint publishing projects with Viacom’s Nick At<br />
Nite, Nickelodeon, MTV, Star Trek and other programs. Viacom revenues were $22.3<br />
billion in 1999 and $24.0 billion in 2000.<br />
An Industry of Multimedia Giants<br />
The multimedia industry, which included segments such as television, film and publishing,<br />
had been the fastest growing sector of the US economy for several years. From 1995 to<br />
1999, the industry grew at a 7.9% compounded rate, easily outpacing US GDP. 1 Factors that<br />
helped drive this growth included the development of the Internet medium, technology<br />
advancements, proactive government legislation, and increased media consumption. Exhibit<br />
1 shows various multimedia industry segments ranked by operating income margins and<br />
return on assets. Exhibit 2 demonstrates the growth in historical and projected consumer<br />
spending on entertainment media.<br />
Technological advances had helped companies offer customers more information and<br />
entertainment faster and cheaper. Broadcasting, cable and satellite, among others, were the<br />
beneficiaries of government legislation that encouraged consolidation. This led to bettermanaged<br />
and well-distributed products and services for consumers. US consumer ecommerce<br />
grew from $2 billion to $14 billion in 1999 and reached $45 billion in 2000. 2<br />
Internet dot coms were major buyers of advertising in traditional media in the late 1990’s.<br />
The above average growth of the multimedia industry led to intense competition and<br />
significant merger and acquisition activity among growing media giants. The ten largest<br />
publicly reporting media companies in the world accounted for approximately 39% of<br />
multimedia industry revenues in 1999. 3 The media giants included AOL/Time Warner,<br />
Bertelsmann, Pearson, Walt Disney, Viacom, NewsCorp and Vivendi Universal.<br />
Summarizing the media giants’ main strategies, Viacom was the No. 1 platform in the world<br />
for advertisers, while AOL/Time Warner was the world’s first Internet-powered media and<br />
communications conglomerate, and focused on building its already strong subscriptionbased<br />
revenues. NewsCorp was leveraging its technology (developing sophisticated delivery<br />
mechanisms such as satellite and digital) and Bertelsmann was vertically integrating its<br />
content (from printing operations to book clubs to Barnes&Noble.com). Pearson was<br />
growing fast and focusing on education and new media. Vivendi was transforming into a<br />
telecom and media colossus. Walt Disney was focusing on reviving its struggling film and<br />
entertainment divisions. Exhibit 3 shows detailed financial results for the largest media<br />
conglomerates. Appendix 1 describes the companies in further detail.<br />
1 Veronis Schuler Communications Industry Report, 2000.<br />
2 Veronis Suhler Communications Industry Report, 2000 and Jupiter Research.<br />
3 Veronis Suhler Communications Industry Report, 2000.<br />
<strong>Tuck</strong> School of Business at <strong>Dartmouth</strong>—Glassmeyer/McNamee Center for Digital Strategies 3
<strong>Simon</strong> & <strong>Schuster</strong><br />
Legions of Publishing Competitors<br />
no. 6-0004<br />
In contrast to the multimedia industry, book publishing was a highly fragmented but<br />
nevertheless consolidating business. The book publishing industry generated $24 billion in<br />
net sales in 1999 and $25.3 billion in 2000. 4 The Association of American Publishers<br />
categorized the publishing industry into consumer, professional, K-12 textbooks, college<br />
textbooks, university presses, standardized tests and subscription reference. Exhibits 4 and 5<br />
show the historical and projected growth of these book publishing sectors. In 1999,<br />
approximately 24% of consumer book sales were generated by the top 5 publishers. 5<br />
The consumer book publishing industry was sub-divided by the Association of American<br />
Publishers according to distribution methods. These categories were: trade books (sold via<br />
bookstores), religious books (sold through conferences and associations), mass market<br />
paperbacks (sold through discounters and grocery stores), book clubs (subscription-based),<br />
and mail order. Exhibit 6 demonstrates the segmentation of the industry by topics such as art,<br />
biography and science fiction. As a result of the sale of certain divisions to Pearson,<br />
Newcomb considered S&S to be among the purest of the trade publishers. Unlike its<br />
competitors, S&S did not publish reference, how-to or religious books, nor did it have book<br />
clubs. Instead it focused on producing high-quality fiction and non-fiction titles that were<br />
sold through retailers.<br />
S&S’s significant competition included Random House (Bertelsmann), Harper Collins<br />
(NewsCorp), Penguin Putnam (Pearson), Time Warner (AOL), Scholastic and Harlequin<br />
(Torstar). Appendix 2 lists several other publishers that Newcomb believed were not S&S’s<br />
most direct or pressing competitors. Exhibits 7, 8 and 9 rank consumer book publishers by<br />
sales, segments and bestsellers.<br />
Among the competitors, Random House was the largest and it was taking advantage of its<br />
size to derive economies of scale from its backoffice operations. Harper Collins was growing<br />
by acquisitions while reducing title output and headcount to increase its profitability.<br />
Penguin Putnam was also expanding through acquisitions. According to an industry<br />
executive, publishers were typically valued at a multiple of 1.0 to 1.2 times sales.<br />
Random House<br />
Random House was by far the largest consumer book publisher in the world and its books<br />
were sold in almost every country. Books published by Random House had won more major<br />
awards, including Nobel Prizes and Pulitzer Prizes, than those of any other publisher.<br />
Random House had more than double the number of bestsellers as its closest competitor. Its<br />
stable of superstar authors included John Grisham, Tom Brokaw, Frances Mayes and Jon<br />
Krakauer. Bertelsmann acquired Random House in 1998. Random House generated<br />
revenues of $1.7 billion in 1999, which represented approximately 13% of Bertelsmann’s<br />
total revenues.<br />
4 http://www.publishers.org/home/stats/index.htm<br />
5 Trade Book Publishing 2000, Simba Information, Inc.<br />
<strong>Tuck</strong> School of Business at <strong>Dartmouth</strong>—Glassmeyer/McNamee Center for Digital Strategies 4
<strong>Simon</strong> & <strong>Schuster</strong><br />
no. 6-0004<br />
Random House imprints included Bantam, Doubleday, Crown, Ballantine, Knopf, Fodor’s<br />
and Princeton Review. Bantam was the largest publisher of mass market paperback books in<br />
the United States. Joint ventures with Disney and Children’s Television Workshop had been<br />
structured to produce books based on Disney characters and movies made from successful<br />
Random House books.<br />
Harper Collins<br />
Harper Collins was owned by NewsCorp. Harper Collins was founded in 1817 by brothers<br />
James and John Harper. Harper Collins had significant interests in the US, Canada, UK and<br />
Australia. It published classic works by Mark Twain and Charles Dickens along with books<br />
written by modern authors such as Barbara Kingsolver, Isabel Allende and Sebastian Junger.<br />
Harper Collins broke through the billion dollar mark in sales for the first time in its fiscal<br />
year ended June 30, 2000. Revenues were up 35% to $1.03 billion and profits were up 85%<br />
to $89 million. In 1999, Harper Collins’ sales of $764 milllion were 6.6% of NewsCorp’s<br />
$11.5 billion in revenues. The president of Harper, Jane Friedman, indicated to reporters that<br />
the results were primarily from successful hits (57 titles on the bestseller lists in one year) as<br />
well as from fiscal responsibility. In addition, Harper had acquired Hearst’s book publishing<br />
group and several smaller publishers in 1998 and 1999. Friedman stated that Harper Collins<br />
would focus on publishing fewer titles more profitably.<br />
Penguin Putnam<br />
Penguin Putnam was owned by UK-based media giant Pearson, plc. The publishing giant<br />
was formed in 1997 when Pearson bought Putnam Berkley and merged it with its Penguin<br />
division. Penguin authors included Amy Tan, Tom Clancy, Dalai Lama, John Steinbeck,<br />
Patricia Cornwell and Nora Roberts. Book imprints included Viking, Dutton and Puffin.<br />
Penguin had 11 imprints dedicated to children. It had developed joint ventures with teenoriented<br />
Web sites to better understand that demographic segment, which had plenty of<br />
disposable cash but also had notoriously fickle and enigmatic tastes. Pearson acquired the<br />
textbook and educational divisions of S&S in 1998 as part of its strategy for expanding into<br />
learning and new media. In 1999, Penguin’s sales of $644 million represented 12.9% of<br />
Pearson’s $4.9 billion in revenues.<br />
Time Warner<br />
Time Warner intended to leverage its products after the January 2001 merger with AOL.<br />
Synergies were already being developed across all in-house brands, including the book<br />
publishing division. Authors included James Patterson, David Baldacci, Peter Jennings, Bill<br />
Gates, Jane Goodall and George Stephanopolous. The Time-Life series of books was wellknown<br />
by consumers. Time Warner had joint ventured with Bertelsmann to develop the<br />
largest book-of-the-month club in the industry. Time Warner generated consumer book<br />
revenues of $1.6 billion in 1999, however only a small portion was trade publishing, which<br />
competed directly with S&S through its Time Warner and Little Brown imprints. Consumer<br />
<strong>Tuck</strong> School of Business at <strong>Dartmouth</strong>—Glassmeyer/McNamee Center for Digital Strategies 5
<strong>Simon</strong> & <strong>Schuster</strong><br />
no. 6-0004<br />
book revenues were 17.3% of the parent company’s proforma revenues of $9.5 billion. In<br />
1999, Time Warner had 36 books in the New York Times bestseller list.<br />
Scholastic<br />
Scholastic was a global children's publishing and media company. Scholastic created quality<br />
educational and entertainment products for use in schools and homes, including children's<br />
books, textbooks, magazines, technology-based products, teacher materials, television<br />
programming, videos and toys. In June 2000, Scholastic acquired Grolier Incorporated, a<br />
leading operator of direct-to-home book clubs for children, and was the leading print and online<br />
publisher of children's non-fiction and reference products sold primarily to school<br />
libraries. In 1999, Scholastic’s consumer publishing revenues were $793 million,<br />
representing 68.7% of total company sales of $1.15 billion. For fiscal year 2000, Scholastic<br />
increased revenues to $1.4 billion.<br />
Harlequin<br />
Harlequin was owned by Canada-based Torstar. Torstar was a diversified media company<br />
with major holdings in newspapers, book publishing, continuing education, television and<br />
interactive media. Harlequin was founded in 1949 and sold mystery, Western and cookbook<br />
paperbacks. The company evolved and ultimately specialized exclusively in romance novels.<br />
Harlequin revenues in 1999 were $375 million, which were 36.6% of Torstar’s total<br />
revenues of $1 billion. In 2000, Harlequin sold 160 million books in 23 languages and 100<br />
countries.<br />
Newcomb thought about his key competitors and looked at a recent issue of Publishers<br />
Weekly magazine on his desk that described yet another newly formed online publisher.<br />
Consolidation at the top of the industry was accelerating while technology was fostering new<br />
entrants and changing the rules of the game. Newcomb wondered how S&S could best<br />
position itself to protect its core business while taking advantage of the recent trends.<br />
Something was bound to go wrong for the new entrants, the industry leaders or perhaps<br />
everyone in the industry.<br />
Product Mix<br />
Frontlist vs. Backlist<br />
Publishers spent significant time, labor and capital marketing new titles and authors. Those<br />
were known as “frontlist” issues. Some publishers were managing their portfolio of content<br />
in order to increase sales from “backlist” titles. Backlists were books that had been published<br />
in prior years and may have had multiple printings. Once publishers incurred the initial costs<br />
of editing, typesetting and marketing books, subsequent printings were highly profitable.<br />
<strong>Tuck</strong> School of Business at <strong>Dartmouth</strong>—Glassmeyer/McNamee Center for Digital Strategies 6
<strong>Simon</strong> & <strong>Schuster</strong><br />
no. 6-0004<br />
Traditionally, biography, children’s, reference and a small number of top-selling fiction<br />
books from authors such as Stephen King and John Grisham were good candidates for<br />
backlisting. Art and gardening titles also had good backlist potential, while business, health,<br />
“how-to” and mystery were considered to have medium backlist potential. Sports and travel<br />
titles tended to be more frontlisted. Further descriptions of segments are detailed in the next<br />
section.<br />
Publishers typically earned about 50% of revenues from backlists, but some publishers were<br />
slowly shifting their product mix to earn “annuity” type cash flows from backlisted,<br />
consistent winners. Publishers that focused primarily on children’s books, for example,<br />
earned higher than average revenues from backlists. Backlist books also offered increased<br />
sales potential from international markets, where reputable authors had a better chance of<br />
selling books than unknown authors.<br />
Avery, a publisher of health, nutrition and cooking paperbacks, structured its portfolio of<br />
authors and titles to generate 85% of its income from backlist. This accomplishment made a<br />
strong impression at Penguin Putnam, which acquired Avery in September of 2000.<br />
The development of superstores and online stores was a boost for backlists, since more shelf<br />
space was available for displaying classic titles and powerful search engines allowed<br />
customers to research titles without being overly influenced by new book promotions.<br />
S&S generated less than 50% of its revenues from backlists because of its traditional<br />
strength in launching new titles. This strength was demonstrated by the 8.1% increase in its<br />
revenues from 1998 to 1999, which was primarily due to eight newly published blockbusters<br />
written by Stephen King, Mary Higgins Clark and Frank McCourt. Three blockbusters per<br />
year were the norm for S&S.<br />
Retail booksellers thrived on backlists but they used discounted frontlist books to drive<br />
traffic into stores. Once customers were in stores there was a higher likelihood that they<br />
would make impulse buys. Over 60% of bookstore earnings were from backlisted books.<br />
Many Market Segments<br />
According to a 1999 report by the Book Industry Study Group, popular fiction represented<br />
53% of adult consumer book purchasing, followed by cooking/crafts (10%), religion (9%)<br />
and general non-fiction (8%). Simba Information, an industry data provider, estimated that<br />
popular fiction books represented 25% of the New York Times bestseller list and that S&S<br />
was ranked in the top 3 publishers of bestsellers. Newcomb knew that S&S had developed<br />
an enviable reputation in the industry for its fiction as well as its historical and political nonfiction<br />
titles.<br />
According to Simba Information, among topic segments in 1999, S&S was strong relative to<br />
its competitors in biographies, self-help, science fiction, and cookbooks. S&S was the<br />
second largest publisher by sales in each of those segments. For 1999, S&S was also in the<br />
top 5 sales ranking in the children’s, business, how-to, and mystery segments. Exhibit 10<br />
<strong>Tuck</strong> School of Business at <strong>Dartmouth</strong>—Glassmeyer/McNamee Center for Digital Strategies 7
<strong>Simon</strong> & <strong>Schuster</strong><br />
no. 6-0004<br />
shows S&S revenues by segment, according to Simba Information. The following segment<br />
descriptions are based on information in Trade Book Publishing 2000 by Simba Information.<br />
Biography. Publisher revenues from biographies grew modestly, rising about 8% for the<br />
period from 1995 to 1999. While fewer titles were released in 1999, 45 titles reached the<br />
New York Times bestseller list compared to 40 in 1997. Consumer-oriented biographies from<br />
personalities such as Nelson Mandela, George Bush, Princes Diana, and Michael Jordan<br />
became more popular. Random House was the leader in this segment in 1999, followed by<br />
S&S and Harper Collins.<br />
Self-Help. The market for self-help books was strong in the early 1990’s but soon suffered<br />
from a glut of titles. While the segment had growth of 27% from 1995 to 1999, it grew only<br />
4% from 1998 to 1999. Of the 51 titles in the 1999 New York Times miscellaneous<br />
bestseller list, 11 were from the wildly popular “Chicken Soup For The Soul” series. More<br />
than 50 million copies had been sold and the series helped propel Health Communications to<br />
the top of the self-help publishers ranking. S&S and Random House were also leaders in this<br />
segment. Self-help titles were considered of medium potential for backlisting.<br />
Science Fiction. Science fiction books had continuously lost market share for the previous<br />
five years. The segment had grown less than 1% from 1998 to 1999. S&S focused on the<br />
mass market format for sci-fi titles in 1999 and one of the cornerstones of its program was<br />
the Star Trek series. Sci-fi tended to have more frontlist titles. Random House and Torstar<br />
were other top publishers in the segment.<br />
Cookbooks. Cookbooks benefited from the growth of beginner-level buyers and customers<br />
that considered cooking a hobby. The segment was composed primarily of backlist titles,<br />
although new ethnic and specialty titles were also successful. S&S benefited from continuing<br />
sales of classics like Joy of Cooking. Random House and Time Warner also led in this<br />
category in 1999.<br />
Children’s. The children’s book segment had been the fastest growing in 1999 (15%) and<br />
was expected to continue to grow at above-industry rates. Random House, Penguin Putnam<br />
and S&S were the top publishers in the category. Scholastic had been the beneficiary of the<br />
Harry Potter craze, which not only generated millions in sales but also raised broad-based<br />
awareness of the entire children’s book market.<br />
Computer. Though computer books had been one of the fastest growing categories (60%<br />
from 1995 to 1999), no titles had appeared on the New York Times bestseller lists. The<br />
segment had low backlist potential compared to other segments. The top publisher in 1999<br />
was Pearson PTG, a recently formed unit of the Pearson conglomerate. Pearson PTG united<br />
computer book publishing divisions of Macmillan and Prentice Hall (acquired from S&S),<br />
Addison Wesley and others. Hungry Minds/IDG was the second largest publisher with its<br />
“For Dummies” titles.<br />
Romance. Since the mid-1990’s, romance books had been generating over $1 billion a year<br />
in sales. Revenues grew at 23% from 1995 to 1999. The Romance Writers Association<br />
estimated that over 18% of the reading age population had read at least one romance novel a<br />
<strong>Tuck</strong> School of Business at <strong>Dartmouth</strong>—Glassmeyer/McNamee Center for Digital Strategies 8
<strong>Simon</strong> & <strong>Schuster</strong><br />
no. 6-0004<br />
year. Publishers were expanding the market, with sub-themes such as Westerns and science<br />
fiction. Titles tended to have low potential for backlist compared to other segments.<br />
Harlequin, owned by Torstar, dominated the segment, followed by Random House and<br />
Penguin Putnam.<br />
Religion. Increasingly, religious books were finding their way onto bestseller lists and into<br />
the hands of readers who previously would not have picked up a religious title. The segment<br />
grew 16% from 1995 to 1999. This segment had medium potential for backlisting.<br />
Publishers had been turning away from straight-forward religious non-fiction and toward<br />
inspirational topics. The top publishers were Thomas Nelson, Harper Collins and Tyndale.<br />
Audiobooks. The audiobooks market had grown significantly during the previous five years.<br />
Sales had increased over 50% from 1996 to 1999. Top publishers, of which S&S was one,<br />
saw sales increase by an average of about 10% from 1998 to 1999. Exhibit 11 shows details<br />
of the audiobook segment.<br />
Exports. International markets offered many opportunities. As English became the lingua<br />
franca of the world, demand for US, Canadian, UK and Australian titles increased. Also, as<br />
world literacy rose, sales of translations of works by English-speaking authors increased.<br />
Exhibit 12 shows the growth of book exports from 1998 to 1999. Canada, Australia, Japan,<br />
Mexico and the Netherlands seemed to offer large markets with the best growth<br />
opportunities.<br />
Granular Business<br />
As Newcomb liked to say, publishing was a “granular business” with thousands of<br />
individual products and transactions. Regardless of segment, topic, format or language, each<br />
book was a unique product. Each product required its own unique contractual arrangements,<br />
editing, production, marketing campaigns as well as tracking and accounting of royalties and<br />
other intellectual property such as subsidiary and foreign rights. Thousands of titles and<br />
millions of books had to be tracked from production, through multiple levels of distribution<br />
and at retailers warehouses and stores. S&S itself had over 1 million square feet of<br />
warehouse space. As Newcomb also liked to say, that was “enough room to fit a bunch of<br />
747s.”<br />
Like other major publishers, S&S understood how to negotiate the various rights associated<br />
with a single title, those for hardbacks, softcovers, mass market paperbacks, audiobooks,<br />
international rights and digital rights. Along with its competition, S&S had made significant<br />
investments in accounting systems that handled complex royalty payments from thousands<br />
of sales.<br />
As S&S’s largest competitors continually leveraged the backoffice efficiencies and<br />
technological platforms of their corporate parents, they were able to generate greater margins<br />
and higher profitability. Publishers with many international offices could more easily build<br />
global demand for their products.<br />
<strong>Tuck</strong> School of Business at <strong>Dartmouth</strong>—Glassmeyer/McNamee Center for Digital Strategies 9
<strong>Simon</strong> & <strong>Schuster</strong><br />
no. 6-0004<br />
Publishers had mastered the management of hundreds of thousands of inventory units. They<br />
had spent substantial capital in infrastructure buildup. In effect, volume became a key driver<br />
to profitability because of high technology costs and other fixed overhead. Newcomb<br />
wondered if product mix and inventory management skills were enough for S&S to survive<br />
and thrive in the new millennium.<br />
Margin Pressures<br />
Revenue Decline<br />
S&S’s net sales in fiscal year 2000 were $596 million, a decrease of 2.3% from 1999.<br />
Earnings before interest, taxes, depreciation and amortization were $71.3 million, a decrease<br />
of 3.6% versus the previous year. 6 2000 was the first down year for S&S since Newcomb<br />
had joined the company in the early 1990’s and Newcomb was not pleased. At least S&S<br />
had outperformed the trade book industry, whose net sales had decreased 3.7% that year.<br />
A Challenging Cost Structure<br />
Exhibit 13 shows the typical P&L for the publishing industry and indicates the largest<br />
expenses. Exhibit 14 shows the profitability of several publishers in 1998 and 1999. The<br />
typical P&L shows net sales, thus it does not indicate the adjustment to gross sales: books<br />
returned by retailers. Books returned were the bane of the publishing industry. Ironically, as<br />
mentioned earlier, S&S was the first to offer this service to retailers as a way to generate<br />
more business. Over time, books returned became a stubborn and serious problem for the<br />
industry and, by 1999, represented 25% to 30% of gross sales in most categories of books.<br />
Due to complex agreements with retailers, publishers had to extend their accounts<br />
receivable, often for over 90 days.<br />
Newcomb knew that new technologies, such as on-demand printing, would begin to have a<br />
positive impact on publishers margins in three to five years. Books returned would be<br />
reduced, customers would have access to books wherever digital printing presses and in-line<br />
binding machines were located. These presses and binding machines would be connected as<br />
a miniature manufacturing system to produce books in limited numbers, thus avoiding waste.<br />
Because of the current high expense of setting up short-run digital printing and binding<br />
machines, the Wal-Marts and Barnes & Nobles of the world would rely on their traditional<br />
warehousing and distribution systems for the time being. Newcomb was concerned about<br />
how and where to squeeze down costs in the interim.<br />
The $4.6 billion price for which Viacom had sold the non-consumer operations of S&S to<br />
Pearson was a sum that many in the industry considered outstanding by any measure. As part<br />
of the sale agreement, S&S’s accounting, order processing, royalty tracking, customer<br />
service, and inventory management systems were transferred to Pearson and supplied under<br />
contract back to S&S for a set fee. S&S retained ownership of its substantial warehouse<br />
6 Publishers Weekly, February 19, 2001, p. 14.<br />
<strong>Tuck</strong> School of Business at <strong>Dartmouth</strong>—Glassmeyer/McNamee Center for Digital Strategies 10
<strong>Simon</strong> & <strong>Schuster</strong><br />
no. 6-0004<br />
facilities. The contractual agreement limited S&S from taking advantage of economies of<br />
scale and technology developments to reduce costs.<br />
Searching for Better Margins<br />
Reference and professional books, where S&S was no longer strong, tended to have higher<br />
margins than consumer books. Reference and professional customers typically had a higher<br />
need for specific information and were therefore less price sensitive. In addition, publishers<br />
could easily reorganize chapters, concepts and data into multiple formats and publications in<br />
order to generate several revenue streams from the same information. These book categories<br />
were likely to be the initial beneficiaries of in-line printing and binding.<br />
The sale of S&S’s education and professional businesses to Pearson was clearly a financial<br />
triumph. Yet Newcomb wondered what would have been possible if S&S still had its<br />
backoffice systems and its variety of businesses, some of which were better positioned to<br />
take advantage of technological change.<br />
Authors and Agents: The Rights Issues<br />
Newcomb had often been quoted as saying “Publishers are the merchant bankers of the<br />
intellectual property market.” S&S invested in numerous titles much as a venture capitalist<br />
would invest in many startups, hoping that one or two would be big hits.<br />
S&S received thousands of unsolicited manuscripts per year but worked almost exclusively<br />
through agents, since agents served as an effective screening mechanism. Once a book was<br />
deemed worthy of publishing, the rights to the work were negotiated, usually through agents.<br />
New authors typically earned 5% to 15% royalties on book sales, and agents received their<br />
fees from the authors’ royalties. Bestselling authors received significant advances, often in<br />
the millions of dollars, and negotiated higher royalty percentages. Authors were typically<br />
loyal to their agents and publishers, especially to editors, although occasionally authors<br />
would make changes. They also were sometimes able to keep the movie rights to a book and<br />
sell them to studios in a separate transaction from the book publishing rights. Publishers took<br />
significant risks by paying authors’ advances and spending global production and marketing<br />
efforts on titles without being able to fully predict their relative success. Copyrights typically<br />
lasted for the authors’ lifetime plus seventy years and thereafter works became public<br />
domain.<br />
There were thousands of literary agents. Some of the best known included ICM, William<br />
Morris Agency and Wylie Agency. William Morris represented more than thirty New York<br />
Times bestselling authors as well as winners of the Pulitzer Prize, the National Book Award<br />
and the National Medal of Literature. In the past year, the agency had made more than sixty<br />
book-to-screen sales and numerous of its authors had seen their work translated into $100<br />
million plus blockbuster movies. Multi-book deals for superstar authors were common,<br />
though authors rarely committed to exclusivity with one publisher.<br />
<strong>Tuck</strong> School of Business at <strong>Dartmouth</strong>—Glassmeyer/McNamee Center for Digital Strategies 11
<strong>Simon</strong> & <strong>Schuster</strong><br />
no. 6-0004<br />
Traditionally, rights were negotiated between agents and publishers in person or by phone.<br />
For example, publishers would be involved in telephone auctions whereby they would have<br />
to call in their bids every half hour until a winner was announced. Rightscenter.com had<br />
emerged as the leading worldwide online marketplace where agents, sub-agents, scouts,<br />
editors and publishers review and negotiate publications, film, software and multimedia<br />
works. For the publishing industry, users could securely read manuscripts and negotiate<br />
multiparty transactions online. The site eliminated the need to print and mail manuscripts<br />
and catalogs. Rightscenter had over 8,000 members and over 30,000 titles.<br />
A literary agent from the LitWest Group in Palo Alto, California had recently closed a sixfigure<br />
deal using the Rightscenter auction process. She auctioned the book rights for Fast<br />
Alliances, a groundbreaking book on Internet alliances by a relatively unknown author.<br />
Using the site, the agent made her submissions privately to eleven major book publishers<br />
nationwide, and within two weeks, reached an agreement with John Wiley & Sons. Using<br />
the traditional publishing route and mailing the proposals would have added at least two<br />
months to the process.<br />
In January 2000, Harper Collins became the first major publisher to enter into a<br />
comprehensive global agreement with Rightscenter. Harper Collins agreed to list a minimum<br />
of 500 adult and children’s frontlist and backlist titles on the Rightscenter system in 2001.<br />
Through Rightscenter, Harper Collins would be able to extend its reach into foreign markets,<br />
increase exposure to backlist titles and create new opportunities for authors while lowering<br />
its backoffice expenses.<br />
Electronic rights became an important issue as new reports from research firms showed the<br />
potential impact of technology in the publishing industry. Forrester Research estimated that<br />
revenues from digitized book publishing would rise from an estimated $838 million in 2001<br />
to $7.8 billion in 2005. 7<br />
Random House filed suit against Rosetta Books in March of 2001 for illegally selling<br />
electronic versions of books by Random House authors. 8 The suit was at the heart of a longsimmering<br />
battle between publishers and authors over the rights of publishers to issue<br />
electronic versions of already published titles. Authors argued that electronic rights have to<br />
be specified in contracts, much like foreign publishing rights. Many publishers had contracts<br />
with authors that dated back to the times when computers were barely invented, leaving<br />
contract wording such as “forms of books” and “style and manner” subject to interpretation.<br />
RosettaBooks had signed agreements with about 100 authors and offered about 40 titles.<br />
Previously, in late 2000, Random House had raised its royalties to authors of e-books from<br />
15% of retail price to approximately 25% in order to avoid losing authors to upstart Web<br />
publishers,. 9 The company had chosen to incur the expenses of digitizing its backlist of titles<br />
and making them available electronically.<br />
7 http://www.inside.com/jcs/Story?article_id=23078&pod_id=8<br />
8 The Wall Street Journal, February 28, 2001.<br />
9 The Wall Street Journal, November 8, 2000.<br />
<strong>Tuck</strong> School of Business at <strong>Dartmouth</strong>—Glassmeyer/McNamee Center for Digital Strategies 12
<strong>Simon</strong> & <strong>Schuster</strong><br />
Newcomb knew that rights were increasingly being sliced into thinner and more discrete<br />
components, each of which would have to be negotiated carefully to avoid any<br />
disagreements.<br />
Wholesalers and Retailers: Getting in the Game<br />
no. 6-0004<br />
Wholesalers Evolve with the Times<br />
Ingram Book Company was the leading wholesaler of books, audiobooks and magazines,<br />
with over 50% of those markets in 1999. It had more than 32,000 retail accounts, carried<br />
over 15,000 publisher imprints, had an inventory of 500,000 titles and distributed over 175<br />
million units per year. Ingram also offered a package of digital fulfillment services to the<br />
book industry, including print-on-demand and e-book distribution.<br />
Baker & Taylor was a leading distributor of books, videos and music products to Internet<br />
and traditional retailers and to libraries in 2001. The company shipped over 1 million ISBNs<br />
(SKUs) per year. Baker & Taylor offered print-on-demand services via Replica Books.<br />
Replica Books worked directly with authors and publishers to keep their books in print. Each<br />
title was maintained in an electronic database, and the books were printed on a high-speed<br />
printer and individually bound in paperback or hardcover.<br />
Publishers Group West was the largest wholesale distributor for independent publishers in<br />
North America in 2001. It distributed books in categories such as health, travel, business,<br />
children’s, music, among others. Over 90% of Publishers Group West billings were<br />
generated from its top 50 clients. In 1999, PGW established e-book, CD-ROM and academic<br />
book distribution subsidiaries and in 2000 it began expanding into Europe. PGW had an inhouse<br />
fund which invested in publishing companies and publisher’s projects. Three recent<br />
investments of the fund were combined into Avalon Travel Publishing, which had become a<br />
subsidiary of PGW. Exhibit 15 shows unit sales and revenues in the wholesale book<br />
industry.<br />
Superstores and Internet Retailers Take Charge<br />
Amazon.com was the largest online bookseller in the world and was also the most<br />
recognized e-commerce brand. It was started in 1995 and by early 2001 had 29 million<br />
customers from 160 countries. In 1999, online sales of books accounted for only 4.4% of the<br />
market, while traditional large chain bookstores accounted for 24.6%. Although the<br />
combination of online prices and shipping costs resulted in no savings for buyers in<br />
comparison to bookstore prices, for the fiscal year ended in December of 2000, Amazon’s<br />
revenues increased 68% to $2.76 billion. Net losses for the period increased 96% to $1.41<br />
billion.<br />
In 2000, Amazon opened its e-book store offering over 1,000 for-charge and free titles as<br />
well as downloadable audiobooks. Amazon also had expanded from books into music, video,<br />
software, electronics, toys, cars, auctions and other consumer products. The book division<br />
<strong>Tuck</strong> School of Business at <strong>Dartmouth</strong>—Glassmeyer/McNamee Center for Digital Strategies 13
<strong>Simon</strong> & <strong>Schuster</strong><br />
no. 6-0004<br />
accounted for less than half of all sales, though it was still far larger than its closest online<br />
competitor Barnes&Noble.com. By February of 2001, Amazon had cut about 15% of its<br />
workforce in order to attempt to achieve profitability. 10<br />
Barnes & Noble had the largest chain of bookstores in the world and the second largest<br />
online bookselling operation. In 2000, over 85% of Barnes & Noble sales came from its<br />
superstores. Superstores had progressively accounted for a larger portion of the company’s<br />
total sales. Barnes & Noble had 26% of sales in the bookstore market in 1999. For its fiscal<br />
year 2000, Barnes & Noble had $3.4 billion in sales and net income of $124.5 million.<br />
Barnes & Noble spun off its Internet operation, Barnes&Noble.com in 1999, selling a 40%<br />
share to Bertelsmann and taking 20% public. In 2000, Barnes & Noble purchased<br />
Fatbrain.com, an online bookseller specializing in professional and technical titles for<br />
corporate users. Barnes&Noble.com expanded into textbooks, music, software, magazine<br />
subscriptions, online courses and several digital initiatives but continued to generate losses<br />
for its owners.<br />
In 1998, Barnes & Noble’s proposed acquisition of the nation’s largest wholesaler<br />
distributor, Ingram Book Group, was blocked by the Federal Trade Commission.<br />
Independent booksellers were critical of the potentially unfair competitive advantage Barnes<br />
& Noble would have had after the purchase.<br />
Barnes & Noble had purchased publishing and distribution rights to over 2,000 titles. It had<br />
been publishing public domain classics, whose copyrights had expired, under its own brand.<br />
To Newcomb, retailers and wholesalers that started their own publishing divisions were<br />
“nibbling around the edges.” He did not consider them major threats.<br />
Borders Group was the second-largest operator of book superstores and the largest operator<br />
of mall-based bookstores in the world based on both sales and number of stores. As of<br />
December 2000, the Company operated more than 335 superstores primarily under the<br />
Borders name and also under the Waldenbooks and Books, etc. names. For the fiscal year<br />
ended 2001, Borders had generated $3.2 billion in sales and net income of $43.6 million.<br />
Books-A-Million was started by a 14-year old who opened a small newsstand in Alabama in<br />
1917. In 2001, the company was the third largest book retailer in the US and owned 182<br />
stores in 17 states, mostly in the Southeast. Of those stores, 135 were superstores that<br />
generated over 75% of revenues. Books-A-Million also had book wholesale and distribution<br />
subsidiaries, American Wholesale Book Company and Book$mart. Books-A-Million had an<br />
exclusive agreement to distribute books to Wal-Mart. BAM’s subsidiaries were providing<br />
fulfillment services for various online retailers. BAM had recently agreed to acquire the<br />
assets of 19 of the bookstores of defunct Crown Books. Crown Books had declared<br />
bankruptcy twice in three years by 2001. Exhibit 16 has an analysis of the retail book<br />
industry.<br />
10 Publishers Weekly, February 5, 2001, p. 9.<br />
<strong>Tuck</strong> School of Business at <strong>Dartmouth</strong>—Glassmeyer/McNamee Center for Digital Strategies 14
<strong>Simon</strong> & <strong>Schuster</strong><br />
no. 6-0004<br />
Independent bookstores had a 33% share of the book market in 1991. 11 By 1999, their share<br />
had shrunk to 15% as they lost customers to malls, superstores and the Internet. However,<br />
their share held steady in 2000 due to BookSense, a coordinated marketing campaign of over<br />
1,200 independent stores which developed a bimonthly list of 76 of the best books in<br />
numerous categories.<br />
The Electronic Rollercoaster<br />
Electronic Publishing – Operations and Distribution<br />
Printing presses were invented over 500 years ago. The process of publishing books on paper<br />
remained essentially unchanged from that time until the late 1990’s. By 2000, Xerox and 3M<br />
had already developed an experimental thin, flexible and reusable film that displayed<br />
electronic text. The physical and virtual worlds were melding and book publishers were<br />
being forced from snail’s pace developments to riding high-speed technology rollercoasters<br />
in virtual darkness.<br />
Two stories about S&S’s high-profile, exclusively electronic publishing of Stephen King’s<br />
Riding the Bullet said much about the industry. First, the entire process of editing, proofing,<br />
cover design and marketing took two weeks from the time Stephen King delivered the<br />
manuscript. This was a publishing miracle, considering that most books had a gestation cycle<br />
of 9 to 12 months. Second, according to industry publications, less than 20% of the 600,000<br />
people that downloaded Riding the Bullet ever finished reading it.<br />
Companies such as Random House had been making substantial investments in enterprise<br />
resource planning (ERP) software during the late 1990’s to globally integrate their<br />
backoffice systems. By 2001, most large publishers had ERP in place and practically every<br />
publisher had its own website.<br />
S&S’s site offered a number of features to attract readers, including excerpts of new<br />
releases, discussion boards, chat rooms, contests and unique information about bestselling<br />
authors. The site also served book retailers and wholesalers and S&S forwarded leads from<br />
interested book buyers to Amazon. Sites offered the potential for publishers to better<br />
understand the book-buying public. This was a marked improvement for publishers that<br />
traditionally did not know their customers at all because of retailers and wholesalers did not<br />
share data about sales patterns and customer behavior with publishers. Registrations and chat<br />
rooms offered significant information about demographics and preferences of book buyers.<br />
Many startups were launched with the intent of revolutionizing one or more aspects of the<br />
publishing industry. For further details of the effects of technology on the industry, see<br />
Appendix 3. Figure 1 shows changes in the traditional book industry supply chain.<br />
11 http://www.nytimes.com/2001/03/19/business/19INDY.html<br />
<strong>Tuck</strong> School of Business at <strong>Dartmouth</strong>—Glassmeyer/McNamee Center for Digital Strategies 15
<strong>Simon</strong> & <strong>Schuster</strong><br />
no. 6-0004<br />
Figure 1: Examples of Changes in the Traditional Book Publishing Supply Chain<br />
Publishers Group West Forms Avalon Travel Publishing<br />
<strong>Tuck</strong> School of Business at <strong>Dartmouth</strong>—Glassmeyer/McNamee Center for Digital Strategies 16
<strong>Simon</strong> & <strong>Schuster</strong><br />
no. 6-0004<br />
In July of 2000, S&S agreed to a long-term strategic alliance with Lightning Source, a digital<br />
fulfillment service owned by Ingram Book Company. At that time, S&S had the largest<br />
collection of e-book titles of any major trade publisher. Lightning Source’s range of services<br />
to over 700 publishers around the world included digital file conversion, digital rights<br />
management, e-book delivery to various devices and on-demand printing.<br />
The Unrealized Promise of E-Products<br />
While technology offered the potential to radically change the experience of readers by<br />
adding multimedia capabilities, the promise of broad customer acceptance of e-products<br />
remained tantalizingly elusive. Estimates of e-book sales by reputable research firms varied<br />
widely, leading to a lack of certainty about the timeline and growth of the trend.<br />
Arguably one of the top three literary agents in the world, Andrew Wylie was quoted in<br />
Financial Times as saying “You might as well forget about the trade publishing e-book<br />
market for the time being. It is not a strong business.” 12 He based his statement on the sales<br />
results of a novella from one of his author-clients. The e-book rights sold for $80,000 and<br />
the publisher sold only sixteen copies.<br />
John Feldcamp, the co-founder of online publisher Xlibris, saw only problems. “No one has<br />
figured out a good way to distribute e-books or even what to charge,” he said. He added:<br />
“Do e-books ultimately win? Yes, absolutely. Do they win this year (2000) or next year? No.<br />
This isn’t even slightly cooked yet.” 13 Xlibris allowed authors to retain all publishing rights,<br />
paid 50% royalties, and had systems to convert manuscripts into hardback books, paperbacks<br />
and e-books within a few weeks. Random House Ventures, the investment subsidiary of<br />
Random House, made a significant minority investment in Xlibris. In essence, e-books<br />
eliminated printing costs and lowered retail prices, but the real battle was for consumer’s<br />
time.<br />
Websites and data management tools allowed publishers to better understand the<br />
characteristics and habits of book buyers. Figure 2 shows a stylized analysis of book<br />
substitutes. Note that compared to substitutes such as TV and newspapers, books had a<br />
distinct disadvantage as a medium for advertising.<br />
12 Financial Times, March 20, 2001.<br />
13 The Wall Street Journal, October 2, 2000.<br />
<strong>Tuck</strong> School of Business at <strong>Dartmouth</strong>—Glassmeyer/McNamee Center for Digital Strategies 17
<strong>Simon</strong> & <strong>Schuster</strong><br />
Figure 2: Stylized Analysis of Book Substitutes, Price vs. Depth of Material<br />
Depth of<br />
Material<br />
TV &<br />
Radio<br />
E-Books<br />
Movies<br />
Magazines<br />
Newspapers<br />
Music<br />
Specialty<br />
Websites<br />
Paperback<br />
Books<br />
Home<br />
Videos<br />
Educational<br />
Videos<br />
Hardcover<br />
Books<br />
no. 6-0004<br />
Annualized<br />
Cost ($)<br />
Basic<br />
Cable<br />
Reference<br />
Books<br />
<strong>Tuck</strong> School of Business at <strong>Dartmouth</strong>—Glassmeyer/McNamee Center for Digital Strategies 18
<strong>Simon</strong> & <strong>Schuster</strong><br />
no. 6-0004<br />
Random House chairman, Peter Olson, had stated that despite electronic publishing<br />
initiatives, traditional publishing would remain the foundation as well as the main engine for<br />
growth. 14 Newcomb had the same opinion, the Internet was a powerful ally and print-ondemand<br />
would eventually be impactful, but e-books were not the immediate future of S&S.<br />
A Hard Look in the Mirror<br />
Newcomb assessed the powerful forces affecting the publishing industry. He evaluated his<br />
alternatives and thought about the costs, benefits and ramifications of each choice. First,<br />
S&S could develop value-added products and services to its customers, diversifying from<br />
books into distribution services for retailers, data services or magazine publishing. Second,<br />
S&S could launch into the future by focusing all its efforts on accelerating the adoption of<br />
on-demand printing and in-line binding while developing more robust revenue models for ecommerce<br />
and e-books. Third, S&S could stay the course, grow organically and become<br />
more customer-centric, providing more books on subjects selected through reader surveys<br />
and market research. Fourth, S&S could even choose to eliminate certain imprints and<br />
narrow the scope of its publications to higher growth and higher margin segments. Lastly,<br />
there was the divestiture option. S&S could become a part of another company with major<br />
strategic interests in consumer publishing, but this would require a strategy to maximize the<br />
valuation of S&S.<br />
Newcomb took a deep breath. He knew that Viacom would not give him the funds to do all<br />
he wanted, so he would have to prioritize his projects. The Viacom management, the<br />
shareholders and the S&S employees were counting on him to use his best judgement. He<br />
felt the weight of his responsibility to make the right decision.<br />
14 Publishers Weekly, July 3, 2000, p. 10.<br />
<strong>Tuck</strong> School of Business at <strong>Dartmouth</strong>—Glassmeyer/McNamee Center for Digital Strategies 19
<strong>Simon</strong> & <strong>Schuster</strong><br />
Case Questions<br />
no. 6-0004<br />
Use the extensive data provided in the exhibits as you evaluate your answers to the following<br />
questions:<br />
1. Analyze the traditional paper-based book publishing industry using the Five Forces<br />
model. Based on your analysis, what should Jon Newcomb do?<br />
2. How does your Five Forces analysis change if you include the effects of recent and<br />
upcoming technological changes in the industry? Is S&S destined to be<br />
disintermediated? What could Newcomb do to leverage these technological changes into<br />
greater profitability?<br />
3. How do you view the five strategic alternatives that Newcomb is considering? How<br />
would you carry them out? What would you do?<br />
<strong>Tuck</strong> School of Business at <strong>Dartmouth</strong>—Glassmeyer/McNamee Center for Digital Strategies 20
<strong>Simon</strong> & <strong>Schuster</strong><br />
Appendix 1: Multimedia Company Descriptions<br />
no. 6-0004<br />
AOL Time Warner was one of the largest content owners and distributors in the world. It<br />
operated in six businesses: interactive services (AOL), networks (Turner Broadcasting,<br />
HBO), publishing (Time, Inc., Time Warner Publishing), film (Warner Brothers, New Line<br />
Cinema), music (Warner Music Group) and cable (Time Warner Cable). AOL-Time<br />
Warner’s core growth drivers were subscriptions, advertising and content. The integration of<br />
AOL and Time Warner was focusing on cross-selling opportunities and leveraging multiple<br />
brand synergies. Time Warner had already generated over 800,000 new subscriptions from<br />
AOL’s 27 million subscribers. Conversely, promotions in Time Warner magazines had<br />
become one of AOL’s top 10 sources of new members. On a pro forma basis, the combined<br />
AOL Time Warner companies generated $9.5 billion in revenues in 1999 and over $10<br />
billion in 2000.<br />
Bertelsmann was a privately held, Germany-based media conglomerate. Its publishing<br />
empire spanned the globe with book, book club, printing, magazine, television, film, radio,<br />
music, professional information and Internet subsidiaries. As of the end of Bertelsmann’s<br />
fiscal year in June 30, 2000, sales were up 23% to $15.4 billion, due primarily to growth in<br />
book and music operations as well as consolidation of TV and film divisions. CEO Thomas<br />
Middelhoff’s edict to his managers was to be number 1 or 2 in their markets.<br />
Bertelsmann had $7 billion in cash after selling a stake in AOL and planned to continue a<br />
string of acquisitions of key media properties. Bertelsmann made a $60 million investment<br />
in Napster in 2000 to leverage the peer-to-peer site’s more than 50 million users. It also<br />
owned part of Barnes&Noble.com. Over 25% of Bertelsmann’s revenues were derived from<br />
book operations.<br />
Pearson, plc was a global media company based in the UK with key operations in education,<br />
business information, consumer publishing and television markets. Pearson was the world’s<br />
largest textbook publisher, with Prentice Hall, Addison Wesley and other first-class imprints.<br />
It also owned Penguin, Putnam and other consumer book imprints; the Financial Times<br />
international newspaper; and part of RTL European radio and television broadcasting.<br />
Pearson’s sales were over $5.9 billion in 2000.<br />
NewsCorp was an Australia-based international communications company. It produced and<br />
distributed movies and television programs; published newspapers, magazines and books;<br />
developed digital broadcasting; produced advertising services; developed subscriber<br />
management systems; and created and distributed online programming. NewsCorp owned<br />
the Fox network of film and television companies, Harper Collins book publishers, the Los<br />
Angeles Dodgers, the New York Post, BskyB broadcasting service, and STAR TV satellite<br />
service in Asia, among others. For the fiscal year 2000, NewsCorp generated over $11<br />
billion in sales.<br />
Vivendi Universal was for many years a slow-growth French utility and real estate company.<br />
Through acquisitions it evolved into the second largest media and entertainment company in<br />
the world. Vivendi’s strategy was to become the world’s preferred creator and provider of<br />
<strong>Tuck</strong> School of Business at <strong>Dartmouth</strong>—Glassmeyer/McNamee Center for Digital Strategies 21
<strong>Simon</strong> & <strong>Schuster</strong><br />
no. 6-0004<br />
digital content, entertainment and services. Vivendi had recently merged with Seagram,<br />
which gave it ownership of Universal Studios’ movies, TV shows, music labels and theme<br />
parks. Vivendi sold off the Seagram liquor operations.<br />
Vivendi covered the entire value chain from content creation to aggregation to distribution.<br />
Its publishing division included literature, health, education, games and information<br />
delivered via books, websites, Wide Area Protocol (WAP), Personal Digital Assistants<br />
(PDAs), CDs and software. Vivendi also purchased Canal Plus, Europe’s biggest pay-TV<br />
and digital TV operator with more than 14 million subscribers. Vivendi Telecom was<br />
Europe’s leading private telecom operator and it was expanding further into Europe, the<br />
Mediterranean countries and Africa. Vivendi sales in 2000 were over $55 billion, of which<br />
6.9% were from publishing. Havas publishing group focused on reference and education<br />
books sold primarily in France and non-U.S. markets. The company had no debt and annual<br />
cash flow of $3 billion.<br />
The Walt Disney Company was a diversified worldwide entertainment company with<br />
operations in five business segments: Media Networks (ABC), Studio Entertainment (liveaction<br />
and animated movies, television animation, music and theater), Parks and Resorts,<br />
Consumer Products (which licensed cartoon characters and other intellectual property for<br />
merchandise and published books and magazines), and the unprofitable Internet Group.<br />
Disney generated over $25 billion in revenues in fiscal year 2000, of which only $55 million<br />
derived from consumer publishing, mainly through its Buena Vista imprint.<br />
<strong>Tuck</strong> School of Business at <strong>Dartmouth</strong>—Glassmeyer/McNamee Center for Digital Strategies 22
<strong>Simon</strong> & <strong>Schuster</strong><br />
Appendix 2: Additional Major Book Publishers<br />
no. 6-0004<br />
(Ranked By Revenues)<br />
Reader's Digest was founded in 1922 as a magazine publisher. The book publishing division<br />
focused on how-to titles, children's, cooking, reference and abridged works of fiction. The<br />
abridged works were published in 16 languages and sold in 27 countries. Fifty five percent<br />
of the company’s revenues of $937 million in 1999 came from outside the United States.<br />
Reader’s Digest was expanding into multiple distribution channels including direct-response<br />
television, display marketing, catalogs, retail and the Internet. In 1999, Reader’s Digest had<br />
one of the highest operating margins in the industry: 17.8%.<br />
Holtzbrinck was founded in 1948 by Georg von Holtzbrinck and had become a global<br />
powerhouse with operations in all continents. It owned Henry Holt, St. Martin’s Press and<br />
Farrar, Straus & Giroux in the US. It also owns Macmillan in the UK. Holtzbrinck’s<br />
products included trade books, college books, book printing, reference materials, business<br />
information, German newspapers, and Scientific American magazine. Holtzbrinck increased<br />
its revenues by 25% to $346 million from 1998 to 1999.<br />
Rodale Press was founded in 1930 by J.I. Rodale, a farmer who wanted to raise the quality<br />
of farming techniques and improve the public’s nutritional habits. The business was still<br />
family-owned in 2001 and had a number of well-known magazines such as Runner’s World<br />
and Men’s Health. Rodale’s books focused on health, fitness, gardening, crafts and<br />
inspiration. Rodale was the first company to institute a no-smoking policy and refused to<br />
accept advertising from liquor and tobacco companies. In 1999, Rodale generated $203<br />
million in revenues.<br />
Hungry Minds had a portfolio of technology, business, consumer and how-to brands in 2001.<br />
Its brands included “For Dummies”, Cliffs Notes, Frommer’s, “The Unofficial Guide”,<br />
Weight Watchers, Webster’s New World and Betty Crocker. Hungry Minds focused on<br />
helping people learn through a number of mediums such as books, audio tapes, newsletters,<br />
CDs, games, videos, Web sites. In February of 2001 it was forced to lay off about 20% of its<br />
staff due to declining advertising and licensing revenues from its sites. Hungry Minds’ main<br />
education site offered 17,000 online courses through joint ventures with numerous<br />
institutions such as UC Berkeley, Michigan State University and New York University.<br />
Revenues in 1999 were $180 million.<br />
McGraw Hill had a strong business and computer publishing program for consumer books.<br />
However, sales of $129 million from those segments represented only 3% of its $4 billion in<br />
combined revenues in 1999 from financial services, education and business information.<br />
<strong>Tuck</strong> School of Business at <strong>Dartmouth</strong>—Glassmeyer/McNamee Center for Digital Strategies 23
<strong>Simon</strong> & <strong>Schuster</strong><br />
Appendix 3: Technology and Publishing<br />
no. 6-0004<br />
Production. A typical hard-cover bestseller was retail priced at about $25. Going<br />
completely digital would eliminate printing and binding costs of about $3 per book and<br />
warehousing expenses of about $2 per book. Including overhead and other cost reductions,<br />
savings would be as much as 40% of retail price. Even without going fully electronic, the<br />
turnaround time from manuscript to print plus the flexibility to make changes to content later<br />
in the production cycle would surely lead to expanded margins, especially for textbooks,<br />
academic journals and computer books.<br />
Readers received timelier information so the perceived and actual value of the material<br />
increased. A major publisher reported that its computer book publishing division had cut in<br />
half the time it took to edit a book by working electronically. At the very least, online<br />
communication had resulted in a more collaborative working relationship among authors,<br />
editors and designers.<br />
Authors and Disintermediation. Newly published authors stood to gain from online<br />
publishing because they could demand a higher percentage of royalties from publishers and<br />
distributors. Backlisted authors, however, could possibly lose because of insufficient detail<br />
in royalty agreements regarding rights to re-use the work after it went out of print. With<br />
electronic storage, a book would never go “out of print.”<br />
In January of 2001, Barnes&Noble.com announced the creation of an electronic publishing<br />
imprint, Barnes & Noble Digital, which would create a direct link between authors and<br />
readers, giving authors a greater share of income from their works while lowering retail<br />
prices. It would provide authors with a one-stop, direct-to-market process, featuring editorial<br />
support and online sales monitoring. Barnes & Noble Digital would also make its works<br />
available for e-book retailers and would publish digital versions of Barnes & Noble titles in<br />
print at the time.<br />
Print-On-Demand. Publishers such as S&S planned to use print-on demand technology to<br />
control inventory better and to offer works of lesser known authors and volumes that had<br />
been out of print. According to an industry publication, for every five books manufactured,<br />
S&S sold three or four, because of copies used for retail display or returned unsold. Print-ondemand<br />
created the possibility of significantly increased margins from inventory<br />
management.<br />
Barnes & Noble purchased interests in print-on-demand and digital publishing companies.<br />
Barnes & Noble and IBM had teamed together to provide printed books on demand at retail<br />
stores and at Web sites. However, print-on-demand meant publishers and book sellers would<br />
have to invest in distribution centers and high-quality, high-speed printers in stores. A<br />
Barnes & Noble executive predicted that digital laser presses would be in bookstores within<br />
three years.<br />
<strong>Tuck</strong> School of Business at <strong>Dartmouth</strong>—Glassmeyer/McNamee Center for Digital Strategies 24
<strong>Simon</strong> & <strong>Schuster</strong><br />
New Players<br />
no. 6-0004<br />
Mightywords.com specialized in producing and distributing original works such as essays,<br />
short stories, condensed books, serials, speeches and research reports. This type of content<br />
did not fit the typical profile for traditional publishers but filled a need in the marketplace.<br />
Well known authors such as Arthur C. Clarke, Toni Morrison, Newt Gingrich and Seth<br />
Godin had created original content exclusively for Mightywords.com. Mightywords was a<br />
launch pad for new authors and offered royalties of as much as 50%. The site included<br />
business, health, humor, literature, fiction, mystery and romance topics, among others.<br />
Mightywords received $20 million from Barnes and Noble in exchange for a 50%<br />
ownership. Time Warner and Random House were among several top level publishers that<br />
had agreed to make selected and excerpted material available at Mightywords.<br />
Reciprocal was one of the leaders in digital rights management in 2001. It had developed<br />
secure methods of encryption, protection, billing and downloading of content, which<br />
included audio, text, graphics, software, and video. Reciprocal had joint ventures with<br />
numerous content and distribution companies such as AOL/Time Warner, Advanced<br />
Marketing Services, Sony, Harper Collins and Random House.<br />
Books24x7 offered an innovative model in 2001. The venture-funded company was a Webbased<br />
aggregator of branded, high-value business-to-business content which was offered on<br />
a subscription basis to consumers. Since the site launched in September of 2000, over 10,000<br />
subscribers, mostly corporate professionals, had agreed to pay fees of as much as $299 per<br />
person for unlimited access to over 1,000 technical reference books. The content access was<br />
by search engine and online viewing rather than by downloading. As an additional service,<br />
the site also offered hard-copy versions through an alliance with Barnes&Noble.com.<br />
Books24x7 had partnerships with John Wiley & Sons, McGraw-Hill, Microsoft Press and<br />
MIT Press. Publishers liked the revenue-sharing model with Books24x7 because they<br />
generate fees every time a page of their content was accessed. Books24x7 was also<br />
outsourcing its core competency. It was licensing its patented search engine technology<br />
includes bookmarking and annotation capabilities to publishing, education and training sites.<br />
Critics wondered about Books24x7’s revenue model. One of the competitors of Books24x7,<br />
Ibooks.com began operations in 1999 as a retailer and aggregator of content, with many of<br />
the same publishing partners as Books24x7. By 2001, Ibooks had fired many of its staff and<br />
was refocusing on becoming an application service provider (ASP) offering content<br />
conversion, digital warehousing and distribution capabilities to book publishers, distributors<br />
and retailers. Creative destruction was alive and well in the publishing industry.<br />
Netlibrary.com digitized books held by most major public libraries and institutions and made<br />
them available for downloading to student computers. Netlibrary had joint ventures with<br />
colleges and major publishers and was planning to make textbooks available in the Fall of<br />
2001 using proprietary technology that allowed searching, browsing, highlighting and<br />
communication among professors and students. Over 3,500 traditional works of literature<br />
<strong>Tuck</strong> School of Business at <strong>Dartmouth</strong>—Glassmeyer/McNamee Center for Digital Strategies 25
<strong>Simon</strong> & <strong>Schuster</strong><br />
no. 6-0004<br />
such as Hamlet, Canterbury Tales and Beowulf were also available in proprietary e-book<br />
version at Netlibrary.<br />
Sample Competitor Moves. Random House executives had indicated that the company<br />
would invest aggressively in new technology, services and alliances. They intended to<br />
expand their digital archives of content in order to take full advantage of electronic<br />
publishing, short print runs, on-demand digital publishing and Web-based retailing and<br />
marketing. Harper Collins had recently launched HarperTools, a site for Web retailers which<br />
offered publicity plans, promotional material, jacket art, catalogues, ordering and tracking<br />
information. The goal, according to company president Jane Friedman, was to provide a<br />
higher level of service to retailers.<br />
E-books. Online versions of books were generating losses, since installing new technologies<br />
and Web site backend operations were very expensive. Companies with deep pockets had<br />
the luxury and the staying power to experiment until profitable and scalable revenue models<br />
were fully developed. As many business-to-consumer sites had realized in previous years,<br />
online customers were loathe to pay money for original content. Many of the younger<br />
generations had been “Napsterized”; they had developed the attitude that all content had to<br />
be free. This notion was an imminent concern for many traditional book publishers.<br />
E-book formats were numerous and were creating confusion for customers. Formats<br />
included Adobe PDF, Glassbook by Adobe, Peanut Press (for the Palm Pilot), e-Book-<br />
Gemstar and, more recently, Reciprocal (also for the Palm Pilot). While an Open eBook<br />
Format standard was used by publishers, not all devices could read every e-book format. The<br />
search functions of e-book devices made them especially useful for technical readers and<br />
mobile professionals that needed access to data.<br />
The eBook by Gemstar was a dedicated electronic reading device holding from 6,000 to<br />
130,000 pages of text. Models manufactured by RCA sold for $300 to $700 and weighed one<br />
to two pounds. Books could be downloaded via built-in modem or USB connections to<br />
computers. Copyright protection was accomplished primarily through encryption and the<br />
inability of the devices to store file-sharing software. Most major publishers had made at<br />
least some of their works available to Gemstar for the eBook, and some titles were initially<br />
made available only through the eBook in order to generate consumer interest.<br />
Major technology firms were finding ways to leverage electronic publishing. In April 2000,<br />
Microsoft unveiled Pocket PC Windows, an operating system for palm-sized computing<br />
devices. Pocket PC supported e-books, digital music and Web surfing. It included MS<br />
Reader which recreated the sharply focused typeface that readers were accustomed to seeing<br />
on paper. Additional functions included bookmarks, highlighting, annotations and built-in<br />
dictionary access. MS Reader also worked in laptops. Many online book retailers offered ebooks<br />
at prices 50% to 90% cheaper than traditional books.<br />
<strong>Tuck</strong> School of Business at <strong>Dartmouth</strong>—Glassmeyer/McNamee Center for Digital Strategies 26
no. 6-0004<br />
<strong>Simon</strong> & <strong>Schuster</strong><br />
Exhibit 1: Communication Industry Segment Rankings, Operating Income Margins and ROA°, 1995-1999 *<br />
1999 1999<br />
Rank Segment or Subsegment Margin Rank Segment or Subsegment ROA<br />
1 Television Station Broadcasters 21.3% 1 Telephone Directory Publishing 26.5%<br />
2 Newspaper Publishing 21.1% 2 Newspaper Publishing 20.0%<br />
3 Radio Network Companies 19.6% 3 Consumer Magazine Publishing 19.8%<br />
4 Business Information Services - Financial 19.0% 4 Business Information Services - Financial 15.9%<br />
5 Out-of-Home Media 18.7% 5 Interactive Entertainment and Information 12.3%<br />
6 Television Network Companies 17.6% 6 Consumer Book Publishing 12.1%<br />
7 Radio Station Broadcasters 17.3% 7 Other Business Information Services 11.3%<br />
8 Business-to-Business Communications 14.1% 8 Business-to-Business Communications 10.4%<br />
9 Other Business Information Services 13.9% 9 Television Network Companies 8.8%<br />
10 Interactive Entertainment and Information 13.9% 10 Traditional Advertising Agencies 8.6%<br />
11 Consumer Magazine Publishing 13.1% 11 Business Information Services - Marketing 8.5%<br />
12 Traditional Advertising Agencies 12.4% 12 Radio Network Companies 8.5%<br />
13 Telephone Directory Publishing 12.3% 13 Business Information Services - Healthcare 8.4%<br />
14 Specialty Publishing 10.8% 14 Specialty Publishing 8.2%<br />
15 Business Information Services - Marketing 10.3% 15 Television Station Broadcasters 7.5%<br />
:<br />
19 Consumer Book Publishing 7.7%<br />
°Combined results of 560 publicly traded companies representing 52% of total communications industry.<br />
* Source: Veronis Suhler Communications Industry Report<br />
<strong>Tuck</strong> School of Business at <strong>Dartmouth</strong>—Glassmeyer/McNamee Center for Digital Strategies 27
no. 6-0004<br />
<strong>Simon</strong> & <strong>Schuster</strong><br />
Exhibit 2: Consumer Spending on Entertainment, 1995-2004 *<br />
1) Consumer Spending Per Person Per Year, 1995-1999<br />
$ Broadcast Cable & Recorded Consumer Consumer Home Box Video<br />
Year Television Satellite Radio Music Newspapers Books Magazines Video Office Games Internet Total<br />
1995 0 125 0 57 52 79 42 80 25 11 8 479<br />
1996 0 139 0 57 53 81 43 86 27 11 13 510<br />
1997 0 154 0 56 53 81 45 86 29 16 21 541<br />
1998 0 166 0 62 53 84 44 92 31 18 28 578<br />
1999 0 181 0 65 54 86 45 95 33 23 42 624<br />
2000E 0 194 0 71 54 89 46 106 35 28 46 669<br />
2001E 0 207 0 73 55 92 47 113 37 35 50 709<br />
2002E 0 219 0 75 55 95 49 116 39 42 54 744<br />
2003E 0 232 0 71 56 98 50 120 41 50 58 776<br />
2004E 0 244 0 68 57 101 51 123 43 58 61 806<br />
* Source: Veronis Suhler Communications Industry Report<br />
<strong>Tuck</strong> School of Business at <strong>Dartmouth</strong>—Glassmeyer/McNamee Center for Digital Strategies 28
no. 6-0004<br />
<strong>Simon</strong> & <strong>Schuster</strong><br />
Exhibit 2: Consumer Spending on Entertainment, 1995-2004 (continued) *<br />
2) Growth in Consumer Spending Per Person Per Year, 1996-2004<br />
% Broadcast Cable & Recorded Consumer Consumer Home Box Video<br />
Year Television Satellite Radio Music Newspapers Books Magazines Video Office Games Internet Total<br />
1996 0 11.1% 0 1.0% 1.6% 2.2% 3.0% 7.6% 6.9% 8.9% 56.5% 6.7%<br />
1997 0 10.6% 0 -3.4% -3.4% -0.5% 4.2% -0.4% 6.5% 43.4% 57.6% 5.6%<br />
1998 0 8.1% 0 11.1% 11.1% 4.5% -0.5% 7.9% 8.1% 12.4% 32.4% 7.7%<br />
1999 0 8.8% 0 5.6% 5.6% 2.1% 1.2% 3.3% 6.0% 24.3% 51.2% 7.9%<br />
2000E 0 7.2% 0 9.4% 9.4% 3.5% 2.1% 10.8% 5.3% 22.9% 10.8% 7.4%<br />
2001E 0 6.8% 0 1.8% 1.8% 3.2% 2.6% 7.0% 5.6% 22.4% 8.7% 5.9%<br />
2002E 0 6.1% 0 2.9% 2.9% 3.2% 3.0% 2.6% 5.6% 21.5% 7.2% 5.2%<br />
2003E 0 5.6% 0 -5.4% -5.4% 3.1% 2.5% 3.3% 5.8% 18.0% 6.8% 4.1%<br />
2004E 0 5.4% 0 -3.2% -3.2% 3.1% 2.4% 2.3% 5.7% 17.1% 6.4% 4.2%<br />
2.0%<br />
4.5% 6.9% 21.5% 49.1% 7.0%<br />
95-99<br />
CAGR 0.0% 9.6% 0.0% 3.4% 3.4% 2.1%<br />
2.5%<br />
5.2% 5.6% 20.4% 8.0% 5.3%<br />
99-04<br />
CAGR 0.0% 6.2% 0.0% 1.1% 1.1% 2.5%<br />
* Source: Veronis Suhler Communications Industry Report<br />
<strong>Tuck</strong> School of Business at <strong>Dartmouth</strong>—Glassmeyer/McNamee Center for Digital Strategies 29
no. 6-0004<br />
<strong>Simon</strong> & <strong>Schuster</strong><br />
Exhibit 3: Media Conglomerates by Income and EBITA, 1999-2000 *<br />
($ millions)<br />
99-00 % 2000 ProForma ProForma 99-00 % 2000<br />
Viacom 1999 2000 Change Revenue Vivendi Universal 1999 2000 Change Revenue<br />
Revenues Revenues *<br />
Cable networks 3,610 4,082 13.1% 17.0% Music 6,005 6,959 15.9% 12.6%<br />
Entertainment 2,668 2,785 4.4% 11.6% Publishing 3,528 3,789 7.4% 6.9%<br />
Video 4,464 4,960 11.1% 20.7% Film and TV 7,732 9,258 19.7% 16.7%<br />
Broadcasting 7,678 7,900 2.9% 32.9% Telecom 4,119 5,547 34.7% 10.0%<br />
Infinity (radio& advertising) 3,540 4,013 13.4% 16.7% Internet 2 51 2300.0% 0.1%<br />
Publishing 611 596 -2.5% 2.5% Utilities 22,062 27,907 26.5% 50.5%<br />
Online 43 113 162.8% 0.5% Other/intercompany 2,866 1,774 -38.1% 3.2%<br />
Other/intercompany (276) (471) 70.7% -2.0% Total Revenues 46,315 55,285 19.4% 100.0%<br />
Total Revenues 22,338 23,978 7.3% 100.0%<br />
% 2000<br />
% 2000 EBITDA EBITDA<br />
EBITDA EBITDA Music 884 1,218 37.7% 16.0%<br />
Cable networks 1,296 1,566 20.8% 29.8% Publishing 466 559 19.9% 7.4%<br />
Entertainment 321 369 15.0% 7.0% Film and TV 342 812 137.2% 10.7%<br />
Video 520 535 2.9% 10.2% Telecom 520 1,372 163.8% 18.1%<br />
Broadcasting 1,050 1,459 39.0% 27.7% Internet (36) (194) 441.2% -2.6%<br />
Infinity (radio& advertising) 1,507 1,788 18.6% 34.0% Utilities 2,867 3,731 30.1% 49.1%<br />
Publishing 74 71 -4.1% 1.3% Other/intercompany 76 95 25.0% 1.2%<br />
Online (82) (231) 181.7% -4.4% Total EBITDA 5,120 7,592 48.3% 100.0%<br />
Other/intercompany (228) (297) 30.3% -5.6%<br />
Total EBITDA 4,458 5,260 18.0% 100.0% * All figures derived from reports in Euros at exchange rate of 0.95 E/$.<br />
* Source: Thomas Weisel Partners Source: Vivendi.com<br />
<strong>Tuck</strong> School of Business at <strong>Dartmouth</strong>—Glassmeyer/McNamee Center for Digital Strategies 30
no. 6-0004<br />
<strong>Simon</strong> & <strong>Schuster</strong><br />
Exhibit 3: Media Conglomerates by Income and EBITDA, 1999-2000 (continued) *<br />
99-00 % 2000 99-00 % 2000<br />
Walt Disney 1999 2000 Change Revenue Bertelsmann 1999 2000 Change Revenue<br />
Revenues Revenues<br />
Media networks 7,970 9,615 20.6% 37.9% BMG Entertainment 4,166 4,778 15% 28.9%<br />
Studio entertainment 6,166 5,994 -2.8% 23.6% Book publishing 4,253 4,332 2% 26.2%<br />
Parks and resorts 6,139 6,803 10.8% 26.8% Magazines 2,755 2,931 6% 17.7%<br />
Consumer (incl.<br />
publishing) 2,954 2,622 -11.2% 10.3% Printing 1,940 2,239 15% 13.5%<br />
Internet and direct mktg. 206 368 78.6% 1.4% Television and Radio N/A 1,665 N/A 10.1%<br />
Total Revenues 23,435 25,402 8.4% 100.0% Multimedia 250 477 91% 2.9%<br />
Scientific literature 462 684 48% 4.1%<br />
% 2000 Other/intercompany (537) (582) 8% -3.5%<br />
EBITDA EBITDA Total Revenues 13,289 16,524 24% 100.0%<br />
Media networks 1,711 2,438 42.5% 48.7%<br />
Studio entertainment 218 164 -24.8% 3.3% % 2000<br />
Parks and resorts 1,977 2,201 11.3% 44.0% EBITDA EBITDA<br />
Consumer (incl.<br />
publishing) 690 558 -19.1% 11.2% BMG Entertainment 175 223 27% 12.6%<br />
Internet and direct mktg. (184) (359) 95.1% -7.2% Book publishing 131 29 -78% 1.6%<br />
Total EBITDA 4,412 5,002 13.4% 100.0% Magazines 349 384 10% 21.7%<br />
Printing 156 188 21% 10.6%<br />
Television and Radio 90 357 297% 20.2%<br />
Multimedia (125) (261) 109% -14.7%<br />
Scientific literature 25 64 156% 3.6%<br />
Other/intercompany 451 786 74% 44.4%<br />
Total EBITDA 1,252 1,770 41% 100.0%<br />
Note: Some figures may not match exactly with those given in other exhibits due to variations in sources, classifications, fiscal year versus calendar year reporting, choices of exchange<br />
rates and effects of mergers.<br />
* Source: Walt Disney 10-K Report Source: Bertelsmann Annual Report<br />
<strong>Tuck</strong> School of Business at <strong>Dartmouth</strong>—Glassmeyer/McNamee Center for Digital Strategies 31
no. 6-0004<br />
<strong>Simon</strong> & <strong>Schuster</strong><br />
Exhibit 3: Media Conglomerates by Income and EBITDA, 1999-2000 (continued) *<br />
($ millions)<br />
99-00 % 2000 ProForma ProForma 99-00 % 2000<br />
NewsCorp 1999 2000 Change Revenue AOL/Time Warner 1999 2000 Change Revenue<br />
Revenues Revenues<br />
Filmed entertainment 3,753 3,242 -13.6% 27.2% AOL 1,618 2,059 27.3% 20.1%<br />
Television 2,962 3,098 4.6% 26.0% Cable 1,406 1,594 13.4% 15.6%<br />
Cable programming 305 1,063 248.5% 8.9% Filmed Entertainment 2,387 2,411 1.0% 23.6%<br />
Magazines 1,181 840 -28.9% 7.1% Networks 1,732 1,793 3.5% 17.5%<br />
Newspapers 2,192 2,358 7.6% 19.8% Music 1,258 1,264 0.5% 12.4%<br />
Book publishing 649 866 33.4% 7.3% Publishing 1,333 1,429 7.2% 14.0%<br />
Other/intercompany 503 431 -14.3% 3.6% Other/intercompany (274) (319) 16.4% -3.1%<br />
Total Revenues 11,545 11,898 3.1% 100.0% Total Revenues 9,460 10,231 8.2% 100.0%<br />
% 2000 % 2000<br />
EBITDA EBITDA EBITDA EBITDA<br />
Filmed entertainment 337 151 -55.2% 8.6% AOL 412 652 58.3% 26.9%<br />
Television 595 668 12.3% 38.1% Cable 660 767 16.2% 31.7%<br />
Cable programming (44) 94 N/A 5.4% Filmed Entertainment 218 183 -16.1% 7.6%<br />
Magazines 298 224 -24.8% 12.8% Networks 447 443 -0.9% 18.3%<br />
Newspapers 465 566 21.7% 32.3% Music 198 178 -10.1% 7.4%<br />
Book publishing 45 79 75.6% 4.5% Publishing 267 290 8.6% 12.0%<br />
Other/intercompany 34 (30) N/A -1.7% Other/intercompany (83) (92) 10.8% -3.8%<br />
Total 1,730 1,752 1.3% 100.0% Total EBITDA 2,119 2,421 14.3% 100.0%<br />
* Source: Multex.com Source: Raymond James & Associates<br />
<strong>Tuck</strong> School of Business at <strong>Dartmouth</strong>—Glassmeyer/McNamee Center for Digital Strategies 32
no. 6-0004<br />
<strong>Simon</strong> & <strong>Schuster</strong><br />
Exhibit 3: Media Conglomerates by Income and EBITA, 1999-2000 (continued) *<br />
99-00 % 2000<br />
Pearson, plc 1999 2000 Change Revenue<br />
Revenues<br />
Educational publishing 2,619 3,300 26.0% 55.6%<br />
Consumer publishing 815 1,100 35.0% 18.5%<br />
Newspapers 1,074 1,300 21.0% 21.9%<br />
Other/intercompany 475 230 -51.6% 3.9%<br />
Total Revenues 4,983 5,930 19.0% 100.0%<br />
% 2000<br />
EBITDA EBITDA<br />
Educational publishing 385 504 30.9% 50.4%<br />
Consumer publishing 97 112 15.5% 11.2%<br />
Newspapers 228 285 25.0% 28.5%<br />
Other/intercompany 152 99 -34.9% 5.7%<br />
Total 862 1,000 16.0% 100.0%<br />
Note: Some figures may not match exactly with those given in other exhibits due to variations in sources, classifications, fiscal year versus calendar year reporting, choices of<br />
exchange rates and effects of mergers.<br />
* Source: SEC filings and Business Week<br />
<strong>Tuck</strong> School of Business at <strong>Dartmouth</strong>—Glassmeyer/McNamee Center for Digital Strategies 33
no. 6-0004<br />
<strong>Simon</strong> & <strong>Schuster</strong><br />
Exhibit 4: Book Publishing Industry Net Sales, 1996-2000 *<br />
Change CAGR<br />
$ millions 1996 1997 1998 1999 2000 99-00 96-00<br />
Consumer 9,962 10,005 10,521 11,246 11,071 -1.6% 2.1%<br />
Professional 3,985 4,156 4,419 4,720 5,129 8.7% 5.2%<br />
K-12 Texts 2,619 3,005 3,315 3,425 3,881 13.3% 8.2%<br />
<strong>College</strong> Texts 2,486 2,670 2,889 3,129 3,237 3.5% 5.4%<br />
University Presses 349 367 392 412 402 -2.4% 2.9%<br />
Standardized Tests 179 191 205 219 234 6.8% 5.5%<br />
Subscription reference 706 737 767 789 809 2.5% 2.8%<br />
Other 493 510 526 542 559 3.1% 2.5%<br />
Total 20,779 21,641 23,034 24,482 25,322 3.4% 4.0%<br />
Consumer sub-categories:<br />
Trade 5,643 5,774 6,149 6,792 6,541 -3.7% 3.0%<br />
Mass market paperbacks 1,554 1,434 1,514 1,552 1,559 0.5% 0.1%<br />
Religious 1,093 1,133 1,178 1,217 1,247 2.5% 2.7%<br />
Book clubs 1,092 1,143 1,209 1,272 1,292 1.6% 3.4%<br />
Mail order 580 521 471 413 432 4.6% -5.7%<br />
Total consumer books 9,962 10,005 10,521 11,246 11,071 -1.6% 2.1%<br />
Consumer books as % total 47.9% 46.2% 45.7% 45.9% 43.7%<br />
* Source: Association of American Publishers<br />
<strong>Tuck</strong> School of Business at <strong>Dartmouth</strong>—Glassmeyer/McNamee Center for Digital Strategies 34
no. 6-0004<br />
<strong>Simon</strong> & <strong>Schuster</strong><br />
Exhibit 5: Book Publishing Industry Net Sales Projections, 2001-2004 *<br />
Actual Projected CAGR<br />
$ millions 2000 2001 2002 2003 2004 01-04<br />
Consumer 11,071 11,684 12,168 12,672 13,193 3.1%<br />
Professional 5,129 5,243 5,522 5,815 6,121 3.9%<br />
K-12 Texts 3,881 3,795 4,014 4,232 4,469 4.2%<br />
<strong>College</strong> Texts 3,237 3,649 3,930 4,226 4,539 5.6%<br />
University Presses 402 452 474 496 519 3.5%<br />
Standardized Tests 234 249 265 283 302 4.9%<br />
Subscription reference 809 849 882 916 949 2.8%<br />
Other 559 559 559 559 559 0.0%<br />
Total 25,322 26,480 27,814 29,199 30,651 3.7%<br />
Consumer sub-categories:<br />
Trade 6,541 7,146 7,477 7,819 8,174 3.4%<br />
Mass market paperbacks 1,559 1,546 1,616 1,685 1,754 3.2%<br />
Religious 1,247 1,306 1,353 1,401 1,450 2.6%<br />
Book clubs 1,292 1,338 1,380 1,424 1,468 2.3%<br />
Mail order 432 348 342 343 347 -0.1%<br />
Total consumer books 11,071 11,684 12,168 12,672 13,193 3.1%<br />
Consumer books as % total 43.7% 44.1% 43.7% 43.4% 43.0%<br />
* Source: Association of American Publishers, Book Industry Study Group, Inc.<br />
<strong>Tuck</strong> School of Business at <strong>Dartmouth</strong>—Glassmeyer/McNamee Center for Digital Strategies 35
no. 6-0004<br />
<strong>Simon</strong> & <strong>Schuster</strong><br />
Exhibit 6: Major Consumer Book Categories, by Revenues, 1995-1999 *<br />
($ millions) 1999<br />
98-99 95-99 Concentration<br />
Category 1995 1996 1997 1998 1999 Change Change Ratio*<br />
Art 140 141 141 143 144 0.7% 2.9% 67% Top 3<br />
Biography 375 381 400 400 405 1.3% 8.0% 40% Top 4<br />
Business 617 679 726 791 862 9.0% 39.7% 21% Top 5<br />
Children's 1,327 1,448 1,379 1,489 1,721 15.6% 29.7% 45% Top 5<br />
Computer 500 586 638 722 798 10.5% 59.6% 73% Top 5<br />
Cookbook 400 395 402 404 404 0.0% 1.0% 47% Top 4<br />
Gardening 175 192 190 195 197 1.0% 12.3% 51% Top 5<br />
Health 375 400 432 450 481 6.9% 28.3% 28% Top 5<br />
How-To 125 126 125 128 129 0.8% 2.8% 66% Top 5<br />
Mystery 350 350 345 350 356 1.7% 1.7% 67% Top 5<br />
Reference 535 510 500 498 501 0.6% -6.4% 30% Top 5<br />
Religion 1,036 1,093 1,132 1,178 1,210 2.7% 16.7% 39% Top 5<br />
Romance 971 1,000 1,010 1,170 1,195 2.1% 23.1% 36% Top 5<br />
Science Fiction 500 487 475 480 482 0.4% 3.6% 44% Top 4<br />
Self-Help 462 500 538 563 588 4.4% 27.3% 65% Top 5<br />
Sports 100 105 110 115 117 1.7% 16.5% 50% Top 4<br />
Travel 142 143 156 160 168 5.0% 18.3% 66% Top 5<br />
* Sources: Simba Information, Association of American Publishers, Book Industry Study Group<br />
<strong>Tuck</strong> School of Business at <strong>Dartmouth</strong>—Glassmeyer/McNamee Center for Digital Strategies 36
no. 6-0004<br />
<strong>Simon</strong> & <strong>Schuster</strong><br />
Exhibit 7: 20 Largest US Consumer Book Publishers by Revenue 1999 vs. 1998 *<br />
($ millions except Revenues Per Title) 98-99 # Consumer Revenues Per<br />
Publisher 1998 1999 Change Titles in 1999 Title ($) in 1999<br />
Random House 1,610 1,691 5.0% 3,000 564<br />
Time Warner 1,574 1,637 4.0% 805 2,034<br />
Readers Digest 1,033 937 -9.3% 90 10,411<br />
Scholastic 698 793 13.6% 591 1,342<br />
Harper Collins 737 764 3.7% 1,700 449<br />
Penguin Putnam 613 644 5.1% 2,451 263<br />
<strong>Simon</strong> & <strong>Schuster</strong>* 565 611 8.1% 2,100 291<br />
Encyclopedia Britannica 465 465 0.0% N/A N/A<br />
Grolier 450 450 0.0% N/A N/A<br />
Harlequin 355 375 5.6% 936 401<br />
Holtzbrinck 275 346 25.8% 1,985 174<br />
Hearst 210 214 1.9% N/A N/A<br />
Rodale 225 203 -9.8% 120 1,692<br />
Hungry Minds (IDG) 142 180 26.8% 700 257<br />
Thomas Nelson 164 170 3.7% 200 850<br />
Barnes & Noble 160 164 2.5% N/A N/A<br />
Golden Books 150 136 -9.3% 350 389<br />
DK Publishing 103 130 26.2% 550 236<br />
McGraw Hill 124 129 4.0% N/A N/A<br />
Andrews McMeel 115 121 5.2% 437 277<br />
Total Top 20 9,768 10,160 4.0%<br />
Total Industry 23,034 24,482 6.3%<br />
Top 20 as % Total Industry 42.4% 41.5%<br />
Top 5 as % Total Industry 24.5% 23.8%<br />
1998 results are pro forma due to divestitures.<br />
* Source: Simba Information<br />
<strong>Tuck</strong> School of Business at <strong>Dartmouth</strong>—Glassmeyer/McNamee Center for Digital Strategies 37
no. 6-0004<br />
<strong>Simon</strong> & <strong>Schuster</strong><br />
Exhibit 8: Ranking of Publishers by Sales in Categories, 1999 *<br />
<strong>Simon</strong><br />
(1 = top rank) Random & Harper Penguin Time Meredith Rodale Readers Hungry Harlequin Harry Abbeville John<br />
House <strong>Schuster</strong> Collins Putnam Warner Digest Minds/IDG Abrams Wiley<br />
Art 2 1 3<br />
Biography 1 2 3 4<br />
Business 3 4 1 5<br />
Children's 1 3 5 2<br />
Computer 2<br />
Cookbook 1 2 3 4<br />
Gardening 4 1 3 5 2<br />
Health 2 4 5 1 3<br />
How-To 2 3 4 5 1<br />
Mystery 2 3 1 4<br />
Reference 4 3<br />
Religion 5 2 4<br />
Romance 2 4 3 1<br />
Science<br />
Fiction 1 2 4<br />
Self-Help 3 2 4 5<br />
Sports 1 2 3<br />
Travel 2 1<br />
* Source: Simba Information<br />
<strong>Tuck</strong> School of Business at <strong>Dartmouth</strong>—Glassmeyer/McNamee Center for Digital Strategies 38
no. 6-0004<br />
<strong>Simon</strong> & <strong>Schuster</strong><br />
Exhibit 8: Ranking of Publishers by Sales in Categories, 1999 (continued) *<br />
(1 = top rank) McGraw Pearson Health Microsoft St. DK Houghton Merriam Thomas Tyndale Kensington Torstar Golden<br />
Hill Comm. Martin Mifflin Webster Nelson<br />
Art<br />
Biography<br />
Business 2<br />
Children's 4<br />
Computer 4 1 3<br />
Cookbook<br />
Gardening<br />
Health<br />
How-To<br />
Mystery 5<br />
Reference 1 2 5<br />
Religion 1 3<br />
Romance 5<br />
Science<br />
Fiction 3<br />
Self-Help 1<br />
Sports<br />
Travel<br />
* Source: Simba Information<br />
<strong>Tuck</strong> School of Business at <strong>Dartmouth</strong>—Glassmeyer/McNamee Center for Digital Strategies 39
no. 6-0004<br />
<strong>Simon</strong> & <strong>Schuster</strong><br />
Exhibit 9: New York Times and Publishers Weekly Bestsellers, 1999-2000<br />
1) New York Times Bestselling Consumer Book Publishers, 1999 *<br />
Hardcover Paperback Total % Share<br />
Publisher Titles Weeks* Titles Weeks* Titles Weeks* Titles<br />
Random House 79 675 73 556 152 1,231 33.6%<br />
Penguin Putnam 34 262 33 178 67 440 14.8%<br />
<strong>Simon</strong> & <strong>Schuster</strong> 30 236 30 258 60 494 13.3%<br />
Harper Collins 27 148 23 231 50 379 11.1%<br />
Time Warner 17 131 18 127 35 258 7.7%<br />
Other 46 344 42 336 88 680 19.5%<br />
Total 233 1,796 219 1,686 452 3,482 100.0%<br />
2) Publishers Weekly Bestselling Consumer Book Publishers, 2000*<br />
Hardcover Paperback Total % Share<br />
Publisher Titles Weeks* Titles Weeks* Titles Weeks* Titles<br />
Random House 69 505 55 377 124 882 29.2%<br />
Penguin Putnam 39 269 49 266 88 535 20.7%<br />
<strong>Simon</strong> & <strong>Schuster</strong> 29 166 31 196 60 362 14.1%<br />
Harper Collins 29 196 29 216 58 412 13.6%<br />
Time Warner 19 143 15 153 34 296 8.0%<br />
Other 23 129 38 251 61 380 14.4%<br />
Total 208 1,408 217 1,459 425 2,867 100.0%<br />
* Combined weeks for titles.<br />
* Source: #1 = New York Times bestsellers lists and #2 = Publishers Weekly<br />
<strong>Tuck</strong> School of Business at <strong>Dartmouth</strong>—Glassmeyer/McNamee Center for Digital Strategies 40
no. 6-0004<br />
<strong>Simon</strong> & <strong>Schuster</strong><br />
Exhibit 10: S&S Revenues in Categories in which it Ranked Top 5, 1998-1999 *<br />
($ millions)<br />
% 1999<br />
Category 1998 1999 Revenue<br />
Biography 33 35 5.7%<br />
Business 89 31 5.1%<br />
Children's 114 130 21.3%<br />
Cookbook 43 43 7.0%<br />
Health 16 16 2.6%<br />
How-To 10 10 1.6%<br />
Mystery 31 32 5.2%<br />
Science Fiction 43 50 8.2%<br />
Self-Help 85 86 14.1%<br />
Sports 14 15 2.5%<br />
Other 105 163 26.7%<br />
Total 583 611 100.0%<br />
* Source: Simba Information<br />
<strong>Tuck</strong> School of Business at <strong>Dartmouth</strong>—Glassmeyer/McNamee Center for Digital Strategies 41
no. 6-0004<br />
<strong>Simon</strong> & <strong>Schuster</strong><br />
Exhibit 11: Audiobook Market Analysis, 1995-1999 *<br />
($ millions)<br />
1) Audiobook Revenues, 1995-1999<br />
95-99<br />
1995 1996 1997 1998 1999 Change<br />
Audiobooks 347 387 428 479 527 52.1%<br />
2) Leading Audiobook Publisher Revenues, 1999 vs. 1998<br />
% of Total<br />
98-99 Revenues<br />
Publisher 1998 1999 Change in 1999<br />
Random House 73.5 77.2 5.0% 4.6%<br />
Harper Collins 29.5 32.5 10.2% 4.3%<br />
<strong>Simon</strong> & <strong>Schuster</strong> 27.5 29.7 8.0% 4.9%<br />
Timer Warner 18.9 21.2 12.2% 1.3%<br />
Others 330.0 366.7 -25.4% N/A<br />
Total 479.4 527.3 10.0% 2.2%<br />
* Source: Simba Information, Association of American Publishers<br />
<strong>Tuck</strong> School of Business at <strong>Dartmouth</strong>—Glassmeyer/McNamee Center for Digital Strategies 42
no. 6-0004<br />
<strong>Simon</strong> & <strong>Schuster</strong><br />
Exhibit 12: Foreign Markets for US Books, 1999 vs. 1998 *<br />
($ millions) 1999 1999<br />
US 98-99 Imports 98-99<br />
Country Exports Change Into US Change<br />
Canada 831 2.9% 215 -4.2%<br />
UK 261 10.0% 276 -12.2%<br />
Australia 140 -11.4% 10 29.1%<br />
Japan 84 -36.9% 54 -8.6%<br />
Mexico 69 17.2% 23 32.9%<br />
Netherlands 69 51.0% 20 12.1%<br />
Germany 44 51.0% 51 -19.5%<br />
Singapore 42 56.7% 89 -6.5%<br />
Taiwan 26 7.9% 9 -0.7%<br />
Belgium 25 N/A 20 0.7%<br />
Korea 23 42.6% 29 11.1%<br />
New Zealand 23 6.0% 3 140.4%<br />
Hong Kong 21 0.1% 226 12.9%<br />
South Africa 18 18.2% N/A N/A<br />
France 15 31.2% 22 -7.8%<br />
Brazil 15 -20.6% N/A N/A<br />
Phillipines 14 36.9% N/A N/A<br />
China 13 N/A 142 41.4%<br />
Italy 10 10.1% 95 -7.5%<br />
Argentina 8 -12.7% N/A N/A<br />
Other 163 N/A 128 N/A<br />
Total 1,914 3.9% 1,412 2.6%<br />
* Source: 2000 Bowker Annual: Library and Book Trade Almanac<br />
<strong>Tuck</strong> School of Business at <strong>Dartmouth</strong>—Glassmeyer/McNamee Center for Digital Strategies 43
no. 6-0004<br />
<strong>Simon</strong> & <strong>Schuster</strong><br />
Exhibit 13: Sample Publishing Income Statement *<br />
% Sales<br />
Total net sales 100.0%<br />
Edition cost (paper/print/bind) 23.0%<br />
Plant costs 4.0%<br />
Inventory write-down 2.0%<br />
Royalty expense / write-off 28.0%<br />
Total cost of goods sold 57.0%<br />
Gross profit on net sales 43.0%<br />
Distribution fee / subrights 7.0%<br />
Total gross profit 50.0%<br />
Operating Expenses<br />
Freight / warehousing 8.0%<br />
Editorial 4.0%<br />
Production 2.0%<br />
Advertising / selling 14.0%<br />
General & administrative 12.0%<br />
Total operating expenses 40.0%<br />
Contribution income 10.0%<br />
Other income 1.0%<br />
Operating income 11.0%<br />
Plus: depreciation 2.0%<br />
Plus: amortization 0.0%<br />
EBITDA 13.0%<br />
Note: Goodwill amortization excluded<br />
* Source: Industry sources<br />
<strong>Tuck</strong> School of Business at <strong>Dartmouth</strong>—Glassmeyer/McNamee Center for Digital Strategies 44
no. 6-0004<br />
<strong>Simon</strong> & <strong>Schuster</strong><br />
Exhibit 14: Publishers’ Profitability, 1999 vs. 1998 *<br />
$ millions 1998 1999 98-99<br />
Margin<br />
Publisher Revenue Op. Income Margin Revenue Op. Income Margin Change<br />
Golden Books 194 (102) - 166 (17) - -<br />
Harcourt 1,445 199 13.8% 1,654 246 14.9% 8.0%<br />
Harlequin 346 64 18.5% 375 61 16.3% -12.1%<br />
Harper Collins 737 37 5.0% 764 48 6.3% 25.1%<br />
Houghton Mifflin 862 102 11.8% 920 112 12.2% 2.9%<br />
Hungry Minds (IDG) 142 17 12.0% 180 23 12.8% 6.7%<br />
John Wiley 467 62 13.3% 508 63 12.4% -6.6%<br />
McGraw Hill* 1,620 202 12.5% 1,735 274 15.8% 26.7%<br />
Meredith 769 101 13.1% 774 120 15.5% 18.0%<br />
Penguin Putnam 869 80 9.2% 909 105 11.6% 25.5%<br />
Readers Digest 1,033 100 9.7% 937 167 17.8% 84.1%<br />
Scholastic 1,058 48 4.5% 1,155 78 6.8% 48.9%<br />
<strong>Simon</strong> & <strong>Schuster</strong>** 565 53 9.4% 611 54 8.8% -5.8%<br />
Thomas Nelson 253 25 9.9% 261 21 8.0% -18.6%<br />
Time Warner*** 4,496 607 13.5% 4,663 679 14.6% 7.9%<br />
* Educational and Professional Division.<br />
** 1998 results are pro forma due to divestitures.<br />
*** Includes magazine division.<br />
* Source: Simba Information<br />
<strong>Tuck</strong> School of Business at <strong>Dartmouth</strong>—Glassmeyer/McNamee Center for Digital Strategies 45
no. 6-0004<br />
<strong>Simon</strong> & <strong>Schuster</strong><br />
Exhibit 15: Wholesaler Analysis, 1995-1999<br />
1) Total Unit Sales By Wholesalers, 1995-1999<br />
95-99<br />
1995 1996 1997 1998 1999 Change<br />
Units 156 159 146 156 166 6.0%<br />
2) Leading Wholesalers By Revenues, 1999 vs. 1998<br />
($ millions)<br />
98-99<br />
Wholesaler 1998 1999 Change<br />
Ingram 1,350 1,400 3.7%<br />
Baker & Taylor 883 1,021 15.6%<br />
Publishers Group West 100 120 20.0%<br />
National Book Network 33 44 33.3%<br />
Total 2,333 2,541<br />
<strong>Tuck</strong> School of Business at <strong>Dartmouth</strong>—Glassmeyer/McNamee Center for Digital Strategies 46
no. 6-0004<br />
<strong>Simon</strong> & <strong>Schuster</strong><br />
Exhibit 16: Retail Outlet Analysis, 1996-1999 *<br />
1) Book Purchasing By Outlet, 1996-1999<br />
Outlet 1996 1997 1998 1999<br />
Large chain bookstores 24.8% 25.1% 25.3% 24.6%<br />
Book clubs 18.4% 20.3% 18.0% 17.7%<br />
Independent/small bookstores 18.6% 17.2% 16.6% 15.2%<br />
Discount stores 9.1% 8.7% 9.2% 9.2%<br />
Warehouse clubs 6.2% 6.0% 6.5% 6.5%<br />
Internet 0.0% 0.4% 1.9% 4.4%<br />
Mail order 4.7% 5.3% 4.9% 4.4%<br />
Food/drug stores 4.8% 4.3% 3.6% 3.5%<br />
Used bookstores 3.7% 3.4% 3.0% 3.0%<br />
Multi-media stores 1.3% 1.0% 1.0% 0.9%<br />
Other 8.5% 8.4% 10.0% 9.6%<br />
2) Revenues of Largest Bookstore Chains, 1996-1999<br />
($ millions)<br />
1996-1999<br />
Chain 1996 1997 1998 1999 Change<br />
Barnes and Noble 2,448 2,796 3,006 3,486 42.4%<br />
Borders 1,959 2,266 2,590 2,981 52.2%<br />
Books-A-Million 279 325 348 404 44.8%<br />
Total of Largest Chains 4,686 5,387 5,944 6,871 46.6%<br />
All Bookstore Sales 11,547 11,824 13,179 13,662 18.3%<br />
Largest Chains as % of All Sales 40.6% 45.6% 45.1% 50.3%<br />
* Source: Simba Information, Multex.com<br />
<strong>Tuck</strong> School of Business at <strong>Dartmouth</strong>—Glassmeyer/McNamee Center for Digital Strategies 47
no. 6-0004<br />
<strong>Simon</strong> & <strong>Schuster</strong><br />
Exhibit 16: Retail Outlet Analysis, 1996-1999 (continued) *<br />
3) Revenues of Leading Web-based Booksellers, 1998-2000<br />
($ millions)<br />
1998-2000<br />
Web Site 1998 1999 2000 Change<br />
Amazon.com 610 1,640 2,762 353%<br />
Barnesandnoble.com 62 202 320 416%<br />
Fatbrain.com 11 29 N/A* N/A<br />
Borders.com - 5 18 260%<br />
Total 683 1,876 3,100 175%<br />
*Fatbrain.com was acquired by Barnes&Noble.com in 2000.<br />
* Source: Simba Information, Multex.com<br />
<strong>Tuck</strong> School of Business at <strong>Dartmouth</strong>—Glassmeyer/McNamee Center for Digital Strategies 48