- Page 1 and 2:
'/1UTO QIRTO IV Proceedings of the
- Page 3 and 4:
SPONSORED BY: Proceedings of the Vo
- Page 5 and 6:
FOREWORD This is the fourth confere
- Page 7:
PREFACE The technical articles cont
- Page 10 and 11:
The Use of Computer Generated Maps
- Page 12 and 13:
Interactive Computer Mapping ......
- Page 14 and 15:
A Formal Model of a Cartographic In
- Page 17 and 18:
PHOTOGRAMMETRY SESSIONS Introductio
- Page 19 and 20:
William 0. Lucoff of Cal. State at
- Page 21 and 22:
widths may be varied at random from
- Page 23 and 24:
command codes to the minicomputer a
- Page 25 and 26:
Figure 2 Computer Controller EXPOSU
- Page 27 and 28:
— 1 X 0 u_ ABCDE M X ^ ^j to C£
- Page 29 and 30:
Figure 12 Portion of 48"X60" Chart
- Page 31 and 32:
3. THE GAS SYSTEM Chicago Aerial Su
- Page 33 and 34:
mode and guides the operator throug
- Page 35 and 36:
Figure 1 - Input Edit Figure 2 - Li
- Page 37 and 38:
Figure 7 - illegal Elevations Figur
- Page 39 and 40:
L Figure 11-Matching Between Models
- Page 41 and 42:
1. Street trees are defined as any
- Page 43 and 44:
exists between the calculated data
- Page 45 and 46:
Trom a conversation with Robert Lee
- Page 47 and 48:
II. The Alternatives Various conven
- Page 49 and 50:
With error correction as the final
- Page 51 and 52:
1. Introduction PRACTICAL EXPERIENC
- Page 53 and 54:
instruments with digital mapping te
- Page 55 and 56:
the patterns and stores the digital
- Page 57 and 58:
o Provides the capability to conver
- Page 59 and 60:
II.System Description Figure 1 is a
- Page 61 and 62:
Status signals are located on the m
- Page 63 and 64:
which have been digitized and recor
- Page 65 and 66:
Figure 4 Digitized/Recorded Image C
- Page 67 and 68:
IMAGE PROCESSING The Image Processi
- Page 69 and 70:
II. Background The work reported in
- Page 71 and 72:
coordinates from topographic maps.
- Page 73 and 74:
polation techniques are available i
- Page 75 and 76:
egistrations. In all areas where re
- Page 77 and 78:
THE INTERACTIVE IMAGE SYSTEM FOR TH
- Page 79 and 80:
The operator may type in commands w
- Page 81 and 82:
input, each request being terminate
- Page 83 and 84:
The language elements invoke indepe
- Page 85 and 86:
IMAGE PROCESSING AND NAVIGATION FOR
- Page 87 and 88:
4. Image Acquisition and Amplitude
- Page 89 and 90:
disc); - the satellite spin-speed w
- Page 91 and 92:
line start. These parameters are se
- Page 93 and 94:
PRACTICAL APPLICATIONS FOR DIGITAL
- Page 95 and 96:
need for early warning of impending
- Page 97 and 98:
In order to manipulate classes of f
- Page 99 and 100:
depends mainly on the density of fe
- Page 101 and 102:
A DATA STRUCTURE FOR A RASTER MAP D
- Page 103 and 104:
FIG. 2. A border with indicated max
- Page 105 and 106:
pointers associated with the max-po
- Page 107 and 108:
y-max 1 z \7 'x-min \x-max 3 x-min
- Page 109 and 110:
DIGITAL TERRAIN MODELS SESSIONS Int
- Page 111 and 112:
Their programs have been developed
- Page 113 and 114:
that the purpose of the digital ter
- Page 115 and 116:
equirement for such a program is th
- Page 117 and 118:
equivalent to locating the lines of
- Page 119 and 120:
Brassel, K.,1974,"A Model of Americ
- Page 121 and 122:
It is not the intention of this pap
- Page 123 and 124:
One feature in this should be empha
- Page 125 and 126:
neighbouring data points to estimat
- Page 127 and 128:
Lawson, C.L., 1977. Software for C-
- Page 129 and 130:
EDIT SYSTEM HARDWARE The IPIN Edit
- Page 131 and 132:
Each edit terminal will also contai
- Page 133 and 134:
FIGURE 2. PLOT OF GEOMORPHIC DATA 1
- Page 135 and 136:
a 0° 0 0 + 0 o 0 FIGURE 4. SELECTE
- Page 137 and 138:
FIGURE 5. CONTOUR PLOT OF INTERPOLA
- Page 139 and 140:
absorbed in the merger if the diffe
- Page 141 and 142:
To an every-increasing degree, the
- Page 143 and 144:
potential storage volumes of depres
- Page 145 and 146:
Soil type sand, Vegetation trees -^
- Page 147 and 148:
References Brnjac, M; Carlsen, L; M
- Page 149 and 150:
is particularly important to allow
- Page 151 and 152:
(b) If Z-coordinate of the vertex B
- Page 153 and 154:
Figure 3a. TIN DTM Projection Figur
- Page 155 and 156:
URBAN MAPPING SESSIONS Introduction
- Page 157 and 158:
Norfolk, and Hampton Virginia. Part
- Page 159 and 160:
MAPPING SERVICES IN FAIRFAX COUNTY,
- Page 161 and 162:
If errors are detected they are res
- Page 163 and 164:
Some are only printed as the stocks
- Page 165 and 166:
URBAN MAPPING AND RELATED AUTOMATED
- Page 167 and 168:
tersection matching program was wri
- Page 169 and 170:
The selection of coding schemes wil
- Page 171 and 172:
cartography and are firmly committe
- Page 173 and 174:
main purpose of this paper. Five of
- Page 175 and 176:
The project was undertaken specific
- Page 177 and 178:
play and analysis. By breaking from
- Page 179 and 180:
The operating system environment is
- Page 181 and 182:
INTERACTIVE COMPUTER MAPPING* Thoma
- Page 183 and 184:
- By displaying variables in map fo
- Page 185 and 186:
with a start - head- and an end -ta
- Page 187 and 188:
Rovner, P.D and Feldman, J.A., 1968
- Page 189 and 190:
eading this complex type of map, (2
- Page 191 and 192:
y a law pertaining to persons 65 an
- Page 193 and 194:
So far the analysis has been concer
- Page 195 and 196:
enta separation to the family age g
- Page 197 and 198:
Mortality maps have been widely use
- Page 199 and 200:
1970 population values, growth rate
- Page 201 and 202:
CANCER MORTALITY BY CENSUS TRACT 19
- Page 203 and 204:
References Burbank, F., Epidemiolog
- Page 205 and 206:
Computer graphics is changing all t
- Page 207 and 208:
time to define the uses to which th
- Page 209 and 210:
tually complete - we had a meeting
- Page 211 and 212:
EXPLORATION AND UTILITY SYSTEMS SES
- Page 213 and 214:
AUTOMATED MAPPING AND FACILITIES MA
- Page 215 and 216:
turned out to be a boon for automat
- Page 217 and 218:
As an example, one utility had five
- Page 219 and 220:
suburb of Denver, is a group of eng
- Page 221 and 222:
Introduction CADAE * (COMPUTER AIDE
- Page 223 and 224:
using CADAE, but the convenience an
- Page 225 and 226:
fractions of an inch to 1/64 or in
- Page 227 and 228:
Now that the viability of CADAE has
- Page 229 and 230:
"LANDFORM" LAND ANALYSIS AND DISPLA
- Page 231 and 232:
(2) Information Display (3) Design
- Page 233 and 234:
scales, and perspective views can b
- Page 235 and 236:
ENGINEERING APPLICATIONS OF DIGITAL
- Page 237 and 238:
Once the Map Grids are complete, th
- Page 239 and 240:
TOPOLOGICAL MODELS FOR ARCHITECTURA
- Page 241 and 242:
dimension, may be oriented in two w
- Page 243 and 244:
1-cells, and the 0-cells on the bou
- Page 245 and 246:
IX. One and two-dimensional structu
- Page 247 and 248:
looking from c^ to c9 near side far
- Page 249 and 250:
Figure 4 File Layout for Model of a
- Page 251 and 252:
DATA BASES, SMALL SYSTEMS There wer
- Page 253 and 254:
The consistency requirements are se
- Page 255 and 256:
A 0-cell is A 1-cell is a A 2-cell
- Page 257 and 258:
is a 2-ditnensional surface, and pr
- Page 259 and 260:
Our Algorithm From the topological
- Page 261 and 262:
(a) graph \ (b) disk: node 5 lO (c)
- Page 263 and 264:
as earthquake damage assessment, lo
- Page 265 and 266:
data is relatively simple. Problems
- Page 267 and 268:
In theory, the structure of such a
- Page 269 and 270:
BASIS resides on a minicomputer ope
- Page 271 and 272:
DATA BASES, LARGE SYSTEMS SESSIONS
- Page 273 and 274:
Robert Haralick and Linda Shapiro o
- Page 275 and 276:
COMPUTER-ASSISTED ENVIRONMENTAL DAT
- Page 277 and 278:
System (GRIDS) and Calma Mapping Sy
- Page 279 and 280:
Results Space does not permit the r
- Page 281 and 282:
encoded data appear to be very sign
- Page 283 and 284:
NATIONAL OCEAN SURVEY—AUTOMATED I
- Page 285 and 286:
centered at NOS Headquarters, but r
- Page 287 and 288:
separately. There are also five of
- Page 289 and 290:
graphic, chart base, and labels may
- Page 291 and 292:
Introduction GEOMODEL - INTEGRATED
- Page 293 and 294:
ace, income, miles of bus-lines, or
- Page 295 and 296:
phrase pointer Figure Ib. 1-cell Fe
- Page 297 and 298:
Implementation The development plan
- Page 299 and 300:
ECQBASE OF BRITAIN: status report o
- Page 301 and 302:
1. Coastlines (high water mark) inc
- Page 303 and 304:
much statistical data, e.g. , from
- Page 305 and 306:
Figure 1 Scale of digitisation of p
- Page 307 and 308:
I. Introduction A DATA STRUCTURE FO
- Page 309 and 310:
One obvious division of the state i
- Page 311 and 312:
Figure 2 illustrates this structure
- Page 313 and 314:
Raster or grid form is another form
- Page 315 and 316:
For each type of spatial data struc
- Page 317 and 318:
The following questions are possibl
- Page 319 and 320:
4. Freeman, H., "Computer Processin
- Page 321 and 322:
also be generalized to remove exces
- Page 323 and 324:
Figure I. On the left, a map of zon
- Page 325 and 326:
The other important role the error
- Page 327 and 328:
REFERENCES Corbett, J. (1975). "Top
- Page 329 and 330:
The fundamental building block of a
- Page 331 and 332:
discussed previously are of the COD
- Page 333 and 334:
[2] Bonczek, R. H.; Holsapple, C. W
- Page 335 and 336:
REFERENCE BASE REFERENCE LINES NAP
- Page 337 and 338:
Polygon data, in contrast, results
- Page 339 and 340:
An alternative to grid resampling i
- Page 341 and 342:
Should this table already contain a
- Page 343 and 344:
Murray, F. W. (1968) A_ Method of O
- Page 345 and 346:
ships between units, and thereby fe
- Page 347 and 348:
ture, encode, reduce, edit, format,
- Page 349 and 350:
could be assigned to each 40-acre g
- Page 351 and 352:
more on chain encoding rather than
- Page 353 and 354:
RIDS-CURRENT TECHNOLOGY IN RESOURCE
- Page 355 and 356:
The RID system is designed to overl
- Page 357 and 358:
Data Input Once the relevant data h
- Page 359 and 360:
Data Manipulation Timber Contour Cu
- Page 361 and 362:
THE DEVELOPMENT OF A NATIONAL SMALL
- Page 363 and 364:
III. The National Small-Scale Data
- Page 365 and 366:
cally-structured data base is under
- Page 367 and 368:
Appendix A: HAWAII: Hydrography U>
- Page 369 and 370:
INTERACTIVE CARTOGRAPHY, SMALL SYST
- Page 371 and 372:
options but it also extends our res
- Page 373 and 374:
sis techniques) information not pre
- Page 375 and 376: media forming input to the system i
- Page 377 and 378: D. CIS Data Base Limitations There
- Page 379 and 380: input space into a set of 8 x 8 sub
- Page 381 and 382: esolution of the system and the num
- Page 383 and 384: impractical to use this terminal fo
- Page 385 and 386: and heat from power plants into wat
- Page 387 and 388: The present and future Low-resoluti
- Page 389 and 390: Development of GIMMAP at the Kansas
- Page 391 and 392: The second area of development is a
- Page 393 and 394: GROUP Fig. 1
- Page 395 and 396: MOVING INTERACTIVE THEMATIC MAPPING
- Page 397 and 398: directives. Both map and data files
- Page 399 and 400: Parameters are commonly of the form
- Page 401 and 402: 7. Conclusions In the s:!x months C
- Page 403 and 404: INTERACTIVE CARTOGRAPHY, LARGE SYST
- Page 405 and 406: developed at LBL has been particula
- Page 407 and 408: printed at a common scale and forma
- Page 409 and 410: 1. 2. 3. 4. 5. 6. 7. 8. 9. 10. 11.
- Page 411 and 412: V. Production Sequence The most imp
- Page 413 and 414: 1. Introduction MULTIPLE SYSTEM INT
- Page 415 and 416: measurements during map compilation
- Page 417 and 418: Photogrammetric —— > Digitizer/
- Page 419 and 420: intersections. These are a few exam
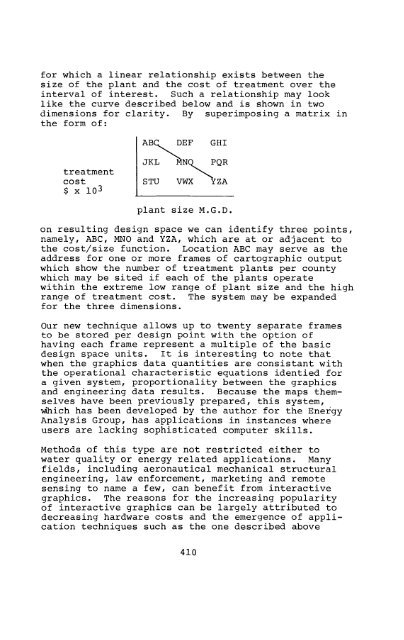
- Page 421 and 422: Introduction ENERGY ANALYSIS BY MEA
- Page 423 and 424: enabled us to undertake runs consit
- Page 425: Cost (k $) (D CD M M
- Page 429 and 430: ELECTRON BEAM RECORDERS FOR AUTOMAT
- Page 431 and 432: data files are supplied as an 8 Bit
- Page 433 and 434: signals representative of map featu
- Page 435 and 436: composite photograph prepared to sh
- Page 437 and 438: Figure 5 16 AAIPS Approach Charts R
- Page 439 and 440: Figure 8 - LANDSAT Image Recorded i
- Page 441 and 442: AUTO-CARTO IV STAFF AND COMMITTEES
- Page 443 and 444: University of Kansas Mike Hogben A'
- Page 445 and 446: Efi Arazi, President Sci-Tex Corp.,
- Page 447 and 448: Peter F. Bermel Chief, Eastern Mapp
- Page 449 and 450: Sherry K. Brown Princeton Universit
- Page 451 and 452: Steven D. Clark Petroleum Informati
- Page 453 and 454: Richard Davis NOAA, NOS 6001 Execut
- Page 455 and 456: John Durkin Suiranagraphics 35 Bren
- Page 457 and 458: E. Porrest A-E-C Automation Newslet
- Page 459 and 460: Barry J. Glick Middlebury College M
- Page 461 and 462: Jim Hargis M & S Computing Co. 14 I
- Page 463 and 464: Howard C. Hopps Dept. of Pathology
- Page 465 and 466: Lee P. Johnston GeoGraphic Decision
- Page 467 and 468: Herbert Kressler Defense Mapping Sc
- Page 469 and 470: D. Richard Lycan Center for Pop. Re
- Page 471 and 472: Robert K. McKinney Weyerhaeuser Co.
- Page 473 and 474: Joel L. Morrison Dept. of Geography
- Page 475 and 476: David Osiecki 83 Gerber Rd. South W
- Page 477 and 478:
A.D. Poole Phillips Petroleum Co. 2
- Page 479 and 480:
Dirck L. Rotty USDA Forest Service
- Page 481 and 482:
Craig L. Shafer NFS 18 & C Street,
- Page 483 and 484:
Bobby Staudt M & S Computing 406 Au
- Page 485 and 486:
Laure Thompson George Mason Univers
- Page 487 and 488:
D.J. Walker Image Graphics 107 Ardm
- Page 489 and 490:
Alberta Auringer Wood Chairperson,
- Page 491 and 492:
AUTHOR INDEX - VOLUME II Allam, M.
- Page 493:
Schmidt, Warren E. ...............