Klaus Barwinski and Heinz Bruggemann Landesvermessungsamt ...
Klaus Barwinski and Heinz Bruggemann Landesvermessungsamt ...
Klaus Barwinski and Heinz Bruggemann Landesvermessungsamt ...

You also want an ePaper? Increase the reach of your titles
YUMPU automatically turns print PDFs into web optimized ePapers that Google loves.
DEVELOPMENT OF DIGITAL CADASTRAL AND TOPOGRAPHIC MAPS<br />
- REQUIREMENTS, GOALS AND BASIC CONCEPT -<br />
<strong>Klaus</strong> <strong>Barwinski</strong> <strong>and</strong> <strong>Heinz</strong> <strong>Bruggemann</strong><br />
L<strong>and</strong>esvermessungsamt Nordrhein-Westfalen<br />
Muffendorfer StraBe 19-21<br />
D-5300 B9nn 2<br />
Federal Republic of Germany<br />
ABSTRACT<br />
In North Rhine-Westfalia basic social facilities gain a<br />
special importance because of the impact of the densely<br />
populated <strong>and</strong> industrialized state on our environment. For<br />
their installment surveying <strong>and</strong> mapping offers current,<br />
detailed <strong>and</strong> exact maps in different scales. The possibili<br />
ties of map production by analoguous means are exhausted.<br />
Further developments can only be expected by the use of di<br />
gital production methods. The technical prerequisites for<br />
the installation of these methods are guaranteed. In the<br />
future the map user expects a more flexible availability of<br />
topographic-cartographic informations. To the conventional<br />
map series further editions should be added with other user-<br />
friendly graphic symbols <strong>and</strong> contents. But additionally the<br />
surveying <strong>and</strong> mapping agencies have to be prepared for the<br />
rapidly growing dem<strong>and</strong> for digital informations of the<br />
earth's surface. Therefore, we have to strive for the reali<br />
zation of a L<strong>and</strong> Information System (LIS), which can sup<br />
port the acquisition, storage <strong>and</strong> provision of cadastral,<br />
topographic <strong>and</strong> user-oriented data. In the nation-wide pro<br />
ject, the preparations for a digital cadastral map, the so<br />
called ALK, are nearly completed. For topographic maps in<br />
scales 1 : 5 000 <strong>and</strong> 1 : 25 000 first experiences were<br />
gained in data acquisition <strong>and</strong> data output. Suited storage<br />
models are being tested.<br />
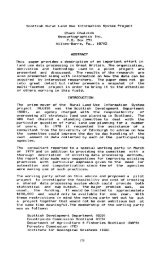
SURVEYING AND MAPPING IN NORTH RHINE-WESTFALIA<br />
Prerequisites<br />
North Rhine-Westfalia is the most densely populated state of<br />
the Federal Republic of Germany. During the industrializa<br />
tion periods many people were employed in the Rhine <strong>and</strong> Ruhr<br />
district; meanwhile large conurbations were developed in<br />
these districts. According to the growing population the de<br />
m<strong>and</strong> for housing areas, areas for transportation, private<br />
<strong>and</strong> public institutions for education, culture etc. in<br />
creased. Especially in North Rhine-Westfalia the dem<strong>and</strong> for<br />
industrial areas is considerable, because of softcoal mi<br />
ning, mineral coal mining, steal production <strong>and</strong> chemical in<br />
dustry. In order to supply the areas required <strong>and</strong> to secure<br />
certain living conditions as well, the development of basic<br />
social facilities were considered very important.<br />
Means of planning were developed <strong>and</strong> applied successfully in<br />
a wide range. Since society became more <strong>and</strong> more aware of<br />
76
the close relation between conurbations <strong>and</strong> natural resour<br />
ces, the provision of these social facilities also gained a<br />
new dimension since we do not want to endanger our own<br />
future.<br />
Official map series<br />
In these circumstances updated, exact maps in various scales<br />
become the important basis of all environment-related mea<br />
sures starting with the inventory <strong>and</strong> planning up to the re<br />
alization. The constantly growing dem<strong>and</strong> for maps for admi-<br />
nistrational or industrial purposes could be met up to now<br />
by the different official topographic maps offered by the<br />
surveying <strong>and</strong> mapping administrations.<br />
Official maps of North Rhine-Westfalia<br />
map series number of revision application examples<br />
sheets cycle<br />
cadastral<br />
map<br />
1 : 5 000 8629<br />
1 : : 25 000<br />
1 : : 50 000<br />
1 : ; 100 000<br />
photo map<br />
1 : 5 000<br />
photo map<br />
1 : 25 000<br />
270<br />
72<br />
19<br />
8629<br />
270<br />
permanent - property register<br />
- town planning<br />
- utility base maps<br />
5 years - "German Basic Map"<br />
- town planning<br />
- road planning<br />
5<br />
5<br />
5<br />
6<br />
5<br />
years<br />
years<br />
years<br />
years<br />
years<br />
- regional policy<br />
- environment protection<br />
- trail maps<br />
- military maps<br />
- regional maps<br />
- traffic maps<br />
- environment protection<br />
- archaeology<br />
(program started)<br />
In contrary to the cadastral maps which are continuously up<br />
dated, the maps in scales 1 : 5 000 to 1 : 100 000 have a<br />
revision cycle of 5 years. The photomap, scale I : 5 000, is<br />
renewed every 6 years, the photomap, scale 1 : 25 000, every<br />
5 years.<br />
Present production <strong>and</strong> distribution of maps<br />
The development of a map, beginning with a mainly military<br />
function in the beginning of last century up to its present<br />
status as environment-related basis for the prevision of so<br />
cial facilities, was accompanied with a fundamental change<br />
of the production method of maps. Only by means of this<br />
77
change the growing dem<strong>and</strong> for maps could be satisfied. Thus,<br />
the use of transparent foil since the middle of this century<br />
enabled an even stronger differentiation of cartographic ob<br />
jects according to their colours, <strong>and</strong> depending on various<br />
foil-combinations different map editions were possible. Even<br />
the production of thematic maps on the basis of topographic<br />
maps became very simple by adding a thematic foil, varia<br />
tions in scale, colours <strong>and</strong> sheet lines were possible as<br />
well. Still today the use of transparent foil influences the<br />
cartographic production method. According to present map<br />
production, map editions basically different of the ones we<br />
know today, can only be realized by a high expenditure of<br />
personnel, time <strong>and</strong> money.<br />
Future requirements<br />
In spite of the high st<strong>and</strong>ard of our official map series,<br />
they are more <strong>and</strong> more criticized:<br />
1) The map symbols should correspond to the knowledge of mo<br />
dern semiology. The basic graphic elements: area, colour<br />
<strong>and</strong> raster should be used more frequently.<br />
2) Different groups of users need different types of maps.<br />
3) The reliability <strong>and</strong> updating of maps does not meet the<br />
dem<strong>and</strong>s of the user.<br />
4) The possible combinations of situation <strong>and</strong> a special<br />
theme are limited by the number of foils used.<br />
This means that map users do not only want updated <strong>and</strong> exact<br />
maps but a more flexible presentation of the available topo<br />
graphic-cartographic information. The conventional map edi<br />
tions should be complemented by further editions with user-<br />
oriented graphic symbols <strong>and</strong> themes. Recently new editon<br />
possibilities have been introduced in the Federal Republic<br />
of Germany. The surveying <strong>and</strong> mapping agency of North Rhine-<br />
Westfalia also took part <strong>and</strong> introduced two edition possi<br />
bilities for maps in scale 1 : 25 000. These editions each<br />
with a different graphic representation <strong>and</strong> theme are meant<br />
for two different purposes. The first purpose, the map as<br />
planning material <strong>and</strong> scientific research basis, shows a<br />
geometric documentation of the earth's surface as complete<br />
as possible. In contrast to the conventional edition another<br />
graphic means - the area - was used in addition to new <strong>and</strong><br />
more map colours. The second purpose, the map as a means of<br />
orientation, stresses all elements necessary for the orien<br />
tation outside <strong>and</strong> does without any information useless for<br />
orientation. This can be seen by the different representa<br />
tion of housing areas <strong>and</strong> the addition of streetnames. In<br />
this edition the graphic elements: area, colour <strong>and</strong> raster<br />
are used more often than in the conventional one.<br />
In addition the surveying <strong>and</strong> mapping administrations have<br />
to face an increasing dem<strong>and</strong> for digital information of the<br />
earth's surface. New information systems are being developed<br />
for different purposes related to the earth's surface. The<br />
78
surveying <strong>and</strong> mapping administrations developed the program<br />
system "Digital Cadastral Map", a parcel-oriented informa<br />
tion system of high accuracy, which is meant to be the basis<br />
of user-oriented information for large scale maps. The de<br />
velopment of topographic-cartographic data-banks has only<br />
just begun. We want to realize a L<strong>and</strong> Information System<br />
(LIS) for the acquisition, storage <strong>and</strong> processing of topo<br />
graphic data as well as user-oriented data.<br />
DIGITAL MAP CONCEPT<br />
I have already mentioned that the use of transparent foil<br />
for cartographic production meant a new step of cartographic<br />
evolution <strong>and</strong> thus enabled surveying <strong>and</strong> mapping administra<br />
tion to meet higher dem<strong>and</strong>s of former times. The next step<br />
of cartographic evolution has begun with the development of<br />
computerized information systems, which we also want to use<br />
for the production of official maps. Only thus we shall be<br />
able to meet the increasing dem<strong>and</strong>s of the future. Below, I<br />
want to describe the development of a L<strong>and</strong> Information Sys<br />
tem which we have begun in North Rhine-Westfalia.<br />
Structure of the L<strong>and</strong> Information System<br />
A L<strong>and</strong> Information System comprises all information on our<br />
environment for a defined region - a township, a county or<br />
a state. It is different from other information systems be<br />
cause of a geometrical, a 3-dimensional component of each<br />
information. This enables direct access to information of a<br />
certain region but also dem<strong>and</strong>s special geometrically ori<br />
ented storage-structures which are difficult to h<strong>and</strong>le by<br />
conventional data-management-systems.<br />
All objects stored in a L<strong>and</strong> Information System need geome<br />
trical description based on coordinates. Therefore, special<br />
importance has to be given to a homogeneous, highly accurate<br />
horizontal <strong>and</strong> vertical control point net which serves as<br />
basis of the L<strong>and</strong> Information System. The surveying <strong>and</strong> map<br />
ping agency of North Rhine-Westfalia successfully uses<br />
methods of satellite geodesy, the Global Positioning System<br />
(GPS), in order to achieve this aim.<br />
The horizontal accuracy neccessary for practical purposes<br />
also influences the choice of scale usefull for cartographic<br />
representation. An information system for 3-dimensional data<br />
will, therefore, be devided in scale sections as long as<br />
automatic generalization is still impossible. For official<br />
mapping the following scale sections are planned: scales<br />
1 : 1, 1 : 5 000, 1 : 50 000, I : 250 000 <strong>and</strong> 1 : I million.<br />
These so called "Digital L<strong>and</strong> Models (DLM)" are based on<br />
each other <strong>and</strong> are meant to be the basis for all user-<br />
oriented information in the fields of planning, statistics,<br />
environment protection etc.<br />
The surveying <strong>and</strong> mapping agency of North Rhine-Westfalia<br />
has to develop the "Digital Cadastral Map" (DCM), <strong>and</strong> to<br />
gether with the different cadastral administrations, to<br />
realize this project <strong>and</strong> install the Digital L<strong>and</strong> Models,<br />
79
scales 1 : 5 000 <strong>and</strong> 1 : 50 000. The other scales belong to<br />
the responsibility of the Institute for Applied Geodesy.<br />
The Digital L<strong>and</strong> Model is object-oriented, <strong>and</strong> comprises the<br />
original information of the earth's surface, not the already<br />
deducted information of the map. The Digital L<strong>and</strong> Model can<br />
be divided in two components: a "Digital Situation Model"<br />
(DSM) consisting of all informations about the horizontal<br />
position of the objects <strong>and</strong> a "Digital Terrain Model" (DTM)<br />
consisting of all informations of the terrain modulation of<br />
a region. The DLM can be used to develop "Digital Cartogra<br />
phic Models (DCM)" which are the digital equivalent to our<br />
analogous maps.<br />
DLM, DCM <strong>and</strong> official map series<br />
Digital Cadastral Cadastral Maps 1 : 5 000 -<br />
Map (DCM) - 1:2 000<br />
DLM<br />
DLM<br />
DLM<br />
DLM<br />
5<br />
50<br />
250<br />
1000<br />
DCM<br />
DCM<br />
DCM<br />
DCM<br />
DCM<br />
DCM<br />
DCM<br />
5<br />
25<br />
50<br />
100<br />
200<br />
500<br />
1000<br />
German Basic Map 1 : 5 000<br />
Topographic Map 1 : 25 000<br />
Topographic Map 1 : 50 000<br />
Topographic Map 1 : 100 000<br />
Topographic Map 1 : 200 000<br />
General Map 1 : 500 000<br />
International Map of the<br />
World 1 : 1 000 000<br />
The development of a DCM is necessary since a map cannot be<br />
produced automatically from the original DLM because of its<br />
complex map symbols. Manual corrections of the DCM at an in<br />
teractive workstation are necessary in order to guarantee a<br />
correct graphic representation. In special cases these cor<br />
rections might be relatively extensive, therefore, it seems<br />
adviceable to store the corrected DCM also to reduce the<br />
time expenditure for the next map revision.<br />
In order to h<strong>and</strong>le such a L<strong>and</strong> Information System all sur<br />
veying <strong>and</strong> mapping administrations agreed on certain stan<br />
dards. The first step was the edition of a uniform object-<br />
catalogue for all objects represented in official maps. The<br />
catalogue for cadastral maps is already completed, for<br />
medium <strong>and</strong> small-scale maps it is being revised.<br />
In the second step to st<strong>and</strong>ardization a data-model was deve<br />
loped. According to their shape the objects were classified<br />
in point-shaped, line-shaped <strong>and</strong> area-shaped objects, <strong>and</strong><br />
additionally for each object the details relevant for repre<br />
sentation were given. E.g. for the object 'parcel 1 the de<br />
tails relevant for representation are parcel boundary <strong>and</strong><br />
parcel identifier.<br />
In a third step this data model was considered the basis of<br />
80
a st<strong>and</strong>ard-interface necessary for data exchange, the so<br />
called "Uniform Data Bank Interface" (UDBI).<br />
Further st<strong>and</strong>ards define the graphic representation of map<br />
objects <strong>and</strong> individual names of map objects (e.g. parcel<br />
identification, building identification). These elements can<br />
be used to link informations of the data file with files<br />
which do not contain any geometrical information.<br />
Because of practical reasons for the organization of the DLM<br />
maps will be the primary source of information. Only for re<br />
vision purposes it seems useful to use the countryside it<br />
self as main source but it also depends on the scale of the<br />
model revised. The DCM (equivalent to maps in scales 1 : 500<br />
- 1 : 2 000) is based solely on original surveying informa<br />
tions, the DLM 5 (equivalent to the map scale 1 : 5 000) is<br />
partly based on original surveying informations <strong>and</strong> partly<br />
on aerial photos; the models of smaller scales are based on<br />
aerial photos only but are controlled by field checks if ne<br />
cessary.<br />
The special advantage of a L<strong>and</strong> Information System is the<br />
variety of its products. Besides conventional official maps<br />
a whole range of different map editions will be available.<br />
Maps of each scale, of any map section, of any contents<br />
desired, <strong>and</strong> of any graphic representation dem<strong>and</strong>ed can<br />
then be offered to the user. Because of the linkage between<br />
all geometrical data files <strong>and</strong> those of other thematic in<br />
formation thematic maps can easily be produced.<br />
Digital production methods<br />
The organization of the L<strong>and</strong> Information System consists of<br />
two seperate parts: the storage of data on the one h<strong>and</strong> <strong>and</strong><br />
the processing of data on the other.'Not only the producer<br />
of this program-system (the surveying <strong>and</strong> mapping agency of<br />
NRW) shall be able to use all data stored but also the other<br />
users,( e.g. all cadastral administration i.e. townships in<br />
NRW). Therefore, a st<strong>and</strong>ardized, central large-capacity com<br />
puter is used. But we do not plan to store all possible DLM<br />
in the storage of this central computer. Especially the mo<br />
dels for the cadastral maps, will be stored decentralized<br />
in computers of each township concerned since in NRW the<br />
cadastral functions are carried out decentralized by the<br />
administration of each township county or community.<br />
Similar to the storage of the DLM data processing is also<br />
carried out decentralized e.g. in the cadastral administra<br />
tions of each township or the departments of the surveying<br />
<strong>and</strong> mapping agency in charge of a certain/map scale. Because<br />
of these complex programs <strong>and</strong> the integration of the differ<br />
ent operations an interactive graphic workstation should be<br />
used. The data/flow between the central computer <strong>and</strong> these<br />
interactive gr/aphic workstations is guaranteed by the<br />
st<strong>and</strong>ardized interface mentioned above, the so called "Uni<br />
form Data Bank- Interface".<br />
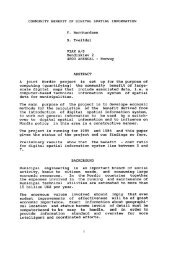
In this development stage of the LIS the surveying <strong>and</strong> map<br />
ping agency of NRW uses the special hardware configuration<br />
- figure 1 -, without scanner/ rasterplotter.<br />
81
This configuration is based on the special necessities of<br />
the program-system for the Digital Cadastral Map. The cen<br />
tral unit is a SIEMENS-computer; the data bank for the Di<br />
gital Cadastral Map is tested with a multipurpose data bank<br />
program-system <strong>and</strong> will soon be available for general use.<br />
In the departments of the surveying <strong>and</strong> mapping agency of<br />
NRW in charge of the production of different map scales<br />
vector based graphic computer systems are used for decen<br />
tralized data processing.<br />
The interactive graphic workstation will be the most impor<br />
tant tool of the user. This workstation was developed espe<br />
cially for the requirements of the DCM-project. It is, as<br />
already mentioned above, a vector-based system equipped with<br />
additional functions, e.g. for data acquisition, data revi<br />
sion <strong>and</strong> for data application (automated drafting or compu<br />
ting) . These functions can easily be modified according to<br />
the wishes of each individual user.<br />
This interactive graphic workstation is based on the inter<br />
national graphic st<strong>and</strong>ard, the so calles "Graphical Kernel<br />
System" GKS, which also implies a special organization of<br />
software - figure 2 -.<br />
This software is specially oriented according to cartogra<br />
phic requirements consisting of different sections for a<br />
graphic data bank, which enable the use of digitizers, menu-<br />
functions <strong>and</strong> complicated graphic representations. Thus,<br />
this workstation can be applied for many fields:<br />
- cadastre<br />
- soil evaluation<br />
- mapping of l<strong>and</strong> use<br />
- regional planning<br />
- development planning<br />
- mapping of cables <strong>and</strong> pipelines<br />
This program-system proves the capacity of the GKS also for<br />
complicated graphic applications <strong>and</strong> shows in every day pro<br />
gramming <strong>and</strong> application the advantages of such a graphic<br />
system.<br />
It is based on the highest level of the GKS, therefore, its<br />
portability is limited to computers, where GKS of the<br />
highest level can be implemented. The programs are written<br />
in FORTRAN 77. According to principles of software engi<br />
neering a special programming structure was developed to en<br />
able the programming of the components of the basic system<br />
<strong>and</strong> the application components.<br />
This vector-based graphic interactive workstation for the<br />
digital cadastral map meets all our requirements. But using<br />
this workstation for smaller scales soon shows its bounds.<br />
We estimated that data acquisition for a DLM 50 (equivalent<br />
to the maps scales 1 : 25 000 to 1 : 100 000) of North<br />
Rhine-Westfalia with conventional digitizing methods based<br />
on the maps, scale 1 : 25 000 <strong>and</strong> the momentary staff-capa<br />
city would take about 10 - 15 years. A second problem arises<br />
82
y the automated drafting of one sheet of the map, scale<br />
1 : 25 000. According to our experiences this takes about<br />
50 hrs (without contour lines) on a CONTRAVES-plotter with<br />
light-head.<br />
A solution of these problems could be the use of scanners<br />
for automated digitizing <strong>and</strong> of raster-based plotters for<br />
automated drafting. But we are not yet sure about how much<br />
acquisition expenditure scanners would actually save. The<br />
development of special software designed for the recognition<br />
of patterns <strong>and</strong> structures has only just begun. These pro<br />
grams still leave many details to manual correction <strong>and</strong><br />
addition especially considering the relatively complex<br />
symbols of topographic maps.<br />
The use of a raster-based plotter shows immediate efficien<br />
cy, instead. The problem of converting raster-data to<br />
vector-data is already solved, thus, the raster-based<br />
plotter could directly replace our vector-based one. An<br />
additional advantage of the raster-based plotter is, that it<br />
easily drafts areas of solid colour <strong>and</strong> screened areas.<br />
Because of the advantages of raster-based graphic data pro<br />
cessing the surveying <strong>and</strong> mapping agency of NRW considers to<br />
supplement the configuration with an efficient raster-based<br />
high precision plotter. We expect great advantages for the<br />
reproduction of maps, especially for colour seperates <strong>and</strong><br />
map printing. By means of this new high-precision plotter<br />
we hope to introduce data processing techniques in the pro<br />
duction process of topographic maps <strong>and</strong> orthophoto maps. We<br />
also expect that the raster-based techniques expedite the<br />
conversion process of the analoguous cadastral map to the<br />
digital cadastral map <strong>and</strong> in general also the development of<br />
a LIS in NRW.<br />
FIRST EXPERIENCES<br />
Since 15 years the surveying <strong>and</strong> mapping agency of NRW is<br />
using methods of graphic data processing. Not all develop<br />
ments which we started were successfully, <strong>and</strong> we also<br />
thought to manage the problem of automated generalization,<br />
meanwhile, we are sober to think that we are farer away of<br />
the solution of this problem than ever. We turned to closer<br />
problems: the processing <strong>and</strong> computing of mass-data of a<br />
LIS, the acquisition of topographic <strong>and</strong> other environment<br />
related data for cartographic data-banks, <strong>and</strong> their output<br />
in an either digital or analoguous way. Therefore, we<br />
finally developed an interactive graphic workstation as<br />
modern tool for all applications concerning a L<strong>and</strong> Infor<br />
mation System by applying many experiences we gathered with<br />
other previous systems. We used it e.g. to assist the revi<br />
sion of 100 maps, scale 1 : 25 000 by digitizing, control<br />
ling <strong>and</strong> correcting interactively 1,1 Million points in 4000<br />
hrs. The workstation was used successfully for the produc<br />
tion of thematic maps, for digitizing of cadastral maps <strong>and</strong><br />
for the development of a digital terrain model. Today we can<br />
offer a mature, multi-functional interactive graphic work<br />
station, which is compatible to all computers designed for<br />
high-st<strong>and</strong>ard graphic data-processing because of the GKS <strong>and</strong><br />
its pure modular structure.<br />
83
VAX 11/750<br />
MICROVAX II<br />
HIGH PRECISION PLOTTER<br />
DRUM PLOTTER<br />
SCANNER/RASTERPLOTTER<br />
GRAPHIC INTERACTIVE<br />
WORKSTATION<br />
Figure 1 : Hardware Configuration
geometrical data<br />
selecting •" •<br />
work<br />
output station J^<br />
object orien ted storage<br />
descriptive data<br />
— dig tizing<br />
— edil ing<br />
con structing<br />
— connputing<br />
1 *5fJresenting<br />
— pro cess ing of<br />
des criptive data<br />
picture<br />
storage<br />
input metafile<br />
» * * 3KS * » *<br />
Figure 2: concept of the interactive graphic workstation for the digital<br />
cadastral map<br />
85
TENDEX: A COMPUTERISED DATA BASE OF MINING<br />
TENEMENT INFORMATION<br />
D T PEARCE, ASSISTANT DIRECTOR, SURVEYS & MAPPING<br />
DEPARTMENT OF MINES<br />
MINERAL HOUSE<br />
66 ADELAIDE TERRACE<br />
PERTH WESTERN AUSTRALIA<br />
ABSTRACT<br />
The Department of Mines in Western Australia is<br />
responsible for the registration <strong>and</strong> processing of<br />
application for mining tenements.<br />
In a period of reasonable mining interest <strong>and</strong> activity,<br />
the number of applications lodged in the Department are in<br />
excess of 10,000 per year, rising to between 60,000-80,000<br />
in a boom year.<br />
Tendex is a computerised data base holding the most<br />
important attribute data against approximately 35,000<br />
tenements. It was designed as the first step in a<br />
building block approach to an eventual large data base<br />
managment system of tenement information, <strong>and</strong> scientific<br />
data connected to a geographic base.<br />
This paper outlines the philosophy, method <strong>and</strong> results of<br />
the Tendex system.<br />
IMPORTANCE OF MINING TO THE STATE<br />
The importance of mining to the economic well being of<br />
Western Australia can be gauged from the fact that in 1984<br />
the value of minerals extracted was almost $4.7 billion<br />
(Aus) of which the Government collected more than $180<br />
million in royalties, rent <strong>and</strong> fees. (See Fig 1)<br />
The Western Australian Mining industry contributed 30% of<br />
the total value of overseas trade for Australia <strong>and</strong> more<br />
than 80% of the value of W.A. mineral production is<br />
exported. (See Fig 2)<br />
There are currently 5 different types of tenement that<br />
maybe applied for to carry out exploration <strong>and</strong> mining<br />
under a new Act introduced in 1978.<br />
EL - Exploration lease<br />
ML - Mineral lease<br />
PL - Prospecting licence<br />
GPL - General purpose lease<br />
ML - Miscellaneous licence<br />
86
120'<br />
110-<br />
100-<br />
90-<br />
w 80'<br />
QC<br />
<<br />
_J<br />
i<br />
u.ro-<br />
o g 60'<br />
O _l<br />
i 50-<br />
40-<br />
30-<br />
20-<br />
10-<br />
Figure 1<br />
^^OT Diamonds<br />
|[ ||[ [[I Nickel<br />
___ I Alumina<br />
[ | Petroleum<br />
| ___ Iron Ore<br />
mnaaamm<br />
Mini<br />
Illllll! Tffffff<br />
ROYALTY REVENUE<br />
ffmiTT<br />
fl<br />
P i<br />
JX §<br />
u n<br />
1<br />
1975 1976 1977 1978 1979 1980 1981 1982 1983 1984<br />
87
MILLIONS OF DOLLARS<br />
Z O
Prior to that, more than 40 different types of tenements<br />
could be applied for under the original Act of 1904.<br />
At the end of 1985, more than 35000 tenement applications<br />
under the 1978 act had been lodged in the Department <strong>and</strong><br />
approximately 394000 under the 1904 act.<br />
Each tenement may have up to 70 items of information<br />
related to it, such as the name <strong>and</strong> address of the holder,<br />
Departmental file number, area, plan name <strong>and</strong> other legal<br />
dealing attributes.<br />
Since the beginning of this century <strong>and</strong> until recently<br />
all tenement information was recorded by h<strong>and</strong> in large<br />
leather bound volumes.<br />
Because of the vastness <strong>and</strong> remoteness of Western<br />
Australia, a system of registration offices was<br />
established in remote areas where tenement applications<br />
may be lodged in the field to avoid the long trip to Head<br />
Office in Perth, capital city of Western Australia. (See<br />
Fig 3)<br />
A duplicate set of registers is kept in each outstation<br />
covering tenement applications in that particular region.<br />
All tenements are plotted onto plans at various scales<br />
although mostly at 1:50 000 <strong>and</strong> a duplicate set of plans<br />
is maintained in each outstation similar to the registers.<br />
The Department is required to service the public <strong>and</strong> the<br />
mining industry by providing up to date information on all<br />
aspects of current applications <strong>and</strong> in particular,<br />
evidence that ground is available for pegging.<br />
The massive amount of information requiring recording,<br />
plotting <strong>and</strong> processing has severely strained the ability<br />
of the Department to maintain manual systems.<br />
In 1981/82 investigations were carried out into ways of<br />
computerising the information so that more efficient<br />
methods of recording <strong>and</strong> processing the tenement data<br />
would enable a better service to be provided to the<br />
industry <strong>and</strong> the Department.<br />
When an application for a mining tenement is lodged, it is<br />
allocated a file number <strong>and</strong> a tenement number. The State<br />
is divided into Mineral Fields for the purpose of<br />
administration <strong>and</strong> as the names are quite long a 2 digit<br />
code is used to precede the tenement member. Thus, a<br />
tenement applied for as an Exploration Licence in the<br />
Marble Bar District would carry a number like this - E 80<br />
3962.<br />
89
Unit 1<br />
Unit 2<br />
Unit 3<br />
Figure 3<br />
REGISTRATION OFFICES<br />
Administration area boundary<br />
Mining registrars office<br />
90<br />
APPLICATIONS<br />
1-1-84 TO 30-6-85<br />
UNIT1<br />
TENEMENT NUMBER AREA (ha)<br />
PL<br />
EL<br />
ML<br />
MISC.<br />
GEN<br />
PL<br />
EL<br />
ML<br />
MISC.<br />
GEN.<br />
PL<br />
EL<br />
ML<br />
MISC<br />
GEN.<br />
1873<br />
291<br />
260<br />
52<br />
6<br />
UNIT 2<br />
1717<br />
435<br />
199<br />
94<br />
21<br />
UNIT 3<br />
2155<br />
444<br />
309<br />
143<br />
35<br />
211468<br />
3184000<br />
37655<br />
1121<br />
155<br />
225866<br />
6327500<br />
17890<br />
6744<br />
404<br />
262720<br />
6411300<br />
46510<br />
6144<br />
591<br />
TOTAL 8034 16740088<br />
PL = PROSPECTING LICENCE<br />
EL = EXPLORATION LICENCE<br />
ML = MINING LEASE<br />
MISC. = MISCELLANEOUS LICENCE<br />
GEN = GENERAL PURPOSE LEASE
The application form (See Fig 4) contains all the data<br />
necessary for processing <strong>and</strong> in the event of disputes<br />
arising, marking off time <strong>and</strong> date may become an important<br />
issue.<br />
The type of data on the application form <strong>and</strong> the following<br />
legal transactions were ideal for computerisation <strong>and</strong> it<br />
was eventually decided to proceed with building a data<br />
base.<br />
Although the Department did not have a computer, the<br />
Central Government Computing Centre had sufficient space<br />
on a Vax 780 <strong>and</strong> terminals were installed in the<br />
Department <strong>and</strong> connected by l<strong>and</strong> line to the central<br />
computer about one kilometre away.<br />
The Department decided to proceed with building a data<br />
base <strong>and</strong> staff were trained <strong>and</strong> much enthusiasm<br />
prevailed.<br />
Due to inexperience with data base management systems, no<br />
structuring of the data was attempted <strong>and</strong> it was decided<br />
to simply take up all the data <strong>and</strong> work out any reporting<br />
functions at a later date.<br />
The data take up began in 1983 for a system known as MTIS<br />
(Mining Tenement Information System) with all data based<br />
on the tenement number.<br />
Temporary staff were engaged <strong>and</strong> the data were taken<br />
direct from the source documents, the h<strong>and</strong> written<br />
registers where the information was recorded most of the<br />
time, <strong>and</strong> certainly in the last 20 years, under pressure<br />
of continuous high level mining activity <strong>and</strong> the original<br />
entries were never checked.<br />
By mid - 1984, there were obvious signs of trouble. The<br />
error rate of data entry was very high <strong>and</strong> added to the<br />
errors in the original data, the whole validation process<br />
became unworkable. It proved conclusively the need for<br />
data to be checked <strong>and</strong> validated before entry.<br />
All data entry ceased <strong>and</strong> a working group investigated the<br />
problems <strong>and</strong> finally concluded that the original plan to<br />
take up so much data was too ambitious <strong>and</strong> recommended<br />
that a severely reduced system should proceed. At the<br />
same time, a project manager, missing from the first<br />
exercise was appointed to co-ordinate all the activities<br />
<strong>and</strong> to design <strong>and</strong> establish a new system.<br />
During 1984, an IBM 4341 computer was installed in the<br />
Department <strong>and</strong> some data had been transferred to it from<br />
the VAX 780.<br />
91
WESTERN AUSTRALIA<br />
Mining Act. 1978<br />
(Sees 41, 58. 74, 86. 91 Reg. 64)<br />
APPLICATION FOR MINING TENEMENT<br />
lI^To.,. (a) EXPLORATION LICENCE<br />
(b)<br />
» id) ' ** A *° (o<br />
a m /p m<br />
'GREY<br />
PILBARA<br />
CORDALE HOLDINGS PROPRIETARY LTD.<br />
CLpISTERS SQUARE<br />
PERTH, WA.A., 6000<br />
..?.i.?.!:l^£?....M.:J.9.._^!JJ...l...?JJ.!!.^9....?£JS. MM...<br />
..T.he..n£e. ..}..?. :.°... .^<br />
back to datiim<br />
92.40 km 2 [<br />
.L2^.m$]te£...<br />
306 "thence 4.2 km brg 2 16.'<br />
:;?«*""" ELIZABETH A. SMITH NOTE TYPE<br />
Where a general purpose lease— S 86 (1) or a miscellaneous licence— S 91 (1) is being<br />
applied lor the mining lease or mining tenement to which it relates should be staled<br />
U<br />
E<br />
O 3JECTIONS to this application may be lodged at the Mining Registrar' s office at../?r?£?<br />
24FEB1986<br />
no? ']/>l-
NEW SYSTEM<br />
Although there were several options available in<br />
developing a new system, certain constraints were imposed<br />
by the Department that had an influence on the final<br />
decision.<br />
The constraints were that no extra staff would be<br />
available <strong>and</strong> that in view of the time that had elapsed<br />
with the previous system, development time should be as<br />
short as possible.<br />
Although a massive amount of data had been taken up, it<br />
was unreliable <strong>and</strong> it was decided that the task of<br />
validating would be too great as compared to starting<br />
again. However, two small sub-systems had been maintained<br />
<strong>and</strong> although not validated, they provided the important<br />
data of a mining tenement such as the Department's file<br />
number, the tenement number, the name <strong>and</strong> address of the<br />
holder <strong>and</strong> some survey details including the plan name.<br />
These two systems, although on different computers <strong>and</strong> not<br />
related, provided an opportunity, if combined, for a small<br />
interim system to be developed that would allow a phased<br />
approach to the eventual large data base.<br />
The systems had been maintained daily by two separate<br />
divisions of the Department but in unsupervised <strong>and</strong> ad-hoc<br />
way.<br />
A complete print out of all information was made which was<br />
then validated with the source documents (registers) <strong>and</strong><br />
corrected. Plans were then made to combine the systems<br />
under the name Tendex, an acronym for Tenement Index.<br />
A number of other essential data items were identified <strong>and</strong><br />
finally, it was agreed that Tendex should contain the<br />
following data items:<br />
Tenement Number<br />
Holder's Name<br />
Holder's Interest (Active or Inactive)<br />
Holder's Address<br />
File Number<br />
Status (Live or Dead)<br />
Locality<br />
Description of Datum Point<br />
Mark Off Time<br />
Mark Off Date<br />
Lodgement Time<br />
Lodgement Date<br />
Date of Grant of Tenement<br />
Date of Death of Tenement<br />
93
Reason for Death of Tenement<br />
Local Council or Shire (by code)<br />
Public Plan<br />
Area Applied for<br />
Related Tenements<br />
Comments<br />
1: Million Index Map<br />
Survey Instruction<br />
Date of Survey<br />
Surveyed Area<br />
Diagram or Original Plan<br />
St<strong>and</strong>ard Plan<br />
Surveyors Name<br />
Surveyors Field Book<br />
Because of staff restrictions, an officer of the<br />
Cartographic Computing Section of the Surveys <strong>and</strong> Mapping<br />
Division was seconded to the project <strong>and</strong> with a contract<br />
programmer, began the job of writing programmes in the<br />
Focus language, a software package that was purchased with<br />
the IBM computer.<br />
During the review of the previous MTIS system, it was<br />
realised that the Department would ultimately require a<br />
huge date base of its information that would include the<br />
following:(See Fig 5)<br />
1. All the data listed in Tendex<br />
2. Additional legal Transactions with tenements<br />
3. Production reports<br />
4. Royalty payments<br />
5. Mineral statistics<br />
6. L<strong>and</strong> rehabilitation information<br />
7. Financial information such as rents, fees<br />
8. Technical reports on operations<br />
9. Geological information<br />
10. Data related to petroleum wells<br />
11. Data related to water bores<br />
12. A range of graphical data including maps<br />
The original philosophy of Tendex was that it would form<br />
an interim limited system only until the full data base<br />
was developed. It would provide useful experience for<br />
users in the general h<strong>and</strong>ling of a computerised system <strong>and</strong><br />
would provide answers to the most common enquiries made by<br />
the public <strong>and</strong> government ministers. It was agreed not to<br />
exp<strong>and</strong> it beyond the limits previously set unless there<br />
was a good reason to do so.<br />
94
-Technical Raport<br />
on operations<br />
-Interface with WAMEX<br />
- Graphic Applications<br />
Figure 5<br />
FUTURE DATA BASE<br />
— L<strong>and</strong> Schedules<br />
— Public Plans<br />
— Reserved L<strong>and</strong><br />
— Survey Instructions<br />
—Graphic Applications<br />
95
When Tendex became a live operational system, work would<br />
begin immediately on designing the large MTIS data base<br />
<strong>and</strong> although the data from Tendex would be used, the<br />
programmes <strong>and</strong> system would be discarded.<br />
Preliminary planning for Tendex began in February, 1985,<br />
<strong>and</strong> the system became live on November 1st, 1985.<br />
Almost immediately a number of enhancements were requested<br />
from users. A steering Committee had been set up<br />
initially to monitor the planning <strong>and</strong> all enhancements<br />
were examined by the committee to decide whether they<br />
should be included. Where it was seen that they system<br />
would be improved, the enhancements were built in.<br />
DATA ENTRY<br />
Data entry is carried out daily by two operators on<br />
separate input terminals. Entries are made from the<br />
tenement application forms that are lodged daily in the<br />
Department <strong>and</strong> those that are received by mail from the<br />
outstations. Transactions that take place after lodgement<br />
of these forms such as approvals, refusals, transfers,<br />
surrenders etc, are entered from internal forms that<br />
record such data.<br />
The data base is up to date with all information at the<br />
end of each day.<br />
At the end of every data entry session, an automatic print<br />
out is produced of all data entered for that session. A<br />
senior officer uses the print out to validate all data<br />
against the source documents.<br />
DATA ENQUIRY<br />
Many sections of the Department use the data daily <strong>and</strong> the<br />
public <strong>and</strong> mining industry presently make enquiries by<br />
telephone <strong>and</strong> through public counters in the Department<br />
<strong>and</strong> through the 15 outstations.<br />
Although the system is still under test (as of March) it<br />
is expected that between 20 <strong>and</strong> 30 terminals will be<br />
eventually operating to h<strong>and</strong>le all such enquiries. The<br />
outstations will also be progressively brought on live for<br />
enquiries.<br />
96
Enquiries can be made via the file number, the tenement<br />
number or the name of the holder <strong>and</strong> any or all of the<br />
data can be read on the screen or printed out if required,<br />
Programmes have been written for a number of report<br />
functions that are required frequently; such as:-<br />
(i) List all the tenements by type on a particular plan<br />
(ii) List all tenements owned by Company X in all<br />
districts or a particular district.<br />
(iii) List all tenements approved between two given<br />
dates.<br />
Other similar <strong>and</strong> more complex functions will be added as<br />
users became more confident with the whole operation.<br />
BENEFITS<br />
Tendex has provided faster access to a wide range of data<br />
for multiple users that previously took much time <strong>and</strong><br />
labour to obtain from the manual records.<br />
When the system is available to the public, these benefits<br />
will increase particularly with answers to telephone<br />
enquiries.<br />
However, there have been many side benefits that are worth<br />
mentioning. The need for accurate <strong>and</strong> up to date<br />
information to be computerised, has forced the Divisions<br />
of the Department to tighten up their existing records <strong>and</strong><br />
manual procedures <strong>and</strong> to introduce checking stages for all<br />
data entry.<br />
It is expected that manual registers in one Division will<br />
be discarded very shortly <strong>and</strong> time consuming manually<br />
compiled reports will be discontinued in another<br />
Division.<br />
DISADVANTAGES<br />
The Department runs a number of other computer systems<br />
based on the Focus data base language but the huge amount<br />
of data in Tendex has placed a strain on the storage <strong>and</strong><br />
processing capacity of the IBM.<br />
97
It was found that only 4 terminals could operate together<br />
on Tendex <strong>and</strong> the response times were too slow to consider<br />
a public system.<br />
In addition, it was realised that in its present form, the<br />
IBM would not be able to carry the capacity of the next<br />
stage, the development of MTIS.<br />
A computer consultant was engaged to recommend a solution<br />
<strong>and</strong> gave 5 options to be considered. The important<br />
criteria was to have a public system available as soon as<br />
possible <strong>and</strong> the option taken was to rewrite the<br />
programmes into COBOL language <strong>and</strong> run the system under<br />
CICS, (IBM Customer Information Control System); doing it<br />
in two stages.<br />
The enquiry system required internally <strong>and</strong> for the public<br />
would be done first with expected completion by May 1st<br />
<strong>and</strong> followed by the update function, expected completion<br />
by June 30th.<br />
At the same time, the opportunity will be taken to correct<br />
a number of design faults in the original system, brought<br />
about by the pressure to complete it quickly.<br />
It is expected that at the completion of the<br />
modifications, the Department will have an excellent up to<br />
date data base of mining tenement information that can be<br />
accessed through 20 to 30 screens including at least one<br />
outstation.<br />
GRAPHICS<br />
One of the most important requirements of the Department<br />
is to provide graphical information about mining tenements<br />
<strong>and</strong> this is currently done through the mapping system.<br />
However, it is planned to support TENDEX <strong>and</strong> ultimately<br />
the MTIS, with a graphic system.<br />
There are two main options that have been considered:<br />
(i) A complete capture of all tenement boundaries plus<br />
the topographical <strong>and</strong> cadastral bases<br />
(ii) A limited capture only of the boundaries of the very<br />
large tenements, a centroid or co-ordinate value of<br />
all other tenements <strong>and</strong> a main framework only of<br />
topographic <strong>and</strong> cadastral information<br />
98
The first option, while considered to be the best, is<br />
beyond the Departments resources in the next 10 years.<br />
The second option could be achieved in one year <strong>and</strong> would<br />
provide very useful spatial data as almost all enquiries<br />
about tenement data includes a "where is it" question.<br />
Much of the surveyed data has been captured on other<br />
systems in the Department both manual <strong>and</strong> computer, <strong>and</strong><br />
much of the main topographic features have a co-ordinate<br />
reference in a names file of another department.<br />
The proposed plan is to manually digitise the centroid of<br />
each small tenement, (by eye only) <strong>and</strong> to digitise the<br />
boundaries of the large exploration tenements. This will<br />
be done from existing plans <strong>and</strong> as new tenements are<br />
plotted, a co-ordinate value will be read <strong>and</strong> entered into<br />
the data base. A complete plan or portion only could be<br />
printed out to support an inquiry. (See Figs 6 ,T)<br />
A l<strong>and</strong> information system is being developed in other<br />
State Government Departments <strong>and</strong> in the long term it is<br />
expected that the cadastral <strong>and</strong> topographic data base of<br />
that system will be interfaced with the MTIS <strong>and</strong> will be<br />
on line to the Department.<br />
The Department is also involved in geological mapping but<br />
at this stage, there are no plans to computerise any areas<br />
although it will be one of the long term considerations.<br />
Other future possibilities include the loading of parts of<br />
the data base onto a video-tex system to provide greater<br />
<strong>and</strong> faster access for the industry.<br />
A problem in placing computers in the outstations, is<br />
combating the erratic fluctuation of power that occurs <strong>and</strong><br />
the problems of dust. Many outstation areas of Western<br />
Australia are like being on the edge of the Sahara Desert<br />
where heat <strong>and</strong> red s<strong>and</strong> prevail. The use of Video-tex<br />
could solve this problem.<br />
The Departments wide range <strong>and</strong> variety of information will<br />
undoubtedly fill a very large management data base in the<br />
future.<br />
The development of Tendex has created the first foundation<br />
stone <strong>and</strong> the next few years will see this added to with<br />
what promises be exciting use of new technology.<br />
99
Figure 6 MAP OF TENEMENT CENTROIDS DOCKRELL
DOCKRELL<br />
Figure 7 ACTUAL TENEMENT MAP
THE BURNABY EXPERIENCE<br />
WITH COMPUTERIZED MAPPING<br />
V.N. Wiebe, P. Eng.<br />
Corporation of Burnaby<br />
4949 Canada Way<br />
Burnaby, B.C., Canada, V5G 1M2<br />
ABSTRACT<br />
In 1976 the Corporation of Burnaby decided it was time to review<br />
its maps. We found that the old maps which had been produced<br />
prior to 1939 contained many errors <strong>and</strong> that the maintenance of<br />
our maps was very costly because of the variety <strong>and</strong> number of<br />
documents which were involved each time a correction <strong>and</strong>/or<br />
addition had to be made. It was also at this time that our<br />
Federal Government began talking about converting everything to a<br />
metric st<strong>and</strong>ard. Recognizing that the other utility companies,<br />
which serve our Municipality, would be faced with similar<br />
problems, we put forward a proposal to undertake a joint project<br />
to explore the computerized approach to map production <strong>and</strong> the<br />
h<strong>and</strong>ling of a broad spectrum of facilities information.<br />
The pilot project (BJUMP) proved conclusively that<br />
computerization was a viable alternative to manual remapping <strong>and</strong><br />
now, after some ten years of experience, we have come to the<br />
realization that the maps are only the tip of th iceberg. A<br />
greater benefit of having such a system is the spatial data base<br />
which allows us to use the system as a powerful tool for analysis<br />
<strong>and</strong> not just as a record keeping system.<br />
CORPORATION RESOURCE<br />
For the past 35 years, computing systems have been used by<br />
municipal governments to maintain financial records, issue<br />
cheques, record inventories of equipment, etc., in essence, most<br />
communities have a computer of some description. However, during<br />
the past eighteen months, we at Burnaby have been studying our<br />
information needs throughout the Municipality <strong>and</strong> with the<br />
assistance of our consultant, R. Liley <strong>and</strong> Associates, have<br />
concluded that more than 70% of the information maintained by<br />
Burnaby has a spatial or geographical relationship. Burnaby now<br />
considers INFORMATION AS A CORPORATE RESOURCE <strong>and</strong> as such, it<br />
should accommodate individual <strong>and</strong> departmental needs <strong>and</strong> be<br />
accessible by all. Although the current recession has put a very<br />
definite emphasis on restraint in every facet of our operation,<br />
the elected officials continue to dem<strong>and</strong> a higher level of<br />
service <strong>and</strong> additional information to keep them well informed.<br />
It is our conclusion that the only way to meet this dem<strong>and</strong> is<br />
with high tech information systems.<br />
During the early 1970's we at Burnaby became increasingly aware<br />
that our 50-year old maps, plus or minus a few years, no longer<br />
102
were adequate for the level of detail <strong>and</strong> accuracy required in a<br />
1970's organization.<br />
Although maps seem to be taken for granted <strong>and</strong> recognized as<br />
important documents, no one seemed prepared to budget for a new<br />
set of composite maps. It continually seemed that the cost of<br />
producing new maps was high <strong>and</strong> the benefit was "it only looked<br />
better".<br />
Over the past ten years this perception has changed in Burnaby<br />
<strong>and</strong> we have come to recognize the importance of accurate maps.<br />
What brought about this change?<br />
JOINT VENTURE<br />
The Municipality of Burnaby is one of twelve communities making<br />
up the Greater Vancouver Regional District. Each of these<br />
communities, plus a number of private utility companies operate<br />
facilities within the Regional District <strong>and</strong> have historically<br />
drawn their own maps. Although each of these jurisdictions had<br />
different requirements for accuracy, level of information <strong>and</strong><br />
purpose for the information, there was one common denominator;<br />
each agency is concerned about the same geographic area.<br />
This lead us to believe that possibly other map users within our<br />
Municipal boundaries were also beginning to realize that they<br />
needed new maps.<br />
The two major map users besides the Municipality are B.C. Hydro,<br />
representing gas <strong>and</strong> electric facilities, <strong>and</strong> B.C. Telephone, <strong>and</strong><br />
upon enquiry we confirmed that both utilities were facing the<br />
same need to remap <strong>and</strong>, in fact, had already started to explore<br />
the application of computer assisted techniques.<br />
At the same time, during the summer of 1975, the Canadian Federal<br />
Government indirectly came to the Municipality's aid by<br />
suggesting that Canadians would henceforth convert to metric<br />
measurement as part of Canada's push towards a closer trading<br />
relationship with the European community.<br />
Recognizing the fact that we were having difficulty convincing<br />
our management to budget for manual remapping <strong>and</strong> the fact that<br />
two other prime map users in Burnaby were already involved in a<br />
remapping program with the use of computer assisted techniques,<br />
we proposed the formation of a task force composed of members<br />
from each of the major map users to investigate the feasibility<br />
of creating one common base map, with the aid of computers, to be<br />
used by each agency. In turn, each agency would enter their<br />
respective facilities onto the system so as to be available to<br />
all users.<br />
The task force completed a feasibility report in 1976 January,<br />
which concluded that computer assisted mapping would:<br />
103
(1) be approximately three times faster than the conventional<br />
manual approach;<br />
(2) be less expensive, especially as the work volume<br />
increases;<br />
(3) be easier <strong>and</strong> quicker to maintain <strong>and</strong> update;<br />
(4) provide an "end" product which would be a total<br />
information base with infinitely more flexibility than the<br />
conventional map.<br />
PILOT PROJECT<br />
Formation<br />
Although the CAM approach appears to be far superior to the<br />
manual approach, it must be pointed out that much of the data on<br />
the existing maps <strong>and</strong> the time, cost <strong>and</strong> performance projections<br />
were not very definitive, <strong>and</strong> that to obtain more meaningful<br />
information a significant amount of mapping would have to be<br />
performed using a CAM system.<br />
From the foregoing conclusions came the recommendation that the<br />
participating agencies undertake a one year pilot project using a<br />
computer assisted mapping system to obtain more definitive<br />
information regarding manpower, equipment costs <strong>and</strong> overall<br />
benefits for computer assisted map conversion <strong>and</strong> maintenance.<br />
The task force spent almost a year establishing the parameters of<br />
the pilot project, doing preparatory work such as field survey<br />
<strong>and</strong> photogrammetry, selecting a system supplier, negotiating with<br />
labour unions representing operators from each of the<br />
participants, selecting <strong>and</strong> training operators, <strong>and</strong> convincing<br />
their respective managements that the computer assisted mapping<br />
technology was sufficiently advanced to recommend the leasing of<br />
such a system for the pilot project.<br />
Some of our more successful arguments were that firstly, our<br />
Federal Government was recommending that the country would<br />
convert to metric measurement <strong>and</strong> secondly, that some of the<br />
other large map users were "leaning" very heavily towards the use<br />
of computer assisted technology <strong>and</strong> we did not want to fall<br />
behind. A third argument, which may very well have been the most<br />
convincing one, was that in the long term there could be some<br />
staff reductions.<br />
The Burnaby Joint Utility Mapping Pilot Project (BJUMP) began<br />
operation in 1976 December when we took delivery of a Synercom<br />
ST-700 mapping system. For the next fourteen months members of<br />
BJUMP worked with the technology to assess all facets of<br />
computer-aided map production <strong>and</strong> maintenance.<br />
Level of Accuracy<br />
104
Many papers have discussed the question of what level of accuracy<br />
one should aim for when developing base maps. We concluded that<br />
the agency with the highest accuracy requirements should be<br />
responsible for base map development, production <strong>and</strong> maintenance.<br />
In most instances this would be the municipality. Very early in<br />
the pilot project it became apparent to all participants that to<br />
digitize directly from the existing maps would not give us the +1<br />
meter level of accuracy which we had set as our absolute minimum.<br />
Our decision was to use coordinate geometry to enter each line<br />
mathematically. For the sake of saving time we chose to use<br />
photogrammetric methods to obtain our required control points.<br />
The latter consisted of survey monuments, survey pins, gas valve<br />
<strong>and</strong> manhole covers, etc., which had been painted to ensure<br />
identification.<br />
These "targets" were all identifiable on aerial photographs, <strong>and</strong><br />
by using analytical aerotriangulation were given Universal Trans<br />
Mercator (UTM) coordinates. (UTM coordinates are true<br />
rectangular coordinates on a grid parallel to a central meridian,<br />
which in Burnaby is 123 degrees west <strong>and</strong> perpendicular to the<br />
equator.)<br />
Using these photogrammetrically derived control points <strong>and</strong> the<br />
original air photos, we were able to produce orthophotos which<br />
show the targetted control points, all of which can be used when<br />
digitizing/directly from the orthophotos. This procedure<br />
increased our accuracy to something in the order of +_0.2 m.<br />
This method was the primary source for base map production in<br />
BJUMP. In some areas where there were difficulties in<br />
reconstructing the irregular <strong>and</strong> curved cadastre from the<br />
orthophotos, a method using coordinate geometry (COGO) was<br />
employed <strong>and</strong> the resulting maps are virtually of legal map<br />
plotting accuracy.<br />
Although this decision contributed to a reduced rate of<br />
production <strong>and</strong> increased costs, we can now look back <strong>and</strong> state<br />
that it was well worth it as the benefits definitely outweighed<br />
the added costs of production delays.<br />
Some of the benefits of having produced higher quality maps are<br />
that:<br />
(1) we can extract <strong>and</strong> rotate any portion of the base map as<br />
necessary to suit the required orientation for<br />
construction plans <strong>and</strong> profiles;<br />
(2) we can merge individual sheets or portions thereof <strong>and</strong><br />
produce composites of a larger area at reduced scales;<br />
(3) we will be able to use the information stored in the<br />
system for the future preparation of design plans,<br />
105
profiles <strong>and</strong> c.ross sections; <strong>and</strong><br />
(4) we will not have to remap to improve accuracy because each<br />
facility will be referenced to true world positions.<br />
DEVELOPING THE BASE MAP<br />
Agreement<br />
With the completion of BJUMP in 1978 February the Municipality<br />
exercised their option to purchase the Synercom system <strong>and</strong><br />
established a work schedule to produce a complete set of new base<br />
maps which would serve the needs of the many users in our<br />
community.<br />
The other two participants in BJUMP also gained the information<br />
they needed to convince their Board of Directors to purchase<br />
their own CAM systems, which each one has now done. Having<br />
purchased their own respective systems for province-wide mapping,<br />
each of the utility companies entered into an agreement with the<br />
Municipality to provide us a copy of their utility information in<br />
digital form in exchange for updated base maps from the<br />
Municipality.<br />
Features<br />
Some features of the Burnaby system which I would like to mention<br />
are map components, property identifiers, facets, versatility<br />
with respect to conversion between imperial <strong>and</strong> metric<br />
measurements <strong>and</strong> versatility with respect to isolating r<strong>and</strong>omly<br />
sized "windows".<br />
Maps contain three basic elements, namely, lines, symbols <strong>and</strong><br />
annotation; our task is to develop a cartographic base showing<br />
the cadastre in a format that is acceptable <strong>and</strong> useful to a<br />
variety of- users.<br />
Illustrations 1, 2, 3 <strong>and</strong> 4 show how we have built our base in<br />
order that each user is able to display the cadastre in a form<br />
that he or she requires.<br />
In Burnaby we have assigned a twelve-digit property identifier to<br />
each of the approximately 43,000 properties. This identifier<br />
consists of three basic elements; the first four digits represent<br />
the name of the street or avenue, the next four digits represent<br />
the civic address <strong>and</strong> the last four digits are reserved for the<br />
suite number. Using this number one can then get such<br />
information as the complete legal description, the street name,<br />
<strong>and</strong> the property owner's name. Other non-graphic statistics will<br />
be available in the future as other departments come on-line.<br />
The creation of a uniformly sized facet (50 cm by 80 cm at a<br />
scale of 1:1000) covering an area 500 metres by 800 metres<br />
eliminates the problems of eighteen r<strong>and</strong>om sized strip maps as<br />
well as the problems of overlaying a strip map or portion thereof<br />
106
Figure No. 1<br />
VICTORY ST.<br />
Block lines <strong>and</strong> street names<br />
IO2093I<br />
OIP36<br />
not<br />
!S 2 ?!<br />
DIPS*, !<br />
Figure No. 3<br />
;<br />
8 J<br />
1 mt 1<br />
»«<br />
8<br />
8 ?<br />
: 12 =<br />
'",62<br />
VICTORY ST. 3270<br />
Civic addresses, dimensions<br />
<strong>and</strong> legal descriptions<br />
107<br />
10289.51<br />
OIP.53<br />
Figure No .2<br />
Survey control information<br />
I 0<br />
Figure No. 4<br />
VICTORY ST 3270<br />
Attribute information<br />
pertaining to 4711 Victory St
with a contour <strong>and</strong>/or facilities map. However, the user is not<br />
restricted to displaying only predetermined facets as the system<br />
has the capability of plotting any area, whether it be a part of<br />
one facet or whether it spans a number of facets. This allows<br />
the user to zero in on an area as small as a survey monument <strong>and</strong><br />
display it at an enlarged scale.<br />
The system also has the versatility to convert information which<br />
was entered in imperial units to metric units, <strong>and</strong> vice versa.<br />
It can also adjust the scale almost infinitely between 1:200 to<br />
1:1,000,000.<br />
FACILITIES<br />
With the completion of our base maps, we now have the skeleton<br />
which is necessary to support facilities information, contours<br />
<strong>and</strong> countless other geo-based information. This phase is the<br />
core for an effective <strong>and</strong> efficient engineering office in a local<br />
government setting. We must have good quality up-to-date<br />
information which is readily accessible. We are currently<br />
involved in data entry (again using coordinate geometry) for the<br />
conversion of our facilities information such as waterworks,<br />
sewers, drainage, roads <strong>and</strong> street lighting networks to the<br />
computer assisted system, our current projection is to have this<br />
phase completed by the end of 1987.<br />
Let's now look, in a little more detail, at exactly what we mean<br />
by facilities information. As an example, I will use a portion<br />
of Burnaby's waterworks system. The basic element in a<br />
waterworks distribution system is the water main or line which is<br />
generally located within the public road allowance. The second<br />
element is the water main fittings such as valves, service<br />
connetions, hydrants, meters, bends, adapters, couplings, etc.,<br />
<strong>and</strong> the third element is the annotation relating to each of the<br />
fittings. This could include such information as size, type,<br />
date of installation, position (open or closed), number of turns<br />
required to open, manufacturer, reference number <strong>and</strong> condition.<br />
Everything, except the annotation, can be displayed graphically.<br />
With all the aforementioned information loaded into the system,<br />
the computer can now exercise its capability to draw a map of<br />
Burnaby, or any chosen portion thereof, showing only 150 mm<br />
diameter water mains; or giving us a complete listing of all<br />
streets which have a water main less than 150 mm in diameter; or<br />
providing a complete tabulation of all asbestos water mains,<br />
including sizes <strong>and</strong> lengths. As you can see, this is the type of<br />
information which would be invaluable when preparing a water main<br />
replacement program.<br />
As each of the facilities is entered into the system, we will<br />
have similar applications for each of them. To make such an<br />
analysis manually would have taken many weeks at a high cost. By<br />
using the system, the results were produced in minutes <strong>and</strong> at a<br />
108
fraction of the cost. This is significant to our community<br />
because the infrastructure of water mains, sewers <strong>and</strong> roads is<br />
the backbone of the Municipality <strong>and</strong> a large percentage have been<br />
in service for over thirty years. It is therefore reasonable to<br />
project that much of our infrastructure will have to be replaced<br />
within the next ten to fifteen years.<br />
However, facilities are not restricted to our physical<br />
infrastructure. They may include l<strong>and</strong> use zoning, traffic<br />
accident details, crime statistics, population distribution,<br />
property ownership <strong>and</strong> much more.<br />
MANAGEMENT INFORMATION SYSTEM<br />
Although we are continually finding new uses for our automated<br />
mapping facilities management system, we must look beyond this to<br />
the broader subject of information management. At Burnaby we are<br />
in the process of developing an integrated information management<br />
system. We recognized that the computerized mapping technology<br />
was changing to concentrate on spatially-oriented data bases. We<br />
also began to recognize that the fragmentation of information<br />
systems was costly <strong>and</strong> prevented us from taking advantage of the<br />
inherent synergy of an integrated information management<br />
approach.<br />
In order to further study the feasibility of developing a plan<br />
for integrating all of the Municipality's information systems the<br />
Municipality, in late 1983, retained the consulting services of<br />
R. Liley <strong>and</strong> Associates. The consultants report entitled "A<br />
Strategic Plan for Information Management" (Liley, 1984) included<br />
the following recommendation:<br />
"Information systems were required to support overall<br />
Municipal operations <strong>and</strong> management decision-making."<br />
The report also presented a new configuration for Burnaby's<br />
electronic information network as illustrated in Figure #5 <strong>and</strong><br />
outlined a system design concept based on the following premises:<br />
(1) access to the computer systems will be provided throughout<br />
the Corporation. In most cases the manual systems will be<br />
replaced by a computer system;<br />
(2) many of the applications will cross departmental<br />
boundaries <strong>and</strong> pervade the operation <strong>and</strong> management of the<br />
Corporation;<br />
(3) individual applications will be conceived around data<br />
bases. This approach, rather than the more traditional<br />
one of appending data bases to specific applications,<br />
should significantly increase flexibility <strong>and</strong> result in<br />
systems which have longer term viability for the<br />
Corporation.<br />
109
ELECTRONIC INFORMATION NETWORK OVERVIEW<br />
FIGURE NO. 5<br />
110
Having come through the various stages of this evolution, Burnaby<br />
is only now beginning to reap some of the many benefits which<br />
will improve productivity <strong>and</strong> services at all levels. Benefits<br />
such as on-line inquiry through a single work station, paperwork<br />
simplification, staff cost avoidance, the ability to respond to a<br />
changing environment, the ability to control <strong>and</strong> manage costs,<br />
improved levels of service <strong>and</strong> management control. In addition<br />
there will be many intangible benefits such as the availability<br />
of more complete <strong>and</strong> better information for decision-making <strong>and</strong><br />
planning, job enrichment as employees come in contact with the<br />
computer <strong>and</strong> greater reliability of information.<br />
CONCLUSION<br />
The Corporation of the District of Burnaby has been a leading<br />
user of information systems in local government. The<br />
Municipality has pioneered the use of automated mapping <strong>and</strong>, by<br />
virtue of having a digital map of the Municipality, has been able<br />
to proceed to the next logical step of marrying non-graphic<br />
geobased data to the mapping system. It is now moving<br />
successfully into the total integration of Municipal Information<br />
Systems, having recognized that information is a key corporate<br />
resource <strong>and</strong> should be managed as such. The use of electronic<br />
data processing to h<strong>and</strong>le the routine day-to-day business of the<br />
Municipality will of itself realize significant benefits in terms<br />
of productivity <strong>and</strong> quality of services offered. The information<br />
that is captured through transaction processing will also provide<br />
significant benefits in terms of performance planning <strong>and</strong><br />
measurement. However, the synergistic benefits arising from the<br />
integration of systems will potentially outweigh the routine<br />
benefits provided by automation of the normal transaction<br />
processing. This integration is vital because the majority of<br />
municipal data is geobased.<br />
ACKNOWLEDGEMENTS<br />
I would like to thank Harry Christie for his assistance in<br />
preparing this paper <strong>and</strong> for the opportunity to participate in<br />
Auto Carto London.<br />
REFERENCES<br />
Liley, R.W. (1984) A Strategic Plan for Information Management.<br />
111
A LANDINFORMATION SYSTEM (LIS) FOR AN URBAN REGION<br />
Erich Wilmersdorf<br />
Council of Vienna<br />
MD-ADV/Graph. Datenverarbeitung<br />
RathausstraBe 1<br />
A - 1082 Vienna<br />
1. ABSTRACT<br />
Urban regions are marked by a high density of objects on<br />
the surface <strong>and</strong> below. The management how to make use of<br />
the available space is a continous process of planning,<br />
execution <strong>and</strong> administration. The knowledge of the local<br />
relationship is an important prerequisite for controlling<br />
these processes. The paper describes the state of the art<br />
of an geographic system in operation in the municipality of<br />
Vienna (Austria). In detail a description is given of the<br />
production line starting from different types of data<br />
collection until the automated production of multipurpose<br />
cartographic output such as st<strong>and</strong>ardized large scale maps,<br />
special <strong>and</strong> thematic maps. The features of the data bases<br />
<strong>and</strong> the ways of maintaining them are mentioned as well. As<br />
a long range objective it is envisaged that all geographic<br />
data processing should be automated by ADP <strong>and</strong> fully<br />
supported by computer graphics. Therefore a detained model<br />
of the urban region has to be stored in the near future<br />
comprising a broad variety of data with geographic<br />
relationship.<br />
2. DATA COLLECTION<br />
2.1 Requirements<br />
Basically it is envisaged to include step by step the<br />
inventory of objects which are described already in<br />
different types of graphic documents. Priority is given to<br />
the capture of topographic data. Underground, objects <strong>and</strong><br />
town planning themes will be inserted subsequently.<br />
According to the needs of users data are captured with the<br />
utmost accuracy of geodetic data, the highest degree of<br />
geometric detail, classification <strong>and</strong> keying facility.<br />
Therefore it is likely that the central data base will be<br />
able to fit all requirements <strong>and</strong> it can be prevented, that<br />
separated <strong>and</strong> redundant data must be maintained for special<br />
purpose.<br />
112
2.2 Data sources<br />
2.2.1 Field measurements<br />
2.2.2.1 Digital tacheometry. The most accurate method of<br />
data collection is applied in the road area, where available<br />
space is scarce <strong>and</strong> conflicts of interests have to be solved<br />
frequently. The council of Vienna decided to survey the<br />
complete network of streets in order to get reliable data in<br />
these sensible areas of the town. The final result will be a<br />
complete framework of precise geographic data.<br />
Features of this measuring method are:<br />
. Coding in the field<br />
. partitioned data set per street segment<br />
. generating derived geometric elements (e.g. parallel<br />
lines for rails, walls; completing rectangular objects,<br />
composing segments)<br />
. highly automated dataflow from the field to the<br />
plotter (linework included)<br />
The remaining bloc area is filled up by photogrammetrie<br />
measurement (2.2.2).<br />
2.2.1.2 Survey plans. The large archives of maps <strong>and</strong><br />
survey plans represent a useful stock of geodetic data. By<br />
manual digitising of existing analogue documents, mostly<br />
road planes 1:200, additional data are obtained. The<br />
digitised data are adjusted by control points. The final<br />
datafile resembles that of a field measurement in the<br />
tachometric mode.<br />
2.2.2 Photogrammetrie measurements. In the early stage<br />
analogue documents of a stereoplotter had to be digitised<br />
completely. Now, the photogrammetric model is measured<br />
analytically <strong>and</strong> stored during the interpreting process.<br />
These digitised data represent a supplement of the skeleton<br />
built up by ground survey.<br />
2.2.3 Existing maps<br />
2.2.3.1 Manual digitising versus scanning. Due to the<br />
vast extent of analogue sources digitising is still the<br />
bottleneck of geographic data processing. Efforts in the<br />
last years had been made to automate the digitising process.<br />
Scanning <strong>and</strong> a subsequent vectorisation has successfully<br />
proved its feasibility in several applications.<br />
Although scanning does not signify a fully automated data<br />
capture - interactive postprocessing is still necessary -<br />
it is a fact, that it can alleviate the nearly invincible<br />
task of compiling the vast amount of existing analogue<br />
documents.<br />
113
2.2.3.2 State of the art of scanning methods. In<br />
practice the range of economic scanning is dependent on<br />
the graphic quality of the document <strong>and</strong> its complexity<br />
in terms of lines, symbols <strong>and</strong> text. Recognition of lines<br />
together with a rough classification according to the line<br />
width <strong>and</strong> line pattern can be an economic counterpart to<br />
manual digitising. Further advantages are expected by more<br />
sophisticated pattern recognition for symbols <strong>and</strong> text.<br />
Then scanning will become more economic due to increased<br />
possibility of automated classification <strong>and</strong> keying.<br />
The recent production line makes use of manual offline<br />
digitising, scanning, interactive editing or a combination<br />
of those methods.<br />
2.3 Assembling of different data sources<br />
In the last processing stage of data collection all these<br />
different kinds of source data have to be checked, merged<br />
<strong>and</strong> harmonized.<br />
2.3.1 Geometric adjustment. This complex task is done<br />
partly automated (within a tolerable range) partly<br />
interactively.<br />
Digitised or scanned data are adjusted by means of control<br />
points.<br />
Manual digitised <strong>and</strong> scanned data are composed.<br />
Photogrammetric data are adjusted to identical ground survey<br />
data.<br />
2.3.2 Overall coding system. For each measuring device<br />
a special coding system is used to minimize operator's input,<br />
After checking automatically the codes additional data are<br />
derived. In the final stage the isolated coding systems had<br />
to be fitted into a comprising overall coding system.<br />
3. USING THE DATABASES<br />
3.1 Types of databases<br />
3.1.1 Local reference system. In the first step a<br />
reference system was built up covering the whole area of the<br />
city. It is based on a hierarchical order of areas ranging<br />
from district to the bloc (census tract, bloc) <strong>and</strong> a street<br />
network (crossing point as nodes).<br />
3.1.2 Topographic database. Is still in the process<br />
of building up. It represents a detained description of<br />
topographiy separated into features combined with an<br />
geographic inventory of objects. It contains<br />
114
- geodetic data<br />
partly threedimensional of different qualities<br />
(according to source data)<br />
- classification of object groups (layers)<br />
- identification keys (postal address, pylon, etc.)<br />
- object names (text)<br />
3.1.3 Thematic data basis<br />
- l<strong>and</strong> use<br />
- planning zones<br />
- protected areas<br />
- environment cadastre<br />
3.2 Access to the geographic database Retrieval paths<br />
Apart from the selection by coordinates there are a set<br />
of user oriented selection modes:<br />
- postal address<br />
- street segment<br />
- street name<br />
- bloc code<br />
- census tract<br />
- layer code<br />
- identification key of objects<br />
Among these are interconnections <strong>and</strong> pointers to other<br />
regional keys:<br />
postal address to its bloc <strong>and</strong> to its street segment, or<br />
to its constituency.<br />
3.3 Geographic data connection<br />
The keying facility of the geographic database allows the<br />
linkage to other data basis storing statistical <strong>and</strong><br />
technical data.<br />
e.g. density of population<br />
growth of population (e.g. forecasting<br />
the number of children of schoolage for the<br />
dem<strong>and</strong> of teachers <strong>and</strong> classroom)<br />
density of built up areas<br />
traffic system (local coordination of road<br />
construction works <strong>and</strong> excavations in the road)<br />
medical care of the population<br />
environmental aspects<br />
annoyance by noise<br />
provision with areas for recreation<br />
115
4. CARTOGRAPHIC OUTPUT<br />
Despite the advantage of digital data for processing<br />
analogue representation of geographic information will be<br />
needed further on. Even its range of application is growing<br />
fast, as graphic output is the adequate output format. A<br />
powerful graphic capability by ADP is therefore an important<br />
prerequisite of such an information system.<br />
4.1 St<strong>and</strong>ard large scale map<br />
In areas with ground survey the base map starts with 1:200<br />
(the map sheets follow the street network). Smaller scales<br />
continue with 1:500 (sheets gridwise), 1:1000, 1:2000,<br />
1:3000 up to 1:5000 (1:10000 is produced by reproduction).<br />
Sample map see App. 1.<br />
4.2 Special maps<br />
District maps or any other special purpose plan or map.<br />
Parameters are:<br />
- window<br />
- layers<br />
- legend (symbolisation, line <strong>and</strong> area pattern, text<br />
fonts).<br />
Sample map of lightning system (wiring chart) see App. 2.<br />
4.3 Thematic maps<br />
The keying facility enables the user to link other data<br />
bases in order to examine special relationship of data. This<br />
feature causes a fundamental change: the time consuming task<br />
of collecting statistical data <strong>and</strong> of referencing to their<br />
local distribution is obsolete. Automated geographic data<br />
processing reduces the "response time" for the production of<br />
thematic maps, so that maps become an up-to-date image.<br />
Recently obtained data of administration can be transferred<br />
quickly into cartographic images as useful means for the<br />
day's work.<br />
e.g. Controlling of registered obstacles in the traffic<br />
system makes use of thematic maps: an overview of<br />
excavation <strong>and</strong> construction work in the stage of<br />
execution <strong>and</strong> planning can be published within few<br />
days.<br />
116
5. UPDATING<br />
5.1 Geographic mail box for updating<br />
A prerequisite for an effective revision of a geographic<br />
data base is the observation of all changes in a region<br />
<strong>and</strong> to recognize them as soon as possible. There are many<br />
signals in public administration which give hints to future<br />
changes: changes of parcels (cadastre), planning <strong>and</strong><br />
building permission of future construction activities on<br />
the surface <strong>and</strong> underground. These signals are obtainable<br />
by tapping existing files of the administration. Those<br />
activities which will be later on a case for updating (e.g.<br />
construction of demolition of buildings, changes in the<br />
zoning etc.) are stored in the mail box. Finally different<br />
types of changes are linked with their relevant geographic<br />
reference (e.g. postal address, parcel number or street<br />
segment) <strong>and</strong> stored in a mail box. If a map sheet is plotted<br />
additional news are available to the user, referring to the<br />
changes in the area of the map sheet since the last updating<br />
of the data base for each layer. These news can be delivered<br />
in alphanumeric way as listings but also in graphics.<br />
Thematic maps with geocodes symbols can be produced<br />
automatically displaying type of changes, the responsible<br />
authority where to find further information etc.<br />
5.2 Temporary update<br />
In those cases where a quick updating with less accuracy is<br />
necessary, a prerelease of an up-to-date database is built<br />
up. Site planes, maintenance reports can be used to generate<br />
provisional cartographic data which are labelled especially.<br />
5.3 Final update<br />
Similar to the building up of the geographic database<br />
maintenance of its data makes use of different sources as<br />
well.<br />
5.3.1 Field surveying. Additional to the input of the<br />
data collection codes for updating <strong>and</strong> the reference to<br />
existing points by junction points allows an automated<br />
insertion of a new object or a part of it (in development).<br />
5.3.2 Aerial Survey. For those areas where less<br />
accurate data are needed, photogrammetry contributes her<br />
part of geodetic data.<br />
5.3.3 Processing for updating. The software development<br />
is aimed towards a maximum degree of automation. Automated<br />
data flow from measuring equipment to the insertion into the<br />
data base is envisaged. It is evident that this cannot be<br />
117
ealised totally. Interactive computer assisted activities<br />
will reduce manual interferance to a minimum. Not to mention<br />
that a lot of auxiliary function of updating can be<br />
automated: Checking that all update cases were executed<br />
(data of the mailbox can be compared with corresponding<br />
files of objects).<br />
Adjustment of new geodetic data with old data, logic<br />
checking, uniqueness of identification keys, admissible<br />
range of identification keys.<br />
5.4 Distribution of recent geographic data<br />
Computer assisted revision of geographic data is expected<br />
to cut down the response time of map revision essentially.<br />
But in the final stage it is important that data can be<br />
transmitted to all users fast <strong>and</strong> in such a way that it<br />
need not processed manually. Apart from the distribution of<br />
analog documents the transmission of cartographic data can<br />
either be h<strong>and</strong>led by ADP via a digital interface.<br />
5.5 Responsibility<br />
As above mentioned layering of objects is designed user<br />
oriented in such a way that the responsibility for updating<br />
of geographic data can be distributed on to those<br />
authorities which have the duty to maintain those objects.<br />
5.6 Aspects of time<br />
Updating of the city map of Vienna had been done<br />
periodically adjusted to the aerial survey interval. This<br />
proceeding will be changed to flexible periodes, dependent<br />
on the priorities of the users of the data base.<br />
6. CONCLUSIONS<br />
The L<strong>and</strong> Information System described above is desinged<br />
as a comprising source for geographic information. By means<br />
of an increasing use of the keying facility the data base<br />
becomes more <strong>and</strong> more a powerful tool for geographic<br />
integration of distributed data. An "inquiry bank" for<br />
local planning, executing <strong>and</strong> administration is therefore<br />
available.<br />
Especially spatial coordination among several branches of<br />
authorities <strong>and</strong> offices - today a time consuming <strong>and</strong><br />
cumbersome activity - will be supported by automated<br />
retrieval <strong>and</strong> combination of relevant data.<br />
As a powerful userinterface information can be oblained in<br />
graphics manifolded according to the purpose. Either a<br />
general description of the local situation (basic map) or<br />
a special application oriented graphic (thematic map).<br />
118
Advantages of this development are:<br />
- increased quality of data<br />
- multiple usage of geographic data<br />
- integration with other data bases<br />
- automated processing of local relationship<br />
<strong>and</strong> distribution<br />
- flexible data exchange<br />
- flexible output<br />
the data base represents an abstract storage<br />
without fixed linkeage a specific cartographic<br />
representation.<br />
119
Weiterverwendung nur mit Ouellenangabe: MA 41 - Stadtvermessung<br />
Digita]isiert u. automatisch gezeichnet MD-ADV<br />
120