computing lives - FTP Directory Listing
computing lives - FTP Directory Listing
computing lives - FTP Directory Listing

You also want an ePaper? Increase the reach of your titles
YUMPU automatically turns print PDFs into web optimized ePapers that Google loves.
A<br />
Computer Previous Page | Contents | Zoom in | Zoom out | Front Cover | Search Issue | Next Page M S BE<br />
aG<br />
F<br />
With the complete model, an organization can<br />
not only define measurement consistent with<br />
larger, upper-level organizational concerns, but<br />
also interpret and roll up the resulting measurement<br />
data at each level.<br />
AN APPLICATION<br />
To illustrate the features of our approach, we<br />
consider a fictitious but representative type of<br />
organization, ABC, which provides information<br />
services to its customers through the Web. Customers<br />
do not buy the software, but rather pay a<br />
service fee for access to information and to software<br />
that searches, analyzes, and presents that<br />
information. Thus, the business model implies that<br />
the number of customer accesses to ABC’s system<br />
determines the company’s revenue. Figure 2 represents<br />
a model of this application.<br />
Business goals<br />
Although the approach is flexible enough to accommodate<br />
several different entry points, the starting point of the<br />
GQM + Strategies process in this example is a business goal.<br />
As Goal 1 shows, one of ABC’s business goals is to increase<br />
profit from software service use. The GQM + Strategies approach<br />
enforces the explicit documentation of the relevant<br />
context factors and assumptions necessary for understanding<br />
and evaluating each goal. For Goal 1, one such<br />
context factor is that how often customers access ABC<br />
software products determines the amount of revenue generated<br />
at ABC.<br />
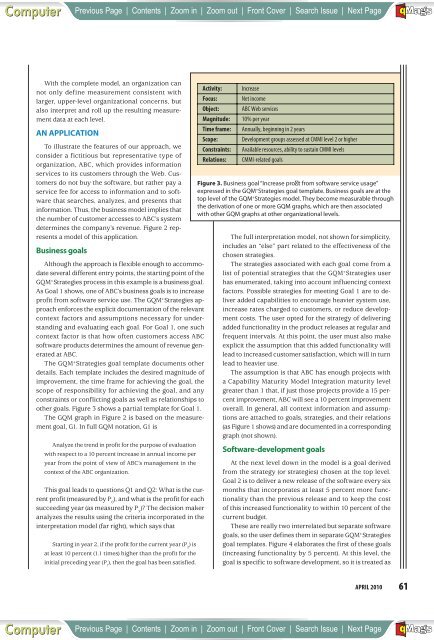
The GQM + Strategies goal template documents other<br />
details. Each template includes the desired magnitude of<br />
improvement, the time frame for achieving the goal, the<br />
scope of responsibility for achieving the goal, and any<br />
constraints or conflicting goals as well as relationships to<br />
other goals. Figure 3 shows a partial template for Goal 1.<br />
The GQM graph in Figure 2 is based on the measurement<br />
goal, G1. In full GQM notation, G1 is<br />
Analyze the trend in profit for the purpose of evaluation<br />
with respect to a 10 percent increase in annual income per<br />
year from the point of view of ABC’s management in the<br />
context of the ABC organization.<br />
This goal leads to questions Q1 and Q2: What is the current<br />
profit (measured by P 0 ), and what is the profit for each<br />
succeeding year (as measured by P x )? The decision maker<br />
analyzes the results using the criteria incorporated in the<br />
interpretation model (far right), which says that<br />
Starting in year 2, if the profit for the current year (P ) is 2<br />
at least 10 percent (1.1 times) higher than the profit for the<br />
initial preceding year (P ), then the goal has been satisfied.<br />
1<br />
Activity: Increase<br />
Focus: Net income<br />
Object: ABC Web services<br />
Magnitude: 10% per year<br />
Time frame: Annually, beginning in 2 years<br />
Scope: Development groups assessed at CMMI level 2 or higher<br />
Constraints: Available resources, ability to sustain CMMI levels<br />
Relations: CMMI-related goals<br />
Figure 3. Business goal “Increase pro t from software service usage”<br />
expressed in the GQM + Strategies goal template. Business goals are at the<br />
top level of the GQM + Strategies model. They become measurable through<br />
the derivation of one or more GQM graphs, which are then associated<br />
with other GQM graphs at other organizational levels.<br />
The full interpretation model, not shown for simplicity,<br />
includes an “else” part related to the effectiveness of the<br />
chosen strategies.<br />
The strategies associated with each goal come from a<br />
list of potential strategies that the GQM + Strategies user<br />
has enumerated, taking into account influencing context<br />
factors. Possible strategies for meeting Goal 1 are to deliver<br />
added capabilities to encourage heavier system use,<br />
increase rates charged to customers, or reduce development<br />
costs. The user opted for the strategy of delivering<br />
added functionality in the product releases at regular and<br />
frequent intervals. At this point, the user must also make<br />
explicit the assumption that this added functionality will<br />
lead to increased customer satisfaction, which will in turn<br />
lead to heavier use.<br />
The assumption is that ABC has enough projects with<br />
a Capability Maturity Model Integration maturity level<br />
greater than 1 that, if just those projects provide a 15 percent<br />
improvement, ABC will see a 10 percent improvement<br />
overall. In general, all context information and assumptions<br />
are attached to goals, strategies, and their relations<br />
(as Figure 1 shows) and are documented in a corresponding<br />
graph (not shown).<br />
Software-development goals<br />
At the next level down in the model is a goal derived<br />
from the strategy (or strategies) chosen at the top level.<br />
Goal 2 is to deliver a new release of the software every six<br />
months that incorporates at least 5 percent more functionality<br />
than the previous release and to keep the cost<br />
of this increased functionality to within 10 percent of the<br />
current budget.<br />
These are really two interrelated but separate software<br />
goals, so the user defines them in separate GQM + Strategies<br />
goal templates. Figure 4 elaborates the first of these goals<br />
(increasing functionality by 5 percent). At this level, the<br />
goal is specific to software development, so it is treated as<br />
APRIL 2010<br />
A<br />
Computer Previous Page | Contents | Zoom in | Zoom out | Front Cover | Search Issue | Next Page M S BE<br />
aG<br />
F<br />
61