computing lives - FTP Directory Listing
computing lives - FTP Directory Listing
computing lives - FTP Directory Listing

Create successful ePaper yourself
Turn your PDF publications into a flip-book with our unique Google optimized e-Paper software.
A<br />
Computer Previous Page | Contents | Zoom in | Zoom out | Front Cover | Search Issue | Next Page M S BE<br />
aG<br />
F<br />
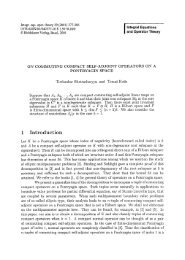
′ The function G predicts the cost per Gbyte<br />
X<br />
of SATA disk storage X days from 20 April 2003,<br />
′ with G = 1.2984 when X = 0. We can therefore<br />
X<br />
approximate the function G by assuming that<br />
T<br />
the future disk price trend conforms to the<br />
equation K ∗ eC ∗ T , where K represents the lowest<br />
storage price per Gbyte available to the consumer<br />
at T = 0; and T represents the number of<br />
years in the future. We therefore derive G as G T T<br />
= K ∗ e –0.0012∗ 365 ∗ T⇒ G = K ∗ e T –0.438∗ T .<br />
Disk replacement rates<br />
Any realistic cost model for disk storage ownership<br />
must estimate the disk replacement cost.<br />
A recent large-scale study of disk failures measured<br />
the annualized replacement rate (ARR) of<br />
disk drives in real data centers. 2 The study<br />
observed ARRs in the range of 0.5 to 13.5 percent,<br />
with the most commonly observed ARRs in<br />
the 3 percent range.<br />
In our model, we approximate R T with this<br />
empirical approximation of the disk replacement<br />
rate by using the formula R T = 0.03 * Ω *<br />
⎡V T ⎤ Ω . In this formula, the constant 0.03 represents the observed<br />
3 percent disk replacement rate. 2 Thus, we can simplify E T to:<br />
–0.438∗ T<br />
E = (( ⎡V ⎤ – ⎡V ⎤ ) ∗ Ω + 0.03 ∗ Ω ∗⎡V⎤ ) ∗ K ∗ e T T Ω T – 1 Ω T Ω<br />
⇒ E = (1.03 ∗⎡V⎤ – ⎡V ⎤ ) ∗ Ω ∗ K · e T T Ω T – 1 Ω –0.438∗ T .<br />
Disk salvage value<br />
$/GByte<br />
We assume a hard disk drive can be sold in the used market for<br />
some salvage value at the end of its life. To predict this salvage<br />
value, we leverage the future disk price prediction formula, discounting<br />
the predicted price by some depreciation factor, γ, in the<br />
We assume this vendor lets users purchase raw disk<br />
storage over the Internet. We’re only interested in the storage<br />
cloud’s pricing structure for the end user, and we don’t<br />
assume any particular service access technology. Table 2<br />
shows the assumed tiered monthly pricing structure. For<br />
illustrative purposes, we don’t consider data uploading or<br />
downloading costs.<br />
Single-user computers<br />
Single-user computers make up the vast majority of all<br />
shipped disk storage capacity. 2 For our study, we assume<br />
the same user owns and operates the single-user computer.<br />
This user’s storage requirement grows at a moderate rate<br />
of 100 Gbytes per year. Therefore, regardless of where<br />
data is stored, we assume the level of effort in managing<br />
the system/data is approximately equal in both cases<br />
because of the low storage volume involved—that is,<br />
= 0. We assume the user must purchase a new disk<br />
controller (C = $1,000), specified to consume 0.5 kW of<br />
power. Also, as storage is required, the user will purchase<br />
2.5<br />
2.0<br />
1.5<br />
1.0<br />
0.5<br />
y = 1.2984e – 0.0012 X<br />
Disk price<br />
Exponential (disk price)<br />
0 200 400 600 800 1,000 1,200 1,400 1,600 1,800 2,000<br />
Start date: 20 April 2003<br />
Days<br />
Figure A. Weekly SATA disk price data collected from Pricewatch.com from<br />
20 April 2003 to 19 August 2008.<br />
range [0, 1]. In equation form, this gives us the salvage value S = γ<br />
* Ω * ⎡V T ⎤ Ω ∗ K ∗ e –0.438 ∗ T , simplifying into ΔNPV as shown by<br />
Equation 1 in the main text.<br />
References<br />
1. O.A. Lamont and R.H. Thaler, “Anomalies: The Law of One<br />
Price in Financial Markets,” J. Economic Perspective, vol. 17, no.<br />
4, 2003, pp. 191-202.<br />
2. B. Schroeder and G. Gibson, “Disk Failures in the Real World:<br />
What Does an MTTF of 1,000,000 Hours Mean to You?” Proc.<br />
5th Usenix Conf. File and Storage Technologies (FAST 07),<br />
Usenix Assoc., 2007, pp. 1-16.<br />
COROLLARY FOR ESTIMATING THE<br />
UPPER-BOUND PRESENT VALUE<br />
We derive the following corollary from the economic Law of<br />
One Price, which states, “In an efficient market, identical<br />
goods will have only one price.”<br />
Corollary 1. The upper bound of the present values for the purchase<br />
and lease price equilibrium in an efficient market is derived<br />
from the risk-free interest rate, I . F<br />
Informal proof: In an efficient market, an arbitrager has no<br />
opportunity to make a risk-free profit. Assuming an efficient market<br />
in which financing at the risk-free rate is possible for a subset of<br />
agents, the proof is by contradiction. Thus, if the present value of<br />
the lease price is higher than that derived from the risk-free rate, I , F<br />
an arbitrager can purchase disks from monies borrowed at the riskfree<br />
rate, lease at this higher price, and pocket the risk-free profit.<br />
Also, if the present value of the purchase price is higher than that<br />
derived from the risk-free rate, I , an arbitrager can purchase a disk<br />
F<br />
from monies borrowed at the risk-free rate, sell the disk at some<br />
future instance at this higher price, and pocket the risk-free profit.<br />
APRIL 2010<br />
A<br />
Computer Previous Page | Contents | Zoom in | Zoom out | Front Cover | Search Issue | Next Page M S BE<br />
aG<br />
F<br />
47