solution
solution
solution

Create successful ePaper yourself
Turn your PDF publications into a flip-book with our unique Google optimized e-Paper software.
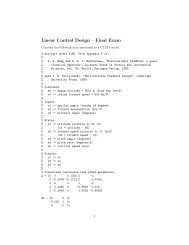
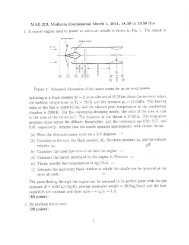
omg = 0.1:0.1:1000;<br />
num = [10,0];den = [1,20,100];<br />
sys = tf(num,den);<br />
figure(1),bode(omg,sys);grid on; % using "bode" to get the Bode diagram<br />
Magnitude (dB)<br />
Phase (deg)<br />
0<br />
-20<br />
-40<br />
-60<br />
90<br />
45<br />
0<br />
-45<br />
-90<br />
10 -1<br />
Asymptote:<br />
10 0<br />
j10ω<br />
H( jω)<br />
=<br />
( jω<br />
+ 10)<br />
2<br />
10 1<br />
10 2<br />
10 jω<br />
= ⋅<br />
jω+ 10 jω+<br />
10<br />
From the expression, we see the frequency response have: zero at jω = 0 , pole at<br />
jω =− 10 and pole at jω =− 10 .<br />
(1). Magnitude asymptote<br />
First consider the part<br />
10<br />
jω + 10<br />
10<br />
20log10 0<br />
10 = . For high frequencies ( ω ω p<br />
10 3<br />
. For low frequencies ( ω ω p ), the dB-scale magnitude is<br />
20log<br />
), magnitude should be 10<br />
10<br />
, which<br />
jω<br />
is a straight line with the slope of -20dB and go through (10,0). The magnitude<br />
asymptote from<br />
10<br />
jω + 10<br />
is a pair of straight lines with corner frequency at ω p = 10 ,