solution
solution
solution

Create successful ePaper yourself
Turn your PDF publications into a flip-book with our unique Google optimized e-Paper software.
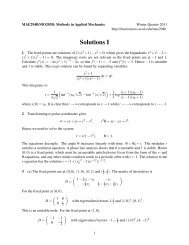
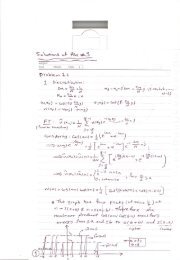
Problem 2 (Chapter 8, P. 23)<br />
From (a) to (d), we got<br />
x () t = x () t + 2cos(2 Nπt) N N−1<br />
= x ( t) + 2cos(2( N − 1) πt) + 2cos(2 Nπt) <br />
N −2<br />
= x ( t) + 2cos(2 πt) + 2cos(4 πt) + + 2cos(2 Nπt) <br />
0<br />
N<br />
= 1+∑ 2 cos(2 nπt) = ∑ e<br />
n=<br />
1<br />
N<br />
n=−N j2nπt Signals for N = 0,1,2,20 are shown as follow over the time range − 3< t < 3.<br />
By<br />
numerically calculate the area of the signal over − 1/2 < t < 1/2,<br />
we got:<br />
( a) N = 0, area=<br />
1,<br />
( b) N = 1, area=<br />
1,<br />
() c N = 2, area=<br />
1,<br />
( d) N = 20, area=<br />
1<br />
As N become lager, for case N = ∞ ,<br />
j2nπt x () t = ∑ e tends to a function x() t<br />
N<br />
∞<br />
n=−∞<br />
with 0 1 T = and Xk [ ] = 1.<br />
From the table we can find that, x() t is a unit period<br />
impulse ( xt ( ) = δ ( t) ↔ Xk [ ] = 1).<br />
Clearly see in plots, as N increases the figure<br />
become more like the impulse train and the area within one period should be 1.<br />
Code:<br />
t = -3:0.01:3; x_Nt = zeros(size(t))+1; N0 = 20; % N0=0,1,2,20 for part a,b,c,d<br />
for n = 1:N0;<br />
x_Nt = x_Nt+2*cos(2*n*pi*t);<br />
end<br />
figure(2),subplot(2,1,1),plot(t,x_Nt);<br />
num1 = find(t==-1/2);num2 = find(t==1/2);<br />
Area = sum((x_Nt(num1:num2-1))*0.01, % Summation should end at num2-1<br />
N=0<br />
2<br />
x 0 (t)<br />
1.5<br />
1<br />
0.5<br />
0<br />
-3 -2 -1 0 1 2 3<br />
t