Central Valley Aquifer, Chapters A and B - MAE Class Websites
Central Valley Aquifer, Chapters A and B - MAE Class Websites
Central Valley Aquifer, Chapters A and B - MAE Class Websites

You also want an ePaper? Increase the reach of your titles
YUMPU automatically turns print PDFs into web optimized ePapers that Google loves.
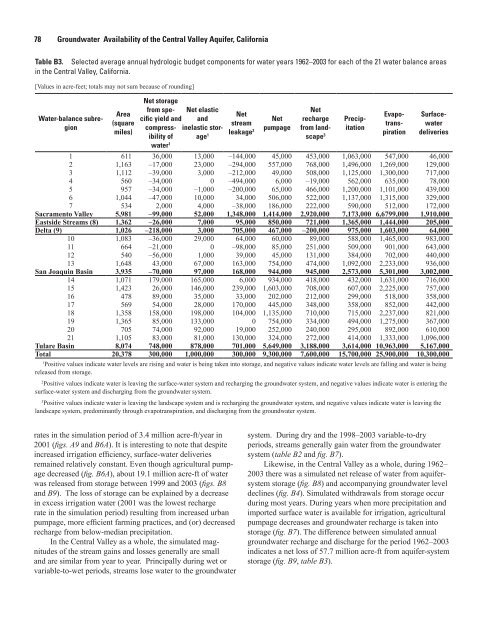
78 Groundwater Availability of the <strong>Central</strong> <strong>Valley</strong> <strong>Aquifer</strong>, California<br />
Table B3. Selected average annual hydrologic budget components for water years 1962–2003 for each of the 21 water balance areas<br />
in the <strong>Central</strong> <strong>Valley</strong>, California.<br />
<br />
Water-balance subregion<br />
Area<br />
(square<br />
miles)<br />
Net storage<br />
from spe-<br />
cific yield <strong>and</strong><br />
compressibility<br />
of<br />
water 1<br />
Net elastic<br />
<strong>and</strong><br />
inelastic storage<br />
1<br />
rates in the simulation period of 3.4 million acre-ft/year in<br />
2001 ( <strong>and</strong> <br />
<br />
-<br />
<br />
<br />
<strong>and</strong> <br />
<br />
<br />
<br />
<br />
-<br />
<br />
<br />
<br />
Net<br />
stream<br />
leakage 2<br />
Net<br />
pumpage<br />
Net<br />
recharge<br />
from l<strong>and</strong>scape<br />
3<br />
Precip-<br />
itation<br />
Evapo-<br />
trans-<br />
piration<br />
Surface-<br />
water<br />
deliveries<br />
1 611 36,000 13,000 45,000 453,000 1,063,000 547,000 46,000<br />
2 1,163 23,000 557,000 768,000 1,496,000 1,269,000 129,000<br />
3 1,112 3,000 49,000 508,000 1,125,000 1,300,000 717,000<br />
4 560 0 6,000 562,000 635,000 78,000<br />
5 957 65,000 466,000 1,200,000 1,101,000 439,000<br />
6 1,044 10,000 34,000 506,000 522,000 1,137,000 1,315,000 329,000<br />
7 534 2,000 4,000 186,000 222,000 590,000 512,000 172,000<br />
Sacramento <strong>Valley</strong> 5,981 –99,000 52,000 1,348,000 1,414,000 2,920,000 7,173,000 6,6799,000 1,910,000<br />
Eastside Streams (8) 1,362 –26,000 7,000 95,000 850,000 721,000 1,365,000 1,444,000 205,000<br />
Delta (9) 1,026 –218,000 3,000 705,000 467,000 –200,000 975,000 1,603,000 64,000<br />
10 1,083 29,000 64,000 60,000 89,000 588,000 1,465,000 983,000<br />
11 664 0 85,000 251,000 509,000 901,000 643,000<br />
12 540 1,000 39,000 45,000 131,000 384,000 702,000 440,000<br />
13 1,648 43,000 67,000 163,000 754,000 474,000 1,092,000 2,233,000 936,000<br />
San Joaquin Basin 3,935 –70,000 97,000 168,000 944,000 945,000 2,573,000 5,301,000 3,002,000<br />
14 1,071 179,000 165,000 6,000 934,000 418,000 432,000 1,631,000 716,000<br />
15 1,423 26,000 146,000 239,000 1,603,000 708,000 607,000 2,225,000 757,000<br />
16 478 89,000 35,000 33,000 202,000 212,000 299,000 518,000 358,000<br />
17 569 54,000 28,000 170,000 445,000 348,000 358,000 852,000 442,000<br />
18 1,358 158,000 198,000 104,000 1,135,000 710,000 715,000 2,237,000 821,000<br />
19 1,365 85,000 133,000 0 754,000 334,000 494,000 1,275,000 367,000<br />
20 705 74,000 92,000 19,000 252,000 240,000 295,000 892,000 610,000<br />
21 1,105 83,000 81,000 130,000 324,000 272,000 414,000 1,333,000 1,096,000<br />
Tulare Basin 8,074 748,000 878,000 701,000 5,649,000 3,188,000 3,614,000 10,963,000 5,167,000<br />
Total 20,378 300,000 1,000,000 300,000 9,300,000 7,600,000 15,700,000 25,900,000 10,300,000<br />
1 <br />
<br />
2 <br />
<br />
3 <br />
<br />
<br />
<br />
system ( <strong>and</strong> ).<br />
<br />
<br />
<br />
declines (<br />
<br />
<br />
<br />
<br />
<br />
indicates a net loss of 57.7 million acre-ft from aquifer-system<br />
, ).