Central Valley Aquifer, Chapters A and B - MAE Class Websites
Central Valley Aquifer, Chapters A and B - MAE Class Websites Central Valley Aquifer, Chapters A and B - MAE Class Websites
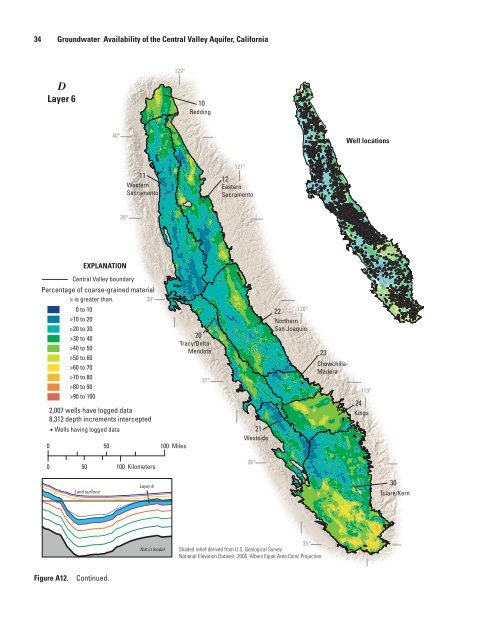
34 Groundwater Availability of the Central Valley Aquifer, California D Layer 6 10 EXPLANATION Central Valley boundary Percentage of coarse-grained material > is greater than. 0 to 10 >10 to 20 >20 to 30 >30 to 40 >40 to 50 >50 to 60 >60 to 70 >70 to 80 >80 to 90 >90 to 100 2,007 wells have logged data 8,312 depth increments intercepted Wells having logged data 0 50 100 Miles 0 50 100 Kilometers Land surface Figure A12. Continued. 11 Western Sacramento Layer 6 Not in model Redding 20 Tracy/Delta- Mendota 12 Eastern Sacramento 21 Westside 22 Northern San Joaquin Shaded relief derived from U.S. Geological Survey National Elevation Dataset, 2006. Albers Equal Area Conic Projection 23 Chowchilla- Madera Well locations 24 Kings 30 Tulare/Kern
E Layer 9 EXPLANATION Central Valley boundary Percentage of coarse-grained material > is greater than. 0 to 10 >10 to 20 >20 to 30 >30 to 40 >40 to 50 >50 to 60 >60 to 70 >70 to 80 >80 to 90 >90 to 100 79 wells have logged data 309 depth increments intercepted Wells having logged data 0 50 100 Miles 0 50 100 Kilometers Land surface Figure A12. Continued. 11 Western Sacramento Layer 9 Not in model 10 Redding 20 Tracy/Delta- Mendota 12 Eastern Sacramento 21 Westside 22 Northern San Joaquin Shaded relief derived from U.S. Geological Survey National Elevation Dataset, 2006. Albers Equal Area Conic Projection 23 Chowchilla- Madera Well locations 24 Kings Hydrogeology 35 30 Tulare/Kern
- Page 1 and 2: GROUNDWATER RESOURCES PROGRAM Groun
- Page 3 and 4: Groundwater Availability of the Cen
- Page 5 and 6: Foreword An adequate supply of grou
- Page 7 and 8: Contents Chapter A Introduction, Ov
- Page 9 and 10: Chapter C Numerical Model of the Hy
- Page 11 and 12: Figures Chapter A Figure A1. Map of
- Page 13 and 14: Figure B12. Map of altitude of the
- Page 15 and 16: Figure C28. Pie chart and histogram
- Page 17 and 18: Conversion Factors Inch/Pound to SI
- Page 19 and 20: Chapter A. Introduction, Overview o
- Page 21 and 22: - - precipitation. -
- Page 23 and 24: 40° 39° 38° 37° 36° 35° Klama
- Page 25 and 26: Texture Model DATA Centralized Geos
- Page 27 and 28: Hydrology Water Well Information Aq
- Page 29 and 30: Table A1. Water-balance subregions
- Page 31 and 32: B Red Bluff 0 50 100 Miles 0 50 100
- Page 33 and 34: Delta and Eastside Streams ).
- Page 35 and 36: for about 30 percent of the annual
- Page 37 and 38: 0 50 100 Miles 0 50 100 Kilometers
- Page 39 and 40: A Coast Ranges Clayey lenses Fault
- Page 41 and 42: - the distribution of these pro
- Page 43 and 44: C DEPTH TO MIDPOINT OF INCREMENT, I
- Page 45 and 46: ). The southern part, referred , in
- Page 47 and 48: 3-D Model of Percentage of Coarse-G
- Page 49 and 50: A Layer 1 EXPLANATION Central Valle
- Page 51: C Layer Corcoran Clay EXPLANATION C
- Page 55 and 56: Geomorphic province— Basin Delta
- Page 57 and 58: San Joaquin Valley ),
- Page 59 and 60: - Water supplied from aquifers
- Page 61 and 62: C Figure A16. Continued. 3.54% 5.45
- Page 63 and 64: CUMULATIVE DEPARTURE OF PRECIPITATI
- Page 65 and 66: CUMULATIVE DEPARTURE OF STREAMFLOW
- Page 67 and 68: 700 500 600 400 200 160 0 50 100 Mi
- Page 69 and 70: B 0 50 100 Miles 0 50 100 Kilometer
- Page 71 and 72: Water Budget per year (
- Page 73 and 74: References Cited 55 -
- Page 75: References Cited 57 - - 2009, at
- Page 78 and 79: 60 Groundwater Availability of the
- Page 80 and 81: 62 Groundwater Availability of the
- Page 82 and 83: 64 Groundwater Availability of the
- Page 84 and 85: 66 Groundwater Availability of the
- Page 86 and 87: 68 Groundwater Availability of the
- Page 88 and 89: 70 Groundwater Availability of the
- Page 90 and 91: 72 Groundwater Availability of the
- Page 92 and 93: 74 Groundwater Availability of the
- Page 94 and 95: 76 Groundwater Availability of the
- Page 96 and 97: 78 Groundwater Availability of the
- Page 98 and 99: 80 Groundwater Availability of the
- Page 100 and 101: 82 Groundwater Availability of the
34 Groundwater Availability of the <strong>Central</strong> <strong>Valley</strong> <strong>Aquifer</strong>, California<br />
D<br />
Layer 6 10<br />
EXPLANATION<br />
<strong>Central</strong> <strong>Valley</strong> boundary<br />
Percentage of coarse-grained material<br />
> is greater than.<br />
0 to 10<br />
>10 to 20<br />
>20 to 30<br />
>30 to 40<br />
>40 to 50<br />
>50 to 60<br />
>60 to 70<br />
>70 to 80<br />
>80 to 90<br />
>90 to 100<br />
2,007 wells have logged data<br />
8,312 depth increments intercepted<br />
Wells having logged data<br />
0 50 100 Miles<br />
0 50 100 Kilometers<br />
L<strong>and</strong> surface<br />
Figure A12. Continued.<br />
11<br />
Western<br />
Sacramento<br />
Layer 6<br />
Not in model<br />
Redding<br />
20<br />
Tracy/Delta-<br />
Mendota<br />
12<br />
Eastern<br />
Sacramento<br />
21<br />
Westside<br />
22<br />
Northern<br />
San Joaquin<br />
Shaded relief derived from U.S. Geological Survey<br />
National Elevation Dataset, 2006. Albers Equal Area Conic Projection<br />
23<br />
Chowchilla-<br />
Madera<br />
Well locations<br />
24<br />
Kings<br />
30<br />
Tulare/Kern


