Central Valley Aquifer, Chapters A and B - MAE Class Websites
Central Valley Aquifer, Chapters A and B - MAE Class Websites
Central Valley Aquifer, Chapters A and B - MAE Class Websites

Create successful ePaper yourself
Turn your PDF publications into a flip-book with our unique Google optimized e-Paper software.
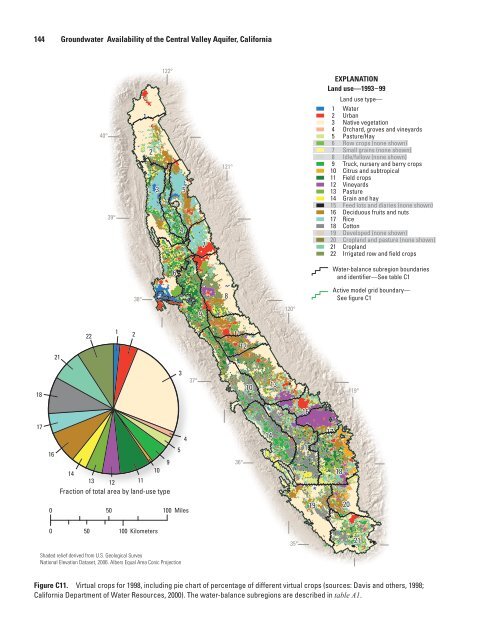
144 Groundwater Availability of the <strong>Central</strong> <strong>Valley</strong> <strong>Aquifer</strong>, California<br />
18<br />
17<br />
16<br />
21<br />
22<br />
1 2<br />
9<br />
14<br />
10<br />
13 12 11<br />
Fraction of total area by l<strong>and</strong>-use type<br />
0 50 100 Miles<br />
0 50 100 Kilometers<br />
Shaded relief derived from U.S. Geological Survey<br />
National Elevation Dataset, 2006. Albers Equal Area Conic Projection<br />
1<br />
2<br />
3<br />
6<br />
4<br />
3<br />
5<br />
5<br />
4<br />
9<br />
7<br />
8<br />
11<br />
12<br />
10<br />
14<br />
13<br />
16<br />
15<br />
19<br />
EXPLANATION<br />
L<strong>and</strong> use—1993-99<br />
1<br />
2<br />
3<br />
4<br />
5<br />
6<br />
7<br />
8<br />
9<br />
10<br />
11<br />
12<br />
13<br />
14<br />
15<br />
16<br />
17<br />
18<br />
19<br />
20<br />
21<br />
22<br />
17<br />
L<strong>and</strong> use type—<br />
Water<br />
Urban<br />
Native vegetation<br />
Orchard, groves <strong>and</strong> vineyards<br />
Pasture/Hay<br />
Row crops (none shown)<br />
Small grains (none shown)<br />
Idle/fallow (none shown)<br />
Truck, nursery <strong>and</strong> berry crops<br />
Citrus <strong>and</strong> subtropical<br />
Field crops<br />
Vineyards<br />
Pasture<br />
Grain <strong>and</strong> hay<br />
Feed lots <strong>and</strong> diaries (none shown)<br />
Deciduous fruits <strong>and</strong> nuts<br />
Rice<br />
Cotton<br />
Developed (none shown)<br />
Cropl<strong>and</strong> <strong>and</strong> pasture (none shown)<br />
Cropl<strong>and</strong><br />
Irrigated row <strong>and</strong> field crops<br />
Water-balance subregion boundaries<br />
<strong>and</strong> identifier—See table C1<br />
Active model grid boundary—<br />
See figure C1<br />
Figure C11. Virtual crops for 1998, including pie chart of percentage of different virtual crops (sources: Davis <strong>and</strong> others, 1998;<br />
California Department of Water Resources, 2000). The water-balance subregions are described in .<br />
18<br />
20<br />
21