Central Valley Aquifer, Chapters A and B - MAE Class Websites
Central Valley Aquifer, Chapters A and B - MAE Class Websites
Central Valley Aquifer, Chapters A and B - MAE Class Websites

You also want an ePaper? Increase the reach of your titles
YUMPU automatically turns print PDFs into web optimized ePapers that Google loves.
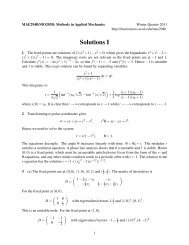
x<br />
Figure A17. Graph of cumulative departure from average annual precipitation at<br />
Redding, Davis, Fresno, <strong>and</strong> Bakersfield, California ......................................................44<br />
Figure A18. Graph of cumulative departure of monthly precipitation (Parameter-<br />
elevation Regressions on Independent Slopes Model (PRISM) data from Davis,<br />
California), cumulative departure of the Pacific Decadal Oscillation (PDO)<br />
index, <strong>and</strong> cumulative departure of the monthly reference evapotranspiration<br />
(ETo) values (gridded values of California Irrigation Management Information<br />
System’s (CIMIS) stations from Redding, Davis, <strong>and</strong> Bakersfield, 1960–2004) .........45<br />
Figure A19. Graph of cumulative departure of streamflow diversions from the<br />
Bear River by South Sutter Water District, California; cumulative annual<br />
temperature from California Irrigation Management Information System’s<br />
(CIMIS) stations at Davis <strong>and</strong> the Pacific Decadal Oscillation (PDO) index,<br />
1960–2004 ..............................................................................................................................47<br />
Figure A20. Map of pre-development groundwater map ....................................................................49<br />
Figure A21. Maps of distribution of A, Pre-1900 l<strong>and</strong>-use patterns. B, L<strong>and</strong>-use<br />
patterns in 2000 for the <strong>Central</strong> <strong>Valley</strong>, California ...........................................................50<br />
Figure A22. Map of distribution of selected streams <strong>and</strong> canals, <strong>and</strong> average<br />
estimated gains <strong>and</strong> losses for selected segments .......................................................52<br />
Figure A23. Diagrams of pre-development water budget <strong>and</strong> post-development<br />
water budget .........................................................................................................................53<br />
Chapter B<br />
Figure B1. Diagram showing average water budget for water years 1962–2003 .........................63<br />
Figure B2. Pie charts <strong>and</strong> histograms showing simulated l<strong>and</strong>scape budget for the<br />
<strong>Central</strong> <strong>Valley</strong> for typical (1975), dry (1990), <strong>and</strong> wet (1998) years ...............................64<br />
Figure B3. Pie charts <strong>and</strong> histograms showing simulated groundwater budget for the<br />
<strong>Central</strong> <strong>Valley</strong> for typical (1975), dry (1990), <strong>and</strong> wet (1998) years ...............................65<br />
Figure B4. Maps of A, Estimated change in hydraulic head in upper part of the<br />
aquifer system from 1860 to 1961. B, Simulated change in hydraulic head in<br />
lower part of the aquifer system from spring 1962 to spring 2003 ...............................68<br />
Figure B5. Graphs showing monthly groundwater budget for the <strong>Central</strong> <strong>Valley</strong> for a<br />
dry year (1990), typical year (1975), <strong>and</strong> wet year (1998) ...............................................71<br />
Figure B6. Graphs of annual A, Delivery requirement, l<strong>and</strong>scape recharge,<br />
surface-water deliveries, <strong>and</strong> agricultural pumpage. B, Groundwater<br />
withdrawals for agricultural <strong>and</strong> urban use for the entire <strong>Central</strong> <strong>Valley</strong><br />
between 1962 <strong>and</strong> 2003 .......................................................................................................73<br />
Figure B7. Stacked bar chart showing simulated groundwater budget changes between<br />
water years 1962 <strong>and</strong> 2003 for the <strong>Central</strong> <strong>Valley</strong>, California ........................................75<br />
Figure B8. Stacked bar chart showing simulated annual changes in aquifer-system<br />
storage between water years 1962 <strong>and</strong> 2003 for the <strong>Central</strong> <strong>Valley</strong>, California .......76<br />
Figure B9. Graph showing simulated cumulative annual changes in aquifer-system storage<br />
between water years 1962 <strong>and</strong> 2003 for the <strong>Central</strong> <strong>Valley</strong>, California ......................77<br />
Figure B10. Pie charts <strong>and</strong> histograms of average annual groundwater budget for the<br />
A, Sacramento <strong>Valley</strong>. B, Delta <strong>and</strong> Eastside Streams. C, San Joaquin <strong>Valley</strong>.<br />
D, Tulare Basin .....................................................................................................................80<br />
Figure B11. Stacked bar chart of simulated flow through multi-zone wells ...................................84