Central Valley Aquifer, Chapters A and B - MAE Class Websites
Central Valley Aquifer, Chapters A and B - MAE Class Websites
Central Valley Aquifer, Chapters A and B - MAE Class Websites

You also want an ePaper? Increase the reach of your titles
YUMPU automatically turns print PDFs into web optimized ePapers that Google loves.
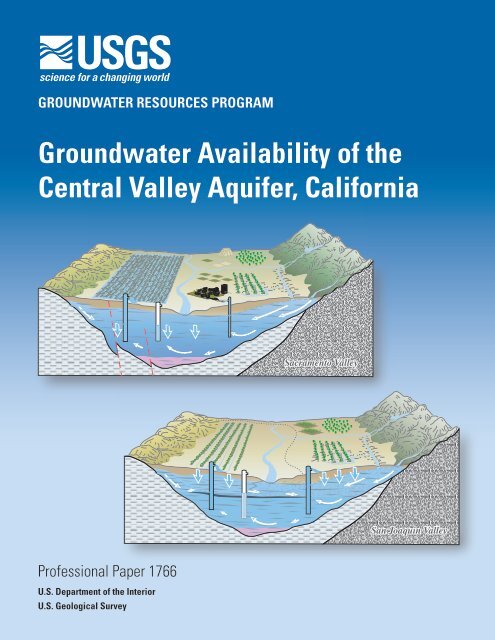
GROUNDWATER RESOURCES PROGRAM<br />
Groundwater Availability of the<br />
<strong>Central</strong> <strong>Valley</strong> <strong>Aquifer</strong>, California<br />
Professional Paper 1766<br />
U.S. Department of the Interior<br />
U.S. Geological Survey<br />
Sacramento <strong>Valley</strong><br />
San Joaquin <strong>Valley</strong>
Generalized block diagrams showing post-development hydrologeology of the Sacramento <strong>and</strong> San Joaquin <strong>Valley</strong>s, California.
Groundwater Availability of the<br />
<strong>Central</strong> <strong>Valley</strong> <strong>Aquifer</strong>, California<br />
Edited by Claudia C. Faunt<br />
Chapter A<br />
Introduction, Overview of Hydrogeology, <strong>and</strong> Textural Model of<br />
California’s <strong>Central</strong> <strong>Valley</strong><br />
By Claudia C. Faunt, R<strong>and</strong>all T. Hanson, <strong>and</strong> Kenneth Belitz<br />
Chapter B<br />
Groundwater Availability in California’s <strong>Central</strong> <strong>Valley</strong><br />
By Claudia C. Faunt, Kenneth Belitz, <strong>and</strong> R<strong>and</strong>all T. Hanson<br />
Chapter C<br />
Numerical Model of the Hydrologic L<strong>and</strong>scape <strong>and</strong> Groundwater<br />
Flow in California’s <strong>Central</strong> <strong>Valley</strong><br />
By Claudia C. Faunt, R<strong>and</strong>all T. Hanson, Kenneth Belitz, Wolfgang Schmid,<br />
Steven P. Predmore, Diane L. Rewis, <strong>and</strong> Kelly McPherson<br />
Appendix 1<br />
Supplemental Information—Modifications to<br />
Modflow-2000 Packages <strong>and</strong> Processes<br />
By Wolfgang Schmid <strong>and</strong> R.T. Hanson<br />
Groundwater Resources Program<br />
Professional Paper 1766<br />
U.S. Department of the Interior<br />
U.S. Geological Survey
U.S. Department of the Interior<br />
KEN SALAZAR, Secretary<br />
U.S. Geological Survey<br />
Suzette M. Kimball, Acting Director<br />
U.S. Geological Survey, Reston, Virginia: 2009<br />
For more information on the USGS—the Federal source for science about the Earth, its natural <strong>and</strong> living resources,<br />
natural hazards, <strong>and</strong> the environment, visit http://www.usgs.gov or call 1-888-ASK-USGS<br />
For an overview of USGS information products, including maps, imagery, <strong>and</strong> publications,<br />
visit http://www.usgs.gov/pubprod<br />
To order this <strong>and</strong> other USGS information products, visit http://store.usgs.gov<br />
Any use of trade, product, or firm names is for descriptive purposes only <strong>and</strong> does not imply endorsement by the U.S.<br />
Government.<br />
Although this report is in the public domain, permission must be secured from the individual copyright owners to<br />
reproduce any copyrighted materials contained within this report.<br />
Suggested citation:<br />
Faunt, C.C., ed., 2009, Groundwater Availability of the <strong>Central</strong> <strong>Valley</strong> <strong>Aquifer</strong>, California: U.S. Geological Survey<br />
Professional Paper 1766, 225 p.<br />
ISBN 978-1-4113-2515-9
Foreword<br />
An adequate supply of groundwater is essential for the Nation’s health <strong>and</strong> economic well<br />
being. Increased use of groundwater resources <strong>and</strong> the effects of drought have led to concerns<br />
about the future availability of groundwater to meet domestic, agricultural, industrial, <strong>and</strong> environmental<br />
needs. The resulting effects of competition for groundwater from human <strong>and</strong> environmental<br />
uses need to be better understood to respond to the following basic questions that are<br />
being asked about the Nation’s ability to meet current <strong>and</strong> future dem<strong>and</strong>s for groundwater. Do<br />
we have enough groundwater to meet the needs of the Nation? Where are these groundwater<br />
resources? Is groundwater available where it is needed? To help answer these questions, the<br />
U.S. Geological Survey’s (USGS) Groundwater Resources Program is conducting large-scale<br />
multidisciplinary regional studies of groundwater availability, such as this study of the <strong>Central</strong><br />
<strong>Valley</strong> <strong>Aquifer</strong> System, California.<br />
Regional groundwater availability studies quantify current groundwater resources, evaluate how<br />
those resources have changed through time, <strong>and</strong> provide tools that decision makers can use<br />
to forecast system responses to future development <strong>and</strong> climate variability <strong>and</strong> change. These<br />
quantitative studies are, by design, large in scope, can include multiple aquifers, <strong>and</strong> address<br />
critical groundwater issues. The USGS has previously identified the Nation’s principal aquifers<br />
<strong>and</strong> they will be used as a framework to classify <strong>and</strong> study regional groundwater systems.<br />
The groundwater availability studies being conducted for each regional groundwater flow system<br />
emphasize the use of long-term groundwater monitoring data, in conjunction with groundwater<br />
models, to improve underst<strong>and</strong>ing of the flow systems <strong>and</strong> assess the status <strong>and</strong> trends<br />
in groundwater resources in the context of a changing water budget for the aquifer system. The<br />
results of these individual groundwater availability studies will be used collectively as building<br />
blocks towards a national assessment of groundwater availability. In addition, these studies will<br />
provide the foundational information <strong>and</strong> modeling tools needed to help State <strong>and</strong> local resource<br />
managers make water availability decisions based on the latest comprehensive quantitative<br />
assessment given their regional water-management constraints <strong>and</strong> goals.<br />
Matthew C. Larsen, Associate Director for Water<br />
U.S. Geological Survey<br />
iii
iv<br />
This page intentionally left blank.
Contents<br />
Chapter A<br />
Introduction, Overview of Hydrogeology, <strong>and</strong> Textural Model of California’s <strong>Central</strong> <strong>Valley</strong><br />
Executive Summary .......................................................................................................................................1<br />
Geographic Information System (GIS) ..............................................................................................1<br />
Texture Modeling ..................................................................................................................................2<br />
Hydrologic System Modeling ..............................................................................................................2<br />
Introduction.....................................................................................................................................................3<br />
Purpose <strong>and</strong> Scope ..............................................................................................................................4<br />
Methods of Analyses............................................................................................................................6<br />
Data Compilation ..........................................................................................................................6<br />
Numerical Model .........................................................................................................................6<br />
Previous Investigations........................................................................................................................7<br />
Recent Regional Groundwater Models ....................................................................................7<br />
<strong>Central</strong> <strong>Valley</strong> Regional <strong>Aquifer</strong>-System Analysis (CV-RASA) ....................................7<br />
California <strong>Central</strong> <strong>Valley</strong> Groundwater-Surface-Water Simulation Model<br />
(C2VSIM) ..............................................................................................................10<br />
Study Area.....................................................................................................................................................10<br />
Climate .................................................................................................................................................10<br />
Sacramento <strong>Valley</strong> .............................................................................................................................10<br />
Delta <strong>and</strong> Eastside Streams ..............................................................................................................15<br />
San Joaquin Basin of the San Joaquin <strong>Valley</strong> ...............................................................................15<br />
Tulare Basin of the San Joaquin <strong>Valley</strong> ..........................................................................................17<br />
Water-Balance Subregions...............................................................................................................18<br />
Geologic History <strong>and</strong> Setting .....................................................................................................................18<br />
Hydrogeology................................................................................................................................................20<br />
<strong>Aquifer</strong> Characteristics ......................................................................................................................20<br />
Textural Analysis .................................................................................................................................23<br />
Selection <strong>and</strong> Compilation of Existing Well Data .................................................................25<br />
<strong>Class</strong>ification of Texture from Drillers’ Logs <strong>and</strong> Regularization of Well Data ................26<br />
Geostatistical Modeling Approach .........................................................................................26<br />
Regions <strong>and</strong> Domains ......................................................................................................26<br />
Geostatistical Model of Coarse-Grained Texture ........................................................27<br />
3-D Model of Percentage of Coarse-Grained Texture ................................................29<br />
Results of Texture Model ..........................................................................................................30<br />
Sacramento <strong>Valley</strong> ............................................................................................................30<br />
San Joaquin <strong>Valley</strong> ...........................................................................................................39<br />
Hydrologic System ..............................................................................................................................40<br />
Climate ........................................................................................................................................41<br />
Surface Water ............................................................................................................................46<br />
v
vi<br />
Groundwater ..............................................................................................................................47<br />
Predevelopment Recharge, Discharge, Water Levels, <strong>and</strong> Flows ...........................48<br />
Groundwater/Surface-Water Interaction .....................................................................48<br />
<strong>Aquifer</strong>-System Storage ..................................................................................................48<br />
Water Budget ....................................................................................................................53<br />
Acknowledgments .......................................................................................................................................53<br />
References Cited..........................................................................................................................................54<br />
Chapter B<br />
Groundwater Availability in California’s <strong>Central</strong> <strong>Valley</strong><br />
Introduction ..................................................................................................................................................59<br />
Development <strong>and</strong> the Hydrologic System ...............................................................................................59<br />
Surface-Water <strong>and</strong> Groundwater Development History .............................................................59<br />
L<strong>and</strong> Use ...............................................................................................................................................60<br />
Agricultural L<strong>and</strong> Use ...............................................................................................................61<br />
Urban L<strong>and</strong> Use ..........................................................................................................................61<br />
Development <strong>and</strong> Changes to the Hydrologic Budget ..........................................................................62<br />
Hydrologic Budget Components ......................................................................................................62<br />
Recharge <strong>and</strong> Discharge ..........................................................................................................66<br />
<strong>Aquifer</strong>-System Storage ...........................................................................................................67<br />
Intra-Annual Variations in Typical, Dry, <strong>and</strong> Wet Years .......................................................70<br />
Temporal Variation in the Hydrologic Budget ...............................................................................72<br />
Spatial Variation in the Hydrologic Budget ....................................................................................79<br />
Water Levels <strong>and</strong> Groundwater Flow .............................................................................................79<br />
L<strong>and</strong> Subsidence.................................................................................................................................98<br />
Surface Water <strong>and</strong> the Environment .............................................................................................101<br />
Global Climate Change <strong>and</strong> Variability ...................................................................................................102<br />
Past Climates .....................................................................................................................................102<br />
Future Climate Projections ..............................................................................................................102<br />
Groundwater Sustainability <strong>and</strong> Management ....................................................................................103<br />
Groundwater Sustainability ............................................................................................................103<br />
Groundwater Management ............................................................................................................104<br />
Conjunctive Use .......................................................................................................................106<br />
Water Banking ..........................................................................................................................107<br />
Other Management Strategies ..............................................................................................108<br />
Monitoring the Hydrologic System .........................................................................................................109<br />
Groundwater ......................................................................................................................................110<br />
Surface Water ...................................................................................................................................111<br />
Subsidence ........................................................................................................................................112<br />
Water Quality .....................................................................................................................................112<br />
L<strong>and</strong> Use <strong>and</strong> Climate.......................................................................................................................114<br />
Summary......................................................................................................................................................114<br />
References Cited........................................................................................................................................116
Chapter C<br />
Numerical Model of the Hydrologic L<strong>and</strong>scape <strong>and</strong> Groundwater Flow in<br />
California’s <strong>Central</strong> <strong>Valley</strong><br />
Introduction ................................................................................................................................................121<br />
Model Development ..................................................................................................................................121<br />
Discretization ....................................................................................................................................123<br />
Spatial Discretization <strong>and</strong> Layering ......................................................................................123<br />
Temporal Discretization .........................................................................................................126<br />
Boundary Conditions .......................................................................................................................126<br />
Specified-Flow Boundaries ....................................................................................................128<br />
Pumpage ...................................................................................................................................128<br />
Agricultural Pumpage ....................................................................................................128<br />
Urban Pumpage ..............................................................................................................130<br />
Recharge from <strong>and</strong> Discharge to the Delta .........................................................................131<br />
Recharge from <strong>and</strong> Discharge to Canals <strong>and</strong> Streams .....................................................132<br />
Water-Table Simulation ...................................................................................................................132<br />
Farm Process (FMP) .........................................................................................................................132<br />
Delivery Requirement ..............................................................................................................134<br />
Soils ..............................................................................................................................135<br />
L<strong>and</strong> Use ...........................................................................................................................135<br />
Virtual Crop Maps ..................................................................................................139<br />
Crop-Type Data .......................................................................................................143<br />
Climate Data ....................................................................................................................151<br />
Reference Evapotranspiration (ETo) ...................................................................151<br />
Precipitation ...........................................................................................................152<br />
Surface-Water Supply ............................................................................................................152<br />
Groundwater Supply ...............................................................................................................152<br />
Net Recharge ...........................................................................................................................154<br />
Hydraulic Properties.........................................................................................................................154<br />
Hydraulic Conductivity ............................................................................................................156<br />
Storage Properties ..................................................................................................................158<br />
Hydrogeologic Units ...............................................................................................................160<br />
Hydrogeologic Structures .....................................................................................................160<br />
Initial Conditions................................................................................................................................160<br />
Model Calibration <strong>and</strong> Sensitivity ...........................................................................................................161<br />
Observations Used in Model Calibration ......................................................................................161<br />
Water-Level Altitudes, Water-Level Altitude Changes, <strong>and</strong><br />
Water-Level Altitude Maps .......................................................................................163<br />
Water-Table <strong>and</strong> Potentiometric-Surface Maps .......................................................167<br />
Sacramento <strong>Valley</strong> .................................................................................................167<br />
Delta .....................................................................................................................167<br />
San Joaquin <strong>Valley</strong> ...............................................................................................170<br />
Tulare Basin ............................................................................................................170<br />
Streamflow Observations .......................................................................................................170<br />
Boundary Flow Observations .................................................................................................173<br />
vii
viii<br />
Subsidence Observations ......................................................................................................173<br />
Pumpage Observations ...........................................................................................................179<br />
Water-Use Observations ........................................................................................................179<br />
Water-Delivery Observations.................................................................................................181<br />
Model Parameters ...........................................................................................................................181<br />
Sensitivity Analysis ..........................................................................................................................191<br />
Simulation Results <strong>and</strong> Budget ...............................................................................................................191<br />
Recharge <strong>and</strong> Discharge .................................................................................................................192<br />
<strong>Aquifer</strong>-System Storage ..................................................................................................................197<br />
Model Uncertainty <strong>and</strong> Limitations ........................................................................................................203<br />
Future Work ................................................................................................................................................205<br />
References Cited........................................................................................................................................207<br />
Appendix 1<br />
Supplemental Information—Modifications to Modflow-2000 Packages <strong>and</strong> Processes<br />
Introduction.................................................................................................................................................213<br />
Layer-Property Flow Package (LPF) .......................................................................................................213<br />
Multiplier Package (MULT).......................................................................................................................213<br />
Time-Series Package (HYDMOD) ............................................................................................................213<br />
Streamflow Routing Package (SFR1) ......................................................................................................214<br />
The Farm Process (FMP1) ........................................................................................................................214<br />
Concepts <strong>and</strong> Input Instructions for New FMP1 Features ........................................................214<br />
Data for each Simulation ........................................................................................................215<br />
Data for each Stress Period ...................................................................................................216<br />
Root Uptake Under Variably Saturated Conditions (PSI specified in Item 14) ........................217<br />
Current Concept of Root Uptake from Unsaturated Conditions .......................................217<br />
Exp<strong>and</strong>ed Concept of Root Uptake from Variably Saturated Conditions ........................217<br />
Input Instructions .....................................................................................................................221<br />
Matrix of On-Farm Efficiencies (OFE specified in Items 7 or 24) ...............................................221<br />
Input Requirements .................................................................................................................221<br />
Data Output ...............................................................................................................................221<br />
Non-Irrigation Crops (NONIRR Specified in Items 15 or 27) ......................................................222<br />
Consumptive Use Options (ICUFL Specified in Item 2; ETR Specified as New Item) ............222<br />
Semi-Routed Delivery (ISRDFL in Item 2; REACH in Items 20 or 34) .........................................222<br />
Semi-Routed Surface-Water Runoff-Return Flow (ISRRFL in Item 2 <strong>and</strong> ROW COLUMN<br />
SEGMENT REACH Specified as New Item) ....................................................................223<br />
Farm-Related Data List for Semi-Routed Runoff-Return Flow Locations<br />
(New Item Added After Items 20 or 34): ........................................................223<br />
Additional Auxiliary Variable (AUX NOCIRNOQ Specified in Item 2) .......................................224<br />
Farm Budget Output Options (IFBPFL Specified in Item 2) ........................................................224<br />
References Cited........................................................................................................................................225
Figures<br />
Chapter A<br />
Figure A1. Map of <strong>Central</strong> <strong>Valley</strong> major geomorphic provinces, alluvial fans of the<br />
San Joaquin Basin, <strong>and</strong> extent <strong>and</strong> thickness of Corcoran Clay ....................................5<br />
Figure A2. Diagram showing the relation <strong>and</strong> flow of information used in analyzing the<br />
<strong>Central</strong> <strong>Valley</strong> Hydrogeologic system .................................................................................7<br />
Figure A3. Diagram showing the diversity of data types <strong>and</strong> categories included in the<br />
centralized geospatial database ..........................................................................................8<br />
Figure A4. Diagram showing an example of the detail for compilation, integration, <strong>and</strong><br />
analysis for one data type (water-level nformation) .........................................................9<br />
Figure A5. A, Map of surface-water inflows <strong>and</strong> average annual precipitation for<br />
September 1961 through September 2003 throughout the <strong>Central</strong> <strong>Valley</strong>,<br />
California. B, Map showing average annual reference evapotranspiration (ETo)<br />
for September 1961 through September 2003 throughout the <strong>Central</strong> <strong>Valley</strong>,<br />
California ................................................................................................................................12<br />
Figure A6. Graph of average monthly precipitation for Redding, Davis, <strong>and</strong><br />
Bakersfield, California ..........................................................................................................14<br />
Figure A7. Map of general features of the surface-water system in the <strong>Central</strong><br />
<strong>Valley</strong>, California ....................................................................................................................16<br />
Figure A8. Map of distribution of water-balance subregions (WBSs) used for<br />
surface-water delivery <strong>and</strong> estimation of groundwater pumpage ...............................19<br />
Figure A9. Generalized cross-sections showing pre- <strong>and</strong> post-development of the<br />
A, Sacramento <strong>Valley</strong>. B, <strong>Central</strong> part of the San Joaquin <strong>Valley</strong>,<br />
California .................................................................................................................................21<br />
Figure A10. A, Map of <strong>Central</strong> <strong>Valley</strong> showing groundwater basins <strong>and</strong> subbasins,<br />
groupings of basins <strong>and</strong> subbasins into spatial provinces <strong>and</strong> domains for<br />
textural analysis. B, Map showing distribution of wells used for mapping texture.<br />
C, Graph showing count of wells for each depth increment by domains<br />
through 1,200 feet .................................................................................................................24<br />
Figure A11. Generalized hydrogeologic section (A–A’) indicating the vertical discretization<br />
of the numerical model of the groundwater-flow system in the <strong>Central</strong> <strong>Valley</strong>,<br />
California ................................................................................................................................29<br />
Figure A12. Maps showing kriged distribution of coarse-grained deposits for layers 1, 3,<br />
Corcoran Clay, 6, <strong>and</strong> 9 of the groundwater-flow model. A, Layer 1. B, Layer 3.<br />
C, Corcoran Clay. D, Layer 6. E, Layer 9 .............................................................................31<br />
Figure A13. Block diagram of kriged texture within groundwater-flow model ..............................36<br />
Figure A14. Map showing distribution of coarse-grained deposits for the upper 50 feet<br />
for part of the <strong>Central</strong> <strong>Valley</strong>...............................................................................................37<br />
Figure A15. Graph of cumulative distributions of kriged sediment textures for model<br />
layers in the A, Sacramento <strong>Valley</strong>. B, San Joaquin <strong>Valley</strong> <strong>and</strong> Tulare Basin ...........38<br />
Figure A16. A, Bar chart of total inflow from 44 gaged streams flowing into the<br />
<strong>Central</strong> <strong>Valley</strong>, California, water years 1962–2003. B, Graph of average annual<br />
precipitation in the <strong>Central</strong> <strong>Valley</strong>, California, water years 1962–2003.<br />
C, Pie chart of total surface-water flow into the <strong>Central</strong> <strong>Valley</strong>, California,<br />
water years 1962–2003 .......................................................................................................42<br />
ix
x<br />
Figure A17. Graph of cumulative departure from average annual precipitation at<br />
Redding, Davis, Fresno, <strong>and</strong> Bakersfield, California ......................................................44<br />
Figure A18. Graph of cumulative departure of monthly precipitation (Parameter-<br />
elevation Regressions on Independent Slopes Model (PRISM) data from Davis,<br />
California), cumulative departure of the Pacific Decadal Oscillation (PDO)<br />
index, <strong>and</strong> cumulative departure of the monthly reference evapotranspiration<br />
(ETo) values (gridded values of California Irrigation Management Information<br />
System’s (CIMIS) stations from Redding, Davis, <strong>and</strong> Bakersfield, 1960–2004) .........45<br />
Figure A19. Graph of cumulative departure of streamflow diversions from the<br />
Bear River by South Sutter Water District, California; cumulative annual<br />
temperature from California Irrigation Management Information System’s<br />
(CIMIS) stations at Davis <strong>and</strong> the Pacific Decadal Oscillation (PDO) index,<br />
1960–2004 ..............................................................................................................................47<br />
Figure A20. Map of pre-development groundwater map ....................................................................49<br />
Figure A21. Maps of distribution of A, Pre-1900 l<strong>and</strong>-use patterns. B, L<strong>and</strong>-use<br />
patterns in 2000 for the <strong>Central</strong> <strong>Valley</strong>, California ...........................................................50<br />
Figure A22. Map of distribution of selected streams <strong>and</strong> canals, <strong>and</strong> average<br />
estimated gains <strong>and</strong> losses for selected segments .......................................................52<br />
Figure A23. Diagrams of pre-development water budget <strong>and</strong> post-development<br />
water budget .........................................................................................................................53<br />
Chapter B<br />
Figure B1. Diagram showing average water budget for water years 1962–2003 .........................63<br />
Figure B2. Pie charts <strong>and</strong> histograms showing simulated l<strong>and</strong>scape budget for the<br />
<strong>Central</strong> <strong>Valley</strong> for typical (1975), dry (1990), <strong>and</strong> wet (1998) years ...............................64<br />
Figure B3. Pie charts <strong>and</strong> histograms showing simulated groundwater budget for the<br />
<strong>Central</strong> <strong>Valley</strong> for typical (1975), dry (1990), <strong>and</strong> wet (1998) years ...............................65<br />
Figure B4. Maps of A, Estimated change in hydraulic head in upper part of the<br />
aquifer system from 1860 to 1961. B, Simulated change in hydraulic head in<br />
lower part of the aquifer system from spring 1962 to spring 2003 ...............................68<br />
Figure B5. Graphs showing monthly groundwater budget for the <strong>Central</strong> <strong>Valley</strong> for a<br />
dry year (1990), typical year (1975), <strong>and</strong> wet year (1998) ...............................................71<br />
Figure B6. Graphs of annual A, Delivery requirement, l<strong>and</strong>scape recharge,<br />
surface-water deliveries, <strong>and</strong> agricultural pumpage. B, Groundwater<br />
withdrawals for agricultural <strong>and</strong> urban use for the entire <strong>Central</strong> <strong>Valley</strong><br />
between 1962 <strong>and</strong> 2003 .......................................................................................................73<br />
Figure B7. Stacked bar chart showing simulated groundwater budget changes between<br />
water years 1962 <strong>and</strong> 2003 for the <strong>Central</strong> <strong>Valley</strong>, California ........................................75<br />
Figure B8. Stacked bar chart showing simulated annual changes in aquifer-system<br />
storage between water years 1962 <strong>and</strong> 2003 for the <strong>Central</strong> <strong>Valley</strong>, California .......76<br />
Figure B9. Graph showing simulated cumulative annual changes in aquifer-system storage<br />
between water years 1962 <strong>and</strong> 2003 for the <strong>Central</strong> <strong>Valley</strong>, California ......................77<br />
Figure B10. Pie charts <strong>and</strong> histograms of average annual groundwater budget for the<br />
A, Sacramento <strong>Valley</strong>. B, Delta <strong>and</strong> Eastside Streams. C, San Joaquin <strong>Valley</strong>.<br />
D, Tulare Basin .....................................................................................................................80<br />
Figure B11. Stacked bar chart of simulated flow through multi-zone wells ...................................84
Figure B12. Map of altitude of the A, Water table in the unconfined part of the aquifer<br />
system. B, Potentiometric surface of the confined part of the aquifer system for<br />
1961. C, Unconfined part of the aquifer system. D, Potentiometric surface of<br />
the confined part of the aquifer system for 1976. E, Unconfined part of<br />
the aquifer system. F, Potentiometric surface of the confined part of the<br />
aquifer system, for 2000 .....................................................................................................86<br />
Figure B13. Map showing hydrographs for representative wells in the <strong>Central</strong> <strong>Valley</strong>,<br />
California ................................................................................................................................92<br />
Figure B14. Map of estimated depth to water table in spring 2000 ...................................................96<br />
Figure B15. A, Map of areal extent of l<strong>and</strong> subsidence in the <strong>Central</strong> <strong>Valley</strong> <strong>and</strong><br />
locations of extensometers. B, Graph of compaction data from selected<br />
extensometers <strong>and</strong> total simulated pumpage in the <strong>Central</strong> <strong>Valley</strong> ............................99<br />
Figure B16. Graph of measured compaction in relation to head decline in the<br />
San Joaquin <strong>Valley</strong> .............................................................................................................101<br />
Figure B17. Graph showing streamflow gains <strong>and</strong> losses in the <strong>Central</strong> <strong>Valley</strong><br />
between 1962 <strong>and</strong> 2003 .....................................................................................................105<br />
Figure B18. Diagram of relationship of water-level changes <strong>and</strong> critical heads to<br />
subsidence <strong>and</strong> inelastic compaction ...........................................................................109<br />
Chapter C<br />
Figure C1. Map of <strong>Central</strong> <strong>Valley</strong> Hydrologic Model grid: A, Extent of San Joaquin<br />
Formation, Corcoran Member of the Tulare Formation, crystalline bedrock,<br />
<strong>and</strong> horizontal flow barriers. B, Upper-most active layer............................................124<br />
Figure C2. Map of distribution of general-head boundary cells <strong>and</strong> major streams<br />
<strong>and</strong> canals with streamflow-routing cells (including location of inflows <strong>and</strong><br />
diversions) ...........................................................................................................................127<br />
Figure C3. Map of distribution of urban <strong>and</strong> agricultural wells simulated in the<br />
<strong>Central</strong> <strong>Valley</strong> Hydrologic Model ....................................................................................129<br />
Figure C4. Graph of urban pumpage from U.S. Geological Survey <strong>and</strong> California<br />
Department of Water Resources data ............................................................................131<br />
Figure C5. Flow chart of water inflows to <strong>and</strong> outflows from a “farm” as simulated<br />
by the Farm Process (FMP) .............................................................................................133<br />
Figure C6. Map of agricultural soils for the <strong>Central</strong> <strong>Valley</strong>, California, derived from<br />
STATSGO data ....................................................................................................................136<br />
Figure C7. Graph showing cumulative departure of precipitation, Pacific Decadal<br />
Oscillation (PDO) Index, climate windows, <strong>and</strong> time frame l<strong>and</strong>-use maps<br />
were applied .......................................................................................................................137<br />
Figure C8. Map showing virtual crops for 1960 (modified with 2000 data), including<br />
pie chart of percentage of different virtual crops ........................................................140<br />
Figure C9. Map showing virtual crops for 1973, including pie chart of percentage of<br />
different virtual crops ........................................................................................................141<br />
Figure C10. Map showing virtual crops for 1992, including pie chart of percentage of<br />
different virtual crops .......................................................................................................142<br />
Figure C11. Map showing virtual crops for 1998, including pie chart of percentage of<br />
different virtual crops .......................................................................................................144<br />
xi
xii<br />
Figure C12. Map showing virtual crops for 2000, including a pie chart of percentage of<br />
different virtual crops .......................................................................................................145<br />
Figure C13. Graphs showing monthly crop coefficients for virtual crops in the<br />
<strong>Central</strong> <strong>Valley</strong>, California ..................................................................................................147<br />
Figure C14. Graph showing relation between hydraulic conductivity <strong>and</strong> percentage<br />
coarse-grained deposits based on hydraulic conductivity end members <strong>and</strong><br />
exponent of the power mean ..........................................................................................155<br />
Figure C15. Map of distribution of calibration data (groundwater levels, gains <strong>and</strong><br />
losses of streamflow, <strong>and</strong> subsidence observations)................................................162<br />
Figure C16. Map of distribution of wells with water-level-altitude data for the<br />
simulation period 1961–2003, <strong>and</strong> location of wells selected for model<br />
calibration ..........................................................................................................................164<br />
Figure C17. Graph of plots of simulated water-level altitude values compared with the<br />
measured water-level altitudes for the A, Entire modeled area (<strong>and</strong> with inset<br />
with histogram of residuals). B, Sacramento <strong>Valley</strong>. C, Delta <strong>and</strong> Eastside.<br />
D, San Joaquin Basin. E, Tulare Basin ..........................................................................165<br />
Figure C18. Maps of the simulated A, Water-table altitude in spring 1976.<br />
B, Potentiometric-surface altitude in spring 1976 for the calibrated transient<br />
groundwater-flow model of the <strong>Central</strong> <strong>Valley</strong> ............................................................168<br />
Figure C19. Map showing distribution of stream gain/loss segments used for model<br />
calibration A, Measured gaining <strong>and</strong> losing reaches for selected stream<br />
reaches for 1961–1977. B, Simulated gaining <strong>and</strong> losing reaches for<br />
selected stream reaches for 1961–1977 for the <strong>Central</strong> <strong>Valley</strong>, California ..............171<br />
Figure C20. Map of distribution of historical subsidence, estimated from 1961 to<br />
1977 extensometer data, <strong>Central</strong> <strong>Valley</strong>, California .....................................................174<br />
Figure C21. A, Map of distribution of total simulated subsidence for water years<br />
1962 through 2003, <strong>and</strong> locations of subsidence measurements. B, Graph<br />
of aggregate compaction measured at, <strong>and</strong> simulated subsidence for,<br />
selected extensometer locations, <strong>Central</strong> <strong>Valley</strong>, California .....................................175<br />
Figure C22. Graph of agricultural pumpage from 1961–77 estimated from power<br />
records compared to <strong>Central</strong> <strong>Valley</strong> Hydrologic Model simulated agricultural<br />
pumpage for the <strong>Central</strong> <strong>Valley</strong>, California ...................................................................180<br />
Figure C23. Graph showing A, Annual water deliveries. B, Monthly water deliveries<br />
from the mid 1970s to mid 1980s for water-balance subregion 14 ............................182<br />
Figure C24. Graph showing single <strong>and</strong> double cropped crop coefficient values for<br />
truck crops .........................................................................................................................183<br />
Figure C25. Graph showing original <strong>and</strong> adjusted crop coefficient values for truck <strong>and</strong><br />
cotton crops .......................................................................................................................184<br />
Figure C26. Map showing distribution of cells used for streams, colored by streambed<br />
hydraulic conductivity values for cells estimated during calibration ......................190<br />
Figure C27. Graph showing relative composite sensitivity of computed water-level<br />
altitudes, flows, <strong>and</strong> subsidence information at calibration points to changes<br />
in parameters .....................................................................................................................192
Figure C28. Pie chart <strong>and</strong> histograms showing average annual components of farm<br />
budget for water years 1962–2003 .................................................................................193<br />
Figure C29. Stacked bar chart showing farm budget changes through time for the<br />
<strong>Central</strong> <strong>Valley</strong>, California ..................................................................................................194<br />
Figure C30. Graphs showing farm budget changes through time for water-balance<br />
subregion 13, western San Joaquin <strong>Valley</strong>, <strong>Central</strong> <strong>Valley</strong>, California.<br />
A, Water years 1962–2003. B, Water years 1977–1985 ...............................................195<br />
Figure C31. Stacked bar chart showing groundwater budget changes through time<br />
for the <strong>Central</strong> <strong>Valley</strong>. A, All values. B, Net values ......................................................197<br />
Appendix<br />
Figure 1-1. Diagram of evaluation of active <strong>and</strong> inactive parts of a variably<br />
saturated root zone in FMP .............................................................................................218<br />
Figure 1-2. Diagram of conceptualization to the change of transpiration uptake<br />
from a saturated root zone with varying water level ..................................................220<br />
xiii
xiv<br />
Tables<br />
Chapter A<br />
Table A1. Water-balance subregions within the <strong>Central</strong> <strong>Valley</strong>, California ...................................11<br />
Table A2. Distribution of statistical properties for the percentage of coarse-grained<br />
deposits for the <strong>Central</strong> <strong>Valley</strong>, Calfornia, by domain, including variogram <strong>and</strong><br />
variogram models ....................................................................................................................28<br />
Table A3. <strong>Central</strong> <strong>Valley</strong>, California, groundwater flow model layer thicknesses <strong>and</strong> depths ....29<br />
Chapter B<br />
Table B1. Summary of the simulated l<strong>and</strong>scape budget for average (water years<br />
1962-2003), typical (1975), dry (1990), <strong>and</strong> wet (1998) years for the <strong>Central</strong> <strong>Valley</strong>,<br />
California ..................................................................................................................................66<br />
Table B2. Summary of the simulated groundwater budget for average (water years<br />
1962-2003), typical (1975), dry (1990), <strong>and</strong> wet (1998) years for the <strong>Central</strong> <strong>Valley</strong>,<br />
California ..................................................................................................................................66<br />
Table B3. Selected average annual hydrologic budget components for water years<br />
1962–2003 for each of the 21 water balance areas in the <strong>Central</strong> <strong>Valley</strong>,<br />
California ..................................................................................................................................78<br />
Chapter C<br />
Table C1. MODFLOW-2000 packages <strong>and</strong> processes used with the hydrologic flow<br />
model of the <strong>Central</strong> <strong>Valley</strong>, California ...............................................................................122<br />
Table C2. Coordinates of the <strong>Central</strong> <strong>Valley</strong> Hydrologic Model grid ..............................................126<br />
Table C3. L<strong>and</strong>-use periods with acreage in square miles <strong>and</strong> percentage of<br />
different virtual crop categories .........................................................................................138<br />
Table C4. Summary of <strong>Central</strong> <strong>Valley</strong>, California, virtual crop categories <strong>and</strong> properties .........146<br />
Table C5. Summary of fractions of transpiration <strong>and</strong> evaporation by month for<br />
<strong>Central</strong> <strong>Valley</strong>, California, virtual crops .............................................................................150<br />
Table C6. Average area-weighted composite efficiency for each water-balance<br />
subregion of the <strong>Central</strong> <strong>Valley</strong>, California, through the simulation period .................151<br />
Table C7. Average reference evapotranspiration (ETo) by month for the <strong>Central</strong> <strong>Valley</strong>,<br />
California, for 1961–2003 based on temperature data using the Hargreaves–<br />
Samani equation ....................................................................................................................153<br />
Table C8. Measured <strong>and</strong> simulated hydraulic properties ................................................................157<br />
Table C9. Estimated <strong>and</strong> <strong>Central</strong> <strong>Valley</strong> Hydrologic Model-simulated average <strong>and</strong> unit<br />
evapotranspiration of applied water (ETaw) for the <strong>Central</strong> <strong>Valley</strong>, California ..........180<br />
Table C10. Parameter values estimated for the <strong>Central</strong> <strong>Valley</strong> Hydrologic Model ........................185<br />
Table C11. Simulated farm budget for the <strong>Central</strong> <strong>Valley</strong>, California, in acre-feet per year ........199<br />
Table C12. Simulated groundwater budget for the <strong>Central</strong> <strong>Valley</strong>, California,<br />
in acre-feet per year ............................................................................................................200
Conversion Factors<br />
Inch/Pound to SI<br />
Multiply By To obtain<br />
Length<br />
inch (in.) 2.54 centimeter (cm)<br />
inch (in.) 25.4 millimeter (mm)<br />
foot (ft) 0.3048 meter (m)<br />
mile (mi) 1.609 kilometer (km)<br />
mile, (mi) 1.609 kilometer (km)<br />
Area<br />
acre 4,047 square meter (m 2 )<br />
acre 0.4047 hectare (ha)<br />
acre 0.4047 square hectometer (hm 2 )<br />
acre 0.004047 square kilometer (km 2 )<br />
square foot (ft 2 ) 929.0 square centimeter (cm 2 )<br />
square foot (ft 2 ) 0.09290 square meter (m 2 )<br />
square inch (in 2 ) 6.452 square centimeter (cm 2 )<br />
section (640 acres or 1 square mile) 259.0 square hectometer (hm 2 )<br />
square mile (mi 2 ) 259.0 hectare (ha)<br />
square mile (mi 2 ) 2.590 square kilometer (km 2 )<br />
Volume<br />
acre-foot (acre-ft) 1,233 cubic meter (m 3 )<br />
acre-foot (acre-ft) 0.001233 cubic hectometer (hm 3 )<br />
Flow rate<br />
acre-foot per day (acre-ft/d) 0.01427 cubic meter per second (m 3 /s)<br />
acre-foot per year (acre-ft/yr) 1,233 cubic meter per year (m 3 /yr)<br />
acre-foot per year (acre-ft/yr) 0.001233 cubic hectometer per year (hm 3 /yr)<br />
Hydraulic conductivity<br />
foot per day (ft/d) 0.3048 meter per day (m/d)<br />
Temperature in degrees Celsius (°C) may be converted to degrees Fahrenheit (°F) as follows:<br />
°F=(1.8×°C)+32<br />
Vertical coordinate information is referenced to the National Geodetic Vertical Datum of 1929<br />
(NGVD 29).<br />
Altitude, as used in this report, refers to distance above or below the NGVD 29.<br />
NGVD 29 can be converted to the North American Vertical Datum of 1988 (NAVD 88) by using the<br />
National Geodetic Survey conversion utility available at URL http://www.ngs.noaa.gov/TOOLS/<br />
xv
xvi<br />
Well-Numbering System<br />
-<br />
<br />
<br />
<br />
-<br />
-<br />
<br />
<br />
<br />
<br />
<br />
TOWNSHIP<br />
T13N<br />
T12N<br />
T11N<br />
T10N<br />
T9N<br />
R2W<br />
RANGE<br />
R1W R1E<br />
Mt. Diablo Meridian<br />
R2E R3E<br />
T11N<br />
R1E<br />
6 5 4 3 2<br />
7 8 9 10 11<br />
18 17 16 15 14 13<br />
19 20 21 22 23<br />
30 29 28 27 26 25<br />
31 32 33 34 35 36<br />
D C B A<br />
E F G H<br />
M<br />
SECTION 24<br />
L<br />
K<br />
J<br />
N P Q R<br />
11N/1E-24Q8<br />
Well-numbering diagram (Note: maps in this report use abbreviated well numbers such as "24Q8")<br />
1<br />
12<br />
24
Chapter A. Introduction, Overview of Hydrogeology, <strong>and</strong> Textural<br />
Model of California’s <strong>Central</strong> <strong>Valley</strong><br />
By Claudia C. Faunt, R<strong>and</strong>all T. Hanson, <strong>and</strong> Kenneth Belitz<br />
Executive Summary<br />
<br />
<br />
<br />
<br />
-<br />
<br />
<br />
<br />
its aquifers.<br />
<br />
<br />
<br />
<br />
<br />
<br />
<br />
<br />
<br />
<br />
<br />
-<br />
<br />
<br />
<br />
<br />
<br />
<br />
<br />
<br />
<br />
<br />
<br />
<br />
<br />
<br />
<br />
<br />
<br />
<br />
<br />
<br />
<br />
<br />
<br />
<br />
<br />
Geographic Information System (GIS)<br />
<br />
<br />
<br />
<br />
<br />
<br />
<br />
-<br />
<br />
<br />
<br />
<br />
<br />
<br />
-<br />
<br />
<br />
<br />
resampled to produce spatial <strong>and</strong> temporal data sets needed for
2 Groundwater Availability of the <strong>Central</strong> <strong>Valley</strong> <strong>Aquifer</strong>, California<br />
Texture Modeling<br />
<br />
<br />
<br />
<br />
<br />
<br />
<br />
<br />
<br />
<br />
<br />
-<br />
<br />
<br />
<br />
-<br />
<br />
<br />
<br />
-<br />
<br />
<br />
<br />
<br />
<br />
<br />
<br />
<br />
<br />
<br />
<br />
<br />
<br />
<br />
<br />
<br />
-<br />
<br />
<br />
<br />
<br />
<br />
<br />
<br />
<br />
<br />
<br />
<br />
<br />
-<br />
<br />
<br />
-<br />
<br />
Hydrologic System Modeling<br />
<br />
<br />
<br />
<br />
<br />
<br />
<br />
<br />
<br />
<br />
<br />
<br />
<br />
<br />
<br />
<br />
<br />
-<br />
-<br />
<br />
<br />
<br />
-<br />
<br />
<br />
<br />
-<br />
-<br />
<br />
<br />
<br />
<br />
20,000 model cells of 1-mi 2 <br />
<br />
<br />
<br />
-<br />
<br />
-
-<br />
<br />
<br />
<br />
<br />
<br />
<br />
-<br />
<br />
<br />
<br />
<br />
<br />
precipitation.<br />
<br />
-<br />
<br />
<br />
-<br />
<br />
<br />
<br />
<br />
<br />
-<br />
<br />
<br />
<br />
<br />
<br />
<br />
<br />
<br />
<br />
-<br />
<br />
<br />
<br />
<br />
<br />
<br />
<br />
<br />
<br />
<br />
<br />
<br />
<br />
<br />
<br />
<br />
Introduction 3<br />
-<br />
<br />
<br />
<br />
<br />
<br />
<br />
<br />
<br />
also could be used as a platform to connect the simulation<br />
<br />
<br />
<br />
<br />
<br />
<br />
<br />
<br />
-<br />
<br />
<br />
<br />
Introduction<br />
<br />
<br />
-<br />
<br />
<br />
-<br />
<br />
<br />
<br />
<br />
<br />
<br />
<br />
<br />
<br />
<br />
-<br />
<br />
<br />
-<br />
<br />
<br />
<br />
<br />
<br />
<br />
<br />
-<br />
<br />
<br />
to continue.
4 Groundwater Availability of the <strong>Central</strong> <strong>Valley</strong> <strong>Aquifer</strong>, California<br />
ties,<br />
industries, <strong>and</strong> ecosystems that depend directly or indi-<br />
<br />
<br />
<br />
<br />
nia<br />
(<br />
<br />
-<br />
<br />
<br />
<br />
<br />
<br />
source of supply is a function of many factors—both natural<br />
<strong>and</strong> human—that control its use. Natural factors include<br />
<br />
<br />
<br />
-<br />
<br />
<br />
<br />
<br />
<br />
-<br />
<br />
<br />
<br />
<br />
Purpose <strong>and</strong> Scope<br />
<br />
<br />
<br />
<br />
<br />
<br />
<br />
-<br />
<br />
-<br />
<br />
report. Included in are descriptions of the effects of<br />
<br />
<br />
<br />
-<br />
<br />
.<br />
<br />
<br />
<br />
<br />
<br />
<br />
<br />
<br />
<br />
<br />
<br />
<br />
<br />
1. <br />
<br />
<br />
2. <br />
<br />
<br />
<br />
3. <br />
<br />
<br />
<br />
<br />
<br />
“<br />
<br />
-<br />
<br />
-<br />
<br />
<br />
<br />
in <br />
<br />
<br />
<br />
model that is described in . describes the<br />
-
40°<br />
39°<br />
38°<br />
37°<br />
36°<br />
35°<br />
Klamath Mts<br />
Carquinez<br />
Straits<br />
C o a s t<br />
San Francisco<br />
Bay<br />
Selected faults<br />
A A'<br />
Line of section (figure A11)<br />
Extent of San Joaquin Basin<br />
fluvial fans<br />
Major streams <strong>and</strong> selected<br />
canals<br />
Davis Population centers<br />
0<br />
124°<br />
123°<br />
122°<br />
S a c r a m e n t o V a l l e y<br />
Pacific Ocean<br />
EXPLANATION<br />
Geomorphic province—<br />
Basin<br />
Delta<br />
Dissected upl<strong>and</strong>s<br />
Sacramento River flood plains<br />
Sutter Buttes<br />
Younger fan deposits<br />
Historical lakes<br />
Extent of Corcoran Clay<br />
Redding<br />
Red Bluff<br />
Sacramento River<br />
Davis<br />
Cascade Range<br />
0 100 200 Kilometers<br />
Shaded relief derived from U.S. Geological Survey National Elevation Dataset, 2006.<br />
Albers Equal Area Conic Projection<br />
Sutter<br />
Buttes<br />
121°<br />
Sacramento<br />
Stockton<br />
Modesto<br />
San Joaquin River<br />
R a n g e s<br />
S i e r r a N e v a d a<br />
Stockton<br />
Fault<br />
S a n J o a q u i n V a l l e y<br />
San Joaquin Basin<br />
Kettleman<br />
Hills<br />
Tulare<br />
Lake bed<br />
100 200 Miles<br />
120°<br />
San<br />
Francisco<br />
<strong>Central</strong><br />
<strong>Valley</strong><br />
A<br />
C A L I<br />
Pacific Ocean<br />
F O R N I A<br />
Fresno<br />
Kings River<br />
Tulare<br />
Basin<br />
119°<br />
NEVADA<br />
CALIFORNIA<br />
Visalia<br />
A'<br />
Introduction 5<br />
Bakersfield<br />
Tehachapi Mts<br />
Figure A1. <strong>Central</strong> <strong>Valley</strong> major geomorphic provinces (modified from Davis <strong>and</strong> others, 1959; Olmstead <strong>and</strong> Davis, 1961; <strong>and</strong><br />
Jennings,1977), alluvial fans of the San Joaquin Basin (Weissmann <strong>and</strong> others, 2005), <strong>and</strong> extent <strong>and</strong> thickness of Corcoran Clay<br />
(modified from Page,1986 <strong>and</strong> Burow <strong>and</strong> others, 2004).
6 Groundwater Availability of the <strong>Central</strong> <strong>Valley</strong> <strong>Aquifer</strong>, California<br />
Methods of Analyses<br />
-<br />
-<br />
<br />
<br />
<br />
-<br />
<br />
<br />
-<br />
<br />
<br />
<br />
<br />
-<br />
<br />
<br />
<br />
-<br />
<br />
ity.<br />
The results, conclusions, <strong>and</strong> limitations discussed in this<br />
<br />
Data Compilation<br />
<br />
-<br />
<br />
<br />
<br />
<br />
<br />
-<br />
-<br />
-<br />
<br />
<br />
<br />
<br />
of this report.<br />
<br />
<br />
<br />
-<br />
<br />
<br />
-<br />
<br />
<br />
-<br />
<br />
( <strong>and</strong> <br />
<br />
<br />
<br />
in <br />
compilation, <strong>and</strong> analysis of information for the hydraulic<br />
properties database is described in the “”<br />
section of this chapter.<br />
<br />
-<br />
-<br />
<br />
(<strong>and</strong> <br />
-<br />
-<br />
<br />
processed, <strong>and</strong> (or) re-sampled to produce spatial <strong>and</strong> temporal<br />
-<br />
<br />
).<br />
Numerical Model<br />
<br />
<br />
<br />
<br />
<br />
<br />
-<br />
-<br />
<br />
<br />
<br />
<br />
<br />
<br />
<br />
<br />
<br />
of this report.<br />
<br />
in a s<strong>and</strong>-silt-clay aquifer system. The system has been
Texture<br />
Model<br />
DATA<br />
<strong>Central</strong>ized<br />
Geospatial<br />
Database<br />
VISUALIZATION<br />
Groundwater<br />
Levels<br />
<strong>and</strong> Flows<br />
Hydrogeologic<br />
Properties<br />
Introduction 7<br />
Flow Model<br />
CVHM<br />
Figure A2. The relation <strong>and</strong> flow of information used in analyzing the <strong>Central</strong> <strong>Valley</strong> Hydrogeologic system. Both interpretive <strong>and</strong><br />
modeling data flow in <strong>and</strong> out of the centralized geospatial database. The texture model, data in the geospatial database, <strong>and</strong> modeling<br />
results are visualized throughout the data gathering, analysis, <strong>and</strong> modeling stages of the project.<br />
Previous Investigations<br />
<br />
-<br />
<br />
<br />
<br />
-<br />
<br />
<br />
<br />
-<br />
<br />
<br />
<br />
-<br />
<br />
Recent Regional Groundwater Models<br />
<strong>Central</strong> <strong>Valley</strong> Regional <strong>Aquifer</strong>-System Analysis<br />
(CV-RASA)<br />
-<br />
<br />
<br />
<br />
-<br />
-<br />
<br />
<br />
<br />
-<br />
<br />
<br />
<br />
<br />
<br />
<br />
<br />
2 , <strong>and</strong> the<br />
<br />
<br />
<br />
about 500 mi 2 <br />
<br />
often are smaller than 500 mi 2
8 Groundwater Availability of the <strong>Central</strong> <strong>Valley</strong> <strong>Aquifer</strong>, California<br />
Soils Topography Remote Sensing<br />
Soil Surveys (STATSGO)<br />
Soil Properties Data<br />
Digital Elevation Models<br />
Topographic Maps<br />
Geology Vegetation & L<strong>and</strong> Use<br />
Geologic Maps<br />
Geologic Cross Sections<br />
Drillers Logs<br />
<strong>Central</strong>ized<br />
Geospatial<br />
Database<br />
Satellite Imagery<br />
MoDIS<br />
L<strong>and</strong> Use/L<strong>and</strong> Cover Maps (DWR)<br />
Agricultural Data<br />
Crop Data<br />
Original Data Types<br />
Climate Geophysics<br />
Precipitation Data<br />
Temperature Data<br />
Humidity<br />
Evapotranspiration<br />
Hydrology Chemistry Anthropogenic Controls<br />
Water Well Information<br />
<strong>Aquifer</strong> Tests<br />
<strong>Aquifer</strong> Properites<br />
Surface Water Data<br />
<strong>Aquifer</strong> Chemistry<br />
Spring Chemistry<br />
SU Chemistry<br />
Redox Chemistry<br />
Gravity<br />
Seismic/Earthquake<br />
Magnetics/Resistivity<br />
Surface Water Delivery<br />
Surface Water Diversions<br />
Environmental Requirements<br />
Figure A3. The diversity of data types <strong>and</strong> categories included in the centralized geospatial database. Data types in bold were used<br />
specifically in this study.<br />
<br />
<br />
-<br />
-<br />
<br />
<br />
-
Hydrology<br />
Water Well Information<br />
<strong>Aquifer</strong> Tests<br />
<strong>Aquifer</strong> Properites<br />
Surface Water Data<br />
DWR USGS<br />
Water Levels<br />
Locations<br />
Construction<br />
Hydrographs<br />
Combined<br />
Water-Level<br />
Database<br />
21,417 wells<br />
873,073 water levels<br />
Data<br />
Analysis<br />
CVHM<br />
Subset<br />
206 wells<br />
19,725 water levels<br />
Water Levels<br />
Locations<br />
Construction<br />
Overlapping records<br />
Missing information<br />
Location discrepancies<br />
Construction<br />
Measurement discrepancies<br />
Temporal distribution<br />
Specific time periods<br />
Climate control<br />
Continuous record<br />
Spatial distribution<br />
Water balance areas<br />
Basin to foothills<br />
Calibration<br />
Observations<br />
Water levels<br />
Water-level gradients<br />
Change in water levels<br />
Figure A4. An example of the detail for compilation, integration, <strong>and</strong> analysis for one data type (water-level nformation).<br />
Introduction 9
10 Groundwater Availability of the <strong>Central</strong> <strong>Valley</strong> <strong>Aquifer</strong>, California<br />
California <strong>Central</strong> <strong>Valley</strong> Groundwater-Surface-Water<br />
Simulation Model (C2VSIM)<br />
-<br />
-<br />
<br />
<br />
<br />
-<br />
<br />
<br />
<br />
<br />
2 .<br />
<br />
-<br />
<br />
<br />
<br />
<br />
<br />
<br />
-<br />
<br />
<br />
system <strong>and</strong> calculate stream accretions <strong>and</strong> depletions for use<br />
<br />
<br />
<br />
<br />
<br />
<br />
2006).<br />
Study Area<br />
<br />
2 <strong>and</strong> is one of the more<br />
-<br />
<br />
-<br />
<br />
<br />
-<br />
<br />
-<br />
<br />
<br />
<br />
<br />
-<br />
<br />
<br />
<br />
<br />
is about 1,700 ft.<br />
<br />
<br />
<br />
<br />
<br />
( <strong>and</strong> <br />
<br />
<br />
<br />
<br />
<br />
<br />
<br />
<br />
<br />
<br />
<br />
Climate<br />
<br />
<br />
<br />
<br />
<br />
<br />
<br />
<br />
<br />
<br />
<br />
<br />
<br />
<br />
<br />
<br />
-<br />
<br />
<br />
Sacramento <strong>Valley</strong><br />
<br />
<br />
<br />
-<br />
<br />
<br />
<br />
-<br />
<br />
<br />
).
Table A1. Water-balance subregions within the <strong>Central</strong> <strong>Valley</strong>, California.<br />
Regions<br />
Site<br />
identifier<br />
General<br />
description<br />
DWR DSA<br />
number<br />
Total<br />
area<br />
(mi 2 )<br />
Routed<br />
surface-<br />
water<br />
deliveries<br />
Study Area 11<br />
-<br />
<br />
<br />
2 ,<br />
square mile]<br />
Non-routed<br />
surface-<br />
water<br />
deliveries<br />
1 611 2 None<br />
2 <br />
<br />
<br />
1,163 3 None<br />
3 <br />
<br />
1,112 4 None<br />
4 <br />
<br />
560 1 None<br />
5 <br />
<br />
<br />
957 2 6<br />
6 <br />
<br />
1,044 4 None<br />
7 <br />
<br />
534 4 4<br />
8 <br />
<br />
1,362 6 None<br />
9 <br />
<br />
1,026 1 None<br />
10 1,083 1 7<br />
11 664 6 None<br />
12 540 5 None<br />
13 1,648 6 2<br />
14 1,071 None 3<br />
15 1,423 4 5<br />
16 478 2 1<br />
17 569 2 1<br />
18 1,358 4 4<br />
19 <br />
<br />
1,365 2 3<br />
20 705 2 3<br />
21 <br />
area)<br />
1,105 3 2<br />
— — — 20,378 64 41<br />
-
12 Groundwater Availability of the <strong>Central</strong> <strong>Valley</strong> <strong>Aquifer</strong>, California<br />
A<br />
Average annual<br />
precipitation,<br />
in inches per year—<br />
6 to 8<br />
9 to 10<br />
11 to 12<br />
13 to 14<br />
15 to 16<br />
17 to 18<br />
19 to 20<br />
21 to 22<br />
23 to 24<br />
25 to 26<br />
27 to 28<br />
29 to 30<br />
31 to 32<br />
33 to 34<br />
35 to 36<br />
37 to 38<br />
39 to 40<br />
41 to 42<br />
43 to 44<br />
45 to 46<br />
Red Bluff<br />
0 50 100 Miles<br />
0 50 100 Kilometers<br />
Sacramento River<br />
Davis<br />
Shaded relief derived from U.S. Geological Survey<br />
National Elevation Dataset, 2006. Albers Equal Area Conic Projection<br />
San Joaquin River<br />
Los Gatos<br />
Creek<br />
Feather<br />
River<br />
Yuba<br />
River<br />
Bear<br />
River<br />
American<br />
River<br />
Cosumnes<br />
River<br />
Mokelumne<br />
River<br />
Calaveras<br />
River<br />
Stanislaus<br />
River<br />
Fresno<br />
Slough<br />
Davis<br />
EXPLANATION<br />
Average annual inflow,<br />
in thous<strong>and</strong>s of acre-feet per year—<br />
Tuolumne<br />
River<br />
Merced<br />
River<br />
Less than 100<br />
100.1 to 500<br />
500.1 to 1,000<br />
1,000.1 to 2,000<br />
2,000.1 to 3,000<br />
3,000.1 to 4,000<br />
4,000.1 to 5,000<br />
Greater than 5,000<br />
Selected streams<br />
<strong>and</strong> rivers<br />
Precipitation station<br />
<strong>and</strong> identifier<br />
San Joaquin<br />
River<br />
Kings<br />
River<br />
Kaweah<br />
River<br />
Tule<br />
River<br />
White<br />
River<br />
Kern<br />
River<br />
Bakersfield<br />
Figure A5. A, Surface-water inflows <strong>and</strong> average annual precipitation for September 1961 through September 2003 throughout the <strong>Central</strong> <strong>Valley</strong>,<br />
California. B, Average annual reference evapotranspiration (ETo) for September 1961 through September 2003 throughout the <strong>Central</strong> <strong>Valley</strong>, California.<br />
ETo data were calculated from PRISM temperature data (Climate Source, 2006). The surface-water inflows are from U.S. Geological Survey files <strong>and</strong><br />
California Department of Water Resources (C. Brush, written commun., February 21, 2007). Precipitation data are from Parameter-Elevation Regressions<br />
on Independent Slopes Model (PRISM) data (Climate Source, 2006).
B<br />
Red Bluff<br />
0 50 100 Miles<br />
0 50 100 Kilometers<br />
Davis<br />
Shaded relief derived from U.S. Geological Survey<br />
National Elevation Dataset, 2006. Albers Equal Area Conic Projection<br />
Figure A5. Continued.<br />
Davis<br />
EXPLANATION<br />
Selected streams<br />
<strong>and</strong> rivers<br />
Precipitation station<br />
<strong>and</strong> identifier<br />
Bakersfield<br />
Study Area 13<br />
Average annual reference evapotranspiration,<br />
in inches per year—<br />
45.5 to 46<br />
46.1 to 47<br />
47.1 to 48<br />
48.1 to 49<br />
49.1 to 50<br />
50.1 to 51<br />
51.1 to 52<br />
52.1 to 53<br />
53.1 to 54<br />
54.1 to 55<br />
55.1 to 56
14 Groundwater Availability of the <strong>Central</strong> <strong>Valley</strong> <strong>Aquifer</strong>, California<br />
AVERAGE PRECIPITATION, IN INCHES<br />
5<br />
4.5<br />
4<br />
3.5<br />
3<br />
2.5<br />
2<br />
1.5<br />
1<br />
0.5<br />
0<br />
JAN FEB MAR APR MAY JUN JUL AUG SEP OCT NOV DEC<br />
<br />
<br />
<br />
<br />
<br />
<br />
<br />
-<br />
<br />
MONTH<br />
EXPLANATION<br />
Monthly average precipitation (1961 to 2003) at—<br />
Red Bluff<br />
Davis<br />
Bakersfield<br />
Figure A6. Average monthly precipitation for Redding, Davis, <strong>and</strong> Bakersfield, California (Climate Source, 2006).<br />
<br />
<br />
<br />
ecosystem protection <strong>and</strong> restoration efforts are needed<br />
<br />
<br />
<br />
<br />
purposes.
Delta <strong>and</strong> Eastside Streams<br />
<br />
<br />
<br />
).<br />
<br />
<br />
-<br />
<br />
<br />
<br />
<br />
<br />
<br />
<br />
<br />
<br />
<br />
2 of estuary.<br />
<br />
<br />
<br />
<br />
<br />
<br />
-<br />
<br />
<br />
<br />
<br />
<br />
<br />
<br />
<br />
<br />
-<br />
<br />
<br />
<br />
<br />
<br />
times<br />
are curtailed. This focus on ecosystem restoration often<br />
<br />
<br />
<br />
<br />
<br />
<br />
<br />
<br />
-<br />
<br />
Study Area 15<br />
-<br />
<br />
<br />
<br />
<br />
<br />
-<br />
<br />
<br />
<br />
-<br />
<br />
-<br />
-<br />
<br />
<br />
<br />
<br />
<br />
San Joaquin Basin of the San Joaquin <strong>Valley</strong><br />
<br />
<br />
<br />
<br />
<br />
<br />
<br />
<br />
<br />
<br />
).<br />
<br />
-<br />
<br />
<br />
<br />
<br />
-<br />
<br />
<br />
<br />
<br />
the summers are particularly hot <strong>and</strong> dry, the area has been<br />
<br />
-<br />
<br />
<br />
rapid shift to other crops, particularly almond orchards. On the<br />
nated<br />
by deciduous fruit <strong>and</strong> nut orchards. The remainder of
16 Groundwater Availability of the <strong>Central</strong> <strong>Valley</strong> <strong>Aquifer</strong>, California<br />
Shasta Lake<br />
Corning<br />
Canal<br />
Red Bluff<br />
Tehama<br />
Co<br />
Glenn<br />
Co<br />
Colusa<br />
Co<br />
Napa<br />
Co<br />
0 50 100 Miles<br />
0 50 100 Kilometers<br />
Shasta<br />
Co<br />
Yolo<br />
Co<br />
Davis<br />
Solano<br />
Co<br />
Shaded relief derived from U.S. Geological Survey<br />
National Elevation Dataset, 2006. Albers Equal Area Conic Projection<br />
Tehama-Colusa<br />
Canal<br />
Glenn-Colusa<br />
Canal<br />
Lake Oroville<br />
Folsom Lake<br />
Folsom South Canal<br />
Camanche Reservoir<br />
Pardee Lake<br />
California<br />
Mokelumne<br />
Aqueduct<br />
Kern<br />
Water Bank<br />
Figure A7. General features of the surface-water system in the <strong>Central</strong> <strong>Valley</strong>, California.<br />
Butte<br />
Co<br />
Sutter<br />
Co<br />
Yuba<br />
Co<br />
Sacramento<br />
Co<br />
Nevada<br />
Co<br />
Placer<br />
Co<br />
San Joaquin<br />
Co<br />
Stanislaus<br />
Co<br />
El Dorado Co<br />
Amador Co<br />
Calaveras<br />
Co<br />
Merced<br />
Co<br />
Tuolumne<br />
Co<br />
Mariposa<br />
Co<br />
Hetch Hetchy<br />
Aqueduct<br />
Madera<br />
Co<br />
Fresno<br />
Co<br />
Aqueduct<br />
Kings<br />
Co<br />
EXPLANATION<br />
Historic lakes<br />
Reservoir<br />
State Water Project<br />
Federal Water Project<br />
Davis<br />
Tulare<br />
Co<br />
Local Canal/<br />
Aqueduct Projects<br />
Selected streams<br />
<strong>and</strong> rivers<br />
County boundary<br />
Precipitation station<br />
<strong>and</strong> identifier<br />
Kern<br />
Co<br />
Friant-Kern<br />
Canal<br />
Cross <strong>Valley</strong><br />
Canal<br />
Bakersfield
for about 30 percent of the annual supply of both types of<br />
<br />
<br />
-<br />
-<br />
<br />
<br />
<br />
<br />
-<br />
<br />
<br />
<br />
<br />
Tulare Basin of the San Joaquin <strong>Valley</strong><br />
<br />
<br />
<br />
<br />
<br />
<br />
<br />
<br />
<br />
<br />
<br />
<br />
<br />
<br />
<br />
<br />
<br />
<br />
<br />
<br />
<br />
<br />
<br />
<br />
<br />
<br />
-<br />
<br />
-<br />
<br />
<br />
-<br />
<br />
<br />
<br />
Study Area 17<br />
<br />
<br />
<br />
<br />
<br />
<br />
<br />
<br />
<br />
<br />
-<br />
<br />
<br />
<br />
<br />
<br />
<br />
<br />
<br />
<br />
<br />
<br />
<br />
<br />
<br />
<br />
<br />
-<br />
<br />
<br />
<br />
<br />
ter<br />
often is used to replace much of the shortfall in surface-<br />
-<br />
<br />
<br />
<br />
<br />
<br />
<br />
<br />
-<br />
<br />
<br />
<br />
-<br />
<br />
<br />
as for recreation.
18 Groundwater Availability of the <strong>Central</strong> <strong>Valley</strong> <strong>Aquifer</strong>, California<br />
Water-Balance Subregions<br />
<br />
-<br />
<strong>and</strong> ).<br />
<br />
<br />
<br />
<br />
<br />
<br />
<br />
<br />
<br />
<br />
<br />
<br />
<br />
<br />
<br />
<br />
<br />
<br />
<br />
<br />
).<br />
Geologic History <strong>and</strong> Setting<br />
<br />
<br />
<br />
<br />
-<br />
<br />
<br />
<br />
<br />
<br />
<br />
<br />
<br />
<br />
-<br />
<br />
<br />
<br />
-<br />
<br />
<br />
(last 10 million years). The only prominent non-sedimentary<br />
<br />
<br />
<br />
<br />
<br />
<br />
<br />
<br />
<br />
<br />
-<br />
<br />
<br />
<br />
<br />
<br />
<br />
<br />
materials—mostly clay <strong>and</strong> silt—compose as much as<br />
<br />
<strong>and</strong> Williams, 1995).<br />
<br />
<br />
<br />
<br />
-<br />
<br />
-<br />
<br />
<br />
<br />
<br />
<br />
<br />
<br />
<br />
<br />
<br />
<br />
<br />
-<br />
<br />
<br />
-<br />
<br />
-<br />
). The
0 50 100 Miles<br />
0 50 100 Kilometers<br />
Shaded relief derived from U.S. Geological Survey<br />
National Elevation Dataset, 2006. Albers Equal Area Conic Projection<br />
1<br />
2<br />
3<br />
6<br />
4<br />
5<br />
9<br />
7<br />
8<br />
11<br />
12<br />
10<br />
12<br />
14<br />
13<br />
EXPLANATION<br />
16<br />
15<br />
19<br />
17<br />
Geologic History <strong>and</strong> Setting 19<br />
California Department of Water Resources<br />
water-balance subregion <strong>and</strong> identifier. Water-<br />
balance subregion identifier with red highlight<br />
indicates subregion receiving deliveries not<br />
shown by arrows<br />
Major streams <strong>and</strong> canals<br />
Diversion locations<br />
Direction of water movement<br />
from diversion location, <strong>and</strong><br />
water-balance subregion affected.<br />
Length of arrow does not relate<br />
to volume of diversion<br />
Figure A8. Distribution of water-balance subregions (WBSs) used for surface-water delivery <strong>and</strong> estimation of groundwater<br />
pumpage. These areas are based on areas defined by the California Department of Water Resources <strong>and</strong> are used as “virtual farms”<br />
for accounting by the Farm Process in the simulation of the hydrologic system of the <strong>Central</strong> <strong>Valley</strong> with MODFLOW-2000. WBSs 5, 7, 10,<br />
<strong>and</strong> 13-21 receive surface-water that is not shown in the stream network (non-routed deliveries).<br />
18<br />
20<br />
21
20 Groundwater Availability of the <strong>Central</strong> <strong>Valley</strong> <strong>Aquifer</strong>, California<br />
<br />
<br />
). They determined that the character<br />
<br />
<br />
<br />
<br />
<br />
<br />
<br />
<br />
<br />
<br />
<br />
<br />
<br />
turn, resulted in thinner depositional sequences <strong>and</strong> no incised<br />
<br />
” section<br />
<br />
model in more detail.<br />
Hydrogeology<br />
<br />
<br />
<br />
<br />
<br />
<br />
-<br />
<br />
<br />
<br />
<strong>Aquifer</strong> Characteristics<br />
<br />
<br />
-<br />
<br />
). The chief source of<br />
<br />
-<br />
<br />
<br />
<br />
<br />
<br />
thick, marine sedimentary rocks (-<br />
<br />
<br />
<br />
<br />
<br />
-<br />
<br />
<br />
<br />
<br />
<br />
<br />
<br />
<br />
<br />
<br />
<br />
<br />
-<br />
<br />
<br />
<br />
<br />
<br />
-<br />
<br />
-<br />
<br />
<br />
-<br />
<br />
<br />
<br />
-<br />
<br />
<br />
<br />
-<br />
<br />
).<br />
<br />
<br />
<br />
<br />
<br />
<br />
others, 1993) (<br />
<br />
<br />
<br />
<br />
-
A<br />
Coast Ranges<br />
Clayey<br />
lenses<br />
Fault<br />
Marine<br />
deposits<br />
River<br />
Potentiometric surface for the<br />
lower part of the aquifer system<br />
Old saline water<br />
Pumping wells<br />
Slough<br />
-<br />
<br />
<br />
<br />
-<br />
<br />
constitute more than 50 percent of the total thickness of the<br />
<br />
-<br />
2 <br />
<br />
Water<br />
movement<br />
Sierra Nevada<br />
Fresh-water<br />
recharge<br />
Lower part<br />
of the aquifer<br />
system<br />
Upper part<br />
of the aquifer<br />
system<br />
Bedrock<br />
Hydrogeology 21<br />
Figure A9. Pre- <strong>and</strong> post-development of the A, Sacramento <strong>Valley</strong>. B, <strong>Central</strong> part of the San Joaquin <strong>Valley</strong>, California. (Modified<br />
from Belitz <strong>and</strong> Heimes, 1990; <strong>and</strong> Galloway <strong>and</strong> others, 1999).<br />
Water<br />
table<br />
<br />
<br />
<br />
lacustrine deposit (Johnson <strong>and</strong> others, 1968) as much as 200<br />
). This
22 Groundwater Availability of the <strong>Central</strong> <strong>Valley</strong> <strong>Aquifer</strong>, California<br />
B<br />
Coast Ranges<br />
Clayey<br />
lenses<br />
Corcoran Clay<br />
(confining layer)<br />
Marine<br />
deposits<br />
Figure A9. Continued.<br />
River<br />
Potentiometric surface of the<br />
lower part of the aquifer system<br />
Old saline water<br />
Pumping wells<br />
Slough<br />
Subsidence area<br />
<br />
<br />
<br />
<br />
<br />
(<br />
<br />
<br />
<br />
<br />
<br />
<br />
<br />
<br />
Water<br />
table<br />
Water<br />
movement<br />
Lower part<br />
of the aquifer<br />
system<br />
Sierra Nevada<br />
Fresh-water<br />
recharge<br />
Upper part<br />
of the aquifer<br />
system<br />
(Sierran<br />
deposits)<br />
Bedrock
-<br />
<br />
<br />
<br />
<br />
the distribution of these properties are more important than are<br />
<br />
1991).<br />
<br />
<br />
<br />
<br />
<br />
<br />
<br />
<br />
<br />
<br />
<br />
<br />
<br />
<br />
<br />
ments<br />
of hydraulic properties of the aquifer system are scarce,<br />
<br />
<br />
<br />
<br />
<br />
<br />
<br />
<br />
<br />
).<br />
<br />
” section.<br />
Textural Analysis<br />
<br />
nitude<br />
<strong>and</strong> distribution of aquifer-system compaction, mani-<br />
<br />
-<br />
<br />
Hydrogeology 23<br />
<br />
<br />
-<br />
-<br />
<br />
-<br />
<br />
2 <br />
<br />
-<br />
<br />
<br />
<br />
500 to 1,000 mi 2 <br />
<br />
<br />
<br />
<br />
a 1,000-mi 2 <br />
<br />
<br />
2 <br />
<br />
<br />
<br />
<br />
tribution<br />
of sedimentary hydrofacies in a nearly 6.5-mi 2 study<br />
area <br />
(cies<br />
model in a 19-mi 2 <br />
<br />
of the 64-mi 2 <br />
-<br />
<br />
-<br />
<br />
<br />
<br />
<br />
<br />
<br />
-<br />
<br />
().
24 Groundwater Availability of the <strong>Central</strong> <strong>Valley</strong> <strong>Aquifer</strong>, California<br />
A B<br />
10<br />
S a c r a m e n t o V a l l e y<br />
11<br />
Sacramento River<br />
12<br />
EXPLANATION<br />
Textural analysis spatial<br />
provinces <strong>and</strong> domains<br />
Number Name<br />
10<br />
11<br />
12<br />
20<br />
21<br />
22<br />
23<br />
24<br />
30<br />
Redding<br />
Western Sacramento<br />
Eastern Sacramento<br />
Tracy/Delta-Mendota<br />
Westside<br />
Northern San Joaquin<br />
Chowchilla-Madera<br />
Kings<br />
Tulare/Kern<br />
Stream or river<br />
Orestimba<br />
Creek<br />
S a n J o a q u i n V a l l e y<br />
San Joaquin River<br />
20<br />
22<br />
0 50 100 Miles<br />
0 50 100 Kilometers<br />
Shaded relief derived from U.S. Geological Survey<br />
National Elevation Dataset, 2006. Albers Equal Area Conic Projection<br />
Merced River<br />
Bear<br />
Creek<br />
21<br />
23<br />
24<br />
Kings River<br />
30<br />
10<br />
11<br />
12<br />
20<br />
21<br />
22<br />
23<br />
24<br />
30<br />
0 50<br />
EXPLANATION<br />
Textural analysis spatial<br />
provinces <strong>and</strong> domains<br />
Number Name<br />
Redding<br />
Western Sacramento<br />
Eastern Sacramento<br />
Tracy/Delta-Mendota<br />
Westside<br />
Northern San Joaquin<br />
Chowchilla-Madera<br />
Kings<br />
Tulare/Kern<br />
Well used for<br />
texture analysis<br />
0 50 100 Kilometers<br />
100 Miles<br />
Figure A10. A, <strong>Central</strong> <strong>Valley</strong> showing groundwater basins <strong>and</strong> subbasins, groupings of basins <strong>and</strong> subbasins into spatial provinces<br />
<strong>and</strong> domains for textural analysis. B, Distribution of wells used for mapping texture. C, Count of wells for each depth increment by<br />
domains through 1,200 feet. Because less than 1 percent of the logs extend past 1,200 feet, increments below 1,200 feet were not shown.<br />
Detailed description of the spatial provinces <strong>and</strong> domains are in .
C<br />
DEPTH TO MIDPOINT OF INCREMENT, IN FEET BELOW LAND SURFACE<br />
0<br />
50<br />
100<br />
150<br />
200<br />
250<br />
300<br />
350<br />
400<br />
450<br />
500<br />
550<br />
600<br />
650<br />
700<br />
750<br />
800<br />
850<br />
900<br />
950<br />
1,000<br />
1,050<br />
1,100<br />
1,150<br />
Selection <strong>and</strong> Compilation of Existing Well Data<br />
<br />
<br />
<br />
<br />
<br />
<br />
<br />
<br />
<br />
<br />
<br />
<br />
-<br />
<br />
-<br />
<br />
ated<br />
on the basis of the amount of detail in the descriptions<br />
-<br />
<br />
NUMBER OF WELLS USED FOR TEXTURE ANALYSIS<br />
EXPLANATION<br />
Number of wells,<br />
colored by basin<br />
Number Name<br />
10 Redding<br />
Hydrogeology 25<br />
<br />
<br />
<br />
-<br />
-<br />
<br />
<br />
<br />
<br />
<br />
<br />
<br />
<br />
<br />
-<br />
<br />
<br />
<br />
-<br />
<br />
<br />
11<br />
12<br />
20<br />
21<br />
22<br />
23<br />
24<br />
30<br />
Western Sacramento<br />
Eastern Sacramento<br />
Tracy/Delta-Mendota<br />
Westside<br />
Northern San Joaquin<br />
Chowchilla-Madera<br />
Kings<br />
Tulare/Kern<br />
1,200<br />
0 500 1,000 1,500 2,000 2,500 3,000 3,500 4,000 4,500 5,000 5,500 6,000 6,500 7,000 7,500<br />
Figure A10. Continued.
26 Groundwater Availability of the <strong>Central</strong> <strong>Valley</strong> <strong>Aquifer</strong>, California<br />
<br />
2 <br />
<br />
<br />
<br />
<br />
<br />
<br />
<br />
<br />
2<br />
<br />
<br />
<br />
<br />
<br />
<br />
<strong>Class</strong>ification of Texture from Drillers’ Logs <strong>and</strong><br />
Regularization of Well Data<br />
<br />
<br />
<br />
<br />
<br />
<br />
<br />
<br />
<br />
<br />
<br />
<br />
-<br />
<br />
<br />
-<br />
<br />
<br />
<br />
<br />
<br />
<br />
<br />
<br />
<br />
surface to the bottom of the borehole. Thus, none of the depth<br />
<br />
<br />
<br />
<br />
<br />
<br />
<br />
-<br />
<br />
<br />
<br />
<br />
<br />
-<br />
<br />
<br />
<br />
Geostatistical Modeling Approach<br />
<br />
tistics<br />
is a set of applications <strong>and</strong> statistical techniques used<br />
<br />
<br />
<br />
<br />
-<br />
<br />
-<br />
<br />
<br />
methods are based on an assumed spatial correlation structure.<br />
<br />
<br />
<br />
models.<br />
Regions <strong>and</strong> Domains<br />
-<br />
<br />
<br />
<br />
<br />
<br />
<br />
-<br />
<br />
<br />
<br />
<br />
<br />
south (<br />
<br />
-
). The southern part, referred<br />
, includes the<br />
<br />
<br />
2003).<br />
cally<br />
(<br />
).<br />
<br />
<br />
<br />
<br />
<br />
<br />
<br />
<br />
<br />
<br />
<strong>and</strong> ).<br />
Geostatistical Model of Coarse-Grained Texture<br />
-<br />
<br />
-<br />
<br />
<br />
<br />
<br />
<br />
<br />
<br />
-<br />
-<br />
<br />
<br />
-<br />
<br />
165 to 820 ft (<br />
<br />
<br />
<br />
<br />
directions.<br />
<br />
<br />
<br />
<br />
<br />
Hydrogeology 27<br />
-<br />
<br />
<br />
<br />
<br />
<br />
<br />
<br />
<br />
<br />
<br />
<br />
-<br />
<br />
<br />
<br />
<br />
points, rather than by the spatial dimensions of the search<br />
<br />
-<br />
<br />
<br />
<br />
<br />
-<br />
<br />
<br />
<br />
<br />
<br />
-<br />
<br />
<br />
<br />
<br />
<br />
<br />
used is a function of both distance <strong>and</strong> direction.<br />
<br />
<br />
<br />
<br />
<br />
<br />
<br />
<br />
<br />
<br />
<br />
<br />
<br />
-
28 Groundwater Availability of the <strong>Central</strong> <strong>Valley</strong> <strong>Aquifer</strong>, California<br />
Table A2. Distribution of statistical properties for the percentage of coarse-grained deposits for the <strong>Central</strong> <strong>Valley</strong>, Calfornia, by domain, including variogram <strong>and</strong> variogram<br />
models.<br />
-<br />
<br />
Spatial<br />
Spatial<br />
<strong>Valley</strong><br />
province<br />
province<br />
number2 Variogram Variogram models<br />
Area<br />
Domain (square<br />
miles)<br />
3<br />
Model 1 - Exponential Model 2 - Gaussian<br />
Num-<br />
Anisotropy/<br />
ber of Mean Variance rotation Nugget<br />
Directional scales<br />
Directional scales<br />
Sill<br />
Sill<br />
samples<br />
(degrees)<br />
1 2 3 1 2 3<br />
10 597 1,010 39 1,348 0 1,300 2,400 5,000 15,000 500 800 98,000 328,000 700<br />
Western 11 3,524 6,423 25 820 10 1,100 1,200 16,000 21,000 400 300 131,000 656,000 2,300<br />
<br />
<br />
12 2,588 4,632 32 1,069 15 1,300 1,600 20,000 28,000 400 500 164,000 492,000 500<br />
<br />
<br />
20 1,198 1,466 45 1,029 20 1,000 2,300 16,000 59,000 800<br />
<br />
<br />
508 433 29 820 20 0 2,700 16,000 8,000 200<br />
<br />
Westside 21 - 844 1,343 30 982 47 1,000 2,200 20,000 30,000 500<br />
<br />
384 481 33 1,012 47 1,300 2,000 17,000 39,000 500<br />
absent<br />
22 865 4,470 51 876 31 1,600 1,200 459,000 33,000 600<br />
Joaquin<br />
<br />
2,373 8,931 34 936 31 300 2,100 3,000 4,000 200 600 66,000 164,000 300<br />
<br />
375 330 37 691 35 0 2,200 30,000 20,000 200<br />
488 1,119 36 878 35 1,100 1,500 21,000 21,000 600<br />
498 1,157 46 577 30 1,000 900 26,000 39,000 200<br />
1,027 1,560 47 837 30 1,000 1,600 39,000 30,000 500<br />
2,788 2,562 43 1,042 28 500 2,100 11,000 8,000 300 900 164,000 295,000 2,000<br />
2,500 2,775 41 1,314 28 1,200 2,000 16,000 25,000 700<br />
6,568 374 26 874 33 0 2,900 20,000 20,000 0 9,800 197,000 656,00 197,000<br />
6,568 4,685 35 1,138 33 900 1,400 6,000 4,000 400 1,400 180,000 558,000 400<br />
23 <br />
<br />
<br />
<br />
<br />
24 <br />
<br />
<br />
absent<br />
30 <br />
<br />
<br />
<br />
-<br />
<br />
-
3-D Model of Percentage of Coarse-Grained Texture<br />
<br />
<br />
<br />
<br />
<br />
1 mi 2 <br />
<br />
<br />
).<br />
<br />
<br />
layers 4 <strong>and</strong> 5 (). In order to complete this representa-<br />
<br />
<br />
<br />
<br />
ALTITUDE, IN FEET<br />
1,000<br />
500<br />
NGVD 29<br />
-500<br />
-1,000<br />
-1,500<br />
-2,000<br />
Layer<br />
Thickness<br />
(feet)<br />
Depth to<br />
base outside<br />
Corcoran Clay<br />
(feet)<br />
Hydrogeology 29<br />
Table A3. <strong>Central</strong> <strong>Valley</strong>, California, groundwater flow model<br />
layer thicknesses <strong>and</strong> depths.<br />
<br />
<br />
Texture<br />
figure<br />
1 50 50 <br />
2 100 150 —<br />
3 150 300 <br />
4 301 <br />
5 302 <br />
6 198 500 <br />
7 250 750 —<br />
8 300 1,050 —<br />
9 350 1,400 <br />
10 400 1,800 —<br />
A Cross section along row 355<br />
A'<br />
Layer 1<br />
Layer 2<br />
Layer 3<br />
L<strong>and</strong> surface<br />
Corcoran Clay<br />
Layer 6<br />
Layer 7<br />
Layer 8<br />
Layer 9<br />
Layer 10<br />
Not in model<br />
-2,500<br />
0 30,000 60,000 90,000 120,000 150,000 180,000 210,000 240,000 270,000 300,000<br />
DISTANCE ALONG SECTION, IN FEET<br />
Figure A11. Generalized hydrogeologic section (A–A’) indicating the vertical discretization of the numerical model of the groundwaterflow<br />
system in the <strong>Central</strong> <strong>Valley</strong>, California. Line of section shown on (altitudes are along row 355; layer numbers indicate<br />
model layer).
30 Groundwater Availability of the <strong>Central</strong> <strong>Valley</strong> <strong>Aquifer</strong>, California<br />
-<br />
<br />
<br />
<br />
<br />
<br />
<br />
<br />
<br />
<br />
<br />
<br />
<br />
<br />
).<br />
Results of Texture Model<br />
<br />
<br />
-<br />
<br />
-<br />
<br />
<br />
model (<br />
<br />
<strong>and</strong><br />
<br />
<br />
<strong>and</strong> <br />
because of the data density, is the most detailed layer in the<br />
model (<br />
<br />
the l<strong>and</strong> surface ( <strong>and</strong> -<br />
<br />
(<br />
<br />
<br />
<br />
<br />
<strong>and</strong> ).<br />
<br />
<br />
sediments ( <strong>and</strong> <br />
<br />
<br />
<br />
( <strong>and</strong> <br />
. It also can be related to<br />
<br />
<br />
<br />
domains.<br />
Sacramento <strong>Valley</strong><br />
<br />
<br />
<br />
-<br />
<br />
<br />
<br />
<br />
-<br />
<strong>and</strong><br />
<br />
<br />
<br />
<br />
<br />
<br />
<br />
<br />
<br />
<br />
-<br />
<br />
<br />
-<br />
<strong>and</strong> <br />
-<br />
<br />
<br />
<br />
).<br />
<br />
<br />
<br />
<br />
<br />
<br />
<br />
<br />
<strong>and</strong>).<br />
<br />
<br />
-<br />
<br />
<br />
in
A<br />
Layer 1<br />
EXPLANATION<br />
<strong>Central</strong> <strong>Valley</strong> boundary<br />
Percentage of coarse-grained<br />
material > is greater than.<br />
0 to 10<br />
>10 to 20<br />
>20 to 30<br />
>30 to 40<br />
>40 to 50<br />
>50 to 60<br />
>60 to 70<br />
>70 to 80<br />
>80 to 90<br />
>90 to 100<br />
7,263 wells have logged data<br />
Wells having logged data<br />
11<br />
Western<br />
Sacramento<br />
0 50 100 Miles<br />
0 50 100 Kilometers<br />
Layer 1<br />
L<strong>and</strong> surface<br />
Not in model<br />
10<br />
Redding<br />
20<br />
Tracy/Delta-<br />
Mendota<br />
Enlarged area<br />
shown<br />
on figure 14<br />
12<br />
Eastern<br />
Sacramento<br />
21<br />
Westside<br />
22<br />
Northern<br />
San Joaquin<br />
Shaded relief derived from U.S. Geological Survey<br />
National Elevation Dataset, 2006. Albers Equal Area Conic Projection<br />
23<br />
Chowchilla-<br />
Madera<br />
Well locations<br />
24<br />
Kings<br />
Hydrogeology 31<br />
30<br />
Tulare/Kern<br />
Enlarged area<br />
shown<br />
on figure 14<br />
Figure A12. Kriged distribution of coarse-grained deposits for layers 1, 3, Corcoran Clay, 6, <strong>and</strong> 9 of the groundwater-flow model. Inset<br />
shows distribution of wells used in that depth interval.
32 Groundwater Availability of the <strong>Central</strong> <strong>Valley</strong> <strong>Aquifer</strong>, California<br />
B<br />
Layer 3<br />
EXPLANATION<br />
<strong>Central</strong> <strong>Valley</strong> boundary<br />
Percentage of coarse-grained material<br />
> is greater than.<br />
0 to 10<br />
>10 to 20<br />
>20 to 30<br />
>30 to 40<br />
>40 to 50<br />
>50 to 60<br />
>60 to 70<br />
>70 to 80<br />
>80 to 90<br />
>90 to 100<br />
5,952 wells have logged data<br />
13,235 depth increments intercepted<br />
Wells having logged data<br />
11<br />
Western<br />
Sacramento<br />
0 50 100 Miles<br />
0 50 100 Kilometers<br />
L<strong>and</strong> surface<br />
Layer 3<br />
Figure A12. Continued.<br />
Not in model<br />
10<br />
Redding<br />
20<br />
Tracy/Delta-<br />
Mendota<br />
12<br />
Eastern<br />
Sacramento<br />
21<br />
Westside<br />
22<br />
Northern<br />
San Joaquin<br />
Shaded relief derived from U.S. Geological Survey<br />
National Elevation Dataset, 2006. Albers Equal Area Conic Projection<br />
23<br />
Chowchilla-<br />
Madera<br />
Well locations<br />
24<br />
Kings<br />
30<br />
Tulare/Kern
C<br />
Layer Corcoran Clay<br />
EXPLANATION<br />
<strong>Central</strong> <strong>Valley</strong> boundary<br />
Percentage of coarse-grained material<br />
> is greater than.<br />
0 to 10<br />
>10 to 20<br />
>20 to 30<br />
>30 to 40<br />
>40 to 50<br />
>50 to 60<br />
>60 to 70<br />
>70 to 80<br />
>80 to 90<br />
>90 to 100<br />
1,306 wells have logged data<br />
1,534 depth increments intercepted<br />
Wells having logged data<br />
0 50 100 Miles<br />
0 50 100 Kilometers<br />
Corcoran Clay<br />
L<strong>and</strong> surface<br />
Figure A12. Continued.<br />
11<br />
Western<br />
Sacramento<br />
Not in model<br />
10<br />
Redding<br />
20<br />
Tracy/Delta-<br />
Mendota<br />
12<br />
Eastern<br />
Sacramento<br />
21<br />
Westside<br />
22<br />
Northern<br />
San Joaquin<br />
Shaded relief derived from U.S. Geological Survey<br />
National Elevation Dataset, 2006. Albers Equal Area Conic Projection<br />
23<br />
Chowchilla-<br />
Madera<br />
24<br />
Kings<br />
Hydrogeology 33<br />
Well locations<br />
30<br />
Tulare/Kern
34 Groundwater Availability of the <strong>Central</strong> <strong>Valley</strong> <strong>Aquifer</strong>, California<br />
D<br />
Layer 6 10<br />
EXPLANATION<br />
<strong>Central</strong> <strong>Valley</strong> boundary<br />
Percentage of coarse-grained material<br />
> is greater than.<br />
0 to 10<br />
>10 to 20<br />
>20 to 30<br />
>30 to 40<br />
>40 to 50<br />
>50 to 60<br />
>60 to 70<br />
>70 to 80<br />
>80 to 90<br />
>90 to 100<br />
2,007 wells have logged data<br />
8,312 depth increments intercepted<br />
Wells having logged data<br />
0 50 100 Miles<br />
0 50 100 Kilometers<br />
L<strong>and</strong> surface<br />
Figure A12. Continued.<br />
11<br />
Western<br />
Sacramento<br />
Layer 6<br />
Not in model<br />
Redding<br />
20<br />
Tracy/Delta-<br />
Mendota<br />
12<br />
Eastern<br />
Sacramento<br />
21<br />
Westside<br />
22<br />
Northern<br />
San Joaquin<br />
Shaded relief derived from U.S. Geological Survey<br />
National Elevation Dataset, 2006. Albers Equal Area Conic Projection<br />
23<br />
Chowchilla-<br />
Madera<br />
Well locations<br />
24<br />
Kings<br />
30<br />
Tulare/Kern
E<br />
Layer 9<br />
EXPLANATION<br />
<strong>Central</strong> <strong>Valley</strong> boundary<br />
Percentage of coarse-grained material<br />
> is greater than.<br />
0 to 10<br />
>10 to 20<br />
>20 to 30<br />
>30 to 40<br />
>40 to 50<br />
>50 to 60<br />
>60 to 70<br />
>70 to 80<br />
>80 to 90<br />
>90 to 100<br />
79 wells have logged data<br />
309 depth increments intercepted<br />
Wells having logged data<br />
0 50 100 Miles<br />
0 50 100 Kilometers<br />
L<strong>and</strong> surface<br />
Figure A12. Continued.<br />
11<br />
Western<br />
Sacramento<br />
Layer 9<br />
Not in model<br />
10<br />
Redding<br />
20<br />
Tracy/Delta-<br />
Mendota<br />
12<br />
Eastern<br />
Sacramento<br />
21<br />
Westside<br />
22<br />
Northern<br />
San Joaquin<br />
Shaded relief derived from U.S. Geological Survey<br />
National Elevation Dataset, 2006. Albers Equal Area Conic Projection<br />
23<br />
Chowchilla-<br />
Madera<br />
Well locations<br />
24<br />
Kings<br />
Hydrogeology 35<br />
30<br />
Tulare/Kern
36 Groundwater Availability of the <strong>Central</strong> <strong>Valley</strong> <strong>Aquifer</strong>, California<br />
Corcoran<br />
Clay<br />
Figure A13. Kriged texture within groundwater-flow model.<br />
EXPLANATION<br />
Percent coarse-grained material—<br />
> is greater than.<br />
0 to 10<br />
>10 to 20<br />
>20 to 30<br />
>30 to 40<br />
>40 to 50<br />
>50 to 60<br />
>60 to 70<br />
>70 to 80<br />
>80 to 90<br />
>90 to 100<br />
Approximate extent<br />
of Tulare Lake bed<br />
Inactive in model<br />
Box encompassing<br />
extent of model<br />
Line of cross section<br />
shown on figure 11<br />
(Row 355)
Geomorphic province—<br />
Basin<br />
Delta<br />
Dissected upl<strong>and</strong>s<br />
Sacramento River<br />
flood plains<br />
Fan deposits<br />
Orestimba<br />
Creek<br />
EXPLANATION<br />
Percent coarse-grained<br />
material—<br />
> is greater than.<br />
San Joaquin River<br />
0 to 10<br />
0 50 Miles<br />
0 50 Kilometers<br />
>10 to 20<br />
>20 to 30<br />
>30 to 40<br />
>40 to 50<br />
>50 to 60<br />
>60 to 70<br />
>70 to 80<br />
>80 to 90<br />
>90 to 100<br />
Mokelumne<br />
River<br />
Calaveras<br />
River<br />
Stanislaus River<br />
Major stream<br />
or canal<br />
San Joaquin Basin<br />
fluvial-fan boundaries<br />
Tuolumne River<br />
Merced River<br />
Bear Creek<br />
Chowchilla River<br />
Fresno River<br />
Sacramento River<br />
Kings<br />
River<br />
Kaweah<br />
River<br />
Hydrogeology 37<br />
Sacramento River<br />
flood plains<br />
Figure A14. Distribution of coarse-grained deposits for the upper 50 feet for part of the <strong>Central</strong> <strong>Valley</strong>. The map is overlain with the<br />
major geomorphic provinces of the <strong>Central</strong> <strong>Valley</strong> <strong>and</strong> the fluvial fans of the San Joaquin Basin (modified from Davis <strong>and</strong> others, 1959;<br />
Olmstead <strong>and</strong> Davis, 1961; Jennings, 1977; <strong>and</strong> Weissmann <strong>and</strong> others, 2005).
38 Groundwater Availability of the <strong>Central</strong> <strong>Valley</strong> <strong>Aquifer</strong>, California<br />
A<br />
COARSE-GRAINED MATERIAL, IN PERCENT<br />
B<br />
COARSE-GRAINED MATERIAL, IN PERCENT<br />
100<br />
80<br />
60<br />
40<br />
20<br />
0<br />
0.0 0.2 0.4 0.6 0.8 1.0<br />
100<br />
80<br />
60<br />
40<br />
20<br />
0<br />
San Joaquin <strong>Valley</strong><br />
Sacramento <strong>Valley</strong><br />
0.0 0.2 0.4 0.6 0.8 1.0<br />
CUMULATIVE PROBABILITY<br />
Layer 1<br />
Layer 2<br />
Layer 3<br />
Corcoran Clay<br />
EXPLANATION<br />
Layer 6<br />
Layer 7<br />
Layer 8<br />
Layer 9<br />
Layer 10<br />
Figure A15. Cumulative distributions of kriged sediment textures for model layers in the A, Sacramento <strong>Valley</strong>. B, San Joaquin <strong>Valley</strong><br />
<strong>and</strong> Tulare Basin.
San Joaquin <strong>Valley</strong><br />
<br />
<br />
),<br />
<br />
<br />
<br />
<br />
<br />
<br />
<br />
<br />
<br />
<br />
<br />
<br />
<br />
<br />
<br />
<br />
(<br />
<strong>and</strong> ). In this<br />
<br />
<br />
<br />
<br />
<br />
<br />
<br />
<br />
the mountain front.<br />
<br />
<strong>and</strong><br />
<br />
<br />
<br />
<br />
<br />
<br />
<br />
<strong>and</strong> -<br />
<br />
<br />
<br />
<br />
<br />
<br />
<br />
<br />
<br />
<br />
<br />
<br />
<strong>and</strong> <br />
<br />
Hydrogeology 39<br />
<br />
<br />
<br />
<br />
<br />
-<br />
<br />
<br />
<br />
<br />
<br />
<br />
-<br />
<br />
<br />
<br />
<br />
<br />
<br />
<br />
<br />
from north to south because of the differences in tectonic basin<br />
<br />
<br />
<br />
<br />
<br />
<br />
<br />
<br />
<br />
<br />
<br />
<br />
<br />
<br />
<br />
<br />
outlet ( <strong>and</strong> ) is not<br />
<br />
<br />
<br />
<br />
-<br />
<br />
<br />
<br />
<br />
<br />
-<br />
-<br />
-
40 Groundwater Availability of the <strong>Central</strong> <strong>Valley</strong> <strong>Aquifer</strong>, California<br />
<br />
<br />
<br />
<br />
<br />
<br />
).<br />
<br />
<strong>and</strong><br />
<br />
<br />
<br />
<br />
<br />
<br />
<br />
<br />
<br />
<br />
).<br />
<br />
<br />
<strong>and</strong> <br />
<br />
<br />
<br />
<br />
<br />
<br />
<br />
<br />
<br />
<br />
<br />
<br />
<br />
<br />
<br />
<br />
<br />
<br />
, , <strong>and</strong> <br />
<br />
<br />
<br />
<br />
<br />
<br />
<br />
<br />
<br />
<br />
<br />
<br />
<br />
<br />
<br />
<br />
(, <strong>and</strong> -<br />
<br />
<strong>and</strong> ).<br />
<br />
<br />
). This is especially true in comparison to<br />
<br />
<br />
<br />
<br />
<br />
<br />
<br />
<br />
<br />
<br />
<br />
<br />
<br />
<br />
<br />
<br />
<br />
<br />
<br />
<br />
<br />
<br />
<br />
(<br />
<br />
<br />
<br />
-<br />
<br />
<br />
<br />
Hydrologic System<br />
<br />
<br />
<br />
<br />
<br />
<br />
<br />
-<br />
<br />
<br />
<br />
<br />
). These dams capture
-<br />
<br />
<br />
<br />
<br />
Water supplied from aquifers is a less formal <strong>and</strong> less<br />
-<br />
<br />
<br />
<br />
<br />
<br />
<br />
.<br />
<br />
<br />
<br />
<br />
-<br />
<br />
<br />
Climate<br />
<br />
<br />
<br />
<br />
<br />
<br />
<br />
<br />
<br />
<br />
<br />
<br />
<br />
<br />
<br />
<br />
<br />
<br />
-<br />
<br />
<br />
Hydrogeology 41<br />
<br />
(<br />
<br />
months.<br />
<br />
<br />
<br />
<br />
<br />
<br />
<br />
<br />
<br />
<br />
<br />
-<br />
<br />
<br />
-<br />
<br />
(<br />
<strong>and</strong> -<br />
<br />
<br />
<br />
<br />
). Under the current climatic<br />
-<br />
<br />
<br />
<br />
<br />
<br />
<br />
). Wet periods represent<br />
<br />
<br />
<br />
<br />
median periods <strong>and</strong> drier-than-median periods since the<br />
<br />
-<br />
<br />
(<br />
<br />
<br />
).<br />
<br />
<br />
departure is less in the south ( <strong>and</strong> <br />
<br />
) also
42 Groundwater Availability of the <strong>Central</strong> <strong>Valley</strong> <strong>Aquifer</strong>, California<br />
A<br />
FLOW RATE, IN THOUSANDS OF ACRE-FEET PER YEAR<br />
B<br />
MEAN PRECIPITATION, IN INCHES PER YEAR<br />
80,000<br />
70,000<br />
60,000<br />
50,000<br />
40,000<br />
30,000<br />
20,000<br />
10,000<br />
0<br />
30<br />
25<br />
20<br />
15<br />
10<br />
5<br />
0<br />
"Normal"<br />
to<br />
Dry<br />
"Normal"<br />
to<br />
Dry<br />
Representative Water Year<br />
"Variable"<br />
to<br />
Wet<br />
"Variable"<br />
to<br />
Wet<br />
Dry Wet Dry<br />
Wet<br />
WATER YEAR<br />
EXPLANATION<br />
75 th percentile<br />
(38,200)<br />
Median<br />
(26,300)<br />
Dry Wet Dry<br />
Wet<br />
WATER YEAR<br />
"Variable"<br />
to<br />
Dry<br />
1962 1964 1966 1968 1970 1972 1974 1976 1978 1980 1982 1984 1986 1988 1990 1992 1994 1996 1998 2000 2002<br />
Sacramento River<br />
Feather River<br />
American River<br />
Representative Water Year<br />
Typical<br />
1975<br />
Yuba River<br />
Cottonwood Creek<br />
Other Sacramento <strong>Valley</strong> streams<br />
Typical<br />
1975<br />
25 th percentile<br />
(18,800)<br />
Kings River<br />
Tuolumne River<br />
Stanislaus River<br />
75 th percentile<br />
(16.8)<br />
Median<br />
(13.0)<br />
Merced River<br />
Kern River<br />
Other San Joaquin <strong>Valley</strong> streams<br />
25 th percentile<br />
(11.0)<br />
"Variable"<br />
to<br />
Dry<br />
1962 1964 1966 1968 1970 1972 1974 1976 1978 1980 1982 1984 1986 1988 1990 1992 1994 1996 1998 2000 2002<br />
Figure A16. A, Total inflow from 44 gaged streams flowing into the <strong>Central</strong> <strong>Valley</strong>, California, water years 1962–2003.<br />
B, Average annual precipitation in the <strong>Central</strong> <strong>Valley</strong>, California, water years 1962–2003. C, Total surface-water flow into the <strong>Central</strong><br />
<strong>Valley</strong>, California, water years 1962–2003.<br />
Dry<br />
1990<br />
Dry<br />
1990<br />
Wet<br />
1998<br />
Wet<br />
1998
C<br />
Figure A16. Continued.<br />
3.54%<br />
5.45%<br />
S a n J o a q u i n V a l l e y R i v e r s<br />
6.00%<br />
3.24%<br />
2.42%<br />
Sacramento River<br />
Feather River<br />
American River<br />
Yuba River<br />
16.54%<br />
Cottonwood Creek<br />
7.85%<br />
2.17%<br />
6.12%<br />
EXPLANATION<br />
<br />
<br />
<br />
<br />
<br />
<br />
-<br />
<br />
20 th <br />
<br />
24.03%<br />
8.95%<br />
S a c r a m e n t o V a l l e y R i v e r s<br />
Kings River<br />
Tuolumne River<br />
Stanislaus River<br />
Merced River<br />
Kern River<br />
13.69%<br />
Other Sacramento <strong>Valley</strong> streams Other San Joaquin <strong>Valley</strong> streams<br />
Hydrogeology 43<br />
<br />
.<br />
There are some notable spatial differences in the cumula-<br />
<br />
-<br />
<br />
<br />
-<br />
<br />
<br />
precipitation.
44 Groundwater Availability of the <strong>Central</strong> <strong>Valley</strong> <strong>Aquifer</strong>, California<br />
CUMULATIVE DEPARTURE OF PRECIPITATION, IN INCHES PER YEAR<br />
50<br />
40<br />
30<br />
20<br />
10<br />
0<br />
-10<br />
-20<br />
-30<br />
-40<br />
-50<br />
-60<br />
-70<br />
-80<br />
"Variable"<br />
"Variable" "Variable"<br />
Dry Wet to<br />
Wet Dry Wet Dry Wet Dry<br />
to to Dry Wet Dry Wet<br />
Dry<br />
Dry Wet<br />
1875 1885 1895 1905 1915 1925 1935 1945 1955 1965 1975 1985 1995 2005<br />
Red Bluff<br />
Davis<br />
Fresno<br />
<br />
( <strong>and</strong> <br />
<br />
<br />
<br />
TIME, IN YEARS<br />
EXPLANATION<br />
Annual cumulative departure of precipition—<br />
Bakersfield<br />
Pacific Decadal Oscillation (PDO) Index-24 month moving average<br />
Figure A17. Cumulative departure from average annual precipitation at Redding, Davis, Fresno, <strong>and</strong> Bakersfield, California. For<br />
reference, a 24-month moving average of the Pacific Decadal Oscillation Index is also plotted.<br />
"Variable"<br />
to<br />
Dry<br />
-1.0<br />
-2.0<br />
-3.0<br />
<br />
<br />
<strong>and</strong> ).<br />
3.0<br />
2.0<br />
1.0<br />
0.0<br />
PACIFIC DECADAL OSCILLATION (PDO) INDEX, UNITLESS
CUMULATIVE DEPARTURE OF PRECIPITATION AND<br />
REFERENCE EVAPOTRANSPIRATION, IN INCHES PER YEAR<br />
10<br />
0<br />
-10<br />
-20<br />
-30<br />
-40<br />
"Variable"<br />
to<br />
Dry<br />
"Variable"<br />
to<br />
Wet<br />
<br />
) <strong>and</strong> is directly dependent on a combina-<br />
<br />
<br />
-<br />
<br />
<br />
).<br />
Dry Wet Dry<br />
Wet<br />
TIME, IN YEARS<br />
Hydrogeology 45<br />
-50<br />
-1.5<br />
1960 1965 1970 1975 1980 1985 1990 1995 2000 2005<br />
EXPLANATION<br />
Annual cumulative departure of<br />
reference evapotranspiration (ETo)—<br />
Red Bluff<br />
Davis<br />
Bakersfield<br />
Annual cumulative departure of precipitation<br />
from PRISM data<br />
Davis<br />
Pacific Decadal Oscillation (PDO) average annual value<br />
"Variable"<br />
to<br />
Dry<br />
Figure A18. Cumulative departure of monthly precipitation (Parameter-elevation Regressions on Independent Slopes Model (PRISM)<br />
data from Davis, California), cumulative departure of the Pacific Decadal Oscillation (PDO) index, <strong>and</strong> cumulative departure of the<br />
monthly reference evapotranspiration (ETo) values (gridded values of California Irrigation Management Information System’s (CIMIS)<br />
stations from Redding, Davis, <strong>and</strong> Bakersfield, 1960–2004).<br />
-0.5<br />
-1.0<br />
<br />
<br />
-<br />
<br />
<br />
<br />
<br />
<br />
2.0<br />
1.5<br />
1.0<br />
0.5<br />
0.0<br />
PACIFIC DECADAL OSCILLATION (PDO) INDEX, UNITLESS
46 Groundwater Availability of the <strong>Central</strong> <strong>Valley</strong> <strong>Aquifer</strong>, California<br />
<br />
<br />
<br />
Surface Water<br />
<br />
<br />
<br />
-<br />
<br />
<br />
<br />
<br />
(<br />
<br />
-<br />
). North<br />
<br />
<br />
<br />
<br />
<br />
<br />
<br />
<br />
<br />
<br />
<br />
<br />
<br />
<br />
much smaller (<br />
-<br />
<br />
<br />
<br />
<br />
<br />
<br />
<br />
<br />
<br />
<br />
<br />
<br />
<br />
<br />
-<br />
<br />
<br />
<br />
<br />
acre-ft/yr (<br />
<br />
<br />
<br />
<br />
<br />
<br />
<br />
).<br />
-<br />
<br />
<br />
<br />
<br />
<br />
<br />
<br />
<br />
<br />
<br />
-<br />
).<br />
<br />
).<br />
<br />
<br />
<br />
<br />
<br />
<br />
<br />
-<br />
<br />
-<br />
<br />
-<br />
<br />
<br />
<br />
-<br />
<br />
<br />
<br />
<br />
-<br />
<br />
<br />
<br />
<br />
but also is controlled by other factors. These factors may
CUMULATIVE DEPARTURE OF STREAMFLOW DIVERSION, IN ACRE-FEET PER YEAR<br />
300<br />
200<br />
100<br />
0<br />
-100<br />
-200<br />
Cool (Negative) Warm (Positive)<br />
Cool<br />
(Negative)<br />
"Variable"<br />
to<br />
Dry<br />
"Variable"<br />
to<br />
Wet<br />
-<br />
<br />
<br />
<br />
<br />
<br />
<br />
). In addition,<br />
<br />
<br />
Dry Wet<br />
Dry<br />
TIME, IN YEARS<br />
Groundwater<br />
Hydrogeology 47<br />
"Variable"<br />
to<br />
Dry<br />
1960 1965 1970 1975 1980 1985 1990 1995 2000 2005<br />
Cool<br />
(Negative)<br />
EXPLANATION<br />
Periods of Pacific Decadal Oscillation [PDO]<br />
(Mantua, 2006)<br />
Bear River Diversion cumulative departure average<br />
Cumulative annual temperature difference, 1964-2003<br />
Pacific Decadal Oscillation (PDO) average annual value<br />
Figure A19. Cumulative departure of streamflow diversions from the Bear River by South Sutter Water District, California; cumulative<br />
annual temperature from California Irrigation Management Information System’s (CIMIS) stations at Davis <strong>and</strong> the Pacific Decadal<br />
Oscillation (PDO) index, 1960–2004.<br />
Wet<br />
-2.0<br />
-4.0<br />
-6.0<br />
<br />
<br />
<br />
<br />
<br />
<br />
-<br />
<br />
<br />
6.0<br />
4.0<br />
2.0<br />
0.0<br />
CUMULATIVE ANNUAL TEMPERATURE DIFFERENCE, IN DEGREES FAHRENHEIT<br />
PDO-INDEX, UNITLESS
48 Groundwater Availability of the <strong>Central</strong> <strong>Valley</strong> <strong>Aquifer</strong>, California<br />
Predevelopment Recharge, Discharge,<br />
Water Levels, <strong>and</strong> Flows<br />
<br />
<br />
-<br />
<br />
<br />
<strong>and</strong><br />
<br />
<br />
<br />
<br />
<br />
<br />
<br />
<br />
<br />
basin.<br />
<br />
<br />
-<br />
<br />
<br />
<br />
<br />
-<br />
-<br />
<br />
<br />
-<br />
<br />
<br />
<br />
<br />
<br />
). Other<br />
<br />
<br />
(<br />
<br />
Groundwater/Surface-Water Interaction<br />
<br />
<br />
<br />
<br />
<br />
<br />
-<br />
<br />
<br />
<br />
-<br />
<br />
-<br />
<br />
-<br />
<br />
<br />
<br />
<br />
<br />
<br />
<br />
<br />
<br />
-<br />
<br />
<br />
<br />
<br />
<br />
<br />
<br />
<br />
<br />
<br />
<br />
<br />
<br />
<br />
<br />
<br />
).<br />
<strong>Aquifer</strong>-System Storage<br />
-<br />
-<br />
-<br />
<br />
<br />
<br />
-<br />
<br />
-<br />
-<br />
<br />
-<br />
<br />
serious consequences. Therefore, this type of calculation of
700<br />
500<br />
600<br />
400<br />
200<br />
160<br />
0 50 100 Miles<br />
240<br />
360<br />
320<br />
120<br />
280<br />
40<br />
240<br />
160<br />
0 50 100 Kilometers<br />
Shaded relief derived from U.S. Geological Survey<br />
National Elevation Dataset, 2006. Albers Equal Area Conic Projection<br />
0<br />
40<br />
40<br />
160<br />
80<br />
200<br />
200<br />
160<br />
160<br />
240<br />
160<br />
120<br />
240<br />
280<br />
400<br />
200<br />
240<br />
320<br />
400<br />
500<br />
700<br />
320<br />
200<br />
360<br />
EXPLANATION<br />
Predevelopment water levels<br />
Water-level altitude,<br />
in feet above NGVD 29<br />
Figure A20. Pre-development groundwater map (modified from Williamson <strong>and</strong> others, 1989).<br />
360<br />
360<br />
280<br />
360<br />
360<br />
0<br />
1 to 50<br />
51 to 100<br />
101 to 200<br />
201 to 400<br />
401 to 800<br />
Historical lakes<br />
<strong>Central</strong> <strong>Valley</strong> boundary<br />
320<br />
360<br />
400<br />
400<br />
400<br />
500<br />
Hydrogeology 49
50 Groundwater Availability of the <strong>Central</strong> <strong>Valley</strong> <strong>Aquifer</strong>, California<br />
A<br />
0 50 100 Miles<br />
0 50 100 Kilometers<br />
Shaded relief derived from U.S. Geological Survey<br />
National Elevation Dataset, 2006. Albers Equal Area Conic Projection<br />
EXPLANATION<br />
Vegetation types—<br />
Alkali desert scrub<br />
Major streams<br />
Figure A21. Distribution of A, Pre-1900 l<strong>and</strong>-use patterns (modified from California State University, Chico, 2003), B, l<strong>and</strong>-use patterns<br />
in 2000 (California Department of Water Resources, 2000) for the <strong>Central</strong> <strong>Valley</strong>, California.<br />
Aquatic<br />
Grassl<strong>and</strong><br />
Other floodplain habitat<br />
Riparian<br />
<strong>Valley</strong>/Foothill hardwood<br />
Wetl<strong>and</strong><br />
<strong>Central</strong> <strong>Valley</strong> boundary
B<br />
0 50 100 Miles<br />
0 50 100 Kilometers<br />
Shaded relief derived from U.S. Geological Survey<br />
National Elevation Dataset, 2006. Albers Equal Area Conic Projection<br />
Figure A21. Continued.<br />
Alfalfa<br />
Almond <strong>and</strong> pistachio<br />
Corn<br />
Cotton<br />
Cucurbits<br />
Dry beans<br />
Fallow <strong>and</strong> idle<br />
Grain<br />
EXPLANATION<br />
L<strong>and</strong> use or vegetation types—<br />
Native classes<br />
Not surveyed<br />
Onions <strong>and</strong> garlic<br />
Other decidious<br />
Major streams<br />
Hydrogeology 51<br />
Other field<br />
Other truck<br />
Pasture<br />
Potatoes<br />
Rice<br />
Safflower<br />
Subtropical<br />
Sugar beets<br />
Tomatoes<br />
Urban<br />
Vineyard<br />
Water<br />
<strong>Central</strong> <strong>Valley</strong> boundary
52 Groundwater Availability of the <strong>Central</strong> <strong>Valley</strong> <strong>Aquifer</strong>, California<br />
Stony Creek<br />
Sacramento<br />
Cache Creek<br />
Putah Cr ek<br />
0 50 100 Miles<br />
0 50 100 Kilometers<br />
Shaded relief derived from U.S. Geological Survey<br />
National Elevation Dataset, 2006. Albers Equal Area Conic Projection<br />
1<br />
2<br />
3<br />
6<br />
4<br />
5<br />
Feather<br />
9<br />
American<br />
Mokelumne<br />
Calaveras<br />
Stanislaus<br />
Tuolumne<br />
San Joaquin<br />
San Joaquin<br />
Kaweah River<br />
Figure A22. Distribution of selected streams <strong>and</strong> canals, <strong>and</strong> average estimated gains <strong>and</strong> losses for selected segments (Mullen <strong>and</strong><br />
Nady, 1985).<br />
Merced<br />
STREAMFLOW<br />
7 7<br />
8<br />
11<br />
12<br />
10<br />
Deadman's Creek<br />
14<br />
13<br />
GAIN<br />
LOSS<br />
Fresno<br />
Fresno Slough<br />
EXPLANATION<br />
<strong>Central</strong> <strong>Valley</strong> boundary<br />
Selected streams <strong>and</strong> canals<br />
Groundwater/surface-water interaction,<br />
in acre-feet per year<br />
16<br />
-54.97 to -44.42<br />
-44.39 to -14.81<br />
-14.78 to -1.48<br />
-1.45 to 0<br />
0.03 to 1.48<br />
1.51 to 14.81<br />
14.84 to 44.42<br />
44.45 to 113.07<br />
Kings River<br />
15<br />
19<br />
17<br />
18<br />
20<br />
Kern River<br />
21<br />
Out of groundwater<br />
system<br />
Into groundwater<br />
system<br />
California Department of Water Resources<br />
water-balance subregion <strong>and</strong> identifier.
Water Budget<br />
<br />
<br />
<br />
<br />
<br />
<br />
<br />
<br />
<br />
<br />
<br />
<br />
per year (<br />
<br />
<br />
<br />
-<br />
-<br />
<br />
<br />
-<br />
<br />
-<br />
<br />
<br />
pired<br />
by plants (<br />
Precipitation<br />
(12.4)<br />
(1.5)<br />
(10.9)<br />
<strong>Central</strong> <strong>Valley</strong><br />
Surface Processes<br />
Evapotranspiration<br />
(12.6)<br />
<strong>Central</strong> <strong>Valley</strong><br />
<strong>Aquifer</strong><br />
(1.7)<br />
Acknowledgments 53<br />
<br />
<br />
-<br />
-<br />
<br />
<br />
<br />
Acknowledgments<br />
<br />
<br />
<br />
<br />
<br />
<br />
<br />
<br />
<br />
<br />
<br />
<br />
<br />
<br />
-<br />
<br />
others.<br />
Surface-Water<br />
Gain (0.3)<br />
[sw out]<br />
Surface-Water<br />
Loss (0.5)<br />
[sw in]<br />
Figure A23. Pre-development water budget <strong>and</strong> post-development water budget. Values are in millions of acre-feet per year.
54 Groundwater Availability of the <strong>Central</strong> <strong>Valley</strong> <strong>Aquifer</strong>, California<br />
References Cited<br />
<br />
<br />
-<br />
<br />
<br />
-<br />
<br />
<br />
<br />
-<br />
<br />
<br />
<br />
<br />
<br />
<br />
<br />
<br />
<br />
<br />
<br />
<br />
<br />
<br />
<br />
<br />
44 p.<br />
-<br />
<br />
<br />
-<br />
<br />
<br />
<br />
<br />
<br />
-<br />
-<br />
<br />
<br />
<br />
-<br />
<br />
<br />
<br />
<br />
<br />
<br />
<br />
<br />
-<br />
<br />
<br />
<br />
<br />
16, 2009, at <br />
<br />
<br />
<br />
<br />
<br />
<br />
2009, at <br />
-<br />
<br />
<br />
<br />
<br />
<br />
<br />
-
References Cited 55<br />
<br />
-<br />
<br />
<br />
<br />
<br />
<br />
<br />
<br />
<br />
<br />
<br />
<br />
<br />
<br />
<br />
<br />
-<br />
<br />
http://<br />
<br />
<br />
-<br />
<br />
<br />
<br />
<br />
-<br />
<br />
<br />
<br />
<br />
<br />
<br />
<br />
<br />
-<br />
<br />
<br />
<br />
<br />
<br />
<br />
-<br />
<br />
<br />
<br />
<br />
<br />
<br />
<br />
<br />
<br />
<br />
at <br />
<br />
<br />
<br />
<br />
-<br />
<br />
<br />
<br />
<br />
<br />
-<br />
<br />
<br />
<br />
<br />
<br />
<br />
-<br />
<br />
<br />
<br />
-<br />
<br />
<br />
<br />
<br />
<br />
-<br />
<br />
<br />
<br />
<br />
<br />
-
56 Groundwater Availability of the <strong>Central</strong> <strong>Valley</strong> <strong>Aquifer</strong>, California<br />
<br />
<br />
-<br />
<br />
<br />
<br />
<br />
<br />
<br />
<br />
-<br />
<br />
<br />
<br />
<br />
<br />
<br />
<br />
<br />
-<br />
-<br />
<br />
<br />
<br />
<br />
<br />
<br />
<br />
<br />
561 p.<br />
-<br />
<br />
<br />
<br />
-<br />
-<br />
<br />
<br />
<br />
-<br />
<br />
<br />
<br />
<br />
<br />
<br />
-<br />
<br />
<br />
-<br />
<br />
<br />
<br />
-<br />
<br />
-<br />
<br />
-<br />
<br />
-<br />
<br />
<br />
<br />
-<br />
<br />
<br />
<br />
<br />
-<br />
<br />
<br />
<br />
-<br />
<br />
<br />
-<br />
-<br />
<br />
974 p.<br />
<br />
<br />
<br />
<br />
<br />
<br />
1497, 287 p.<br />
<br />
<br />
-<br />
-<br />
<br />
24 p.<br />
<br />
-<br />
<br />
54 p.
References Cited 57<br />
-<br />
<br />
<br />
-<br />
<br />
2009, at <br />
<br />
-<br />
<br />
<br />
<br />
<br />
<br />
-<br />
<br />
<br />
<br />
<br />
<br />
<br />
<br />
<br />
<br />
<br />
<br />
<br />
<br />
<br />
-<br />
<br />
<br />
<br />
<br />
<br />
<br />
<br />
-<br />
<br />
<br />
<br />
<br />
<br />
-<br />
-<br />
<br />
<br />
<br />
<br />
<br />
-
Chapter B. Groundwater Availability in<br />
California’s <strong>Central</strong> <strong>Valley</strong><br />
By Claudia C. Faunt, Kenneth Belitz, <strong>and</strong> R<strong>and</strong>all T. Hanson<br />
Introduction<br />
-<br />
<br />
<br />
<br />
<br />
<br />
<br />
, this report). The<br />
<br />
<br />
<br />
<br />
<br />
<br />
<br />
-<br />
<br />
<br />
Development <strong>and</strong> the<br />
Hydrologic System<br />
<br />
<br />
<br />
<br />
<br />
<br />
<br />
<br />
<br />
<br />
<br />
in. in places (<br />
<br />
<br />
<br />
<br />
<br />
<br />
<br />
<br />
<br />
<br />
<br />
-<br />
-<br />
<br />
<br />
<br />
<br />
help rectify the imbalance.<br />
Surface-Water <strong>and</strong> Groundwater<br />
Development History<br />
<br />
<br />
<br />
<br />
<br />
<br />
<br />
<br />
<br />
<br />
<br />
<br />
-<br />
<br />
<br />
<br />
<br />
<br />
<br />
<br />
<br />
-
60 Groundwater Availability of the <strong>Central</strong> <strong>Valley</strong> <strong>Aquifer</strong>, California<br />
-<br />
<br />
basins (<br />
<br />
<br />
<br />
<br />
-<br />
-<br />
<br />
<br />
<br />
-<br />
<br />
<br />
<br />
<br />
season.<br />
<br />
<br />
<br />
-<br />
<br />
<br />
<br />
<br />
<br />
<br />
<br />
<br />
<br />
<br />
<br />
-<br />
<br />
<br />
<br />
<br />
<br />
<br />
<br />
<br />
<br />
<br />
<br />
<br />
<br />
<br />
<br />
<br />
<br />
<br />
).<br />
<br />
-<br />
<br />
<br />
).<br />
<br />
<br />
-<br />
<br />
<br />
<br />
<br />
<br />
<br />
<br />
<br />
<br />
<br />
<br />
<br />
<br />
<br />
<br />
<br />
<br />
<br />
<br />
<br />
<br />
<br />
<br />
<br />
<br />
<br />
<br />
<br />
L<strong>and</strong> Use<br />
<br />
<br />
<br />
<br />
<br />
<br />
<br />
-
Agricultural L<strong>and</strong> Use<br />
<br />
-<br />
<br />
<br />
<br />
<br />
<br />
<br />
<br />
-<br />
<br />
19 th <br />
<br />
<br />
<br />
<br />
<br />
<br />
<br />
<br />
<br />
<br />
<br />
<br />
tomatoes, melons, squash <strong>and</strong> lettuce) crops. The tomato<br />
<br />
<br />
Water, soils, microclimate, pests, economic <strong>and</strong> historical<br />
<br />
<br />
ley<br />
(<br />
-<br />
<br />
<br />
<br />
<br />
-<br />
<br />
<br />
<br />
<br />
-<br />
<br />
<br />
<br />
<br />
<br />
<br />
<br />
<br />
<br />
Development <strong>and</strong> the Hydrologic System 61<br />
<br />
<br />
<br />
<br />
<br />
<br />
<br />
<br />
-<br />
<br />
<br />
<br />
<br />
<br />
<br />
<br />
<br />
<br />
<br />
Urban L<strong>and</strong> Use<br />
<br />
<br />
<br />
<br />
<br />
<br />
<br />
<br />
<br />
<br />
<br />
<br />
<br />
<br />
<br />
-<br />
<br />
-<br />
<br />
<br />
<br />
<br />
<br />
-<br />
<br />
threefold from about 0.6 to nearly 2 million acre-ft/yr, despite
62 Groundwater Availability of the <strong>Central</strong> <strong>Valley</strong> <strong>Aquifer</strong>, California<br />
<br />
<br />
<br />
<br />
<br />
<br />
<br />
<br />
<br />
<br />
<br />
<br />
-<br />
<br />
Development <strong>and</strong> Changes to the<br />
Hydrologic Budget<br />
<br />
<br />
<strong>and</strong> ). <br />
-<br />
<br />
<br />
<br />
-<br />
<br />
<br />
<br />
-<br />
<br />
-<br />
<br />
<br />
<br />
system.<br />
<br />
<br />
<br />
<br />
<br />
<br />
<br />
<br />
<br />
<br />
<br />
-<br />
<br />
<br />
<br />
<br />
<br />
<br />
paction<br />
<strong>and</strong> associated l<strong>and</strong> subsidence.<br />
<br />
-<br />
<br />
system (<br />
<br />
<br />
<br />
<br />
<br />
<br />
<br />
<br />
-<br />
<br />
study (). Where necessary, the results of simulations<br />
<br />
<br />
Hydrologic Budget Components<br />
-<br />
<br />
<strong>and</strong> <strong>and</strong> tabulated in <strong>and</strong> <br />
<br />
components pertain to both systems (). The l<strong>and</strong>scape<br />
<br />
( <strong>and</strong> <strong>and</strong> <strong>and</strong> <br />
<br />
<br />
-<br />
<br />
-<br />
<br />
<br />
<br />
<br />
<br />
<br />
<br />
<br />
<br />
<br />
-
Groundwater<br />
Pumpage<br />
(9.3)<br />
Agricultural<br />
(8.6)<br />
Municipal<br />
(1.1)<br />
Flow through<br />
Boreholes<br />
(0.4)<br />
Precipitation<br />
(15.8)<br />
<strong>Central</strong> <strong>Valley</strong><br />
Surface Processes<br />
Groundwater Recharge from<br />
Irrigation <strong>and</strong> Precipitation<br />
(7.8)<br />
<strong>Central</strong> <strong>Valley</strong><br />
<strong>Aquifer</strong><br />
Change in Storage<br />
(including Subsidence)<br />
(1.4)<br />
—Indicates loss of storage in aquifer system<br />
Development <strong>and</strong> Changes to the Hydrologic Budget 63<br />
Evapotranspiration<br />
(25.6)<br />
INFLOW<br />
(26.3)<br />
Surface-Water<br />
Deliveries (10.2)<br />
Runoff<br />
(1.1)<br />
Surface-Water<br />
System<br />
Groundwater<br />
Flow to Delta (0.1)<br />
Surface-Water<br />
Gain from<br />
Groundwater<br />
System (2.2)<br />
Surface-Water<br />
Loss from<br />
Groundwater<br />
System (2.5)<br />
OUTFLOW<br />
to DELTA<br />
(27.2)<br />
Figure B1. Average water budget for water years 1962–2003. This budget includes the l<strong>and</strong>scape <strong>and</strong> groundwater components <strong>and</strong><br />
their linkages. Values in millions of acre-ft/yr. A diagram showing the pre-development water budget is shown in .
64 Groundwater Availability of the <strong>Central</strong> <strong>Valley</strong> <strong>Aquifer</strong>, California<br />
21%<br />
10%<br />
30%<br />
39%<br />
Simulated l<strong>and</strong>scape water budget<br />
INPUT OUTPUT<br />
Typical Year 1975<br />
Dry Year 1990<br />
35%<br />
10%<br />
MILLIONS OF ACRE-FEET<br />
MILLIONS OF ACRE-FEET<br />
30<br />
25<br />
20<br />
15<br />
10<br />
5<br />
0<br />
25<br />
20<br />
15<br />
10<br />
5<br />
0<br />
14.53<br />
11.28<br />
7.93<br />
3.93<br />
30 30<br />
Wet Year 1998<br />
7%<br />
10%<br />
19%<br />
25%<br />
30%<br />
64%<br />
Precipitation<br />
Surface-water<br />
deliveries<br />
MILLIONS OF ACRE-FEET<br />
30<br />
25<br />
20<br />
15<br />
10<br />
5<br />
0<br />
10.12<br />
30.18<br />
8.36<br />
8.95<br />
Groundwater<br />
pumpage<br />
11.69<br />
4.54<br />
Evapotranspiration<br />
from ground water<br />
3.19<br />
1%<br />
EXPLANATION<br />
3%<br />
29%<br />
21%<br />
40%<br />
5%<br />
68%<br />
78%<br />
55%<br />
MILLIONS OF ACRE-FEET<br />
MILLIONS OF ACRE-FEET<br />
MILLIONS OF ACRE-FEET<br />
30<br />
25<br />
20<br />
15<br />
10<br />
5<br />
0<br />
25<br />
20<br />
15<br />
10<br />
5<br />
0<br />
30<br />
25<br />
20<br />
15<br />
10<br />
5<br />
0<br />
Evapotranspiration Runoff<br />
Deep percolation<br />
Figure B2. Simulated l<strong>and</strong>scape budget for the <strong>Central</strong> <strong>Valley</strong> for typical (1975), dry (1990), <strong>and</strong> wet (1998) years.<br />
3.33<br />
25.52<br />
25.99<br />
25.85<br />
1.02<br />
0.49<br />
2.14<br />
10.99<br />
6.92<br />
18.65
Simulated groundwater budget<br />
INPUT OUTPUT<br />
EXPLANATION<br />
Development <strong>and</strong> Changes to the Hydrologic Budget 65<br />
Typical Year 1975<br />
51%<br />
2%<br />
32%<br />
6% 0%<br />
9%<br />
Dry Year 1990<br />
55%<br />
Wet Year 20.86<br />
1998<br />
0%<br />
38%<br />
4%<br />
15%<br />
25%<br />
43%<br />
3%<br />
10%<br />
1%<br />
5%<br />
0%<br />
MILLIONS OF ACRE-FEET<br />
MILLIONS OF ACRE-FEET<br />
MILLIONS OF ACRE-FEET<br />
20<br />
16<br />
12<br />
Specific yield <strong>and</strong><br />
compressibility of water<br />
Elastic <strong>and</strong> inelastic<br />
matrix storage<br />
8<br />
4<br />
0<br />
20<br />
16<br />
12<br />
8<br />
4<br />
0<br />
20<br />
16<br />
12<br />
8<br />
4<br />
0<br />
6.50<br />
2.78<br />
0.03<br />
0.06<br />
0.01<br />
1.13<br />
0.58<br />
1.47<br />
1.90<br />
1.11<br />
7.46<br />
10.19<br />
6.29<br />
18.14<br />
Surface-water loss to<br />
groundwater system<br />
Recharge from<br />
l<strong>and</strong>scape system<br />
Intra-borehole flow<br />
0.44<br />
0.39<br />
37%<br />
43%<br />
27%<br />
11%<br />
13%<br />
9%<br />
18%<br />
33%<br />
7% 0%<br />
10%<br />
6%<br />
32%<br />
10%<br />
38%<br />
4% 2%<br />
0%<br />
Specific yield <strong>and</strong><br />
compressibility of water<br />
Elastic <strong>and</strong> inelastic<br />
matrix storage<br />
MILLIONS OF ACRE-FEET<br />
MILLIONS OF ACRE-FEET<br />
20<br />
16<br />
12<br />
8<br />
4<br />
0<br />
20<br />
16<br />
12<br />
8<br />
4<br />
0<br />
7.67<br />
9.43<br />
0.11<br />
0.03<br />
Groundwater lost<br />
to streams<br />
Evapotranspiration from<br />
groundwater<br />
Pumpage<br />
Figure B3. Simulated groundwater budget for the <strong>Central</strong> <strong>Valley</strong> for typical (1975), dry (1990), <strong>and</strong> wet (1998) years.<br />
0.31<br />
MILLIONS OF ACRE-FEET<br />
20<br />
16<br />
12<br />
8<br />
4<br />
0<br />
8.83<br />
0.45<br />
1.66<br />
2.99<br />
1.00<br />
2.36<br />
1.64<br />
4.12<br />
3.05<br />
2.00<br />
2.65<br />
8.72<br />
12.60<br />
6.18
66 Groundwater Availability of the <strong>Central</strong> <strong>Valley</strong> <strong>Aquifer</strong>, California<br />
Table B1. Summary of the simulated l<strong>and</strong>scape budget for average (water years 1962-2003), typical (1975), dry (1990), <strong>and</strong> wet (1998)<br />
years for the <strong>Central</strong> <strong>Valley</strong>, California.<br />
<br />
<br />
Precip-<br />
itation<br />
Input to l<strong>and</strong>scape system Output from l<strong>and</strong>scape system<br />
Surface<br />
surface-water<br />
deliveries<br />
Groundwater<br />
pumpage<br />
Evapotranspiration<br />
from<br />
groundwater<br />
Evapotranspiration<br />
Runoff<br />
Deep percolation<br />
Ground-<br />
water<br />
recharge<br />
15.8 10.2 8.6 3.7 25.6 1.1 11.4 7.7<br />
Typical 14.5 11.3 7.9 3.9 25.5 1 11 7.0<br />
10.1 8.4 11.7 3.3 26 0.5 6.9 3.6<br />
Wet 30.2 8.9 4.5 3.2 25.8 2.1 18.6 15.4<br />
Table B2. Summary of the simulated groundwater budget for average (water years 1962-2003), typical (1975), dry (1990), <strong>and</strong> wet (1998)<br />
years for the <strong>Central</strong> <strong>Valley</strong>, California.<br />
-<br />
]<br />
Storage from<br />
specific yield <strong>and</strong><br />
compressibility of<br />
water<br />
Elastic <strong>and</strong> inelastic<br />
storage<br />
Input to the groundwater system<br />
Stream leakage to<br />
groundwater<br />
Recharge from<br />
l<strong>and</strong>scape process<br />
Intra-borehole<br />
flow<br />
General head<br />
boundaries<br />
8.1 1 2.6 10.7 0.4 0.0<br />
Typical 6.5 1.1 1.9 10.2 0.4 0.0<br />
2.8 0.6 1.1 6.3 0.4 0.1<br />
Wet 20.9 1.5 7.5 18.1 0.3 0.0<br />
Output from the groundwater system<br />
Storage<br />
(specific yield <strong>and</strong><br />
compressibility<br />
of water)<br />
Storage<br />
(elastic <strong>and</strong><br />
inelastic<br />
compaction)<br />
Groundwater<br />
inflow to<br />
streams<br />
Discharge<br />
from l<strong>and</strong>scape<br />
process<br />
Pumpage<br />
General head<br />
boundaries<br />
8.5 2 2.2 3. 9.7 0.1<br />
Typical 7.7 1.7 2.4 3.1 8.7 0.1<br />
8.8 3 1.6 2.6 12.6 0<br />
Wet 18.9 1 4.1 2.6 6.2 0.5<br />
Net in relation to groundwater availability<br />
Storage from<br />
specific yield <strong>and</strong><br />
compressibility of<br />
water<br />
Elastic <strong>and</strong> inelastic<br />
storage<br />
Stream<br />
interaction<br />
Recharge<br />
from l<strong>and</strong>scape<br />
process<br />
Pumpage<br />
General head<br />
boundaries<br />
0.3 7.8 <br />
Typical 7.1 <br />
3.7 0<br />
Wet 12 0.5 3.3 15.5 <br />
Recharge <strong>and</strong> Discharge<br />
<br />
<br />
<br />
-<br />
<br />
times (Williamson <strong>and</strong> others, 1989).<br />
<br />
<br />
<br />
(
<strong>and</strong> <br />
<br />
<br />
-<br />
<br />
mechanisms.<br />
-<br />
<br />
<br />
-<br />
-<br />
<br />
<br />
-<br />
<strong>and</strong> -<br />
<br />
<br />
<br />
<br />
<br />
<br />
<br />
<br />
<br />
<br />
<br />
<br />
<br />
<br />
<br />
<br />
<br />
-<br />
<br />
<br />
<br />
<br />
<br />
<br />
-<br />
<br />
<br />
<br />
-<br />
<br />
<strong>and</strong> .<br />
<br />
<br />
<br />
10.2 million acre-ft/yr ( <strong>and</strong> <br />
<br />
Development <strong>and</strong> Changes to the Hydrologic Budget 67<br />
<br />
<br />
<br />
<br />
-<br />
<br />
<br />
<br />
proportion increases.<br />
<strong>Aquifer</strong>-System Storage<br />
<br />
-<br />
<br />
system ( <strong>and</strong> <strong>and</strong> <br />
-<br />
<br />
). The principal areas of historical<br />
<br />
. <br />
-<br />
<br />
<br />
<br />
<br />
<br />
<br />
-<br />
<br />
-<br />
<br />
<br />
<br />
<br />
<br />
<br />
<br />
<br />
<br />
<br />
-
68 Groundwater Availability of the <strong>Central</strong> <strong>Valley</strong> <strong>Aquifer</strong>, California<br />
A<br />
S a c r a m e n t o V a l l e y<br />
0 50 100 Miles<br />
0 50 100 Kilometers<br />
Shaded relief derived from U.S. Geological Survey<br />
National Elevation Dataset, 2006. Albers Equal Area Conic Projection<br />
Delta<br />
S a n J o a q u i n V a l l e y<br />
EXPLANATION<br />
Estimated change in hydraulic head,<br />
predevelopment to 1961, in feet—<br />
Rise of 0 to 40<br />
Decline from 0 to 40<br />
Decline from 40 to 80<br />
Decline from 80 to 120<br />
Decline from 120 to 200<br />
Decline from 200 to 300<br />
Decline from 300 to 400<br />
Decline of more than 400<br />
<strong>Central</strong> <strong>Valley</strong> boundary<br />
Water-balance subregion<br />
Tulare<br />
Basin<br />
Figure B4. A, Estimated change in hydraulic head in upper part of the aquifer system from 1860 to 1961 (modified from Williamson <strong>and</strong><br />
others, 1989; Bertoldi <strong>and</strong> others, 1991). B, Simulated change in hydraulic head in lower part of the aquifer system from spring 1962 to<br />
spring 2003.
B<br />
01_01645<br />
03b06329<br />
02_05172<br />
04_07807<br />
06b12975<br />
06_14809<br />
Delta<br />
07_13870<br />
0 50 100 Miles<br />
0 50 100 Kilometers<br />
Shaded relief derived from U.S. Geological Survey<br />
National Elevation Dataset, 2006. Albers Equal Area Conic Projection<br />
Figure B4. Continued.<br />
05_10854<br />
08_14958<br />
09_19824<br />
11_21412<br />
10_25517<br />
12_22972<br />
14_28350<br />
Development <strong>and</strong> Changes to the Hydrologic Budget 69<br />
13_25144<br />
14_30806<br />
15_29737<br />
Simulated change in hydraulic head,<br />
1961 to 2003, in feet—<br />
11_21412<br />
16_30057<br />
15_34255<br />
18_33084<br />
19_37289<br />
19_38742<br />
EXPLANATION<br />
Tulare<br />
Basin<br />
Rise of greater than 400<br />
Rise of 300 to 400<br />
Rise of 200 to 300<br />
Rise of 120 to 200<br />
Rise of 80 to 120<br />
Rise of 40 to 80<br />
Rise of 0 to 40<br />
Decline from 0 to 40<br />
Decline from 40 to 80<br />
Decline from 80 to 120<br />
Decline from 120 to 200<br />
Decline from 200 to 300<br />
Decline from 300 to 400<br />
<strong>Central</strong> <strong>Valley</strong> boundary<br />
Water-balance subregion<br />
Hydrograph well <strong>and</strong> identifier<br />
See figure 13 for hydrographs<br />
20_37212
70 Groundwater Availability of the <strong>Central</strong> <strong>Valley</strong> <strong>Aquifer</strong>, California<br />
<br />
<br />
<br />
<br />
<br />
<br />
<br />
<br />
<br />
<br />
<br />
<br />
-<br />
-<br />
<br />
<br />
aquifer system.<br />
<br />
-<br />
<br />
<br />
<br />
<br />
<br />
<br />
<br />
<br />
<br />
<br />
<br />
<br />
<br />
<br />
permanent compaction <strong>and</strong> l<strong>and</strong> subsidence, can accompany<br />
<br />
<br />
<br />
-<br />
<br />
<br />
This is discussed in more detail in the section of this report<br />
entitled “.”<br />
<br />
<br />
<strong>and</strong><br />
<strong>and</strong> <br />
).<br />
<br />
1.4 million acre-ft. In dry years, about 9.0 million acre-ft of<br />
<br />
).<br />
<br />
<br />
<br />
Intra-Annual Variations in Typical, Dry, <strong>and</strong> Wet<br />
Years<br />
<br />
<br />
-<br />
-<br />
),<br />
<br />
<br />
<br />
<br />
().<br />
<br />
<br />
<br />
(<br />
<br />
<br />
<br />
-<br />
<br />
-<br />
<br />
<br />
<br />
<br />
<br />
<br />
<br />
<br />
(<br />
-<br />
<br />
<br />
<br />
<br />
Water pumped from the aquifer system may not be<br />
<br />
-<br />
<br />
from precipitation <strong>and</strong> streams. In other areas, replenishment<br />
<br />
<br />
<br />
<br />
<br />
<br />
<br />
<br />
).
NET MONTHLY CHANGE IN GROUNDWATER BUDGET, IN MILLIONS OF ACRE-FEET PER YEAR<br />
5<br />
4<br />
3<br />
2<br />
1<br />
0<br />
-1<br />
-2<br />
-3<br />
-4<br />
-5<br />
5<br />
4<br />
3<br />
2<br />
1<br />
0<br />
-1<br />
-2<br />
-3<br />
-4<br />
-5<br />
25<br />
20<br />
15<br />
10<br />
5<br />
0<br />
-5<br />
Typical Year - 1975<br />
OCT NOV DEC JAN FEB MAR APR MAY JUN JUL AUG SEP<br />
Dry Year - 1990<br />
OCT NOV DEC JAN FEB MAR APR MAY JUN JUL AUG SEP<br />
Wet Year - 1998 (Note scale change)<br />
OCT NOV DEC JAN FEB MAR APR MAY JUN JUL AUG SEP<br />
MONTH<br />
Development <strong>and</strong> Changes to the Hydrologic Budget 71<br />
Figure B5. Monthly groundwater budget for the <strong>Central</strong> <strong>Valley</strong> for a dry year (1990), typical year (1975), <strong>and</strong> wet year (1998). Values are<br />
relative to water availability. Hence, an increase in storage is shown as a positive value.<br />
A<br />
B<br />
C<br />
EXPLANATION<br />
Net groundwater budget<br />
Specific yield <strong>and</strong><br />
compressibility of water<br />
Elastic <strong>and</strong> inelastic<br />
matrix storage<br />
Groundwater recharge from<br />
l<strong>and</strong>scape<br />
Stream interaction<br />
Pumpage
72 Groundwater Availability of the <strong>Central</strong> <strong>Valley</strong> <strong>Aquifer</strong>, California<br />
Temporal Variation in the Hydrologic Budget<br />
<br />
-<br />
<br />
<br />
<br />
<br />
tation<br />
(<br />
the same climatic pattern as the precipitation (<br />
<br />
<br />
<br />
<br />
<strong>and</strong><br />
). -<br />
-<br />
<br />
<br />
<br />
<br />
<br />
<br />
<br />
<br />
). This partly is a result of an<br />
<br />
<br />
<br />
<br />
<br />
<br />
<br />
<br />
<br />
<br />
(<br />
<br />
<br />
-<br />
<br />
<br />
<br />
<br />
<br />
<br />
<br />
<br />
<br />
<br />
<br />
<br />
<br />
<br />
<br />
<br />
<br />
-<br />
<br />
<br />
<br />
<br />
<br />
<br />
-<br />
<br />
<br />
( <strong>and</strong> <br />
<br />
<br />
-<br />
<br />
<br />
<br />
<br />
<br />
<br />
-<br />
<br />
( <strong>and</strong> <br />
<br />
<br />
<br />
<br />
<br />
<br />
<br />
<br />
<strong>and</strong> <br />
<br />
<br />
-<br />
<br />
(<br />
-<br />
<br />
-<br />
<br />
<br />
<br />
<br />
).
A<br />
MILLIONS OF ACRE-FEET PER YEAR<br />
30<br />
25<br />
20<br />
15<br />
10<br />
5<br />
0<br />
Figure C8<br />
4/61-3/68<br />
"Variable"<br />
to<br />
Dry<br />
Representative water year<br />
Figure C9<br />
4/68-3/78<br />
"Variable"<br />
to<br />
Wet<br />
<br />
<br />
<br />
<br />
<br />
<br />
<br />
Time frame l<strong>and</strong>-use maps were applied, from Chapter C<br />
Typical<br />
Development <strong>and</strong> Changes to the Hydrologic Budget 73<br />
Figure C10<br />
4/78-3/93<br />
Dry Wet Dry<br />
Wet<br />
Agricultural pumping<br />
WATER YEAR<br />
EXPLANATION<br />
Surface-water deliveries<br />
Delivery requirement<br />
L<strong>and</strong>scape recharge<br />
Figure C11<br />
4/93-3/99<br />
Dry Wet<br />
Figure C12<br />
4/99-9/03<br />
"Variable"<br />
to<br />
Dry<br />
1962 1964 1966 1968 1970 1972 1974 1976 1978 1980 1982 1984 1986 1988 1990 1992 1994 1996 1998 2000 2002<br />
Figure B6. A, Annual delivery requirement, l<strong>and</strong>scape recharge, surface-water deliveries, <strong>and</strong> agricultural pumpage. B, Annual<br />
groundwater withdrawals for agricultural <strong>and</strong> urban use for the entire <strong>Central</strong> <strong>Valley</strong> between 1962 <strong>and</strong> 2003. Other than urban<br />
pumpage, all values are simulated by the <strong>Central</strong> <strong>Valley</strong> Hydrologic Model (CVHM) (). Urban pumpage compiled by California<br />
Department of Water Resources (C. Brush, California Department of Water Resources, written commun., February 21, 2007).<br />
represents a steady increase from less than 5 percent in 1962 to<br />
-<br />
<br />
<br />
urban uses ( <strong>and</strong> <strong>and</strong> ).
74 Groundwater Availability of the <strong>Central</strong> <strong>Valley</strong> <strong>Aquifer</strong>, California<br />
B<br />
SIMULATED PUMPAGE, IN MILLIONS OF ACRE-FEET PER YEAR<br />
20<br />
15<br />
10<br />
5<br />
"Variable"<br />
to<br />
Dry<br />
"Variable"<br />
to<br />
Wet<br />
<br />
<br />
system. <br />
<br />
-<br />
<br />
<br />
<br />
<br />
<br />
<strong>and</strong> inelastic compaction. <br />
<br />
<br />
<br />
<strong>and</strong> <br />
Dry Wet<br />
Dry<br />
Wet<br />
"Variable"<br />
to<br />
Dry<br />
0<br />
1962 1964 1966 1968 1970 1972 1974 1976 1978 1980 1982 1984 1986 1988 1990 1992 1994 1996 1998 2000 2002<br />
Figure B6. Continued.<br />
WATER YEAR<br />
EXPLANATION<br />
Simulated pumpage—<br />
Total<br />
Urban<br />
Agricultural<br />
<br />
<br />
<br />
<br />
<br />
<br />
<br />
( <strong>and</strong> <br />
<br />
<br />
<br />
-<br />
<strong>and</strong> ).
ANNUAL CHANGE IN GROUNDWATER AVAILABILITY, IN MILLIONS OF ACRE-FEET PER YEAR<br />
30<br />
20<br />
10<br />
0<br />
-10<br />
-20<br />
-30<br />
"Variable"<br />
to<br />
Dry<br />
<br />
mal<br />
precipitation () (fourth driest <strong>and</strong> the driest year<br />
<br />
<br />
<br />
<br />
<br />
-<br />
<br />
Development <strong>and</strong> Changes to the Hydrologic Budget 75<br />
Period of<br />
Period of growth of water supplies Period of abundance Period of reduced supplies<br />
drought<br />
Representative water year<br />
"Variable"<br />
to<br />
Wet<br />
Typical<br />
Available water resources<br />
Dry Wet Dry<br />
Wet<br />
WATER YEAR<br />
EXPLANATION<br />
Net groundwater budget<br />
Dry<br />
Wet<br />
"Variable"<br />
to<br />
Dry<br />
1962 1964 1966 1968 1970 1972 1974 1976 1978 1980 1982 1984 1986 1988 1990 1992 1994 1996 1998 2000 2002<br />
Specific yield <strong>and</strong><br />
compressibility of water<br />
Groundwater flow<br />
to Delta<br />
Elastic <strong>and</strong> inelastic<br />
matrix storage<br />
Stream interaction<br />
L<strong>and</strong>scape recharge<br />
Pumpage<br />
Figure B7. Simulated groundwater budget changes between water years 1962 <strong>and</strong> 2003 for the <strong>Central</strong> <strong>Valley</strong>, California.<br />
<br />
(
76 Groundwater Availability of the <strong>Central</strong> <strong>Valley</strong> <strong>Aquifer</strong>, California<br />
NET ANNUAL CHANGE IN STORAGE, IN MILLIONS OF ACRE-FEET PER YEAR<br />
15<br />
10<br />
5<br />
0<br />
-5<br />
-10<br />
-15<br />
"Variable"<br />
to<br />
Dry<br />
Representative water year<br />
"Variable"<br />
to<br />
Wet<br />
Typical<br />
Figure B8. Simulated annual changes in aquifer-system storage between water years 1962 <strong>and</strong> 2003 for the <strong>Central</strong> <strong>Valley</strong>, California.<br />
<br />
-<br />
).<br />
<br />
<br />
<br />
<br />
<br />
<br />
<br />
<br />
<br />
<br />
<br />
Dry Wet Dry<br />
Wet<br />
WATER YEAR<br />
EXPLANATION<br />
Dry Wet<br />
"Variable"<br />
to<br />
Dry<br />
1962 1964 1966 1968 1970 1972 1974 1976 1978 1980 1982 1984 1986 1988 1990 1992 1994 1996 1998 2000 2002<br />
Specific yield <strong>and</strong><br />
compressibility of water<br />
Elastic <strong>and</strong> inelastic<br />
matrix storage<br />
<br />
).<br />
<br />
<br />
<br />
<br />
-<br />
<br />
<br />
<br />
<strong>and</strong> -
CUMULATIVE CHANGE IN GROUNDWATER STORAGE, IN MILLIONS OF ACRE-FEET<br />
20<br />
0<br />
-20<br />
-40<br />
-60<br />
-80<br />
"Variable"<br />
to<br />
Dry<br />
Representative water year<br />
"Variable"<br />
to<br />
Wet<br />
Typical<br />
<br />
-<br />
<br />
<strong>and</strong> <br />
<br />
<br />
<br />
-<br />
<br />
<br />
<strong>and</strong><br />
, , <strong>and</strong> <br />
<br />
acre-ft in the mid-1990s ().<br />
Dry<br />
Development <strong>and</strong> Changes to the Hydrologic Budget 77<br />
Wet Wet<br />
WATER YEAR<br />
EXPLANATION<br />
Dry<br />
Dry Wet<br />
"Variable"<br />
to<br />
Dry<br />
1962 1964 1966 1968 1970 1972 1974 1976 1978 1980 1982 1984 1986 1988 1990 1992 1994 1996 1998 2000 2002<br />
Sacramento<br />
<strong>Central</strong> <strong>Valley</strong> Overall<br />
By region<br />
Delta <strong>and</strong> Eastside Streams<br />
San Joaquin Basin<br />
Tulare Basin<br />
Figure B9. Simulated cumulative annual changes in aquifer-system storage between water years 1962 <strong>and</strong> 2003 for the <strong>Central</strong> <strong>Valley</strong>,<br />
California.<br />
<br />
-<br />
<br />
<br />
-<br />
<br />
<br />
<br />
<br />
<br />
<br />
about 5.7 million acre-ft/yr (<br />
-
78 Groundwater Availability of the <strong>Central</strong> <strong>Valley</strong> <strong>Aquifer</strong>, California<br />
Table B3. Selected average annual hydrologic budget components for water years 1962–2003 for each of the 21 water balance areas<br />
in the <strong>Central</strong> <strong>Valley</strong>, California.<br />
<br />
Water-balance subregion<br />
Area<br />
(square<br />
miles)<br />
Net storage<br />
from spe-<br />
cific yield <strong>and</strong><br />
compressibility<br />
of<br />
water 1<br />
Net elastic<br />
<strong>and</strong><br />
inelastic storage<br />
1<br />
rates in the simulation period of 3.4 million acre-ft/year in<br />
2001 ( <strong>and</strong> <br />
<br />
-<br />
<br />
<br />
<strong>and</strong> <br />
<br />
<br />
<br />
<br />
-<br />
<br />
<br />
<br />
Net<br />
stream<br />
leakage 2<br />
Net<br />
pumpage<br />
Net<br />
recharge<br />
from l<strong>and</strong>scape<br />
3<br />
Precip-<br />
itation<br />
Evapo-<br />
trans-<br />
piration<br />
Surface-<br />
water<br />
deliveries<br />
1 611 36,000 13,000 45,000 453,000 1,063,000 547,000 46,000<br />
2 1,163 23,000 557,000 768,000 1,496,000 1,269,000 129,000<br />
3 1,112 3,000 49,000 508,000 1,125,000 1,300,000 717,000<br />
4 560 0 6,000 562,000 635,000 78,000<br />
5 957 65,000 466,000 1,200,000 1,101,000 439,000<br />
6 1,044 10,000 34,000 506,000 522,000 1,137,000 1,315,000 329,000<br />
7 534 2,000 4,000 186,000 222,000 590,000 512,000 172,000<br />
Sacramento <strong>Valley</strong> 5,981 –99,000 52,000 1,348,000 1,414,000 2,920,000 7,173,000 6,6799,000 1,910,000<br />
Eastside Streams (8) 1,362 –26,000 7,000 95,000 850,000 721,000 1,365,000 1,444,000 205,000<br />
Delta (9) 1,026 –218,000 3,000 705,000 467,000 –200,000 975,000 1,603,000 64,000<br />
10 1,083 29,000 64,000 60,000 89,000 588,000 1,465,000 983,000<br />
11 664 0 85,000 251,000 509,000 901,000 643,000<br />
12 540 1,000 39,000 45,000 131,000 384,000 702,000 440,000<br />
13 1,648 43,000 67,000 163,000 754,000 474,000 1,092,000 2,233,000 936,000<br />
San Joaquin Basin 3,935 –70,000 97,000 168,000 944,000 945,000 2,573,000 5,301,000 3,002,000<br />
14 1,071 179,000 165,000 6,000 934,000 418,000 432,000 1,631,000 716,000<br />
15 1,423 26,000 146,000 239,000 1,603,000 708,000 607,000 2,225,000 757,000<br />
16 478 89,000 35,000 33,000 202,000 212,000 299,000 518,000 358,000<br />
17 569 54,000 28,000 170,000 445,000 348,000 358,000 852,000 442,000<br />
18 1,358 158,000 198,000 104,000 1,135,000 710,000 715,000 2,237,000 821,000<br />
19 1,365 85,000 133,000 0 754,000 334,000 494,000 1,275,000 367,000<br />
20 705 74,000 92,000 19,000 252,000 240,000 295,000 892,000 610,000<br />
21 1,105 83,000 81,000 130,000 324,000 272,000 414,000 1,333,000 1,096,000<br />
Tulare Basin 8,074 748,000 878,000 701,000 5,649,000 3,188,000 3,614,000 10,963,000 5,167,000<br />
Total 20,378 300,000 1,000,000 300,000 9,300,000 7,600,000 15,700,000 25,900,000 10,300,000<br />
1 <br />
<br />
2 <br />
<br />
3 <br />
<br />
<br />
<br />
system ( <strong>and</strong> ).<br />
<br />
<br />
<br />
declines (<br />
<br />
<br />
<br />
<br />
<br />
indicates a net loss of 57.7 million acre-ft from aquifer-system<br />
, ).
Spatial Variation in the Hydrologic Budget<br />
tially<br />
( <strong>and</strong> , <strong>and</strong> <br />
<br />
<br />
(<br />
<br />
<br />
<br />
<br />
<br />
<br />
-<br />
<br />
<br />
<br />
-<br />
<br />
<br />
<br />
<br />
<br />
<br />
<br />
( <strong>and</strong><strong>and</strong><br />
<br />
<br />
-<br />
<br />
<br />
() ( <strong>and</strong> <br />
<br />
<br />
( <strong>and</strong> <strong>and</strong> <br />
<br />
<br />
<br />
<br />
<strong>and</strong> ). In the mid-1970s, there<br />
<br />
<br />
-<br />
<br />
<br />
<br />
<br />
.<br />
Development <strong>and</strong> Changes to the Hydrologic Budget 79<br />
Water Levels <strong>and</strong> Groundwater Flow<br />
<br />
<br />
<br />
<br />
<br />
<br />
<br />
<br />
<br />
<br />
<br />
-<br />
<br />
<br />
<br />
-<br />
<br />
<br />
<br />
<br />
<br />
<br />
<br />
-<br />
<br />
<br />
<br />
<br />
<br />
<br />
-<br />
-<br />
<br />
<br />
<br />
<br />
<br />
<br />
<br />
tions<br />
(
80 Groundwater Availability of the <strong>Central</strong> <strong>Valley</strong> <strong>Aquifer</strong>, California<br />
A<br />
3%<br />
21%<br />
MILLIONS OF ACRE-FEET<br />
Sacramento<br />
45%<br />
MILLIONS OF ACRE-FEET<br />
1.0<br />
0.5<br />
0.0<br />
-0.5<br />
-1.0<br />
MILLIONS OF ACRE-FEET<br />
5% 0%0%<br />
1.0<br />
0.5<br />
0.0<br />
-0.5<br />
-1.0<br />
26%<br />
1.0<br />
0.5<br />
0.0<br />
-0.5<br />
-1.0<br />
MILLIONS OF ACRE-FEET<br />
4<br />
3<br />
2<br />
1<br />
0<br />
-1<br />
-2<br />
-3<br />
-4<br />
-5<br />
-0.29<br />
0 50 100 Miles<br />
0 50 100 Kilometers<br />
Shaded relief derived from U.S. Geological Survey<br />
National Elevation Dataset, 2006. Albers Equal Area Conic Projection<br />
2<br />
1<br />
3<br />
0<br />
MILLIONS OF ACRE-FEET<br />
1.0<br />
0.5<br />
0.0<br />
-0.5<br />
-1.0<br />
-0.03<br />
-1.66<br />
1<br />
2<br />
3<br />
2.88<br />
6<br />
4<br />
-1.37<br />
5<br />
6<br />
7<br />
MILLIONS OF ACRE-FEET<br />
-0.18<br />
1.0<br />
0.5<br />
0.0<br />
-0.5<br />
-1.0<br />
MILLIONS OF ACRE-FEET<br />
EXPLANATION<br />
Net annual groundwater budget,<br />
water years 1962-2003<br />
Specific yield <strong>and</strong><br />
compressibility of water<br />
Flow of groundwater<br />
to Delta<br />
Elastic <strong>and</strong> inelastic<br />
matrix storage<br />
Stream interaction<br />
L<strong>and</strong>scape recharge<br />
MILLIONS OF ACRE-FEET<br />
1.0<br />
0.5<br />
0.0<br />
-0.5<br />
-1.0<br />
1<br />
1.0<br />
0.5<br />
0.0<br />
-0.5<br />
-1.0<br />
Pumpage<br />
Flow between regions or<br />
water-balance subregion<br />
<strong>Central</strong> <strong>Valley</strong> boundary<br />
Water-balance subregion<br />
boundary <strong>and</strong> identifier<br />
Figure B10. Average annual groundwater budget for the A, Sacramento <strong>Valley</strong>. B, Delta <strong>and</strong> Eastside Streams. C, San Joaquin <strong>Valley</strong>.<br />
D, Tulare Basin. Schematic bar charts of average annual groundwater budget for the 21 water-balance subregions (WBSs) in the<br />
<strong>Central</strong> <strong>Valley</strong> also are shown.<br />
4<br />
7<br />
5
B<br />
MILLIONS OF ACRE-FEET<br />
Delta <strong>and</strong><br />
Eastside Streams<br />
1.0<br />
0.5<br />
45%<br />
2%<br />
13%<br />
3%<br />
26%<br />
11%<br />
0%<br />
MILLIONS OF ACRE-FEET<br />
4<br />
3<br />
2<br />
1<br />
0<br />
-1<br />
-2<br />
-3<br />
-4<br />
-5<br />
0.05<br />
-0.09<br />
9<br />
0.0 0.5<br />
-0.5<br />
-1.0<br />
0 50 100 Miles<br />
0 50 100 Kilometers<br />
Shaded relief derived from U.S. Geological Survey<br />
National Elevation Dataset, 2006. Albers Equal Area Conic Projection<br />
Figure B10. Continued.<br />
9<br />
0.00<br />
0.65<br />
8<br />
Development <strong>and</strong> Changes to the Hydrologic Budget 81<br />
0.28<br />
-1.12<br />
0.32<br />
MILLIONS OF ACRE-FEET<br />
1.0<br />
0.0<br />
-0.5<br />
-1.0<br />
EXPLANATION<br />
Net annual groundwater budget,<br />
water years 1962-2003<br />
8<br />
Specific yield <strong>and</strong><br />
compressibility of water<br />
Flow of groundwater<br />
to Delta<br />
Elastic <strong>and</strong> inelastic<br />
matrix storage<br />
Stream interaction<br />
L<strong>and</strong>scape recharge<br />
Pumpage<br />
Flow between regions or<br />
water-balance subregion<br />
<strong>Central</strong> <strong>Valley</strong> boundary<br />
Water-balance subregion<br />
boundary <strong>and</strong> identifier<br />
8
82 Groundwater Availability of the <strong>Central</strong> <strong>Valley</strong> <strong>Aquifer</strong>, California<br />
C<br />
MILLIONS OF ACRE-FEET<br />
MILLIONS OF ACRE-FEET<br />
13%<br />
37%<br />
1.0<br />
0.5<br />
0.0<br />
-0.5<br />
-1.0<br />
1.0<br />
0.5<br />
0.0<br />
-0.5<br />
-1.0<br />
San Joaquin<br />
3%<br />
0%<br />
1% 2%<br />
44%<br />
Figure B10. Continued.<br />
MILLIONS MILLIONS OF OF ACRE-FEET<br />
ACRE-FEET<br />
4<br />
33<br />
22<br />
11<br />
00<br />
-1 -1<br />
-2 -2<br />
-3 -3<br />
-4 -4<br />
-5 -5<br />
-0.04<br />
0 50 100 Miles<br />
11<br />
10<br />
0 50 100 Kilometers<br />
Shaded relief derived from U.S. Geological Survey<br />
National Elevation Dataset, 2006. Albers Equal Area Conic Projection<br />
0<br />
11<br />
-0.02<br />
12<br />
10<br />
0.04<br />
13<br />
0.71<br />
-0.60<br />
MILLIONS OF ACRE-FEET<br />
1.0<br />
0.5<br />
0.0<br />
-0.5<br />
-1.0<br />
-0.21<br />
MILLIONS OF ACRE-FEET<br />
EXPLANATION<br />
Net annual groundwater budget,<br />
water years 1962-2003<br />
1.0<br />
0.5<br />
0.0<br />
-0.5<br />
-1.0<br />
11<br />
Specific yield <strong>and</strong><br />
compressibility of water<br />
Flow of groundwater<br />
to Delta<br />
Elastic <strong>and</strong> inelastic<br />
matrix storage<br />
Stream interaction<br />
L<strong>and</strong>scape recharge<br />
Pumpage<br />
Flow between regions or<br />
water-balance subregion<br />
<strong>Central</strong> <strong>Valley</strong> boundary<br />
Water-balance subregion<br />
boundary <strong>and</strong> identifier<br />
12<br />
13
D<br />
MILLIONS OF ACRE-FEET<br />
1.0<br />
0.5<br />
0.0<br />
-0.5<br />
-1.0<br />
50%<br />
MILLIONS OF ACRE-FEET<br />
1%<br />
MILLIONS OF ACRE-FEET<br />
Tulare<br />
1.0<br />
0.5<br />
0.0<br />
-0.5<br />
-1.0<br />
-1.5<br />
1.0<br />
0.5<br />
0.0<br />
-0.5<br />
-1.0<br />
8%<br />
31%<br />
Figure B10. Continued.<br />
0%<br />
5%<br />
5%<br />
19<br />
MILLIONS OF ACRE-FEET<br />
MILLIONS OF ACRE-FEET<br />
4<br />
3<br />
2<br />
1<br />
0<br />
-1<br />
-2<br />
-3<br />
-4<br />
-5<br />
-6<br />
1.0<br />
0.5<br />
0.0<br />
-0.5<br />
-1.0<br />
-0.88<br />
Shaded relief derived from U.S. Geological Survey<br />
National Elevation Dataset, 2006. Albers Equal Area Conic Projection<br />
15<br />
14<br />
0<br />
-0.49<br />
14<br />
21<br />
0.50<br />
16<br />
15<br />
MILLIONS OF ACRE-FEET<br />
Development <strong>and</strong> Changes to the Hydrologic Budget 83<br />
19<br />
1.0<br />
0.5<br />
0.0<br />
-0.5<br />
-1.0<br />
3.26<br />
17<br />
18<br />
-5.20<br />
20<br />
21<br />
0.06<br />
MILLIONS OF ACRE-FEET<br />
1.0<br />
0.5<br />
0.0<br />
-0.5<br />
-1.0<br />
20<br />
EXPLANATION<br />
Net annual groundwater budget,<br />
water years 1962-2003<br />
Specific yield <strong>and</strong><br />
compressibility of water<br />
Flow of groundwater<br />
to Delta<br />
Elastic <strong>and</strong> inelastic<br />
matrix storage<br />
Stream interaction<br />
L<strong>and</strong>scape recharge<br />
MILLIONS OF ACRE-FEET<br />
MILLIONS OF ACRE-FEET<br />
15<br />
1.0<br />
0.5<br />
0.0<br />
-0.5<br />
-1.0<br />
1.0<br />
0.5<br />
0.0<br />
-0.5<br />
-1.0<br />
Pumpage<br />
Flow between regions or<br />
water-balance subregion<br />
<strong>Central</strong> <strong>Valley</strong> boundary<br />
Water-balance subregion<br />
boundary <strong>and</strong> identifier<br />
16<br />
17<br />
18
84 Groundwater Availability of the <strong>Central</strong> <strong>Valley</strong> <strong>Aquifer</strong>, California<br />
<br />
depth of permeable aquifer material <strong>and</strong> by the quality of the<br />
<br />
<br />
<br />
<br />
<br />
-<br />
<br />
-<br />
<br />
-<br />
<br />
<br />
<br />
<br />
<br />
<br />
NET ANNUAL PUMPAGE AND FLOW THROUGH MULTI-NODE WELLS,<br />
IN MILLIONS OF ACRE-FEET PER YEAR<br />
1.0<br />
0<br />
-1.0<br />
-2.0<br />
-3.0<br />
-4.0<br />
"Variable"<br />
to Dry<br />
Representative water year<br />
Figure B11. Simulated flow through multi-zone wells.<br />
<br />
<br />
<br />
unit (-<br />
<br />
<br />
<br />
<br />
<br />
<br />
<br />
<br />
<br />
<br />
2 (Williamson <strong>and</strong> others, 1989). If<br />
<br />
<br />
"Variable"<br />
to Wet Dry Wet Dry<br />
Wet<br />
Typical<br />
WATER YEAR<br />
Dry Wet<br />
"Variable"<br />
to Dry<br />
-5.0<br />
1962 1964 1966 1968 1970 1972 1974 1976 1978 1980 1982 1984 1986 1988 1990 1992 1994 1996 1998 2000 2002<br />
EXPLANATION<br />
Intra-borehole flow<br />
Pumpage
-<br />
<br />
<br />
<br />
-<br />
<br />
<br />
<br />
<br />
(-<br />
<br />
<br />
<br />
-<br />
<br />
<br />
-<br />
<br />
<br />
<br />
<br />
<br />
<br />
<br />
<br />
). The<br />
<br />
<br />
<br />
this study (-<br />
<br />
-<br />
<br />
<br />
conditions. When compared, these potentiometric-surface<br />
<br />
<br />
<br />
<br />
time .<br />
<br />
-<br />
-<br />
<br />
<br />
<br />
<br />
<br />
().<br />
Development <strong>and</strong> Changes to the Hydrologic Budget 85<br />
<br />
<br />
-<br />
<br />
-<br />
<br />
-<br />
<br />
(<br />
<br />
<br />
<br />
<br />
<br />
<br />
,<br />
<br />
<br />
remain fairly constant<br />
-<br />
<strong>and</strong> ).<br />
-<br />
-<br />
). In addition,<br />
<br />
<br />
<br />
<br />
<br />
2003 <strong>and</strong> <br />
, ,<br />
<strong>and</strong> )<br />
<br />
<br />
<br />
<br />
<br />
<br />
<br />
<br />
-<br />
<br />
). The<br />
<br />
.
86 Groundwater Availability of the <strong>Central</strong> <strong>Valley</strong> <strong>Aquifer</strong>, California<br />
A<br />
700<br />
500<br />
400<br />
320<br />
360<br />
280<br />
120<br />
240<br />
120<br />
160<br />
0<br />
0 50 100 Miles<br />
80<br />
200<br />
40<br />
0 50 100 Kilometers<br />
Shaded relief derived from U.S. Geological Survey<br />
National Elevation Dataset, 2006. Albers Equal Area Conic Projection<br />
40<br />
120<br />
0<br />
160<br />
40<br />
120<br />
120<br />
120<br />
120<br />
80<br />
240<br />
120<br />
80<br />
200<br />
240<br />
160<br />
200<br />
120<br />
500<br />
600<br />
200<br />
320<br />
200<br />
280<br />
400<br />
EXPLANATION<br />
Spring 1961<br />
Water-level altitude<br />
(from Williamson <strong>and</strong> others, 1989),<br />
in feet above NGVD 29—<br />
240<br />
360<br />
280<br />
400<br />
320<br />
320<br />
160<br />
360<br />
280<br />
320<br />
280<br />
0<br />
1 to 50<br />
51 to 100<br />
101 to 200<br />
201 to 400<br />
401 to 800<br />
<strong>Central</strong> <strong>Valley</strong> boundary<br />
Major streams <strong>and</strong> canals<br />
Direction of flow<br />
Figure B12. Altitude of the A, Water table in the unconfined part of the aquifer system (Williamson <strong>and</strong> others, 1989). B, Potentiometric surface of the confined<br />
part of the aquifer system for 1961 (Williamson <strong>and</strong> others, 1989). C, Unconfined part of the aquifer system (Williamson <strong>and</strong> others, 1989). D, Potentiometric<br />
surface of the confined part of the aquifer system for 1976 (Williamson <strong>and</strong> others, 1989. E, Unconfined part of the aquifer system (simulated, ).<br />
F, Potentiometric surface of the confined part of the aquifer system, for 2000 (simulated, ).<br />
400<br />
240<br />
360<br />
360<br />
400<br />
320<br />
500
B<br />
Figure B12. Continued.<br />
600<br />
400<br />
320<br />
240<br />
280<br />
200<br />
80<br />
160<br />
120<br />
120<br />
80<br />
40<br />
40<br />
120<br />
40<br />
0<br />
40<br />
0 50 100 Miles<br />
0 50 100 Kilometers<br />
Shaded relief derived from U.S. Geological Survey<br />
National Elevation Dataset, 2006. Albers Equal Area Conic Projection<br />
80<br />
0<br />
160<br />
80<br />
40<br />
120<br />
80<br />
80<br />
-80<br />
80<br />
-160<br />
Development <strong>and</strong> Changes to the Hydrologic Budget 87<br />
-120<br />
-160<br />
400<br />
40<br />
0<br />
0<br />
240<br />
-80<br />
160<br />
-40<br />
280<br />
500<br />
400<br />
160<br />
500<br />
280<br />
-40<br />
EXPLANATION<br />
320<br />
Spring 1961<br />
Potentiometric surface of the lower part of the<br />
aquifer system (from Williamson <strong>and</strong> others, 1989),<br />
in feet above NGVD 29—<br />
360<br />
120<br />
280<br />
280<br />
320<br />
-200 to -100<br />
-99 to 0<br />
240<br />
200<br />
1 to 100<br />
101 to 250<br />
251 to 500<br />
501 to 750<br />
<strong>Central</strong> <strong>Valley</strong> boundary<br />
Major streams <strong>and</strong> canals<br />
Direction of flow<br />
240<br />
200<br />
280<br />
160<br />
280<br />
280<br />
240<br />
160<br />
280
88 Groundwater Availability of the <strong>Central</strong> <strong>Valley</strong> <strong>Aquifer</strong>, California<br />
C<br />
Figure B12. Continued.<br />
600<br />
500<br />
240<br />
400<br />
280<br />
200<br />
80<br />
160<br />
40<br />
120<br />
0<br />
120<br />
40<br />
0<br />
0 50 100 Miles<br />
0 50 100 Kilometers<br />
Shaded relief derived from U.S. Geological Survey<br />
National Elevation Dataset, 2006. Albers Equal Area Conic Projection<br />
120<br />
40<br />
80<br />
120<br />
160<br />
240<br />
120 320<br />
80<br />
200<br />
320<br />
400<br />
700<br />
320<br />
200<br />
280 240<br />
EXPLANATION<br />
Spring 1976<br />
Water-level altitude<br />
(from Williamson <strong>and</strong> others, 1989),<br />
in feet above NGVD 29—<br />
320<br />
160<br />
120<br />
280<br />
240<br />
320<br />
400<br />
320<br />
0<br />
1 to 50<br />
51 to 100<br />
101 to 200<br />
201 to 400<br />
401 to 800<br />
<strong>Central</strong> <strong>Valley</strong> boundary<br />
Major streams <strong>and</strong> canals<br />
Direction of flow<br />
400
D<br />
Figure B12. Continued.<br />
500<br />
400 320<br />
280<br />
240<br />
200<br />
160<br />
80<br />
40<br />
0<br />
40<br />
80<br />
120<br />
120<br />
40<br />
0<br />
-40<br />
-40<br />
0 50 100 Miles<br />
0 50 100 Kilometers<br />
Shaded relief derived from U.S. Geological Survey<br />
National Elevation Dataset, 2006. Albers Equal Area Conic Projection<br />
0<br />
40<br />
80<br />
0<br />
80<br />
40<br />
80<br />
80<br />
120<br />
-40<br />
Development <strong>and</strong> Changes to the Hydrologic Budget 89<br />
-80<br />
240<br />
160 80<br />
-80<br />
400<br />
0<br />
160<br />
-40<br />
0<br />
EXPLANATION<br />
Spring 1976<br />
Potentiometric surface of the lower part<br />
of the aquifer system (from Williamson <strong>and</strong> others, 1989),<br />
in feet above NGVD 29—<br />
40<br />
200<br />
400<br />
-200 to -100<br />
-99 to 0<br />
160<br />
280<br />
200<br />
40<br />
1 to 100<br />
101 to 250<br />
251 to 500<br />
<strong>Central</strong> <strong>Valley</strong> boundary<br />
Major streams <strong>and</strong> canals<br />
Direction of flow<br />
0<br />
200<br />
360<br />
320<br />
280<br />
320<br />
280<br />
200<br />
320<br />
240<br />
160<br />
160<br />
120<br />
80<br />
200
90 Groundwater Availability of the <strong>Central</strong> <strong>Valley</strong> <strong>Aquifer</strong>, California<br />
E<br />
Figure B12. Continued.<br />
480<br />
360<br />
320<br />
120<br />
160<br />
440<br />
280<br />
200<br />
400<br />
160<br />
240<br />
0 50 100 Miles<br />
120<br />
0 50 100 Kilometers<br />
Shaded relief derived from U.S. Geological Survey<br />
National Elevation Dataset, 2006. Albers Equal Area Conic Projection<br />
80<br />
40<br />
80<br />
40<br />
80<br />
80<br />
120<br />
80<br />
160<br />
120<br />
40<br />
120<br />
200<br />
240<br />
160<br />
EXPLANATION<br />
200<br />
Spring 2000<br />
Simulated water-level altitude,<br />
in feet above NGVD 29—<br />
240<br />
240<br />
280<br />
200<br />
80<br />
160<br />
200<br />
40<br />
80<br />
120<br />
160<br />
200<br />
240<br />
280<br />
320<br />
360<br />
400<br />
440<br />
480<br />
<strong>Central</strong> <strong>Valley</strong> boundary<br />
Major streams <strong>and</strong> canals<br />
Direction of flow<br />
120<br />
280
F<br />
Figure B12. Continued.<br />
400<br />
440<br />
360<br />
320<br />
120<br />
120<br />
80<br />
0<br />
440<br />
280<br />
240<br />
200<br />
160<br />
40<br />
0 50 100 Miles<br />
0 50 100 Kilometers<br />
Shaded relief derived from U.S. Geological Survey<br />
National Elevation Dataset, 2006. Albers Equal Area Conic Projection<br />
40<br />
80<br />
Development <strong>and</strong> Changes to the Hydrologic Budget 91<br />
160<br />
120<br />
80<br />
40<br />
0<br />
480<br />
160<br />
240<br />
440<br />
400<br />
120<br />
280<br />
240<br />
80<br />
40<br />
EXPLANATION<br />
Spring 2000<br />
Simulated potentiometric surface of the lower part<br />
of the aquifer system, in feet above NGVD 29—<br />
280<br />
240<br />
200<br />
160<br />
<strong>Central</strong> <strong>Valley</strong> boundary<br />
Major streams <strong>and</strong> canals<br />
120<br />
120<br />
280<br />
80<br />
240<br />
80<br />
200<br />
280<br />
0<br />
40<br />
80<br />
120<br />
160<br />
200<br />
240<br />
280<br />
320<br />
360<br />
400<br />
440<br />
480<br />
Direction of flow<br />
160
92 Groundwater Availability of the <strong>Central</strong> <strong>Valley</strong> <strong>Aquifer</strong>, California<br />
WATER-LEVEL ALTITUDE, IN FEET ABOVE NGVD 29<br />
500<br />
450<br />
400<br />
350<br />
300<br />
250<br />
Layer 2<br />
200<br />
1960 1970 1980 1990 2000<br />
250<br />
200<br />
150<br />
100<br />
50<br />
NGVD<br />
29<br />
Well 01_01645<br />
Note scale change<br />
Well 03b06329<br />
Layer 6<br />
Layer 7<br />
-50<br />
1960 1970 1980 1990 2000<br />
250<br />
200<br />
150<br />
100<br />
50<br />
NGVD<br />
29<br />
Well 05_10854<br />
Layer 1<br />
Layer 2<br />
-50<br />
1960 1970 1980<br />
WATER YEAR<br />
1990 2000<br />
250<br />
200<br />
150<br />
100<br />
NGVD<br />
29<br />
250<br />
200<br />
150<br />
100<br />
50<br />
NGVD<br />
29<br />
EXPLANATION<br />
Well 02_05172<br />
Layer 2<br />
Layer 3<br />
Layer 6<br />
-50<br />
1960 1970 1980 1990 2000<br />
Well 04_07807<br />
Layer 1<br />
Layer 2<br />
-50<br />
1960 1970 1980 1990 2000<br />
250<br />
200<br />
150<br />
100<br />
50<br />
NGVD<br />
29<br />
Well 06_14809<br />
Layer 2<br />
Layer 3<br />
-50<br />
1960 1970 1980<br />
WATER YEAR<br />
1990 2000<br />
L<strong>and</strong>-surface elevation at well Simulated water-level elevation from model for—<br />
Measured head of well<br />
Layer 1<br />
Layer 5<br />
Layer 9<br />
Layer 2<br />
Layer 6<br />
Layer 10<br />
Layer 3<br />
Layer 7<br />
Layer 4<br />
Layer 8<br />
Figure B13. Hydrographs for representative wells in the <strong>Central</strong> <strong>Valley</strong>, California (locations shown in ).<br />
50
WATER-LEVEL ALTITUDE, IN FEET ABOVE NGVD 29<br />
250<br />
200<br />
150<br />
100<br />
50<br />
NGVD<br />
29<br />
250<br />
200<br />
150<br />
100<br />
50<br />
NGVD<br />
29<br />
-50<br />
1960 1970 1980 1990 2000<br />
250<br />
200<br />
150<br />
100<br />
50<br />
NGVD<br />
29<br />
Well 06b12975<br />
Layer 2<br />
Layer 3<br />
Layer 6<br />
Layer 7<br />
-50<br />
1960 1970 1980 1990 2000<br />
Well 08_14958<br />
Layer 2<br />
EXPLANATION<br />
Development <strong>and</strong> Changes to the Hydrologic Budget 93<br />
-50<br />
1960 1970 1980 1990 2000<br />
-50<br />
1960 1970 1980 1990 2000<br />
-50<br />
-50<br />
1960 1970 1980 1990 2000<br />
1960 1970 1980 1990 2000<br />
WATER YEAR WATER YEAR<br />
250<br />
200<br />
150<br />
100<br />
NGVD<br />
29<br />
250<br />
200<br />
150<br />
100<br />
NGVD<br />
29<br />
Well 10_25517 Well 11_21412<br />
Layer 1<br />
Layer 2<br />
Layer 3<br />
Figure B13. Continued.<br />
L<strong>and</strong>-surface elevation at well Simulated water-level elevation from model for—<br />
Measured head of well<br />
Layer 1<br />
Layer 5<br />
Layer 9<br />
Layer 2<br />
Layer 6<br />
Layer 10<br />
Layer 3<br />
Layer 7<br />
Layer 4<br />
Layer 8<br />
50<br />
50<br />
250<br />
200<br />
150<br />
100<br />
50<br />
NGVD<br />
29<br />
Well 07_13870<br />
Layer 2<br />
Well 09_19824<br />
Layer 1<br />
Layer 1<br />
Layer 2<br />
Layer 3<br />
Layer 4<br />
Layer 5<br />
Layer 5
94 Groundwater Availability of the <strong>Central</strong> <strong>Valley</strong> <strong>Aquifer</strong>, California<br />
WATER-LEVEL ALTITUDE, IN FEET ABOVE NGVD 29<br />
250<br />
200<br />
150<br />
100<br />
50<br />
NGVD<br />
29<br />
NGVD<br />
29<br />
-100<br />
250<br />
200<br />
150<br />
100<br />
NGVD<br />
29<br />
1960 1970 1980 1990 2000 1960 1970 1980 1990 2000<br />
50<br />
Well 12_22972<br />
-50<br />
1960 1970 1980 1990 2000<br />
200<br />
100<br />
-200<br />
-300<br />
-400<br />
-500<br />
-600<br />
Layer 1<br />
Layer 2<br />
Well 14_30806<br />
L<strong>and</strong>-surface elevation 266 feet<br />
Note scale change<br />
Well 15_34255<br />
-50<br />
-50<br />
1960 1970 1980 1990 2000<br />
1960 1970 1980 1990 2000<br />
WATER YEAR WATER YEAR<br />
Figure B13. Continued.<br />
Layer 2<br />
Layer 3<br />
Layer 4<br />
Layer 5<br />
Layer 6<br />
Layer 7<br />
Layer 8<br />
Layer 9<br />
Layer 10<br />
250<br />
200<br />
150<br />
100<br />
NGVD<br />
29<br />
250<br />
200<br />
150<br />
100<br />
NGVD<br />
29<br />
EXPLANATION<br />
-50<br />
1960 1970 1980 1990 2000<br />
L<strong>and</strong>-surface elevation at well Simulated water-level elevation from model for—<br />
Measured head of well<br />
Layer 1<br />
Layer 5<br />
Layer 9<br />
Layer 2<br />
Layer 6<br />
Layer 10<br />
Layer 3<br />
Layer 7<br />
Layer 4<br />
Layer 8<br />
50<br />
200<br />
100<br />
NGVD<br />
29<br />
-100<br />
-200<br />
-300<br />
-400<br />
-500<br />
-600<br />
50<br />
Well 13_25144<br />
Layer 6<br />
Layer 7<br />
Well 14_28350<br />
L<strong>and</strong>-surface elevation 348 feet<br />
Note scale change<br />
Well 15_29737<br />
Layer 3<br />
Layer 4<br />
Layer 5<br />
Layer 6<br />
Layer 7<br />
Layer 8<br />
Layer 9<br />
Layer 10<br />
Layer 6<br />
Layer 7
WATER-LEVEL ALTITUDE, IN FEET ABOVE NGVD 29<br />
250<br />
200<br />
150<br />
100<br />
50<br />
NGVD<br />
29<br />
350<br />
300<br />
250<br />
250<br />
200<br />
150<br />
100<br />
50<br />
Well 16_30057<br />
L<strong>and</strong>-surface elevation 213 feet<br />
Layer 3<br />
Layer 4<br />
Layer 5<br />
Layer 6<br />
-50<br />
1960 1970 1980 1990 2000<br />
Well 19_38742<br />
L<strong>and</strong>-surface elevation 269 feet<br />
Layer 2<br />
Layer 3<br />
EXPLANATION<br />
Development <strong>and</strong> Changes to the Hydrologic Budget 95<br />
250<br />
200<br />
150<br />
100<br />
NGVD<br />
29<br />
-50<br />
1960 1970 1980 1990 2000<br />
NGVD<br />
29<br />
50<br />
Well 20_37212<br />
L<strong>and</strong>-surface elevation 590 feet<br />
Note scale change<br />
-50<br />
NGVD 29<br />
1960 1970 1980 1990 2000 1960 1970 1980 1990 2000<br />
WATER YEAR WATER YEAR<br />
L<strong>and</strong>-surface elevation at well Simulated water-level elevation from model for—<br />
Measured head of well<br />
Layer 1<br />
Layer 5<br />
Layer 9<br />
Layer 2<br />
Layer 6<br />
Layer 10<br />
Layer 3<br />
Layer 7<br />
Layer 4<br />
Layer 8<br />
50<br />
Well 18_33084<br />
Layer 5<br />
Layer 6<br />
Layer 7<br />
200<br />
-100<br />
-200<br />
150 Well 18c33884<br />
Note scale change<br />
-300<br />
Layer 3<br />
Layer 4<br />
100<br />
Layer 2<br />
-400<br />
Layer 5<br />
50<br />
NGVD 29<br />
Layer 3<br />
Layer 6<br />
-500<br />
-600<br />
Well 19_37289<br />
L<strong>and</strong>-surface elevation 279 feet<br />
Note scale change<br />
Layer 6<br />
Layer 7<br />
Layer 8<br />
1960 1970 1980 1990 2000 1960 1970 1980 1990 2000<br />
Figure B13. Continued.<br />
200<br />
100<br />
NGVD 29<br />
350<br />
300<br />
250<br />
200<br />
150<br />
100<br />
Layer 6<br />
Layer 7<br />
Layer 8
96 Groundwater Availability of the <strong>Central</strong> <strong>Valley</strong> <strong>Aquifer</strong>, California<br />
100<br />
100<br />
100<br />
50<br />
50<br />
50<br />
100<br />
150<br />
0 50 100 Miles<br />
0 50 100 Kilometers<br />
Shaded relief derived from U.S. Geological Survey<br />
National Elevation Dataset, 2006. Albers Equal Area Conic Projection<br />
Figure B14. Estimated depth to water table in spring 2000.<br />
50<br />
50<br />
100<br />
150<br />
100<br />
100<br />
50<br />
50<br />
100<br />
100<br />
50<br />
150<br />
100<br />
EXPLANATION<br />
Area with depth-to-water<br />
less than 50 feet<br />
<strong>Central</strong> <strong>Valley</strong> boundary<br />
Line of equal depth-to-water,<br />
Spring 2000, in feet.<br />
Contour interval is 50 feet<br />
Depth-to-water, by well,<br />
in feet below l<strong>and</strong> surface<br />
0 to 50<br />
50 to 100<br />
100 to 150<br />
150 to 200<br />
200 to 500<br />
50<br />
100<br />
150<br />
50<br />
200
-<br />
<br />
<br />
<br />
<strong>and</strong><br />
<br />
<br />
(<br />
<br />
<br />
<br />
<br />
<br />
<br />
<br />
<br />
<br />
-<br />
<br />
<br />
-<br />
-<br />
<br />
<br />
<br />
<br />
<br />
<br />
<br />
<br />
<br />
<br />
1960s ( <strong>and</strong> ).<br />
<br />
<br />
<br />
<br />
, , <strong>and</strong> ). The combined<br />
<br />
<br />
<br />
the aquifer system ( <strong>and</strong> ). In some parts of the<br />
-<br />
<br />
<br />
<br />
( <strong>and</strong> ).<br />
<br />
<br />
<br />
<br />
<br />
<br />
<br />
Development <strong>and</strong> Changes to the Hydrologic Budget 97<br />
<br />
<br />
<br />
<br />
-<br />
<br />
<br />
<br />
<br />
<strong>and</strong> ). Williamson <strong>and</strong> others (1989)<br />
<br />
<br />
<br />
<br />
<br />
<br />
<br />
<br />
<br />
<br />
<br />
<br />
<br />
<br />
(<br />
<br />
<br />
<br />
<br />
-<br />
<br />
<br />
<br />
<br />
<strong>and</strong> ,<br />
<strong>and</strong> terns<br />
in the aquifer system are the same from the mid-1970s to<br />
2003.<br />
-<br />
<br />
<br />
others, 1993) ( <strong>and</strong> <br />
<br />
<br />
<br />
<br />
<br />
<br />
<br />
(
98 Groundwater Availability of the <strong>Central</strong> <strong>Valley</strong> <strong>Aquifer</strong>, California<br />
<br />
-<br />
<br />
<br />
<strong>and</strong> ). The increased<br />
<br />
<br />
-<br />
<br />
L<strong>and</strong> Subsidence<br />
<br />
<br />
<br />
-<br />
<br />
others (1999) compiled a summary on the phenomena of l<strong>and</strong><br />
<br />
<br />
<br />
<br />
-<br />
<br />
<br />
<br />
<br />
<br />
<br />
<br />
<br />
<br />
<br />
1991) (<br />
<br />
<br />
<br />
<br />
<br />
<br />
<br />
<br />
-<br />
<br />
<br />
<br />
<br />
<br />
<br />
-<br />
<br />
<br />
<br />
<br />
-<br />
<br />
<br />
<br />
<br />
other four processes (Williamson <strong>and</strong> others, 1989).<br />
-<br />
<br />
<br />
<br />
<br />
-<br />
<br />
2 <br />
(<br />
<br />
<br />
<br />
<br />
<br />
<br />
others, 1975).<br />
<br />
2<br />
2 in the<br />
2 <br />
<br />
Irel<strong>and</strong> <strong>and</strong> others, 1984) (-<br />
<br />
<br />
caused inelastic compaction of the clayey beds <strong>and</strong> resulted<br />
<br />
<br />
<br />
<br />
<br />
( <strong>and</strong> <br />
<br />
<br />
fraction of the total simulated aquifer-system compaction in<br />
<br />
<br />
<br />
affected by subsidence (mented<br />
that as much as 4 ft of subsidence has occurred in the<br />
<br />
<br />
<br />
feet in the early 1990s (Ikehara, 1995).
A<br />
11N/1E-24Q8<br />
0 50 100Miles<br />
0 50 100 Kilometers<br />
Shaded relief derived from U.S. Geological Survey<br />
National Elevation Dataset, 2006. Albers Equal Area Conic Projection<br />
A<br />
14S/12E-12H1<br />
18S/16E-33A1<br />
Development <strong>and</strong> Changes to the Hydrologic Budget 99<br />
EXPLANATION<br />
Area of subsidence due to compaction<br />
of peat <strong>and</strong> based on field surveys in 1952<br />
Area of subsidence due to compaction<br />
of peat, more than 10 feet as of 1981<br />
Area of subsidence due to hydrocompaction<br />
Area of subsidence due to water-level<br />
decline, more than 1 foot as of 2000<br />
Historic lakes<br />
Major l<strong>and</strong>-subsidence area from Irel<strong>and</strong>, 1984.<br />
Simulated subsidence 1962-2003, in feet<br />
5<br />
10<br />
<strong>Central</strong> <strong>Valley</strong> boundary<br />
Subsidence measurement locations<br />
(extensometers)—Data for labeled<br />
sites shown on figure 15B<br />
13S/15E-31J3<br />
B<br />
17S/15E-14Q1<br />
C<br />
23S/25E-16N3<br />
32S/28E-20Q1<br />
Figure B15. A, Areal extent of l<strong>and</strong> subsidence in the <strong>Central</strong> <strong>Valley</strong> (modified from figure 9 Thomas <strong>and</strong> Phoenix, 1976; figure 11<br />
Bertoldi <strong>and</strong> others, 1991) <strong>and</strong> locations of extensometers. Contours show simulated subsidence for water years 1962-2003.<br />
B, Compaction data from selected extensometers <strong>and</strong> total simulated pumpage in the <strong>Central</strong> <strong>Valley</strong>.
100 Groundwater Availability of the <strong>Central</strong> <strong>Valley</strong> <strong>Aquifer</strong>, California<br />
GROUND MOVEMENT, IN FEET<br />
B<br />
Rebound<br />
Subsidence<br />
-1.5<br />
-1.0<br />
-0.5<br />
0.0<br />
0.5<br />
1.0<br />
1.5<br />
2.0<br />
2.5<br />
"Variable"<br />
to<br />
Dry<br />
Figure B15. Continued.<br />
"Variable"<br />
to<br />
Wet<br />
1960 1970 1980<br />
-<br />
<br />
<br />
<br />
<br />
<br />
<br />
<br />
<br />
<br />
<br />
<br />
<br />
<strong>and</strong> subsidence (<br />
<br />
<br />
(, , <strong>and</strong> <br />
<br />
<br />
<br />
Dry Wet<br />
Dry<br />
YEAR<br />
11N/1E-24Q8 17S/15E-14Q1<br />
23S/25E-16N3<br />
EXPLANATION<br />
18S/16E-33A1<br />
14S/12E-12H1 13S/15E-31J3<br />
32S/28E-20Q1<br />
Wet<br />
1990 2000<br />
Total simulated<br />
pumpage for the<br />
<strong>Central</strong> <strong>Valley</strong><br />
"Variable"<br />
to<br />
Dry<br />
<br />
<br />
<br />
<strong>and</strong> ).<br />
<br />
<br />
<br />
<br />
<br />
-<br />
<br />
-<br />
<br />
<br />
<br />
<br />
most areas (<br />
<br />
<br />
<br />
20<br />
15<br />
10<br />
5<br />
0<br />
SIMULATED PUMPAGE, IN MILLIONS OF ACRE-FEET PER YEAR
compaction <strong>and</strong> l<strong>and</strong> subsidence in some areas (<br />
<strong>and</strong> <br />
). In some areas,<br />
<br />
<br />
2004) (<br />
-<br />
<br />
<br />
-<br />
<br />
-<br />
<br />
<br />
<br />
” subsection<br />
of the “” section.<br />
Surface Water <strong>and</strong> the Environment<br />
-<br />
<br />
<br />
<br />
-<br />
<br />
<br />
<br />
When water levels recover,<br />
compaction <strong>and</strong> l<strong>and</strong> subsidence can abate.<br />
DEPTH-TO-WATER,<br />
IN FEET BELOW LAND SURFACE<br />
COMPACTION,<br />
IN INCHES<br />
200<br />
400<br />
600<br />
12<br />
0<br />
Deep well<br />
No data<br />
1960 1970 1980<br />
YEAR<br />
Drought Drought<br />
No data<br />
1990<br />
Development <strong>and</strong> Changes to the Hydrologic Budget 101<br />
-<br />
<br />
<br />
<br />
<br />
<br />
<br />
<br />
<br />
<br />
<br />
nation<br />
of <strong>and</strong> <br />
<br />
<br />
<br />
<br />
-<br />
<br />
().<br />
-<br />
<br />
<br />
<br />
<br />
<br />
<br />
<br />
<br />
During the droughts of 1976-77 <strong>and</strong><br />
1987-91, deliveries of imported water<br />
to the west side of the San Joaquin<br />
<strong>Valley</strong> were cut back. More groundwater<br />
was pumped to meet the dem<strong>and</strong>, resulting<br />
in a drop in the water table <strong>and</strong><br />
consequent compaction.<br />
Some elastic expansion of the aquifer<br />
system has occured but the compacted<br />
materials can never return to their<br />
pre-compacted thickness.<br />
Figure B16. Measured compaction in relation to head decline in the San Joaquin <strong>Valley</strong>. The effects of drought on groundwater levels<br />
<strong>and</strong> associated subsidence also are evident. (Modified from Galloway <strong>and</strong> others, 1999; <strong>and</strong> Swanson, 1998.)
102 Groundwater Availability of the <strong>Central</strong> <strong>Valley</strong> <strong>Aquifer</strong>, California<br />
<br />
<br />
<br />
<br />
<br />
<br />
<br />
-<br />
<br />
<br />
<br />
<br />
-<br />
<br />
<br />
<br />
<br />
<br />
-<br />
<br />
<br />
<br />
<br />
<br />
ter<br />
resources.<br />
Global Climate Change <strong>and</strong> Variability<br />
<br />
<br />
<br />
-<br />
<br />
<br />
<br />
<br />
Past Climates<br />
-<br />
<br />
<br />
<br />
-<br />
<br />
<br />
<br />
<br />
<br />
<br />
<br />
<br />
<br />
<br />
-<br />
<br />
-<br />
<br />
<br />
<br />
<br />
<br />
north to south (<br />
of total precipitation in the north as compared to the south,<br />
<br />
<br />
<br />
<br />
<br />
<br />
<br />
<br />
<br />
<br />
<br />
<br />
<br />
<br />
<br />
<br />
<br />
Future Climate Projections<br />
<br />
<br />
<br />
<br />
<br />
<br />
-<br />
<br />
<br />
<br />
<br />
<br />
<br />
21 st -<br />
<br />
<br />
<br />
<br />
to increase. Other indirect effects of a temperature increase<br />
<br />
<br />
more than one crop in a season, <strong>and</strong> reduced milk production
-<br />
<br />
<br />
<br />
in the 21 st <br />
<br />
-<br />
<br />
<br />
<br />
-<br />
<br />
<br />
<br />
<strong>and</strong> drier at times, could place more stress on the reliability<br />
<br />
<br />
<br />
<br />
<br />
<br />
<br />
<br />
<br />
<br />
<br />
-<br />
<br />
<br />
(24 million people).<br />
<br />
<br />
-<br />
<br />
humidity could help offset some of the effects of an increase in<br />
<br />
<br />
-<br />
<br />
<br />
<br />
<br />
<br />
<br />
<br />
-<br />
<br />
<br />
<br />
<br />
<br />
-<br />
<br />
<br />
<br />
<br />
Groundwater Sustainability <strong>and</strong> Management 103<br />
<br />
<br />
<br />
<br />
be affected.<br />
Groundwater Sustainability <strong>and</strong><br />
Management<br />
-<br />
<br />
<br />
-<br />
-<br />
<br />
<br />
Groundwater Sustainability<br />
<br />
<br />
sustainable is based, in part, on social <strong>and</strong> philosophical<br />
<br />
<br />
<br />
that limit sustainability include physical, chemical, economic,<br />
<br />
ter<br />
sustainability.<br />
<br />
<br />
<br />
<br />
<br />
<br />
<br />
<br />
<br />
<br />
<br />
(<br />
<br />
<br />
<br />
<br />
<br />
<br />
-
104 Groundwater Availability of the <strong>Central</strong> <strong>Valley</strong> <strong>Aquifer</strong>, California<br />
-<br />
<br />
<br />
<br />
<br />
<br />
<br />
<br />
These related effects may constitute the primary constraint to<br />
<br />
<br />
<br />
<br />
<br />
<br />
<br />
<br />
<br />
<br />
<br />
<br />
<br />
<br />
<br />
-<br />
<br />
<br />
<br />
<br />
<br />
(<br />
<br />
<br />
<br />
<br />
-<br />
-<br />
<br />
<br />
<br />
<br />
<br />
<br />
<br />
-<br />
<br />
<br />
<br />
<br />
<br />
<br />
users (<br />
<br />
<br />
<br />
<br />
<br />
<br />
<br />
<br />
<br />
-<br />
<br />
<br />
<br />
<br />
<br />
by 50 percent as measured in tons of crops per acre foot of<br />
<br />
-<br />
<br />
<br />
<br />
-<br />
<br />
<br />
<br />
<br />
<br />
<br />
<br />
<br />
-<br />
<br />
<br />
-<br />
<br />
<br />
<br />
<br />
<br />
Groundwater Management<br />
<br />
-<br />
<br />
<br />
<br />
-<br />
<br />
-<br />
<br />
<br />
<br />
<br />
(described in <br />
<br />
options.
STREAMFLOW LEAKAGE, IN MILLIONS OF ACRE-FEET PER YEAR<br />
9.0<br />
8.0<br />
7.0<br />
6.0<br />
5.0<br />
4.0<br />
3.0<br />
2.0<br />
1.0<br />
0<br />
-1.0<br />
-2.0<br />
-3.0<br />
"Variable"<br />
to<br />
Dry<br />
Representative water year<br />
"Variable"<br />
to<br />
Wet<br />
Typical<br />
Figure B17. Streamflow gains <strong>and</strong> losses in the <strong>Central</strong> <strong>Valley</strong> between 1962 <strong>and</strong> 2003.<br />
Groundwater Sustainability <strong>and</strong> Management 105<br />
Dry Wet Dry<br />
Wet<br />
WATER YEAR<br />
Dry Wet<br />
"Variable"<br />
to<br />
Dry<br />
-4.0<br />
1962 1964 1966 1968 1970 1972 1974 1976 1978 1980 1982 1984 1986 1988 1990 1992 1994 1996 1998 2000 2002<br />
EXPLANATION<br />
Surface-water loss to<br />
groundwater system<br />
Surface-water gain from<br />
groundwater system
106 Groundwater Availability of the <strong>Central</strong> <strong>Valley</strong> <strong>Aquifer</strong>, California<br />
<br />
<br />
<br />
-<br />
<br />
<br />
<br />
<br />
<br />
<br />
<br />
-<br />
<br />
<br />
to meet dem<strong>and</strong>.<br />
<br />
<br />
<br />
<br />
<br />
<br />
-<br />
<br />
<br />
-<br />
<br />
<br />
<br />
<br />
-<br />
<br />
<br />
-<br />
<br />
<br />
<br />
<br />
<br />
<br />
<br />
-<br />
<br />
-<br />
<br />
-<br />
<br />
<br />
<br />
-<br />
<br />
<br />
<br />
<br />
<br />
<br />
-<br />
<br />
<br />
<br />
<br />
<br />
-<br />
-<br />
<br />
<br />
<br />
<br />
<br />
<br />
<br />
<br />
<br />
<br />
<br />
<br />
<br />
<br />
decadal to century timeframes to assess policy <strong>and</strong> capital<br />
-<br />
-<br />
<br />
<br />
<br />
<br />
<br />
<br />
Conjunctive Use<br />
<br />
<br />
<br />
<br />
<br />
<br />
<br />
<br />
<br />
-
-<br />
<br />
-<br />
<br />
<br />
<br />
<br />
-<br />
-<br />
<br />
<br />
<br />
<br />
<br />
<br />
<br />
<br />
-<br />
<br />
<br />
-<br />
<br />
<br />
considered.<br />
<br />
<br />
<br />
<br />
<br />
<br />
<br />
-<br />
<br />
<br />
<br />
<br />
-<br />
<br />
<br />
<br />
<br />
<br />
<br />
-<br />
<br />
<br />
<br />
<br />
<br />
Groundwater Sustainability <strong>and</strong> Management 107<br />
The report states that a peripheral canal is a necessary compo-<br />
<br />
<br />
<br />
Water Banking<br />
<br />
-<br />
<br />
<br />
<br />
-<br />
<br />
<br />
<br />
-<br />
<br />
<br />
<br />
<br />
<br />
<br />
<br />
<br />
<br />
<br />
<br />
-<br />
<br />
<br />
<br />
<br />
<br />
<br />
<br />
<br />
<br />
-<br />
<br />
<br />
<br />
<br />
<br />
<br />
<br />
<br />
<br />
<br />
). These
108 Groundwater Availability of the <strong>Central</strong> <strong>Valley</strong> <strong>Aquifer</strong>, California<br />
<br />
<br />
<br />
<br />
<br />
-<br />
<br />
<br />
<br />
<br />
<br />
<br />
<br />
habitat.<br />
<br />
<br />
<br />
<br />
-<br />
<br />
<br />
subsidence.<br />
<br />
) <strong>and</strong> the<br />
<br />
<br />
<br />
<br />
<br />
<br />
suitable. Other factors that need to be considered include local<br />
<br />
<br />
<br />
<br />
<br />
<br />
-<br />
<br />
<br />
<br />
<br />
compaction in these units.<br />
Other Management Strategies<br />
<br />
<br />
-<br />
<br />
<br />
<br />
-<br />
-<br />
<br />
<br />
<br />
<br />
ability to monitor soil moisture <strong>and</strong> other crop-related data<br />
<br />
<br />
<br />
<br />
<br />
<br />
<br />
ence<br />
that has already occurred, additional subsidence can be<br />
<br />
<br />
<br />
<br />
<br />
aquifer system compact inelastically <strong>and</strong> the l<strong>and</strong> subsidence<br />
becomes permanent (-<br />
<br />
<br />
<br />
<br />
-<br />
<br />
-<br />
<br />
<br />
identify areas that most likely are susceptible to subsidence<br />
<br />
<br />
others, 1999).
When long-term pumping<br />
lowers ground water levels<br />
<strong>and</strong> stresses on the aquitards<br />
beyond the preconsolidationstress<br />
thresholds, the<br />
aquitards compact <strong>and</strong> the<br />
l<strong>and</strong> surface subsides<br />
permanently.<br />
CH 1 Critical head at time, t 1<br />
CH 2 Critical head at time, t 2<br />
h 1<br />
h 2<br />
h<br />
t2 greater than t 1<br />
Head in well at t1 Head in well at t2 b Total l<strong>and</strong> subsidence,<br />
which equals compressibility<br />
times h<br />
Difference in head,<br />
(h2 minus h1) Water table<br />
Monitoring the Hydrologic System<br />
h<br />
<br />
<br />
<br />
<br />
<br />
<br />
<br />
<br />
<br />
-<br />
-<br />
<br />
<br />
<br />
-<br />
<br />
<br />
t 1<br />
L<strong>and</strong> surface<br />
Clay <strong>and</strong> silt<br />
(aquitards)<br />
Granular aquitard<br />
skeleton defining<br />
fluid-filled pore spaces<br />
storing groundwater<br />
h 1<br />
CH 1<br />
L<strong>and</strong><br />
surface<br />
b<br />
h2=CH2 Rearranged, compacted granular<br />
aquitard skeleton with reduced<br />
porosity <strong>and</strong> groundwater<br />
storage capacity<br />
Monitoring the Hydrologic System 109<br />
Depth<br />
to<br />
water<br />
When h 1 is greater than CH 1 , sediments are<br />
overconsolidated with compression, <strong>and</strong> l<strong>and</strong><br />
subsidence is predominately elastic <strong>and</strong> recoverable<br />
When h 2 is equal to CH 2 , sediments are<br />
normally consolidated with additional head<br />
decline causing inelastic <strong>and</strong> nonrecoverable<br />
l<strong>and</strong> subsidence<br />
Compaction of the aquifer system<br />
is concentrated in the aquitards<br />
Figure B18. Relationship of water-level changes <strong>and</strong> critical heads to subsidence <strong>and</strong> inelastic compaction.<br />
t 2<br />
Time<br />
Long-term decline in water level<br />
modulated by the seasonal cycles<br />
of groundwater pumping<br />
<br />
-
110 Groundwater Availability of the <strong>Central</strong> <strong>Valley</strong> <strong>Aquifer</strong>, California<br />
<br />
-<br />
<br />
-<br />
<br />
<br />
<br />
<br />
<br />
of an aquifer system as it is affected by l<strong>and</strong> use, climate, <strong>and</strong><br />
<br />
<br />
-<br />
<br />
<br />
<br />
<br />
<br />
<br />
<br />
-<br />
<br />
<br />
<br />
<br />
<br />
<br />
<br />
<br />
<br />
<br />
<br />
<br />
<br />
<br />
<br />
<br />
<br />
<br />
<br />
<br />
<br />
Groundwater<br />
<br />
<br />
-<br />
<br />
<br />
<br />
<br />
<br />
<br />
<br />
<br />
<br />
<br />
-<br />
<br />
2001).<br />
<br />
<br />
<br />
<br />
information used to constrain the model. These measure-<br />
<br />
<br />
<br />
<br />
<br />
<br />
<br />
<br />
<br />
<br />
-<br />
<br />
<br />
<br />
<br />
<br />
<br />
<br />
<br />
-
-<br />
<br />
<br />
<br />
<br />
1. <br />
<br />
<br />
2. <br />
<br />
personnel to enter the property <strong>and</strong> measure the<br />
<br />
3. <br />
<br />
<br />
-<br />
-<br />
<br />
<br />
the subsurface <strong>and</strong>, in some cases, construction<br />
<br />
4. <br />
reach the end of their usefulness because the<br />
<br />
<br />
<br />
<br />
<br />
<br />
<br />
<br />
<br />
-<br />
<br />
-<br />
<br />
analysis from different parts of the aquifer system. These data<br />
<br />
<br />
<br />
<br />
<br />
formities<br />
can cause permeability contrasts that tend to isolate<br />
-<br />
<br />
<br />
<br />
Monitoring the Hydrologic System 111<br />
<br />
<br />
<br />
<br />
-<br />
<br />
<br />
<br />
<br />
<br />
-<br />
<br />
<br />
<br />
<br />
<br />
<br />
-<br />
-<br />
<br />
-<br />
<br />
<br />
section of<br />
this report.<br />
Surface Water<br />
<br />
<br />
<br />
<br />
-<br />
<br />
-<br />
<br />
)<br />
<br />
<br />
-<br />
<br />
<br />
<br />
-
112 Groundwater Availability of the <strong>Central</strong> <strong>Valley</strong> <strong>Aquifer</strong>, California<br />
<br />
<br />
<br />
<br />
-<br />
<br />
<br />
<br />
<br />
<br />
<br />
-<br />
<br />
<br />
<br />
Subsidence<br />
-<br />
<br />
<br />
(<br />
<br />
<br />
<br />
<br />
<br />
<br />
-<br />
<br />
<br />
<br />
<br />
<br />
<br />
<br />
<br />
<br />
<br />
<br />
<br />
<br />
<br />
<br />
<br />
-<br />
-<br />
<br />
<br />
<br />
<br />
-<br />
<br />
<br />
ence<br />
from 1994 to 2007.<br />
<br />
<br />
-<br />
<br />
<br />
<br />
<br />
<br />
<br />
-<br />
-<br />
<br />
<br />
<br />
<br />
<br />
<br />
<br />
<br />
-<br />
-<br />
<br />
<br />
<br />
<br />
<br />
Water Quality<br />
<br />
-<br />
-<br />
-<br />
<br />
<br />
<br />
<br />
<br />
-
oron, nitrate, <strong>and</strong> pesticides are of concern <strong>and</strong> monitored<br />
<br />
<br />
<br />
<br />
<br />
<br />
-<br />
<br />
<br />
-<br />
<br />
<br />
-<br />
<br />
<br />
<br />
<br />
<br />
<br />
<br />
-<br />
<br />
-<br />
<br />
<br />
<br />
<br />
-<br />
<br />
<br />
<br />
<br />
soil leaches selenium from the soil <strong>and</strong> transports it to shal-<br />
<br />
-<br />
<br />
is found in concentrations potentially harmful to plants in the<br />
<br />
<br />
<br />
<br />
-<br />
<br />
<br />
<br />
Williams, 1995). The source of the nitrate is attributed to<br />
Monitoring the Hydrologic System 113<br />
<br />
-<br />
<br />
<br />
<br />
<br />
<br />
<br />
<br />
<br />
-<br />
<br />
<br />
<br />
<br />
<br />
<br />
<br />
depth.<br />
<br />
<br />
<br />
<br />
<br />
-<br />
<br />
<br />
<br />
<br />
<br />
<br />
<br />
<br />
<br />
<br />
<br />
<br />
<br />
<br />
<br />
-<br />
<br />
<br />
<br />
<br />
quality to the public.
114 Groundwater Availability of the <strong>Central</strong> <strong>Valley</strong> <strong>Aquifer</strong>, California<br />
L<strong>and</strong> Use <strong>and</strong> Climate<br />
-<br />
<br />
<br />
<br />
to measure, it is commonly not measured or tabulated in the<br />
<br />
<br />
-<br />
<br />
<br />
<br />
<br />
<br />
-<br />
<br />
-<br />
<br />
<br />
-<br />
<br />
<br />
<br />
-<br />
<br />
<br />
-<br />
<br />
-<br />
<br />
<br />
<br />
(K <br />
number of studies report K -<br />
<br />
<br />
<br />
<br />
<br />
-<br />
<br />
<br />
<br />
<br />
<br />
<br />
users.<br />
Summary<br />
<br />
<br />
<br />
<br />
<br />
-<br />
<br />
upon to help rectify the imbalance.<br />
<br />
<br />
<br />
-<br />
<br />
<br />
<br />
<br />
<br />
<br />
<br />
<br />
<br />
-<br />
<br />
<br />
<br />
<br />
<br />
<br />
<br />
<br />
<br />
<br />
<br />
<br />
<br />
<br />
<br />
<br />
<br />
<br />
<br />
<br />
<br />
<br />
<br />
<br />
<br />
aquifer-system compaction <strong>and</strong> associated l<strong>and</strong> subsidence.
Summary 115<br />
<br />
<br />
-<br />
<br />
<br />
<br />
<br />
<br />
-<br />
<br />
<br />
about 8.7 million acre-ft/yr.<br />
-<br />
<br />
<br />
-<br />
<br />
<br />
<br />
<br />
<br />
<br />
<br />
<br />
<br />
<br />
<br />
<br />
<br />
<br />
<br />
<br />
<br />
<br />
<br />
<br />
<br />
<br />
<br />
-<br />
<br />
-<br />
<br />
<br />
<br />
<br />
<br />
<br />
<br />
-<br />
<br />
<br />
<br />
<br />
<br />
<br />
<br />
-<br />
<br />
<br />
<br />
<br />
<br />
<br />
<br />
<br />
<br />
-<br />
<br />
<br />
<br />
<br />
-<br />
<br />
<br />
<br />
<br />
<br />
<br />
<br />
<br />
<br />
<br />
declines.<br />
<br />
<br />
<br />
<br />
-<br />
<br />
<br />
<br />
<br />
<br />
<br />
<br />
<br />
<br />
-<br />
<br />
<br />
5,200 mi 2 <br />
been affected by subsidence.
116 Groundwater Availability of the <strong>Central</strong> <strong>Valley</strong> <strong>Aquifer</strong>, California<br />
-<br />
<br />
<br />
<br />
<br />
<br />
<br />
<br />
<br />
<br />
<br />
<br />
<br />
<br />
<br />
<br />
<br />
<br />
<br />
<br />
<br />
-<br />
<br />
<br />
-<br />
<br />
<br />
<br />
<br />
<br />
<br />
<br />
-<br />
<br />
<br />
-<br />
<br />
<br />
has had substantial related consequences. These consequences<br />
perature,<br />
<strong>and</strong> l<strong>and</strong> subsidence. In turn, these consequences<br />
<br />
<br />
<br />
<br />
<br />
<br />
-<br />
<br />
<br />
-<br />
<br />
<br />
<br />
<br />
<br />
<br />
<br />
<br />
<br />
<br />
<br />
<br />
<br />
<br />
<br />
<br />
<br />
<br />
<br />
<br />
<br />
<br />
<br />
<br />
References Cited<br />
<br />
<br />
<br />
<br />
<br />
<br />
<br />
<br />
<br />
-<br />
<br />
<br />
<br />
<br />
-<br />
<br />
15, 2009, at
-<br />
-<br />
-<br />
<br />
http://<br />
<br />
-<br />
<br />
<br />
<br />
<br />
<br />
<br />
<br />
<br />
<br />
<br />
<br />
<br />
<br />
<br />
<br />
<br />
44 p.<br />
-<br />
<br />
<br />
p. 112-130.<br />
<br />
<br />
-<br />
<br />
<br />
<br />
<br />
<br />
<br />
-<br />
<br />
<br />
<br />
<br />
<br />
<br />
<br />
-<br />
<br />
<br />
<br />
References Cited 117<br />
<br />
<br />
-<br />
<br />
<br />
-<br />
<br />
<br />
<br />
-<br />
<br />
2009, at <br />
<br />
<br />
http://www.<br />
<br />
<br />
<br />
<br />
16, 2009, at <br />
<br />
<br />
<br />
<br />
<br />
<br />
2009, at <br />
<br />
<br />
2009, at <br />
-<br />
-<br />
<br />
<br />
<br />
<br />
<br />
<br />
-
118 Groundwater Availability of the <strong>Central</strong> <strong>Valley</strong> <strong>Aquifer</strong>, California<br />
<br />
-<br />
<br />
<br />
<br />
<br />
<br />
<br />
<br />
<br />
<br />
<br />
<br />
<br />
<br />
<br />
<br />
-<br />
<br />
http://<br />
<br />
-<br />
<br />
<br />
<br />
<br />
<br />
<br />
<br />
<br />
-<br />
<br />
<br />
<br />
<br />
<br />
<br />
<br />
<br />
-<br />
<br />
<br />
<br />
<br />
-<br />
http://<br />
<br />
<br />
<br />
<br />
<br />
<br />
<br />
<br />
-<br />
<br />
<br />
<br />
<br />
<br />
<br />
<br />
<br />
<br />
<br />
-<br />
<br />
<br />
<br />
<br />
<br />
<br />
<br />
<br />
<br />
<br />
<br />
<br />
<br />
<br />
at <br />
-<br />
<br />
<br />
<br />
<br />
<br />
<br />
-
References Cited 119<br />
<br />
<br />
<br />
<br />
<br />
<br />
<br />
<br />
<br />
<br />
<br />
<br />
<br />
77 p.<br />
<br />
<br />
-<br />
<br />
<br />
<br />
<br />
2009, at <br />
<br />
-<br />
<br />
<br />
http://pubs.er.usgs.gov/usgspubs/pp/<br />
<br />
<br />
<br />
<br />
<br />
<br />
<br />
-<br />
<br />
<br />
<br />
<br />
-<br />
-<br />
<br />
<br />
-<br />
<br />
<br />
<br />
<br />
-<br />
<br />
-<br />
<br />
<br />
<br />
<br />
-<br />
<br />
<br />
-<br />
<br />
<br />
<br />
<br />
<br />
-<br />
<br />
<br />
<br />
<br />
<br />
<br />
<br />
<br />
<br />
<br />
<br />
-<br />
<br />
<br />
2008, at <br />
<br />
<br />
<br />
<br />
<br />
<br />
-<br />
<br />
<br />
<br />
<br />
-<br />
<br />
<br />
at
120 Groundwater Availability of the <strong>Central</strong> <strong>Valley</strong> <strong>Aquifer</strong>, California<br />
<br />
<br />
<br />
<br />
<br />
<br />
<br />
<br />
<br />
-<br />
<br />
16 p.<br />
<br />
<br />
<br />
<br />
-<br />
<br />
<br />
<br />
<br />
<br />
<br />
<br />
-<br />
<br />
<br />
<br />
-<br />
<br />
<br />
<br />
<br />
<br />
<br />
-<br />
<br />
<br />
ley,<br />
updated to 1995, -<br />
<br />
<br />
-<br />
<br />
-<br />
<br />
<br />
-<br />
<br />
<br />
<br />
<br />
<br />
<br />
<br />
, .<br />
-
Chapter C. Numerical Model of the Hydrologic L<strong>and</strong>scape <strong>and</strong><br />
Groundwater Flow in California’s <strong>Central</strong> <strong>Valley</strong><br />
By Claudia C. Faunt, R<strong>and</strong>all T. Hanson, Kenneth Belitz, Wolfgang Schmid, Steven P. Predmore, Diane L.<br />
Rewis, <strong>and</strong> Kelly McPherson<br />
Introduction<br />
<br />
<br />
<br />
<br />
<br />
<br />
<br />
-<br />
<br />
<br />
<br />
<br />
Model Development<br />
<br />
-<br />
<br />
<br />
<br />
<br />
<br />
<br />
<br />
<br />
-<br />
<br />
<br />
) has<br />
made it possible to do more detailed <strong>and</strong> realistic simulations<br />
<br />
<br />
<br />
<br />
<br />
<br />
<br />
<br />
<br />
<br />
<br />
<br />
<br />
<br />
<br />
<br />
<br />
<br />
<br />
2 <br />
model cells to 1 mi 2 <br />
<br />
-<br />
<br />
10 layers <strong>and</strong> the uppermost layer is 50 ft thick. This more<br />
<br />
-<br />
<br />
<br />
<br />
<br />
<br />
monthly stress periods facilitate representation of the cyclical<br />
-<br />
<br />
<br />
-<br />
<br />
<br />
<br />
<br />
<br />
<br />
-<br />
<br />
described in more detail in (). The
122 Groundwater Availability of the <strong>Central</strong> <strong>Valley</strong> <strong>Aquifer</strong>, California<br />
Table C1. MODFLOW-2000 packages <strong>and</strong> processes used with the hydrologic flow model of the <strong>Central</strong> <strong>Valley</strong>, California.<br />
Table C1. MODFLOW-2000 packages <strong>and</strong> processes used with the hydrologic flow model of the <strong>Central</strong> <strong>Valley</strong>, California.—Continued<br />
Computer program<br />
(packages, processes,<br />
parameter estimation)<br />
Function Reference<br />
-<br />
Processes <strong>and</strong> Solver<br />
- -<br />
<br />
<br />
<br />
- <br />
<br />
<br />
<br />
Files<br />
<br />
<br />
<br />
<br />
<br />
<br />
<br />
<br />
<br />
<br />
<br />
<br />
<br />
<br />
Discretization<br />
- <br />
ary conditions of the model.<br />
<br />
<br />
<br />
<br />
<br />
<br />
<strong>Aquifer</strong> Parameters<br />
<br />
centers.<br />
<br />
<br />
l<strong>and</strong> subsidence<br />
<br />
<br />
<br />
<br />
Boundary Conditions<br />
<br />
<br />
<br />
<br />
Recharge <strong>and</strong> Discharge<br />
others (2000)<br />
<br />
multiple layers.<br />
<br />
Output, Observations <strong>and</strong> Sensitivity<br />
<br />
<br />
<br />
<br />
<br />
<br />
<br />
each time-step for subsidence, heads, <strong>and</strong> stream-<br />
<br />
<br />
<br />
-
-<br />
mated<br />
parameter estimation. The parameter estimation code<br />
-<br />
<br />
<br />
-<br />
<br />
<br />
<br />
<br />
<br />
<br />
<br />
<br />
-<br />
of this report <strong>and</strong> in the<br />
release notes <strong>and</strong> online documentation of the source code for<br />
<br />
<br />
<br />
<br />
<br />
<br />
these model components.<br />
Discretization<br />
<br />
<br />
<br />
<br />
<br />
<br />
<br />
().<br />
<br />
<br />
<br />
<br />
<br />
<br />
model cell.<br />
Spatial Discretization <strong>and</strong> Layering<br />
2 <br />
<br />
layers (<br />
<br />
Model Development 123<br />
<br />
<br />
<br />
<br />
<br />
<br />
). The top layer (layer 1) has an upper<br />
<br />
<br />
<br />
-<br />
<br />
<br />
<br />
<br />
described in more detail in .<br />
-<br />
<br />
<br />
<br />
<br />
<br />
-<br />
<br />
<br />
<br />
<br />
<br />
<br />
<br />
-<br />
<br />
<br />
<br />
<br />
<br />
deep.<br />
<br />
<br />
<br />
<br />
<br />
(<br />
than the model bottom <strong>and</strong> may be as much as 2,500 ft deep
124 Groundwater Availability of the <strong>Central</strong> <strong>Valley</strong> <strong>Aquifer</strong>, California<br />
A<br />
0<br />
STUDY<br />
AREA<br />
C A L I F O R N I A<br />
San<br />
Francisco<br />
<strong>Central</strong><br />
<strong>Valley</strong><br />
Pacific Ocean<br />
Sierra Nevada<br />
50 100 Miles<br />
0 50 100 Kilometers<br />
1<br />
3<br />
2<br />
Stockton<br />
Fault<br />
Shaded relief derived from U.S. Geological Survey<br />
National Elevation Dataset, 2006. Albers Equal Area Conic Projection<br />
Cascade Range<br />
6<br />
4<br />
5<br />
9<br />
7<br />
Coast Range<br />
8<br />
11<br />
10<br />
Sutter<br />
Buttes<br />
Sierra Nevada<br />
12<br />
13<br />
A<br />
A<br />
14<br />
EXPLANATION<br />
Model cells representing—<br />
12<br />
16<br />
15<br />
A'<br />
Active areas<br />
General-head boundary in layers 1 <strong>and</strong> 2<br />
Bedrock in some layers<br />
San Joaquin Formation in some layers<br />
Corcoran Clay in layers 4 <strong>and</strong> 5<br />
Corcoran Clay over<br />
San Joaquin Formation<br />
Potential horizontal flow<br />
barrier<br />
Active model grid boundary<br />
California Department of Water Resources<br />
water-balance subregions <strong>and</strong> identifier. See<br />
table A1 for names<br />
Geologic section along model row 355<br />
(See figure A11)<br />
19<br />
17<br />
18<br />
20<br />
21<br />
A'<br />
Tehachapi Mts<br />
White Wolf<br />
Fault<br />
Figure C1. <strong>Central</strong> <strong>Valley</strong> Hydrologic Model grid: A, Extent of San Joaquin Formation, Corcoran Member of the Tulare Formation,<br />
crystalline bedrock, <strong>and</strong> horizontal flow barriers. B, Upper-most active layer.
B<br />
0<br />
50 100 Miles<br />
0 50 100 Kilometers<br />
Shaded relief derived from U.S. Geological Survey<br />
National Elevation Dataset, 2006. Albers Equal Area Conic Projection<br />
Figure C1. Continued.<br />
Cascade Range<br />
Coast Range<br />
Sierra Nevada<br />
EXPLANATION<br />
Uppermost active layer—<br />
1<br />
2<br />
3<br />
6<br />
Active model grid boundary<br />
Model Development 125<br />
California Department of Water Resources<br />
water-balance subregions<br />
Tehachapi Mts
126 Groundwater Availability of the <strong>Central</strong> <strong>Valley</strong> <strong>Aquifer</strong>, California<br />
Table C2. Coordinates of the <strong>Central</strong> <strong>Valley</strong> Hydrologic Model grid.<br />
<br />
<br />
Corner of<br />
model grid<br />
Model<br />
coordinates<br />
X (column)<br />
-<br />
<br />
<br />
<br />
-<br />
<br />
<br />
<br />
-<br />
<br />
<br />
<br />
for purposes of this study, are less critical. In addition, to<br />
<br />
<br />
-<br />
<br />
<br />
patterns simulated.<br />
<br />
<br />
(<br />
<br />
<br />
<br />
<br />
<br />
<br />
Temporal Discretization<br />
Model<br />
coordinates<br />
Y (row)<br />
Latitude<br />
(DMS)<br />
<br />
<br />
<br />
-<br />
<br />
<br />
Longitude<br />
(DMS)<br />
-<br />
<br />
<br />
<br />
<br />
<br />
Boundary Conditions<br />
Albers coordinates<br />
X (easting)<br />
(meters)<br />
Albers coordinates<br />
Y (northing)<br />
(meters)<br />
1 1 1,890,733<br />
Northeast 98 1 1,969,734<br />
1 441 38,818 1,280,164<br />
98 441 173,410 1,359,209<br />
<br />
<br />
<br />
<br />
<br />
<br />
<br />
<br />
<br />
-<br />
<br />
<br />
-<br />
<br />
<br />
-<br />
<br />
-<br />
<br />
<br />
<br />
<br />
this chapter.
0<br />
Suisun<br />
Bay<br />
50 100 Miles<br />
0 50 100 Kilometers<br />
Shaded relief derived from U.S. Geological Survey<br />
National Elevation Dataset, 2006. Albers Equal Area Conic Projection<br />
1<br />
3<br />
2<br />
6<br />
4<br />
5<br />
9<br />
7<br />
8<br />
11<br />
10<br />
12<br />
13<br />
12<br />
14<br />
EXPLANATION<br />
Model stream cell<br />
Model general-head boundary cell<br />
Active model boundary<br />
Water-balance subregion receiving<br />
non-routed deliveries<br />
Diversion location<br />
Inflow location<br />
Model Development 127<br />
California Department of Water Resources<br />
water-balance subregions <strong>and</strong> identifier<br />
Figure C2. Distribution of general-head boundary cells <strong>and</strong> major streams <strong>and</strong> canals with streamflow-routing cells (including location<br />
of inflows <strong>and</strong> diversions). The water-balance subregions are described in .<br />
16<br />
15<br />
19<br />
17<br />
18<br />
20<br />
21
128 Groundwater Availability of the <strong>Central</strong> <strong>Valley</strong> <strong>Aquifer</strong>, California<br />
Specified-Flow Boundaries<br />
<br />
<br />
<br />
<br />
). Where bedrock<br />
<br />
-<br />
<br />
<br />
<br />
<br />
<br />
<br />
).<br />
Pumpage<br />
<br />
-<br />
<br />
<br />
<br />
<br />
<br />
<br />
<br />
<br />
<br />
<br />
<br />
Agricultural Pumpage<br />
<br />
-<br />
-<br />
<br />
<br />
can be no direct determination of the accuracy of the different<br />
<br />
<br />
<br />
<br />
<br />
<br />
<br />
-<br />
<br />
<br />
<br />
-<br />
-<br />
<br />
<br />
<br />
-<br />
<br />
<br />
<br />
<br />
<br />
<br />
<br />
<br />
<br />
<br />
<br />
<br />
<br />
<br />
-<br />
<br />
<br />
<br />
<br />
<br />
<br />
<br />
<br />
-
0 50 100 Miles<br />
0 50 100 Kilometers<br />
Shaded relief derived from U.S. Geological Survey<br />
National Elevation Dataset, 2006. Albers Equal Area Conic Projection<br />
EXPLANATION<br />
Area of Corcoran Clay<br />
Model grid boundary<br />
California Department of Water Resources<br />
water-balance subregion<br />
Pumping wells—<br />
Perforated in layers 2 <strong>and</strong>/or 3<br />
Model Development 129<br />
Perforated in upper <strong>and</strong> lower parts of system<br />
Perforated in all or parts of layers 6 through 9<br />
Multi-node irrigation wells perforated in layers<br />
2 <strong>and</strong>/or 3 <strong>and</strong> all or parts of layers 6 through 9<br />
Multi-node urban wells perforated in layers<br />
2 <strong>and</strong>/or 3 <strong>and</strong> all or parts of layers 6 through 9<br />
Figure C3. Distribution of urban <strong>and</strong> agricultural wells simulated in the <strong>Central</strong> <strong>Valley</strong> Hydrologic Model.
130 Groundwater Availability of the <strong>Central</strong> <strong>Valley</strong> <strong>Aquifer</strong>, California<br />
<br />
<br />
<br />
<br />
<br />
<br />
<br />
<br />
<br />
<br />
<br />
<br />
<br />
<br />
-<br />
<br />
<br />
<br />
<br />
<br />
-<br />
<br />
<br />
<br />
<br />
<br />
<br />
<br />
<br />
<br />
<br />
<br />
<br />
<br />
-<br />
<br />
<br />
<br />
<br />
<br />
<br />
). In addition,<br />
<br />
<br />
<br />
).<br />
Urban Pumpage<br />
<br />
<br />
1983) (<br />
<br />
-<br />
<br />
<br />
<br />
<br />
<br />
<br />
<br />
<br />
-<br />
<br />
<br />
-<br />
<br />
<br />
<br />
-<br />
<br />
<br />
<br />
<br />
<br />
<br />
<br />
<br />
<br />
<br />
<br />
<br />
<br />
<br />
<br />
<br />
<br />
-
REPORTED URBAN GROUNDWATER PUMPAGE, IN THOUSANDS OF ACRE-FEET PER YEAR<br />
2,000<br />
1,800<br />
1,600<br />
1,400<br />
1,200<br />
1,000<br />
800<br />
600<br />
400<br />
200<br />
0<br />
1961<br />
1964<br />
1967<br />
Recharge from <strong>and</strong> Discharge to the Delta<br />
<br />
<br />
<br />
<br />
(<br />
<br />
<br />
1970<br />
1973<br />
Tulare Basin<br />
San Joaquin <strong>Valley</strong><br />
Sacramento <strong>Valley</strong> <strong>and</strong> Delta<br />
1976<br />
1979<br />
Pumpage reported by U.S. Geological Survey<br />
[Williams <strong>and</strong> others, 1989](1961 to 1977) for—<br />
1982<br />
YEAR<br />
EXPLANATION<br />
1985<br />
1988<br />
1991<br />
Model Development 131<br />
<br />
<br />
<strong>and</strong> remained constant for the entire simulation period. The<br />
<br />
<br />
<br />
<br />
<br />
1994<br />
Pumpage reported by California Department of<br />
Water Resources (1961 to 2003) for—<br />
Tulare Basin<br />
San Joaquin <strong>Valley</strong><br />
Sacramento <strong>Valley</strong> <strong>and</strong> Delta<br />
Figure C4. Urban pumpage from U.S. Geological Survey <strong>and</strong> California Department of Water Resources data (C. Brush, California<br />
Department of Water Resources, written commun., February 21, 2007).<br />
1997<br />
2000<br />
2003
132 Groundwater Availability of the <strong>Central</strong> <strong>Valley</strong> <strong>Aquifer</strong>, California<br />
Recharge from <strong>and</strong> Discharge to Canals <strong>and</strong><br />
Streams<br />
<br />
<br />
<br />
<br />
<br />
others, 2004) (-<br />
<br />
<br />
<br />
<br />
<br />
<br />
<br />
<br />
<br />
, <br />
-<br />
<br />
<br />
).<br />
<br />
<br />
<br />
<br />
<br />
<br />
<br />
Water-Table Simulation<br />
<br />
<br />
<br />
<br />
<br />
<br />
table is deeper than 50 ft (<br />
<br />
<br />
<br />
<br />
<br />
<br />
<br />
<br />
<br />
<br />
<br />
<br />
<br />
” sec-<br />
<br />
<br />
<br />
<br />
<br />
<br />
<br />
<br />
(<br />
<br />
<br />
-<br />
<br />
<br />
<br />
<br />
<br />
<br />
<br />
<br />
Farm Process (FMP)<br />
-<br />
<br />
<br />
<br />
<br />
<br />
<br />
<br />
<br />
<br />
-<br />
<br />
<br />
<br />
<br />
<br />
<br />
<br />
anced<br />
for each simulation time step (-<br />
<br />
<br />
.
nrd<br />
wells<br />
p<br />
nrd<br />
srdin<br />
wells<br />
egwin<br />
tgwin<br />
egwout<br />
egwin<br />
Precipitation<br />
Non-routed deliveries<br />
into farm<br />
Semi-routed deliveries<br />
into farm<br />
Groundwater well pumping<br />
deliveries into farm<br />
Evaporation from groundwater<br />
into the farm<br />
Transpiration from groundwater<br />
into the farm<br />
Farm<br />
Figure C5. Flow chart of water inflows to <strong>and</strong> outflows from a “farm” as simulated by the Farm Process (FMP).<br />
<br />
<br />
<br />
<br />
<br />
<br />
<br />
ei<br />
ep<br />
ei<br />
ep<br />
egwout<br />
ti<br />
tp<br />
p<br />
dp<br />
<strong>Aquifer</strong><br />
tp<br />
EXPLANATION<br />
ti<br />
Evaporation from irrigation<br />
out of the farm<br />
Evaporation from precipitation<br />
out of the farm<br />
Evaporation from groundwater<br />
out of the farm<br />
Transpiration from irrigation<br />
out of the farm<br />
tgwout<br />
tgwin<br />
Transpiration from precipitation<br />
out of the farm<br />
srdout<br />
srdin<br />
tgwout<br />
run<br />
dp<br />
srdout<br />
Model Development 133<br />
run<br />
Transpiration from groundwater<br />
out of the farm<br />
Overl<strong>and</strong> runoff out<br />
of the farm<br />
Deep percolation out<br />
of the farm<br />
Semi-routed deliveries<br />
out of the farm<br />
INFLOW<br />
Streams<br />
OUTFLOW<br />
<br />
<br />
contains many optional simulation features, only some of the
134 Groundwater Availability of the <strong>Central</strong> <strong>Valley</strong> <strong>Aquifer</strong>, California<br />
<br />
<br />
<br />
<br />
<br />
<br />
<br />
<br />
others, 2006a). In contrast to the micro-scale application in<br />
<br />
<br />
-<br />
-<br />
<br />
<br />
<br />
<br />
<br />
<br />
<br />
<br />
-<br />
<br />
<br />
<br />
<br />
-<br />
<br />
<br />
cussed<br />
in <br />
<br />
<br />
<br />
<br />
<br />
-<br />
<br />
<br />
<br />
<br />
<br />
<br />
<br />
<br />
<br />
<br />
-<br />
<br />
<br />
<br />
<br />
<br />
<br />
<br />
<br />
<br />
<br />
<br />
<br />
<br />
<br />
<br />
<br />
<br />
<br />
<br />
<br />
-<br />
<br />
<br />
<br />
<br />
-<br />
<br />
<br />
<br />
<br />
-<br />
-<br />
<br />
<br />
<br />
<br />
-<br />
<br />
Delivery Requirement<br />
<br />
<br />
<br />
<br />
<br />
<br />
components estimated from both the l<strong>and</strong>scape (predominantly<br />
<br />
<br />
<br />
<br />
crop.
Soils<br />
<br />
<br />
<br />
<br />
). The<br />
<br />
<br />
<br />
<br />
-<br />
<br />
<br />
<br />
<br />
L<strong>and</strong> Use<br />
-<br />
<br />
<br />
<br />
-<br />
<br />
<br />
<br />
-<br />
-<br />
<br />
<br />
<br />
in the model on a cell-by-cell basis <strong>and</strong> include urban <strong>and</strong><br />
<br />
2 model<br />
<br />
<br />
<br />
<br />
<br />
<br />
Model Development 135<br />
<br />
<br />
<br />
-<br />
-<br />
-<br />
<br />
).<br />
<br />
(<br />
<br />
<br />
<br />
<br />
<br />
detailed (-<br />
<br />
-<br />
<br />
<br />
1973, 1992, 1998, <strong>and</strong> 2000 (<br />
simplicity, the l<strong>and</strong>-use maps are named for the year the map<br />
<br />
<br />
<br />
<br />
,<br />
<br />
,<br />
<br />
<br />
more permanent or more established crop types mapped more<br />
<br />
in the earlier maps on the basis of the most recent l<strong>and</strong>-use<br />
period (2000 l<strong>and</strong> use).
136 Groundwater Availability of the <strong>Central</strong> <strong>Valley</strong> <strong>Aquifer</strong>, California<br />
0 50 100 Miles<br />
0 50 100 Kilometers<br />
Shaded relief derived from U.S. Geological Survey<br />
National Elevation Dataset, 2006. Albers Equal Area Conic Projection<br />
EXPLANATION<br />
Agricultural soil classes <strong>and</strong> (capillary fringe)<br />
used in Farm Process—<br />
S<strong>and</strong>y loam (9.1 feet)<br />
Silty clay (7.1 feet)<br />
Silt (9.3 feet)<br />
Active model boundary<br />
California Department of Water Resources<br />
water-balance subregion<br />
Figure C6. Agricultural soils for the <strong>Central</strong> <strong>Valley</strong>, California, derived from STATSGO data (U.S. Department of Agriculture Natural<br />
Resources Conservation Service, 2005b).
CUMULATIVE DEPARTURE OF PRECIPITATION, IN INCHES PER YEAR<br />
50<br />
40<br />
30<br />
20<br />
10<br />
0<br />
-10<br />
-20<br />
-30<br />
-40<br />
-50<br />
-60<br />
-70<br />
-80<br />
Red Bluff<br />
Davis<br />
Fresno<br />
TIME, IN YEARS<br />
Bakersfield<br />
Pacific Decadal Oscillation (PDO) Index<br />
24 month moving average<br />
Figure C8<br />
4/61-3/68<br />
EXPLANATION<br />
Annual cumulative departure of precipitation—<br />
Model Development 137<br />
Time frame l<strong>and</strong>-use maps were applied<br />
Figure C9<br />
4/68-3/78<br />
Figure C10<br />
4/78-3/93<br />
"Variable"<br />
"Variable"<br />
Dry W to<br />
Wet Dry Wet Dry Wet Dry<br />
to Wet D Wet Dry Wet<br />
et<br />
ry<br />
Dry<br />
Dry<br />
Figure C11 Figure C12<br />
4/93-3/99 4/99-9/03<br />
3.0<br />
1875 1885 1895 1905 1915 1925 1935 1945 1955 1965 1975 1985 1995 2005<br />
Figure C7. Cumulative departure of precipitation, Pacific Decadal Oscillation (PDO) Index, climate windows, <strong>and</strong> time frame l<strong>and</strong>-use<br />
maps were applied.<br />
"Variable"<br />
to<br />
Dry<br />
2.0<br />
1.0<br />
0.0<br />
-1.0<br />
-2.0<br />
-3.0<br />
PACIFIC DECADAL OSCILLATION (PDO) INDEX, UNITLESS
138 Groundwater Availability of the <strong>Central</strong> <strong>Valley</strong> <strong>Aquifer</strong>, California<br />
Table C3. L<strong>and</strong>-use periods with acreage in square miles <strong>and</strong> percentage of different virtual crop categories.<br />
Area (square miles) Percentage of active model area Grouping of<br />
other classes1 1961 1973 1992 1998 2000 1961 1973 1992 1998 2000<br />
Irrigated<br />
Description<br />
1. Water No 105 124 160 347 162 1 1 1 2 1 n/a<br />
2 . Urban No 641 765 1,043 894 1,528 3 4 5 4 7 n/a<br />
2 No 7,355 4,809 6,237 5,102 6,639 36 23 30 25 32 n/a<br />
Yes n/a 312 553 263 n/a n/a 2 3 1 n/a 10,12,16<br />
Yes n/a n/a 1,799 589 n/a n/a n/a 9 3 n/a 13,14<br />
Yes n/a n/a 1,265 n/a n/a n/a n/a 6 n/a n/a 9,11,18<br />
Yes n/a n/a 634 n/a n/a n/a n/a 3 n/a n/a 11,14,17<br />
2 Yes 241 104 1 n/a 372 1 1
Virtual Crop Maps<br />
<br />
(“1960” l<strong>and</strong>-use map, <br />
<br />
<br />
<br />
<br />
<br />
<br />
sented<br />
in the simulation period from 1961 to 1968) uses<br />
<br />
<br />
<br />
<br />
<br />
<br />
<br />
-<br />
<br />
<br />
<br />
<br />
<br />
<br />
<br />
<br />
<br />
<br />
<br />
<br />
<br />
-<br />
<br />
<br />
<br />
<br />
<br />
(<br />
<br />
<br />
<br />
<br />
<br />
<br />
<br />
<br />
<br />
<br />
<br />
<br />
<br />
<br />
<br />
<br />
Model Development 139<br />
<br />
-<br />
<br />
<br />
<br />
-<br />
<br />
spatial patterns of l<strong>and</strong> use, there are discrepancies across<br />
<br />
<br />
<br />
<br />
<br />
<br />
-<br />
<br />
<br />
<br />
-<br />
<br />
<br />
1973 to 1992 l<strong>and</strong>-use maps.<br />
<br />
map, <br />
-<br />
<br />
<br />
<br />
<br />
<br />
<br />
<br />
<br />
<br />
-<br />
<br />
<br />
<br />
<br />
<br />
<br />
<br />
<br />
<br />
<br />
<br />
<br />
-<br />
-<br />
<br />
<br />
-
140 Groundwater Availability of the <strong>Central</strong> <strong>Valley</strong> <strong>Aquifer</strong>, California<br />
16<br />
15<br />
17<br />
14<br />
18<br />
13<br />
12<br />
19<br />
11<br />
1 2<br />
0 50 100 Miles<br />
0 50 100 Kilometers<br />
Shaded relief derived from U.S. Geological Survey<br />
National Elevation Dataset, 2006. Albers Equal Area Conic Projection<br />
10<br />
Fraction of total area by l<strong>and</strong>-use type<br />
1<br />
9<br />
2<br />
3<br />
8<br />
6<br />
4<br />
3<br />
5<br />
9<br />
7<br />
8<br />
11<br />
12<br />
10<br />
14<br />
13<br />
EXPLANATION<br />
L<strong>and</strong> use—1961-68<br />
L<strong>and</strong> use type—<br />
1 Water<br />
2 Urban<br />
3 Native vegetation<br />
4 Orchard, groves <strong>and</strong> vineyards (none shown)<br />
5 Pasture/Hay (none shown)<br />
6 Row crops (none shown)<br />
7 Small grains (none shown)<br />
8 Idle/fallow<br />
9 Truck, nursery <strong>and</strong> berry crops<br />
10 Citrus <strong>and</strong> subtropical<br />
11 Field crops<br />
12 Vineyards<br />
13 Pasture<br />
14 Grain <strong>and</strong> hay<br />
15 Feed lots <strong>and</strong> diaries<br />
16 Deciduous fruits <strong>and</strong> nuts<br />
17 Rice<br />
18 Cotton<br />
19 Developed<br />
20 Cropl<strong>and</strong> <strong>and</strong> pasture (none shown)<br />
21 Cropl<strong>and</strong> (none shown)<br />
22 Irrigated row <strong>and</strong> field crops (none shown)<br />
16<br />
15<br />
19<br />
Water-balance subregion boundaries<br />
<strong>and</strong> identifier—See table C1<br />
Active model grid boundary—<br />
See figure C1<br />
Figure C8. Virtual crops for 1960 (modified with 2000 data), including pie chart of percentage of different virtual crops (sources:<br />
California Department of Water Resources, 2000; California State University, Chico, 2003;). The water-balance subregions are described<br />
in .<br />
17<br />
18<br />
20<br />
21
18<br />
17<br />
16<br />
20<br />
14<br />
13<br />
1 2<br />
0 50 100 Miles<br />
0 50 100 Kilometers<br />
Shaded relief derived from U.S. Geological Survey<br />
National Elevation Dataset, 2006. Albers Equal Area Conic Projection<br />
12<br />
1<br />
11<br />
2<br />
3<br />
10<br />
Fraction of total area by l<strong>and</strong>-use type<br />
9<br />
6<br />
4<br />
4<br />
8<br />
5<br />
3<br />
9<br />
7<br />
8<br />
Model Development 141<br />
EXPLANATION<br />
L<strong>and</strong> use—1968-78<br />
L<strong>and</strong> use type—<br />
1 Water<br />
2 Urban<br />
3 Native vegetation<br />
4 Orchard, groves <strong>and</strong> vineyards<br />
5 Pasture/Hay (none shown)<br />
6 Row crops (none shown)<br />
7 Small grains (none shown)<br />
8 Idle/fallow<br />
9 Truck, nursery <strong>and</strong> berry crops<br />
10 Citrus <strong>and</strong> subtropical<br />
11 Field crops<br />
12 Vineyards<br />
13 Pasture<br />
14 Grain <strong>and</strong> hay<br />
15 Feed lots <strong>and</strong> diaries (none shown)<br />
16 Deciduous fruits <strong>and</strong> nuts<br />
17 Rice<br />
18 Cotton<br />
19 Developed (none shown)<br />
20 Cropl<strong>and</strong> <strong>and</strong> pasture<br />
21 Cropl<strong>and</strong> (none shown)<br />
22 Irrigated row <strong>and</strong> field crops (none shown)<br />
Water-balance subregion boundaries<br />
<strong>and</strong> identifier—See table C1<br />
Active model grid boundary—<br />
See figure C1<br />
Figure C9. Virtual crops for 1973, including pie chart of percentage of different virtual crops (sources: U.S. Geological Survey, 1990;<br />
California Department of Water Resources, 2000). The water-balance subregions are described in .<br />
11<br />
12<br />
10<br />
14<br />
13<br />
16<br />
15<br />
19<br />
17<br />
18<br />
20<br />
21
142 Groundwater Availability of the <strong>Central</strong> <strong>Valley</strong> <strong>Aquifer</strong>, California<br />
14<br />
13<br />
12<br />
16<br />
11<br />
10<br />
17<br />
9<br />
7<br />
18<br />
0 50 100 Miles<br />
0 50 100 Kilometers<br />
Shaded relief derived from U.S. Geological Survey<br />
National Elevation Dataset, 2006. Albers Equal Area Conic Projection<br />
6<br />
1 2<br />
Fraction of total area by l<strong>and</strong>-use type<br />
1<br />
5<br />
2<br />
3<br />
4<br />
6<br />
4<br />
5<br />
3<br />
9<br />
7<br />
8<br />
EXPLANATION<br />
L<strong>and</strong> use—1978-93<br />
1<br />
L<strong>and</strong> use type—<br />
Water<br />
2 Urban<br />
3 Native vegetation<br />
4 Orchard, groves <strong>and</strong> vineyards<br />
5 Pasture/Hay<br />
6 Row crops<br />
7 Small grains<br />
8 Idle/fallow (none shown)<br />
9 Truck, nursery <strong>and</strong> berry crops<br />
10 Citrus <strong>and</strong> subtropical<br />
11 Field crops<br />
12 Vineyards<br />
13 Pasture<br />
14 Grain <strong>and</strong> hay<br />
15 Feed lots <strong>and</strong> diaries (none shown)<br />
16 Deciduous fruits <strong>and</strong> nuts<br />
17 Rice<br />
18 Cotton<br />
19 Developed (none shown)<br />
20 Cropl<strong>and</strong> <strong>and</strong> pasture (none shown)<br />
21 Cropl<strong>and</strong> (none shown)<br />
22 Irrigated row <strong>and</strong> field crops (none shown)<br />
Water-balance subregion boundaries<br />
<strong>and</strong> identifier—See table C1<br />
Active model grid boundary—<br />
See figure C1<br />
Figure C10. Virtual crops for 1992, including pie chart of percentage of different virtual crops (sources: Gilliom <strong>and</strong> others, 2006;<br />
California Department of Water Resources, 2000). The water-balance subregions are described in table A1.<br />
11<br />
12<br />
10<br />
14<br />
13<br />
16<br />
15<br />
19<br />
17<br />
18<br />
20<br />
21
l<strong>and</strong>-use map, <br />
-<br />
<br />
<br />
<br />
<br />
<br />
<br />
<br />
<br />
<br />
-<br />
<br />
-<br />
<br />
<br />
<br />
<br />
<br />
<br />
<br />
<br />
crop maps.<br />
<br />
use map, <br />
<br />
<br />
<br />
<br />
<br />
-<br />
<br />
<br />
<br />
<br />
<br />
<br />
from the late 1990s, this type of map also lacks the temporal<br />
<br />
<br />
terns,<br />
there are some discrepancies across county boundaries.<br />
<br />
<br />
<br />
-<br />
<br />
urban (<br />
-<br />
<br />
<br />
<br />
In contrast, 11 percent of the crop l<strong>and</strong>, predominantly on<br />
Model Development 143<br />
the southeast side, is planted in deciduous fruit <strong>and</strong> nut trees,<br />
<br />
<br />
<br />
-<br />
<br />
<br />
<br />
Crop-Type Data<br />
<br />
<br />
<br />
<br />
<br />
-<br />
<br />
<br />
<br />
<br />
<br />
<br />
-<br />
<br />
-<br />
<br />
-<br />
<br />
<br />
<br />
<br />
<br />
<br />
. There is<br />
-<br />
<br />
). The<br />
<br />
<br />
<br />
<br />
<br />
-<br />
<br />
<br />
<br />
-<br />
<br />
<br />
-
144 Groundwater Availability of the <strong>Central</strong> <strong>Valley</strong> <strong>Aquifer</strong>, California<br />
18<br />
17<br />
16<br />
21<br />
22<br />
1 2<br />
9<br />
14<br />
10<br />
13 12 11<br />
Fraction of total area by l<strong>and</strong>-use type<br />
0 50 100 Miles<br />
0 50 100 Kilometers<br />
Shaded relief derived from U.S. Geological Survey<br />
National Elevation Dataset, 2006. Albers Equal Area Conic Projection<br />
1<br />
2<br />
3<br />
6<br />
4<br />
3<br />
5<br />
5<br />
4<br />
9<br />
7<br />
8<br />
11<br />
12<br />
10<br />
14<br />
13<br />
16<br />
15<br />
19<br />
EXPLANATION<br />
L<strong>and</strong> use—1993-99<br />
1<br />
2<br />
3<br />
4<br />
5<br />
6<br />
7<br />
8<br />
9<br />
10<br />
11<br />
12<br />
13<br />
14<br />
15<br />
16<br />
17<br />
18<br />
19<br />
20<br />
21<br />
22<br />
17<br />
L<strong>and</strong> use type—<br />
Water<br />
Urban<br />
Native vegetation<br />
Orchard, groves <strong>and</strong> vineyards<br />
Pasture/Hay<br />
Row crops (none shown)<br />
Small grains (none shown)<br />
Idle/fallow (none shown)<br />
Truck, nursery <strong>and</strong> berry crops<br />
Citrus <strong>and</strong> subtropical<br />
Field crops<br />
Vineyards<br />
Pasture<br />
Grain <strong>and</strong> hay<br />
Feed lots <strong>and</strong> diaries (none shown)<br />
Deciduous fruits <strong>and</strong> nuts<br />
Rice<br />
Cotton<br />
Developed (none shown)<br />
Cropl<strong>and</strong> <strong>and</strong> pasture (none shown)<br />
Cropl<strong>and</strong><br />
Irrigated row <strong>and</strong> field crops<br />
Water-balance subregion boundaries<br />
<strong>and</strong> identifier—See table C1<br />
Active model grid boundary—<br />
See figure C1<br />
Figure C11. Virtual crops for 1998, including pie chart of percentage of different virtual crops (sources: Davis <strong>and</strong> others, 1998;<br />
California Department of Water Resources, 2000). The water-balance subregions are described in .<br />
18<br />
20<br />
21
14<br />
16<br />
13<br />
17<br />
12<br />
18<br />
11<br />
1 2<br />
0 50 100 Miles<br />
0 50 100 Kilometers<br />
Shaded relief derived from U.S. Geological Survey<br />
National Elevation Dataset, 2006. Albers Equal Area Conic Projection<br />
10<br />
Fraction of total area by l<strong>and</strong>-use type<br />
9<br />
1<br />
2<br />
8<br />
3<br />
6<br />
4<br />
5<br />
3<br />
9<br />
7<br />
8<br />
11<br />
12<br />
10<br />
14<br />
13<br />
16<br />
15<br />
1<br />
2<br />
3<br />
4<br />
5<br />
6<br />
7<br />
8<br />
9<br />
10<br />
11<br />
12<br />
13<br />
14<br />
15<br />
16<br />
17<br />
18<br />
19<br />
20<br />
21<br />
22<br />
19<br />
EXPLANATION<br />
L<strong>and</strong> use—1999-2003<br />
L<strong>and</strong> use type—<br />
Model Development 145<br />
Water<br />
Urban<br />
Native vegetation<br />
Orchard, groves <strong>and</strong> vineyards (none shown)<br />
Pasture/Hay (none shown)<br />
Row crops (none shown)<br />
Small grains (none shown)<br />
Idle/fallow<br />
Truck, nursery <strong>and</strong> berry crops<br />
Citrus <strong>and</strong> subtropical<br />
Field crops<br />
Vineyards<br />
Pasture<br />
Grain <strong>and</strong> hay<br />
Feed lots <strong>and</strong> diaries (none shown)<br />
Deciduous fruits <strong>and</strong> nuts<br />
Rice<br />
Cotton<br />
Developed (none shown)<br />
Cropl<strong>and</strong> <strong>and</strong> pasture (none shown)<br />
Cropl<strong>and</strong> (none shown)<br />
Irrigated row <strong>and</strong> field crops (none shown)<br />
Water-balance subregion boundaries<br />
<strong>and</strong> identifier—See table C1<br />
Active model grid boundary—<br />
See figure C1<br />
Figure C12. Virtual crops for 2000, including a pie chart of percentage of different virtual crops (California Department of Water<br />
Resources, 2000). The water-balance subregions are described in<br />
17<br />
18<br />
20<br />
21
146 Groundwater Availability of the <strong>Central</strong> <strong>Valley</strong> <strong>Aquifer</strong>, California<br />
Table C4. Summary of <strong>Central</strong> <strong>Valley</strong>, California, virtual crop categories <strong>and</strong> properties.<br />
Virtual-crop<br />
crop category<br />
(number)<br />
Root depth,<br />
in feet<br />
Anoxia<br />
<br />
<br />
<br />
<br />
<br />
).<br />
<br />
<br />
<br />
<br />
<br />
<br />
<br />
<br />
-<br />
-<br />
<br />
<br />
<br />
<br />
<br />
pears, apricots, cherries, <strong>and</strong> other miscellaneous deciduous<br />
trees.<br />
Root uptake pressure heads, in feet Fraction of<br />
surface-water<br />
Lower optimal<br />
range<br />
Upper optimal<br />
range<br />
Wilting<br />
runoff from<br />
precipitation<br />
/irrigation<br />
(dimensionless)<br />
Water (1) 3.6 1.6 0.3 0.05/0.01<br />
Urban (2) 2.0 0.01/0.01<br />
10.6 1.6 0.4 0.21/0.01<br />
6.0 0.10/0.01<br />
5.3 0.10/0.02<br />
8.3 0.10/0.06<br />
4.0 0.10/0.04<br />
5.3 0.06/0.01<br />
Truck, nursery, <strong>and</strong> berry crops (9) 6.3 0.10/0.10<br />
4.0 0.10/0.01<br />
4.0 0.10/0.08<br />
5.0 0.01/0.01<br />
5.3 0.0 0.10/0.02<br />
4.0 0.10/0.04<br />
3.6 0.32/0.35<br />
poultry farms) (15)<br />
6.0 0.11/0.05<br />
5.3 1.6 0.4 0.01/0.03<br />
9.3 0.10/0.10<br />
5.3 0.10/0.08<br />
4.9 0.10/0.08<br />
6.3 0.10/0.08<br />
4.9 0.10/0.07<br />
-<br />
-<br />
<br />
<br />
<br />
<br />
<br />
<br />
-<br />
-<br />
<br />
<br />
<br />
-<br />
<br />
<br />
months of the year ().
CROP COEFFICIENT BY LAND-USE TYPE, UNITLESS<br />
A<br />
1.40<br />
1.20<br />
1.00<br />
0.80<br />
0.60<br />
0.40<br />
0.20<br />
0.00<br />
<br />
<br />
<br />
<br />
<br />
<br />
<br />
<br />
<br />
in the simulations tabulated in <br />
Model Development 147<br />
JAN FEB MAR APR MAY JUN JUL AUG SEP OCT NOV DEC<br />
L<strong>and</strong> use type—<br />
Water<br />
Urban<br />
Native vegetation<br />
Orchard, groves <strong>and</strong> vineyards<br />
MONTH<br />
EXPLANATION<br />
Pasture/hay<br />
Row crops<br />
Small grains<br />
Idle/fallow<br />
Figure C13. Monthly crop coefficients for virtual crops in the <strong>Central</strong> <strong>Valley</strong>, California (sources: Brouwer <strong>and</strong> others, 1985; Brouwer<br />
<strong>and</strong> Heibloem, 1986; Snyder <strong>and</strong> others, 1987a; Snyder <strong>and</strong> others, 1987b; Allen <strong>and</strong> others, 1998; Brush <strong>and</strong> others, 2004).
148 Groundwater Availability of the <strong>Central</strong> <strong>Valley</strong> <strong>Aquifer</strong>, California<br />
CROP COEFFICIENT BY LAND-USE TYPE, UNITLESS<br />
B<br />
1.40<br />
1.20<br />
1.00<br />
0.80<br />
0.60<br />
0.40<br />
0.20<br />
0.00<br />
Figure C13. Continued.<br />
JAN FEB MAR APR MAY JUN JUL AUG SEP OCT NOV DEC<br />
L<strong>and</strong> use type—<br />
<br />
<br />
<br />
time period in .<br />
-<br />
<br />
<br />
-<br />
<br />
<br />
<br />
MONTH<br />
EXPLANATION<br />
Truck, nursery <strong>and</strong> berry crops<br />
Citrus <strong>and</strong> subtropical<br />
Field crops<br />
Vineyards<br />
Pasture<br />
Grain <strong>and</strong> hay<br />
Feed lots <strong>and</strong> dairies<br />
<br />
<br />
<br />
-
1.40<br />
1.20<br />
1.00<br />
0.80<br />
0.60<br />
0.40<br />
CROP COEFFICIENT BY LAND-USE TYPE, UNITLESS C<br />
0.20<br />
0.00<br />
Figure C13. Continued.<br />
-<br />
-<br />
<br />
<br />
<br />
<br />
<br />
<br />
<br />
Model Development 149<br />
JAN FEB MAR APR MAY JUN JUL AUG SEP OCT NOV DEC<br />
L<strong>and</strong> use type—<br />
Deciduous fruits <strong>and</strong> nuts<br />
Rice<br />
Cotton<br />
Developed<br />
MONTH<br />
EXPLANATION<br />
Cropl<strong>and</strong> <strong>and</strong> pasture<br />
Cropl<strong>and</strong><br />
Irrigated row <strong>and</strong> field crops<br />
<br />
-<br />
<br />
<br />
<br />
-
150 Groundwater Availability of the <strong>Central</strong> <strong>Valley</strong> <strong>Aquifer</strong>, California<br />
Table C5. Summary of fractions of transpiration <strong>and</strong> evaporation by month for <strong>Central</strong> <strong>Valley</strong>, California, virtual crops.<br />
Table C5. Summary of fractions of transpiration <strong>and</strong> evaporation by month for <strong>Central</strong> <strong>Valley</strong> virtual crops.—Continued<br />
<br />
<br />
Virtual-crop<br />
crop category<br />
(number)<br />
January<br />
(Ftr/Fep/Fei)<br />
February<br />
(Ftr/Fep/Fei)<br />
March<br />
(Ftr/Fep/Fei)<br />
April<br />
(Ftr/Fep/Fei)<br />
May<br />
(Ftr/Fep/Fei)<br />
June<br />
(Ftr/Fep/Fei)<br />
Water (1) 0.00/1.00/1.00 0.00/1.00/1.00 0.00/1.00/1.00 0.00/1.00/1.00 0.00/1.00/1.00 0.00/1.00/1.00<br />
Urban (2) 0.25/0.75/0.02 0.25/0.75/0.02 0.25/0.75/0.02 0.25/0.75/0.02 0.25/0.75/0.02 0.25/0.75/0.02<br />
0.28/0.72/0.72 0.28/0.72/0.72 0.66/0.34/0.34 0.66/0.34/0.34 0.66/0.34/0.34 0.66/0.34/0.34<br />
0.20/0.80/0.80 0.20/0.80/0.80 0.37/0.63/0.63 0.23/0.77/0.77 0.46/0.54/0.54 0.47/0.53/0.53<br />
0.50/0.50/0.50 0.50/0.50/0.50 0.50/0.50/0.50 0.50/0.50/0.50 0.72/0.28/0.28 0.88/0.12/0.12<br />
0.11/0.89/0.89 0.11/0.89/0.89 0.11/0.89/0.89 0.09/0.91/0.91 0.36/0.64/0.64 0.46/0.54/0.54<br />
0.00/1.00/1.00 0.00/1.00/1.00 0.00/1.00/1.00 0.00/1.00/1.00 0.00/1.00/1.00 0.00/1.00/1.00<br />
0.00/1.00/0.00 0.00/1.00/0.00 0.00/1.00/0.00 0.00/1.00/0.00 0.00/1.00/0.00 0.00/1.00/0.00<br />
Truck, nursery, <strong>and</strong> berry crops (9) 0.80/0.20/0.18 0.80/0.20/0.18 0.39/0.61/0.61 0.44/0.56/0.36 0.42/0.58/0.38 0.80/0.20/0.18<br />
0.27/0.73/0.73 0.27/0.73/0.73 0.46/0.54/0.14 0.46/0.54/0.14 0.46/0.54/0.14 0.46/0.54/0.14<br />
0.01/0.99/0.99 0.01/0.99/0.99 0.01/0.99/0.99 0.15/0.85/0.85 0.15/0.85/0.85 0.94/0.06/0.06<br />
0.00/1.00/0.03 0.00/1.00/0.03 0.28/0.72/0.22 0.40/0.60/0.10 0.38/0.62/0.12 0.36/0.64/0.14<br />
0.18/0.82/0.82 0.15/0.85/0.85 0.46/0.64/0.64 0.91/0.09/0.03 0.91/0.09/0.03 0.91/0.09/0.03<br />
0.46/0.54/0.54 0.92/0.08/0.08 0.92/0.08/0.08 0.92/0.08/0.08 0.23/0.77/0.77 0.00/1.00/1.00<br />
0.00/1.00/1.00 0.00/1.00/1.00 0.00/1.00/1.00 0.00/1.00/1.00 0.00/1.00/1.00 0.00/1.00/1.00<br />
0.10/0.90/0.90 0.10/0.90/0.90 0.10/0.90/0.90 0.50/0.50/0.50 0.50/0.50/0.50 0.97/0.03/0.03<br />
0.20/0.80/0.50 0.20/0.80/0.50 0.20/0.80/0.50 0.75/0.25/0.25 0.75/0.25/0.25 0.80/0.20/0.10<br />
0.75/0.25/0.25 0.75/0.25/0.25 0.75/0.25/0.25 0.43/0.57/0.17 0.75/0.25/0.20 0.75/0.25/0.20<br />
0.30/0.70/0.67 0.30/0.70/0.67 0.22/0.78/0.78 0.16/0.84/0.84 0.42/0.58/0.38 0.85/0.15/0.15<br />
0.00/1.00/1.00 0.00/1.00/1.00 0.00/1.00/1.00 0.00/1.00/1.00 0.20/0.80/0.80 0.30/0.70/0.70<br />
0.05/0.95/0.85 0.05/0.95/0.85 0.05/0.95/0.55 0.05/0.95/0.55 0.05/0.95/0.95 0.05/0.95/0.85<br />
0.05/0.95/0.55 0.05/0.95/0.55 0.05/0.95/0.75 0.05/0.95/0.75 0.20/0.80/0.78 0.85/0.15/0.10<br />
Virtual-crop<br />
crop category<br />
(number)<br />
July<br />
(Ftr/Fep/Fei)<br />
August<br />
(Ftr/Fep/Fei)<br />
September<br />
(Ftr/Fep/Fei)<br />
October<br />
(Ftr/Fep/Fei)<br />
November<br />
(Ftr/Fep/Fei)<br />
December<br />
(Ftr/Fep/Fei)<br />
Water (1) 0.00/1.00/1.00 0.00/1.00/1.00 0.00/1.00/1.00 0.00/1.00/1.00 0.00/1.00/1.00 0.00/1.00/1.00<br />
Urban (2) 0.25/0.75/0.02 0.25/0.75/0.02 0.25/0.75/0.02 0.25/0.75/0.02 0.25/0.75/0.02 0.25/0.75/0.02<br />
0.66/0.34/0.34 0.66/0.34/0.34 0.66/0.34/0.34 0.66/0.34/0.34 0.66/0.34/0.34 0.28/0.72/0.72<br />
0.47/0.53/0.53 0.47/0.53/0.53 0.47/0.53/0.53 0.47/0.53/0.53 0.45/0.55/0.55 0.20/0.80/0.80<br />
0.95/0.05/0.05 0.96/0.04/0.04 0.96/0.04/0.04 0.96/0.04/0.04 0.96/0.04/0.04 0.96/0.04/0.04<br />
0.95/0.05/0.05 0.87/0.13/0.13 0.12/0.88/0.88 0.11/0.89/0.89 0.11/0.89/0.89 0.11/0.89/0.89<br />
0.20/0.80/0.80 0.50/0.50/0.50 0.90/0.10/0.10 0.90/0.10/0.10 0.00/1.00/1.00 0.50/0.50/0.50<br />
0.00/1.00/0.00 0.00/1.00/0.00 0.00/1.00/0.00 0.00/1.00/0.00 0.00/1.00/0.00 0.00/1.00/0.00<br />
Truck, nursery, <strong>and</strong> berry crops (9) 0.80/0.20/0.18 0.80/0.20/0.18 0.80/0.20/0.18 0.80/0.20/0.18 0.80/0.20/0.18 0.80/0.20/0.18<br />
0.46/0.54/0.14 0.46/0.54/0.14 0.46/0.54/0.14 0.46/0.54/0.14 0.46/0.54/0.14 0.46/0.54/0.14<br />
0.94/0.06/0.06 0.94/0.06/0.06 0.90/0.10/0.10 0.01/0.99/0.99 0.01/0.99/0.99 0.01/0.99/0.99<br />
0.36/0.64/0.14 0.36/0.64/0.14 0.36/0.64/0.14 0.36/0.64/0.14 0.36/0.64/0.14 0.38/0.62/0.12<br />
0.96/0.04/0.04 0.91/0.09/0.03 0.91/0.09/0.03 0.46/0.64/0.64 0.15/0.85/0.85 0.15/0.85/0.85<br />
0.00/1.00/1.00 0.00/1.00/1.00 0.00/1.00/1.00 0.00/1.00/1.00 0.16/0.84/0.84 0.35/0.65/0.65<br />
0.00/1.00/1.00 0.00/1.00/1.00 0.00/1.00/1.00 0.00/1.00/1.00 0.00/1.00/1.00 0.00/1.00/1.00<br />
0.97/0.03/0.03 0.97/0.03/0.03 0.97/0.03/0.03 0.10/0.90/0.90 0.10/0.90/0.90 0.10/0.90/0.90<br />
0.75/0.25/0.25 0.60/0.40/0.27 0.20/0.80/0.50 0.20/0.80/0.50 0.20/0.80/0.50 0.20/0.80/0.50<br />
0.75/0.25/0.20 0.75/0.25/0.20 0.47/0.53/0.33 0.36/0.64/0.44 0.75/0.25/0.25 0.75/0.25/0.25<br />
0.90/0.10/0.10 0.90/0.10/0.10 0.90/0.10/0.10 0.50/0.50/0.50 0.30/0.70/0.70 0.30/0.70/0.67<br />
0.85/0.15/0.15 0.95/0.05/0.05 0.90/0.10/0.10 0.50/0.50/0.50 0.00/1.00/1.00 0.00/1.00/1.00<br />
0.05/0.95/0.85 0.75/0.25/0.25 0.95/0.05/0.05 0.94/0.06/0.06 0.93/0.07/0.07 0.00/1.00/1.00<br />
0.95/0.05/0.05 0.95/0.05/0.05 0.60/0.40/0.15 0.04/0.96/0.04 0.10/0.90/0.50 0.10/0.90/0.50
Table C6. Average area-weighted composite efficiency for each<br />
water-balance subregion of the <strong>Central</strong> <strong>Valley</strong>, California, through<br />
the simulation period.<br />
<br />
Waterbalance<br />
subregion<br />
Climate Data<br />
1960s 1970s 1980s 1990s 2000s<br />
1 70 68 73 76 74<br />
2 70 68 72 75 73<br />
3 74 74 79 82 83<br />
4 71 70 74 78 79<br />
5 73 72 78 80 80<br />
6 69 69 74 77 77<br />
7 71 69 73 77 77<br />
8 69 69 75 78 75<br />
9 69 70 76 79 78<br />
10 69 72 78 80 79<br />
11 70 70 76 78 77<br />
12 71 70 74 77 76<br />
13 71 72 77 80 79<br />
14 68 73 82 86 87<br />
15 67 69 75 76 76<br />
16 72 72 78 79 81<br />
17 72 72 77 79 80<br />
18 71 72 77 79 79<br />
19 68 72 78 79 77<br />
20 72 73 78 81 81<br />
21 71 73 79 81 81<br />
<br />
-<br />
<br />
<br />
<br />
Reference Evapotranspiration (ETo)<br />
eter-based<br />
equations or simple, empirical equations. The main<br />
<br />
<br />
<br />
data required for the parameter-based equations (such as the<br />
<br />
<br />
small number of parameters (usually air temperature <strong>and</strong> solar<br />
<br />
<br />
Model Development 151<br />
<br />
-<br />
<br />
<br />
<br />
-<br />
<br />
<br />
<br />
<br />
-<br />
<br />
where,<br />
T<br />
T<br />
⎛<br />
ETh = 0. 0023Ra⎜<br />
⎝<br />
max<br />
min<br />
T + T ⎞⎛T<br />
−T<br />
max min max min<br />
⎟⎜<br />
2× 178 . ⎠⎝<br />
2<br />
is the maximum daily air temperature [ ° C],<br />
is the minimum<br />
daily air temperature [ ° C], <strong>and</strong><br />
Ra is the extraterrestrial<br />
solar radiation<br />
2<br />
(megaJoule/m /day).<br />
<br />
to be one of the simplest <strong>and</strong> most accurate of the empiri-<br />
<br />
<br />
<br />
<br />
<br />
<br />
<br />
<br />
<br />
-<br />
<br />
<br />
<br />
<br />
<br />
the center of each 1-mi 2 <br />
<br />
<br />
<br />
<br />
<br />
<br />
⎞<br />
⎟<br />
⎠
152 Groundwater Availability of the <strong>Central</strong> <strong>Valley</strong> <strong>Aquifer</strong>, California<br />
-<br />
<br />
<br />
<br />
<br />
<br />
-<br />
<br />
<br />
<br />
<br />
-<br />
<br />
<br />
<br />
<br />
<br />
Precipitation<br />
<br />
<br />
tation<br />
are obtained at a 1.24-mi spatial resolution from the<br />
<br />
<br />
) indicates that the<br />
<br />
<br />
monthly precipitation rate is interpolated for the center of each<br />
1 mi 2 -<br />
<br />
.<br />
<br />
<br />
<br />
precipitation occurs, a part of this precipitation becomes<br />
<br />
<br />
<br />
<br />
-<br />
<br />
<br />
Surface-Water Supply<br />
<br />
-<br />
<br />
<br />
<br />
<br />
<strong>and</strong> ). In<br />
<br />
<br />
<br />
<strong>and</strong><br />
<br />
<br />
<br />
<br />
<br />
<br />
<br />
<br />
<br />
<br />
<br />
-<br />
<br />
<br />
<br />
<br />
). In order to compile multiple<br />
<br />
<br />
<br />
<br />
<br />
-<br />
<br />
<br />
<br />
<br />
<br />
<br />
<br />
<br />
<br />
<br />
<br />
Groundwater Supply<br />
<br />
<br />
<br />
<br />
<br />
” section of this chapter), because the amount of<br />
<br />
<br />
-<br />
<br />
<br />
<br />
-
Water-<br />
balance<br />
subregion<br />
Model Development 153<br />
Table C7. Average reference evapotranspiration (ETo) by month for the <strong>Central</strong> <strong>Valley</strong>, California, for 1961–2003 based on temperature<br />
data using the Hargreaves–Samani equation.<br />
<br />
January February March April May June<br />
1 1.13 1.79 2.43 3.68 5.00 6.32<br />
2 1.24 1.93 2.61 3.91 5.15 6.32<br />
3 1.39 2.15 2.91 4.22 5.34 6.55<br />
4 1.36 2.18 2.92 4.22 5.35 6.58<br />
5 1.28 2.08 2.81 4.14 5.32 6.54<br />
6 1.28 2.14 2.77 4.06 5.19 6.34<br />
7 1.15 1.96 2.65 4.00 5.24 6.45<br />
8 1.29 2.14 2.84 4.04 5.17 6.22<br />
9 1.24 2.09 2.79 4.01 4.98 5.94<br />
10 1.63 2.33 3.11 4.16 5.26 6.40<br />
11 1.53 2.43 3.16 4.24 5.35 6.44<br />
12 1.53 2.37 3.16 4.28 5.37 6.48<br />
13 1.75 2.54 3.29 4.39 5.57 6.72<br />
14 1.72 2.40 3.18 4.33 5.43 6.57<br />
15 1.61 2.32 3.15 4.39 5.51 6.60<br />
16 1.70 2.50 3.30 4.49 5.76 6.99<br />
17 1.70 2.51 3.30 4.52 5.72 6.79<br />
18 1.90 2.70 3.46 4.64 5.77 6.80<br />
19 2.10 2.62 3.33 4.38 5.38 6.48<br />
20 2.21 2.73 3.41 4.34 5.38 6.53<br />
21 2.28 2.70 3.31 4.19 5.13 6.24<br />
Water-<br />
balance<br />
subregion<br />
July August September October November December<br />
1 6.79 5.98 4.71 2.62 1.34 0.91<br />
2 6.69 5.96 4.75 2.79 1.51 1.06<br />
3 6.97 6.23 4.98 3.02 1.78 1.35<br />
4 7.14 6.36 5.05 3.06 1.79 1.40<br />
5 6.92 6.15 4.86 2.94 1.68 1.18<br />
6 6.52 5.89 4.80 2.96 1.74 1.14<br />
7 6.74 6.00 4.76 2.82 1.60 0.98<br />
8 6.53 5.82 4.69 2.94 1.80 1.25<br />
9 6.09 5.45 4.54 2.88 1.75 1.10<br />
10 6.65 5.87 4.89 3.15 1.96 1.41<br />
11 6.93 6.16 4.99 3.20 2.10 1.72<br />
12 6.77 6.02 4.92 3.18 2.01 1.48<br />
13 7.16 6.40 5.30 3.46 2.20 1.73<br />
14 6.67 5.91 4.86 3.26 2.03 1.52<br />
15 6.74 6.04 4.93 3.34 2.05 1.42<br />
16 7.36 6.65 5.32 3.47 2.23 1.73<br />
17 7.20 6.61 5.23 3.51 2.26 1.76<br />
18 7.11 6.52 5.30 3.60 2.38 1.93<br />
19 6.58 5.99 4.98 3.40 2.24 1.83<br />
20 6.63 6.02 5.02 3.38 2.29 1.95<br />
21 6.33 5.76 4.88 3.32 2.28 1.96<br />
<br />
-<br />
-<br />
<br />
<br />
used to satisfy the residual dem<strong>and</strong>.
154 Groundwater Availability of the <strong>Central</strong> <strong>Valley</strong> <strong>Aquifer</strong>, California<br />
Net Recharge<br />
<br />
<br />
<br />
<br />
<br />
<br />
<br />
<br />
<br />
<br />
<br />
<br />
slope (<br />
<br />
<br />
<br />
<br />
<br />
<br />
<br />
<br />
<br />
<br />
-<br />
<br />
Hydraulic Properties<br />
<br />
<br />
<br />
K) <strong>and</strong> thickness<br />
<br />
<br />
<br />
<br />
<br />
<br />
-<br />
<br />
<br />
<br />
<br />
<br />
<br />
<br />
member.<br />
<br />
<br />
<br />
<br />
where<br />
x<br />
p<br />
M ( x)=<br />
n<br />
⎛ 1<br />
⎜<br />
⎝<br />
1<br />
n p<br />
p ⎞<br />
∑ xk<br />
⎟<br />
k = 1<br />
is the value being averaged (such as hydraulic<br />
conductivity),<br />
p is the averaging power-mean<br />
exponent,<br />
n is the number of elements being averaged, <strong>and</strong><br />
th<br />
x is the k element in the list.<br />
k<br />
-<br />
<br />
K ) <strong>and</strong><br />
K <br />
<br />
where<br />
F<br />
ci ,<br />
K<br />
h,i<br />
= + ⎡<br />
⎣KF<br />
K F<br />
c c, i f f , i<br />
is the fraction of coarse-grained<br />
sediment<br />
⎠<br />
⎤<br />
⎦<br />
in a cell, estimated from sediment texture<br />
data as described earlier in Chapter A, <strong>and</strong><br />
F isthe fraction<br />
of fine-grained sediment in a<br />
f , i<br />
cell (1 Fci , ).<br />
K is much smaller that K , the arithmetic mean<br />
K <strong>and</strong> fraction of the coarse-<br />
<br />
K 1/2 )<br />
p th -<br />
<br />
-<br />
<br />
where<br />
k<br />
K vk<br />
, + 1 2<br />
F f k<br />
, + 1 2<br />
p<br />
K = ⎡F<br />
K F K<br />
vk , + 1 ck , + 1 c +<br />
f , k+<br />
1<br />
2 ⎣⎢ 2<br />
2<br />
represents the layer,<br />
p<br />
f<br />
⎤<br />
⎦⎥<br />
1 p<br />
isthe fraction of coarse-grained sediment<br />
between layer midpoints, <strong>and</strong><br />
is the fraction of fine-grained<br />
sediment<br />
between layer midpoints.<br />
,
p<br />
<br />
-<br />
<br />
<br />
-<br />
<br />
<br />
-<br />
p<br />
<br />
<br />
p.<br />
<br />
<br />
<br />
mean. K <br />
<br />
<br />
<br />
<br />
RANGE IN HYDRAULIC CONDUCTIVITY, IN FEET PER DAY<br />
1,000<br />
100<br />
10<br />
1<br />
0.1<br />
0.01<br />
0 20 40<br />
PERCENTAGE COARSE-GRAINED DEPOSITS<br />
EXPLANATION<br />
Exponent of power mean—<br />
-1.0<br />
-0.8<br />
-0.5<br />
-0.3<br />
0<br />
0.5<br />
1.0<br />
Model Development 155<br />
<br />
<br />
-<br />
<br />
<br />
<br />
<br />
-3 ft/d<br />
for silty clay to 13 ft/d for s<strong>and</strong>. Williamson <strong>and</strong> others (1989)<br />
<br />
<br />
<br />
<br />
-<br />
<br />
<br />
<br />
K ) to be<br />
<br />
K ) to<br />
be 4.010 -<br />
<br />
(Harmonic mean)<br />
(Geometric mean)<br />
(Arithimetic mean)<br />
60 80 100<br />
Figure C14. Relation between hydraulic conductivity <strong>and</strong> percentage coarse-grained deposits based on hydraulic conductivity end<br />
members <strong>and</strong> exponent of the power mean.
156 Groundwater Availability of the <strong>Central</strong> <strong>Valley</strong> <strong>Aquifer</strong>, California<br />
K <br />
10 ft/d (). The<br />
<br />
mean (p<br />
<br />
p<br />
<br />
p).<br />
<br />
<br />
about 6.610 <br />
10 10 <br />
5 <br />
-<br />
<br />
<br />
<br />
<br />
-<br />
<br />
<br />
<br />
<br />
<br />
10 to 1.510 -<br />
-<br />
10 <br />
10 -<br />
<br />
<br />
is 5.210 <br />
10 <br />
6.210 <br />
Hydraulic Conductivity<br />
<br />
in this study are K , K , <strong>and</strong> K <br />
<br />
<br />
<br />
<br />
<br />
<br />
<br />
“” section of this chapter.<br />
<br />
<br />
that affect the end-member K<br />
<br />
<br />
<br />
<br />
<br />
<br />
K is 7.510 -2 <br />
K is 6.710 +2 <br />
K is 2.410 K is 3.310 +3 -<br />
<br />
<br />
<br />
<br />
-<br />
<br />
<br />
<br />
<br />
<br />
decrease the K<br />
(see “<br />
<br />
-<br />
<br />
<br />
<br />
K ) is based on the coarse- <strong>and</strong><br />
<br />
<br />
<br />
<br />
-<br />
<br />
aquifer system as opposed to the clayey lenses or interbeds<br />
<br />
<br />
<br />
<br />
<br />
<br />
<br />
<br />
-<br />
<br />
<br />
<br />
<br />
clays <strong>and</strong> the enhanced impedance caused by compaction<br />
<br />
<br />
<br />
<br />
<br />
<br />
deposits about 4.810 ft/d (0.002 * 2.410 ft/d), close to the
Table C8. Measured <strong>and</strong> simulated hydraulic properties.<br />
Model Development 157<br />
[K K K <br />
<br />
Hydraulic<br />
property<br />
Field <strong>and</strong> laboratory values Previously simulated values Values simulated in this study<br />
c +21 31 to 104 ft/d2,3,4 +2 <br />
<br />
5 +3 f 5 to ft/d4 ft/d6 -2 <br />
<br />
5 -1 corc ft/d7 ft/d4 ft/d2 ft/d6 ft/d9 <br />
<br />
-2 <br />
-3 ous<br />
simulations include borehole<br />
<br />
p 4 <br />
<br />
0.25 to 0.65 5 <br />
<br />
0.0 to 0.35 5 4<br />
0.02 to 0.20 9<br />
<br />
<br />
<br />
-6 per ft per ft9 -6 per ft per ft9 -6 per ft <br />
per ft5 per ft16 -6 per ft<br />
per ft 15 per ft 9 per ft<br />
1 <br />
2 <br />
3 <br />
4 <br />
5 <br />
6 <br />
7 <br />
8 Johnson <strong>and</strong> others (1968).<br />
9 Williamson <strong>and</strong> others (1989).<br />
10 <br />
11 <br />
12 <br />
13 <br />
14 <br />
15 <br />
16 Irel<strong>and</strong> <strong>and</strong> others (1984).
158 Groundwater Availability of the <strong>Central</strong> <strong>Valley</strong> <strong>Aquifer</strong>, California<br />
<br />
).<br />
-<br />
<br />
<br />
<br />
<br />
<br />
<br />
<br />
<br />
<br />
<br />
<br />
situations, such data are scarce, depth decay is obscured by<br />
<br />
is substantial. Taylor <strong>and</strong> others (2001) <strong>and</strong> Whittemore <strong>and</strong><br />
<br />
<br />
-<br />
<br />
<br />
<br />
<br />
<br />
<br />
-<br />
<br />
<br />
-<br />
<br />
<br />
Storage Properties<br />
<br />
<br />
<br />
<br />
<br />
<br />
<br />
<br />
<br />
-<br />
<br />
<br />
<br />
<br />
<br />
<br />
-<br />
<br />
-<br />
<br />
<strong>and</strong> inelastic compressibilities of the aquifer-system material.<br />
<br />
<br />
<br />
<br />
<br />
<br />
<br />
<br />
<br />
<br />
<br />
-<br />
<br />
<br />
<br />
<br />
-<br />
<br />
<br />
<br />
<br />
<br />
<br />
-<br />
-<br />
<br />
<br />
<br />
<br />
<br />
<br />
<br />
<br />
in <strong>and</strong> .<br />
<br />
<br />
<br />
<br />
layer (<br />
<br />
<br />
<br />
-
-<br />
<br />
<strong>and</strong> others, 1991).<br />
<br />
<br />
<br />
<br />
<br />
-<br />
<br />
<br />
<br />
<br />
<br />
<br />
<br />
<br />
<br />
<br />
<br />
<br />
<br />
<br />
<br />
<br />
<br />
<br />
<br />
<br />
).<br />
<br />
<br />
<br />
<br />
thicknesses are summed <strong>and</strong> multiplied by the compressibility<br />
10 -6 <br />
<br />
-<br />
-<br />
<br />
Model Development 159<br />
<br />
-<br />
-<br />
<br />
<br />
<br />
<br />
<br />
<br />
future use.<br />
<br />
<br />
lated<br />
as the product of the estimated elastic- <strong>and</strong> inelastic-spe-<br />
<br />
<br />
-<br />
<br />
-<br />
-<br />
<br />
<br />
10 to<br />
210 <br />
<br />
8.610 -<br />
fers<br />
of 1.010 <br />
<br />
<br />
<br />
<br />
<br />
<br />
10 <br />
<br />
<br />
<br />
<br />
<br />
<br />
<br />
10 per foot.<br />
-<br />
<br />
<br />
10 <br />
4 <br />
<br />
10 <br />
<br />
<br />
-
160 Groundwater Availability of the <strong>Central</strong> <strong>Valley</strong> <strong>Aquifer</strong>, California<br />
<br />
<br />
-<br />
-<br />
<br />
<br />
consolidation<br />
stress represents the threshold stress that deter-<br />
<br />
<br />
<br />
<br />
<br />
-<br />
<br />
-<br />
<br />
<br />
<br />
-<br />
<br />
estimated by Williamson <strong>and</strong> others (1989). These heads are<br />
-<br />
<br />
<br />
<br />
<br />
Hydrogeologic Units<br />
<br />
<br />
-<br />
<br />
, the<br />
<br />
<br />
<br />
-<br />
<br />
<br />
<br />
-<br />
<br />
<br />
<br />
<br />
<br />
(<br />
<br />
Hydrogeologic Structures<br />
<br />
<br />
<br />
<br />
ley<br />
(<br />
<br />
<br />
structures (<br />
-<br />
<br />
<br />
<br />
<br />
<br />
<br />
<br />
the model domain ().<br />
Initial Conditions<br />
<br />
<br />
<br />
<br />
-<br />
<br />
<br />
<br />
<strong>and</strong> ).<br />
<br />
<br />
<br />
of these <strong>and</strong> possibly other conditions, steady-state simulations<br />
<br />
<br />
<br />
-<br />
<br />
<br />
<br />
<br />
-<br />
<br />
-<br />
<br />
<br />
-
-<br />
<br />
<br />
<br />
<br />
transient effects caused by imposition of the poorly estimated<br />
<br />
-<br />
<br />
<br />
<br />
to dissipate transient effects caused by inaccurate initial heads<br />
<br />
-<br />
<br />
<br />
<br />
<br />
<br />
<br />
<br />
<br />
<br />
<br />
Model Calibration <strong>and</strong> Sensitivity<br />
<br />
<br />
<br />
-<br />
<br />
-<br />
<br />
<br />
<br />
<br />
<br />
-<br />
<br />
<br />
Model Calibration <strong>and</strong> Sensitivity 161<br />
<br />
<br />
<br />
<br />
<br />
<br />
<br />
<br />
<br />
<br />
<br />
<br />
<br />
<br />
<br />
-<br />
<br />
in <br />
<br />
<br />
<br />
-<br />
<br />
-<br />
<br />
<br />
<br />
Observations Used in Model Calibration<br />
<br />
<br />
<br />
model calibration, often uses hydraulic head data as the sole or<br />
<br />
<br />
data lead to a more accurate, rapid, <strong>and</strong> unique calibration.<br />
<br />
-<br />
<br />
<br />
-
162 Groundwater Availability of the <strong>Central</strong> <strong>Valley</strong> <strong>Aquifer</strong>, California<br />
0 50 100 Miles<br />
0 50 100 Kilometers<br />
Shaded relief derived from U.S. Geological Survey<br />
National Elevation Dataset, 2006. Albers Equal Area Conic Projection<br />
EXPLANATION<br />
Model calibration—<br />
Location of stream segments used<br />
for model calibration<br />
Location of wells used for model<br />
calibration<br />
Location of subsidence measurements<br />
used for model calibration<br />
<strong>Central</strong> <strong>Valley</strong> model boundary<br />
Water-balance subregion<br />
Figure C15. Distribution of calibration data (groundwater levels, gains <strong>and</strong> losses of streamflow, <strong>and</strong> subsidence observations).
Water-Level Altitudes, Water-Level Altitude<br />
Changes, <strong>and</strong> Water-Level Altitude Maps<br />
<br />
<br />
<br />
http://waterdata.usgs.<br />
gov <strong>and</strong> <br />
<br />
<br />
<br />
<br />
).<br />
<br />
<br />
<br />
simulation period.<br />
<br />
<br />
<br />
<br />
-<br />
<br />
<br />
on the basis of perforation depths, completeness of record,<br />
<br />
<br />
<br />
<br />
<br />
<br />
<br />
-<br />
<br />
<br />
<br />
<br />
<br />
<br />
<br />
(<br />
<br />
<br />
<br />
<br />
parameter estimation.<br />
tudes<br />
at a particular time, it is necessary to accurately simu-<br />
<br />
<br />
<br />
<br />
Model Calibration <strong>and</strong> Sensitivity 163<br />
<br />
<br />
<br />
<br />
<br />
<br />
<br />
in the northern part of the study area, increased dramatically in<br />
<br />
<br />
<br />
<br />
<br />
-<br />
-<br />
<br />
10 7 10 ft 2 for the 42.5-year simulation period<br />
<br />
<br />
-<br />
<br />
<br />
<br />
possibly represent errors in the databases, measurements that<br />
<br />
<br />
<br />
<br />
<br />
). In
164 Groundwater Availability of the <strong>Central</strong> <strong>Valley</strong> <strong>Aquifer</strong>, California<br />
0 50 100 Miles<br />
0 50 100 Kilometers<br />
Shaded relief derived from U.S. Geological Survey<br />
National Elevation Dataset, 2006. Albers Equal Area Conic Projection<br />
EXPLANATION<br />
Active model grid boundary<br />
Model streams <strong>and</strong> canals<br />
Model water-balance subregion<br />
Potential horizontal flow<br />
barrier<br />
Wells selected for spatial<br />
<strong>and</strong> climate coverage<br />
Wells selected for spatial<br />
coverage<br />
Wells selected for wet <strong>and</strong> dry period<br />
coverage<br />
Remaining wells with water-level<br />
measurements between 1961 <strong>and</strong> 2003<br />
Figure C16. Distribution of wells with water-level-altitude data for the simulation period 1961–2003, <strong>and</strong> location of wells selected for<br />
model calibration. Only selected wells were used for calibration; other wells are shown to display the density of wells with water-level<br />
measurements in simulation period.
SIMULATED HYDRAULIC HEAD, IN FEET<br />
A<br />
500<br />
300<br />
100<br />
0<br />
-100<br />
-300<br />
FREQUENCY<br />
4,000<br />
3,000<br />
2,000<br />
1,000<br />
0<br />
-150-75-60-45-30-15 0 15 30 45 60 75 150 More<br />
RESIDUALS, IN FEET<br />
1 to 1 correlation line<br />
<br />
<br />
<br />
<br />
(-<br />
<br />
<br />
<br />
<br />
<br />
<br />
<br />
<br />
represent quasi-static conditions.<br />
<br />
). In<br />
Model Calibration <strong>and</strong> Sensitivity 165<br />
-500<br />
-500 -300 -100 0 100<br />
300 500<br />
A<br />
MEASURED WATER LEVELS, IN FEET<br />
EXPLANATION<br />
California Department of Water Resources water-balance subregions (See figure C1 for location)<br />
CENTRAL VALLEY<br />
Sacramento Delta <strong>and</strong> Eastside San Joaquin<br />
Tulare<br />
1<br />
2<br />
3<br />
4<br />
5<br />
6<br />
7<br />
8<br />
9<br />
Figure C17. Plots of simulated water-level altitude values compared with the measured water-level altitudes for the A, Entire modeled<br />
area (<strong>and</strong> with inset with histogram of residuals). B, Sacramento <strong>Valley</strong>. C, Delta <strong>and</strong> Eastside. D, San Joaquin Basin. E, Tulare Basin.<br />
10<br />
11<br />
12<br />
13<br />
14<br />
15<br />
16<br />
18<br />
19<br />
<br />
<br />
<br />
<br />
-<br />
-<br />
<br />
<br />
<br />
<br />
<br />
<br />
-<br />
<br />
<br />
<br />
20<br />
21
166 Groundwater Availability of the <strong>Central</strong> <strong>Valley</strong> <strong>Aquifer</strong>, California<br />
SIMULATED HYDRAULIC HEAD, IN FEET<br />
B<br />
500<br />
300<br />
100<br />
0<br />
-100<br />
-100<br />
300<br />
100<br />
0<br />
-100<br />
D<br />
-300<br />
-100<br />
Figure C17. Continued.<br />
1 to 1 correlation line<br />
0 100<br />
300<br />
1 to 1 correlation line<br />
0 100<br />
300<br />
-100<br />
500<br />
-300<br />
-300<br />
<br />
<br />
<br />
<br />
southeastern part of the study area (<br />
<br />
<br />
<br />
().<br />
300<br />
100<br />
-100<br />
-300<br />
0<br />
500<br />
300<br />
100<br />
0<br />
-100<br />
0 100<br />
300<br />
-500<br />
-300 -100<br />
0 100<br />
300 500<br />
MEASURED WATER LEVELS, IN FEET<br />
EXPLANATION<br />
1 to 1 correlation line<br />
California Department of Water Resources water-balance subregions (See figure C1 for location)<br />
B Sacramento C Delta <strong>and</strong> Eastside D San Joaquin E Tulare<br />
1<br />
2<br />
3<br />
4<br />
5<br />
6<br />
7<br />
8<br />
9<br />
C<br />
E<br />
10<br />
11<br />
12<br />
13<br />
14<br />
15<br />
16<br />
18<br />
-<br />
-<br />
<br />
-<br />
<br />
<br />
<br />
<br />
<br />
19<br />
20<br />
21
-<br />
<br />
<br />
<br />
<br />
Water-Table <strong>and</strong> Potentiometric-Surface Maps<br />
Water-table <strong>and</strong> potentiometric-surface maps for the<br />
<br />
) (Williamson <strong>and</strong> others,<br />
<br />
<br />
<br />
<br />
<br />
<br />
<br />
altitudes for the simulation.<br />
<br />
<br />
<br />
<br />
<br />
<br />
<br />
<br />
<br />
<br />
<br />
<br />
( <strong>and</strong> <br />
-<br />
<br />
<br />
<br />
<br />
, 03b06329 <strong>and</strong><br />
-<br />
<br />
<br />
<br />
<br />
<br />
<br />
Sacramento <strong>Valley</strong><br />
-<br />
<br />
<br />
).<br />
<br />
<br />
<br />
Model Calibration <strong>and</strong> Sensitivity 167<br />
<br />
<br />
<br />
-<br />
<br />
<br />
some of the climatic effects accurately (<br />
<br />
potentiometric surface maps (<br />
<br />
<br />
<br />
<br />
<br />
-<br />
<br />
<br />
<strong>and</strong> mid-to-late 1990s (<br />
<br />
<br />
<br />
<br />
<br />
<br />
<br />
-<br />
<br />
<br />
<br />
<br />
<br />
-<br />
<br />
<br />
of the system (-<br />
<br />
<br />
Delta<br />
<br />
<br />
<br />
<br />
<br />
<br />
<br />
dent<br />
in the simulated potentiometric-surface maps ().<br />
<br />
<br />
<br />
(<br />
<br />
not in this area.
168 Groundwater Availability of the <strong>Central</strong> <strong>Valley</strong> <strong>Aquifer</strong>, California<br />
A<br />
Water-level difference, in feet,<br />
simulated minus estimated (Williamson<br />
<strong>and</strong> others, 1989)—<br />
Equal to or less than -50.0<br />
-49.9 to -25.0<br />
-24.9 to 0.0<br />
0.1 to 24.9<br />
25.0 to 49.9<br />
Equal to or greater than 50.0<br />
0 50 100 Miles<br />
0 50 100 Kilometers<br />
Shaded relief derived from U.S. Geological Survey<br />
National Elevation Dataset, 2006. Albers Equal Area Conic Projection<br />
Simulated water-level altitude,<br />
in feet. Spring, 1976—<br />
Model streams<br />
<strong>and</strong> canals<br />
EXPLANATION<br />
Active model grid<br />
boundary<br />
Model water-balance<br />
subregion<br />
Figure C18. The simulated A, Water-table altitude in spring 1976. B, Potentiometric-surface altitude in spring 1976, for the calibrated<br />
transient groundwater-flow model of the <strong>Central</strong> <strong>Valley</strong>. Residuals at observation points <strong>and</strong> areal differences between h<strong>and</strong>-drawn<br />
altitude maps also are shown. Maps showing the simulated water-table altitude <strong>and</strong> potentiometric-surface altitude in spring of 2000<br />
are shown in <strong>and</strong> .<br />
-160<br />
-120<br />
-80<br />
-40<br />
0<br />
40<br />
80<br />
120<br />
160<br />
200<br />
240<br />
280<br />
320<br />
360<br />
400<br />
440<br />
480<br />
Residual (Observed minus<br />
Simulated), in feet—<br />
-57.3 to -55<br />
-54.9 to -50<br />
-49.9 to -45<br />
-44.9 to -40<br />
-39.9 to -35<br />
-34.9 to -30<br />
-29.9 to -25<br />
-24.9 to -20<br />
-19.9 to -15<br />
-14.9 to -10<br />
-9.9 to -5<br />
-4.9 to 5<br />
5.1 to 10<br />
10.1 to 15<br />
15.1 to 20<br />
20.1 to 25<br />
25.1 to 30<br />
30.1 to 35<br />
35.1 to 40<br />
40.1 to 45<br />
45.1 to 50<br />
50.1 to 55<br />
55.1 to 60
B<br />
Potentiometric-surface difference, in feet,<br />
simulated minus estimated (Williamson<br />
<strong>and</strong> others, 1989)—<br />
0 50 100 Miles<br />
0 50 100 Kilometers<br />
Shaded relief derived from U.S. Geological Survey<br />
National Elevation Dataset, 2006. Albers Equal Area Conic Projection<br />
Figure C18. Continued.<br />
Equal to or less than -50.0<br />
-49.9 to -25.0<br />
-24.9 to 0.0<br />
0.1 to 24.9<br />
25.0 to 49.9<br />
Equal to or greater than 50.0<br />
Model Calibration <strong>and</strong> Sensitivity 169<br />
Model streams<br />
<strong>and</strong> canals<br />
EXPLANATION<br />
Simulated potentiometric-surface<br />
altitude, in feet. Spring, 1976—<br />
-160<br />
-120<br />
-80<br />
-40<br />
0<br />
40<br />
80<br />
120<br />
160<br />
200<br />
240<br />
280<br />
320<br />
360<br />
400<br />
440<br />
480<br />
Active model grid<br />
boundary<br />
Model water-balance<br />
subregion<br />
Residual (Observed minus<br />
Simulated), in feet—<br />
-57.3 to -55<br />
-54.9 to -50<br />
-49.9 to -45<br />
-44.9 to -40<br />
-39.9 to -35<br />
-34.9 to -30<br />
-29.9 to -25<br />
-24.9 to -20<br />
-19.9 to -15<br />
-14.9 to -10<br />
-9.9 to -5<br />
-4.9 to 5<br />
5.1 to 10<br />
10.1 to 15<br />
15.1 to 20<br />
20.1 to 25<br />
25.1 to 30<br />
30.1 to 35<br />
35.1 to 40<br />
40.1 to 45<br />
45.1 to 50<br />
50.1 to 55<br />
55.1 to 60
170 Groundwater Availability of the <strong>Central</strong> <strong>Valley</strong> <strong>Aquifer</strong>, California<br />
San Joaquin <strong>Valley</strong><br />
<br />
<br />
<br />
<br />
<br />
ships<br />
().<br />
<br />
<br />
<br />
<br />
<br />
<br />
<br />
<br />
<br />
<br />
<br />
<br />
<br />
<br />
<br />
().<br />
<br />
-<br />
<br />
-<br />
<br />
<br />
<br />
<br />
<br />
<br />
<br />
<br />
<br />
<br />
<br />
<br />
aquifer system ( <strong>and</strong> <br />
<br />
<br />
<strong>and</strong> ).<br />
<br />
<br />
-<br />
<strong>and</strong> ).<br />
<br />
-<br />
<br />
<br />
<br />
Tulare Basin<br />
<br />
<br />
<br />
<br />
-<br />
<br />
<br />
<br />
) indicate a<br />
<br />
<br />
<br />
<br />
<br />
<br />
<br />
simulation period. On the southeastern side of the basin,<br />
<br />
<br />
Streamflow Observations<br />
<br />
<br />
<br />
<br />
<br />
<br />
<br />
<br />
<br />
-<br />
<br />
<br />
-<br />
<br />
<br />
<br />
<br />
<br />
<br />
<br />
<br />
<br />
<br />
<br />
<br />
<br />
<br />
-<br />
<br />
<br />
in this area.
A<br />
Stony Creek<br />
Cache Creek<br />
Putah Creek<br />
0 50 100 Miles<br />
0 50 100 Kilometers<br />
Shaded relief derived from U.S. Geological Survey<br />
National Elevation Dataset, 2006. Albers Equal Area Conic Projection<br />
Stanislaus<br />
Tuolumne<br />
Merced<br />
San Joaquin<br />
STREAMFLOW<br />
Fresno<br />
San Joaquin<br />
Fresno Slough<br />
Model Calibration <strong>and</strong> Sensitivity 171<br />
EXPLANATION<br />
Groundwater/surface-water interaction,<br />
in acre-feet per year—<br />
GAIN<br />
LOSS<br />
Kings River<br />
-54.97 to -44.42<br />
-44.39 to -14.81<br />
-14.78 to -1.48<br />
-1.45 to 0<br />
0.03 to 1.48<br />
1.51 to 14.81<br />
14.84 to 44.42<br />
44.45 to 113.07<br />
Active model grid boundary<br />
Model stream cells<br />
Model water-balance subregions<br />
Kaweah River<br />
Kern River<br />
Out of groundwater<br />
system<br />
Into groundwater<br />
system<br />
Figure C19. Distribution of stream gain/loss segments used for model calibration. A, Measured gaining <strong>and</strong> losing reaches for selected<br />
stream reaches for 1961–1977. B, simulated gaining <strong>and</strong> losing reaches for selected stream reaches for 1961–1977 for the <strong>Central</strong> <strong>Valley</strong>,<br />
California.
172 Groundwater Availability of the <strong>Central</strong> <strong>Valley</strong> <strong>Aquifer</strong>, California<br />
B<br />
Stony Creek<br />
Cache Creek<br />
Putah Cr ek<br />
0 50 100 Miles<br />
0 50 100 Kilometers<br />
Shaded relief derived from U.S. Geological Survey<br />
National Elevation Dataset, 2006. Albers Equal Area Conic Projection<br />
Figure C19. Continued.<br />
Stanislaus<br />
Tuolumne<br />
Merced<br />
San Joaquin<br />
STREAMFLOW<br />
GAIN<br />
LOSS<br />
Fresno<br />
San Joaquin<br />
Fresno Slough<br />
EXPLANATION<br />
Groundwater/surface-water interaction,<br />
in acre-feet per year<br />
Kings River<br />
Less than -500<br />
-500 to -100<br />
-99.9 to -25<br />
Active model grid boundary<br />
Model water-balance subregions<br />
Kaweah River<br />
-24.9 to 0<br />
0.1 to 25<br />
25.1 to 100<br />
100.1 to 500<br />
Greater than 500<br />
Kern River<br />
Out of groundwater<br />
system<br />
Into groundwater<br />
system
-<br />
<br />
<br />
<br />
<br />
-<br />
<br />
<br />
<br />
-<br />
<br />
<br />
<br />
-<br />
<br />
(-<br />
<br />
<br />
<br />
<br />
<br />
<br />
<br />
<br />
Boundary Flow Observations<br />
<br />
<br />
-<br />
<br />
<br />
<br />
<br />
<br />
<br />
<br />
<br />
<br />
<br />
<br />
<br />
<br />
<br />
<br />
Model Calibration <strong>and</strong> Sensitivity 173<br />
<br />
-<br />
<br />
<br />
Subsidence Observations<br />
<br />
<br />
-<br />
<br />
<br />
<br />
<br />
<br />
<br />
-<br />
<br />
<strong>and</strong> ).<br />
-<br />
<br />
<br />
<br />
-<br />
<br />
<br />
).<br />
-<br />
<br />
<br />
-<br />
<br />
<br />
<br />
). Uplift also<br />
).<br />
pared<br />
to estimated-subsidence maps. The simulated subsidence<br />
<br />
<br />
( <strong>and</strong> -<br />
<br />
<br />
<br />
<br />
). In part, this subsidence likely is caused by the<br />
<br />
the measured declines, in these areas.
174 Groundwater Availability of the <strong>Central</strong> <strong>Valley</strong> <strong>Aquifer</strong>, California<br />
0 50 100 Miles<br />
0 50 100 Kilometers<br />
Shaded relief derived from U.S. Geological Survey<br />
National Elevation Dataset, 2006. Albers Equal Area Conic Projection<br />
1<br />
1<br />
2<br />
-1<br />
3<br />
5 7<br />
4<br />
7<br />
4<br />
3<br />
1<br />
5<br />
4<br />
8<br />
6<br />
3<br />
EXPLANATION<br />
Subsidence, in feet, from 1961 to 1975,<br />
(Williamson <strong>and</strong> others, 1989). Negative<br />
values indicate uplift—<br />
1<br />
2 2<br />
1<br />
Model streams <strong>and</strong> canals<br />
3<br />
-1 to 0<br />
1<br />
2 to 5<br />
6 to 10<br />
Active model grid boundary<br />
Model water-balance subregion<br />
Figure C20. Distribution of historical subsidence, estimated from 1961 to 1977 extensometer data, <strong>Central</strong> <strong>Valley</strong>, California (modified<br />
from Williamson <strong>and</strong> others, 1989).<br />
4<br />
4<br />
1<br />
2<br />
3
A<br />
11N/1E-24Q8<br />
1<br />
1<br />
1<br />
1<br />
12S/12E-16H2,3<br />
0 50 100 Miles<br />
0 50 100 Kilometers<br />
Shaded relief derived from U.S. Geological Survey<br />
National Elevation Dataset, 2006. Albers Equal Area Conic Projection<br />
1<br />
1<br />
14S/12E-12H1<br />
1<br />
10<br />
14S/13E-11D6<br />
15S/13E-11D2<br />
16S/15E-34N1<br />
17S/15E-14Q1<br />
18S/16E-33A1<br />
1<br />
20S/18E-6D1<br />
5<br />
5<br />
10<br />
5<br />
5<br />
18S/16E-33A1<br />
26S/23E-16H2, 3<br />
5<br />
5<br />
10 10<br />
20S/18E-6D1<br />
5<br />
Model Calibration <strong>and</strong> Sensitivity 175<br />
EXPLANATION<br />
Active model grid boundary<br />
Model streams <strong>and</strong> canals<br />
Model water-balance subregion<br />
Simulated subsidence 1962-2003, in feet<br />
1<br />
5<br />
10<br />
Subsidence observation locations<br />
13S/15E-31J3<br />
13S/15E-35D5<br />
15S/16E-31N3<br />
5<br />
10<br />
5<br />
10<br />
5<br />
10<br />
1<br />
18S/19E-20P2<br />
5<br />
23S/25E-16N1,3,4<br />
22S/27E-30D2<br />
24S/26E-34F1<br />
24S/26E-36A2<br />
25S/26E-1A2<br />
32S/28E-20Q1<br />
Figure C21. A, Distribution of total simulated subsidence for water years 1962 through 2003, <strong>and</strong> locations of subsidence measurements.<br />
B, Aggregate compaction measured at, <strong>and</strong> simulated subsidence for, selected extensometer locations, <strong>Central</strong> <strong>Valley</strong>, California.
176 Groundwater Availability of the <strong>Central</strong> <strong>Valley</strong> <strong>Aquifer</strong>, California<br />
B<br />
SIMULATED SUBSIDENCE, IN FEET<br />
7<br />
0<br />
10<br />
20<br />
11N/1E-24Q8<br />
26<br />
1960 1970 1980 1990 2000 2010<br />
7<br />
0<br />
10<br />
20<br />
12S/12E-16H2<br />
12S/12E-16H3<br />
13S/15E-31J3<br />
EXPLANATION<br />
Simulated subsidence Measured subsidence<br />
26<br />
1960 1970 1980 1990 2000 2010<br />
26<br />
26<br />
1960 1970 1980 1990 2000 2010 1960 1970 1980 1990 2000 2010<br />
7<br />
0<br />
10<br />
20<br />
26<br />
26<br />
1960 1970 1980 1990 2000 2010 1960 1970 1980 1990 2000 2010<br />
7<br />
0<br />
10<br />
20<br />
WATER YEAR WATER YEAR<br />
7<br />
0<br />
10<br />
20<br />
7<br />
0<br />
10<br />
20<br />
7<br />
0<br />
10<br />
20<br />
13S/15E-35D5<br />
14S/12E-12H1<br />
14S/13E-11D6<br />
15S/13E-11D2<br />
26<br />
26<br />
1960 1970 1980 1990 2000 2010 1960 1970 1980 1990 2000 2010<br />
Figure C21. Continued.<br />
7<br />
0<br />
10<br />
20
B (Cont.)<br />
SIMULATED SUBSIDENCE, IN FEET<br />
7<br />
0<br />
10<br />
20<br />
26<br />
1960 1970 1980 1990 2000 2010<br />
7<br />
0<br />
10<br />
20<br />
Figure C21. Continued.<br />
EXPLANATION<br />
Simulated subsidence Measured subsidence<br />
Model Calibration <strong>and</strong> Sensitivity 177<br />
18S/19E-20P2<br />
26<br />
1960 1970 1980 1990 2000 2010<br />
20S/18E-6D1<br />
26<br />
26<br />
1960 1970 1980 1990 2000 2010 1960 1970 1980 1990 2000 2010<br />
7<br />
0<br />
10<br />
20<br />
22S/27E-30D2<br />
26<br />
26<br />
1960 1970 1980 1990 2000 2010 1960 1970 1980 1990 2000 2010<br />
7<br />
0<br />
10<br />
20<br />
15S/16E-31N3<br />
16S/15E-34N1<br />
17S/15E-14Q1<br />
18S/16E-33A1<br />
WATER YEAR WATER YEAR<br />
7<br />
0<br />
10<br />
20<br />
7<br />
0<br />
10<br />
20<br />
7<br />
0<br />
10<br />
20<br />
23S/25E-16N1<br />
26<br />
26<br />
1960 1970 1980 1990 2000 2010 1960 1970 1980 1990 2000 2010<br />
7<br />
0<br />
10<br />
20
178 Groundwater Availability of the <strong>Central</strong> <strong>Valley</strong> <strong>Aquifer</strong>, California<br />
B (Cont.)<br />
SIMULATED SUBSIDENCE, IN FEET<br />
26<br />
1960 1970 1980 1990 2000 2010<br />
Figure C21. Continued.<br />
7<br />
0<br />
10<br />
20<br />
7<br />
0<br />
10<br />
20<br />
23S/25E-16N4<br />
24S/26E-34F1<br />
EXPLANATION<br />
Simulated subsidence Measured subsidence<br />
25S/26E-1A2<br />
26<br />
1960 1970 1980 1990 2000 2010<br />
26<br />
26<br />
1960 1970 1980 1990 2000 2010 1960 1970 1980 1990 2000 2010<br />
7<br />
0<br />
10<br />
20<br />
26S/23E-16H3<br />
26<br />
26<br />
1960 1970 1980 1990 2000 2010 1960 1970 1980 1990 2000 2010<br />
7<br />
0<br />
10<br />
20<br />
24S/26E-36A2<br />
23S/25E-16N3<br />
WATER YEAR WATER YEAR<br />
7<br />
0<br />
10<br />
20<br />
7<br />
0<br />
10<br />
20<br />
7<br />
0<br />
10<br />
20<br />
32S/28E-20Q1<br />
26<br />
26<br />
1960 1970 1980 1990 2000 2010 1960 1970 1980 1990 2000 2010<br />
7<br />
0<br />
10<br />
20<br />
26S/23E-16H2
-<br />
<br />
<br />
-<br />
), they likely<br />
-<br />
<br />
<br />
<br />
<br />
<br />
<br />
-<br />
<br />
<br />
<br />
<br />
-<br />
<br />
<br />
<br />
<br />
<br />
<br />
<br />
<br />
<br />
<br />
<br />
Pumpage Observations<br />
-<br />
-<br />
<br />
<br />
<br />
<br />
<br />
<br />
<br />
<br />
<br />
<br />
<br />
<br />
<br />
<br />
-<br />
<br />
<br />
<br />
<br />
Model Calibration <strong>and</strong> Sensitivity 179<br />
). In particular, the<br />
trends are matched. The simulation matches closely in drier<br />
<br />
<br />
<br />
<br />
<br />
the proportions <strong>and</strong> total 21 million acre-ft of annual farm<br />
<br />
(1989).<br />
-<br />
<br />
-<br />
<br />
<br />
<br />
<br />
<br />
<br />
<br />
<br />
<br />
<br />
<br />
). This most likely is a<br />
<br />
<br />
<br />
<br />
<br />
<br />
<br />
contradict this.<br />
Water-Use Observations<br />
<br />
<br />
most of the factors used in its calculation are indirect measure-<br />
<br />
<br />
-<br />
<br />
<br />
<br />
<br />
-<br />
<br />
some cases, is less than those estimated by Williamson (1982).<br />
<br />
<br />
<br />
<br />
), the amount of
180 Groundwater Availability of the <strong>Central</strong> <strong>Valley</strong> <strong>Aquifer</strong>, California<br />
PUMPAGE, IN MILLIONS OF ACRE-FEET PER YEAR<br />
16<br />
12<br />
8<br />
4<br />
Table C9. Estimated <strong>and</strong> <strong>Central</strong> <strong>Valley</strong> Hydrologic Model-simulated average <strong>and</strong> unit evapotranspiration of applied water (ETaw) for<br />
the <strong>Central</strong> <strong>Valley</strong>, California.<br />
<br />
Basin<br />
"Variable"<br />
to<br />
Dry<br />
"Variable"<br />
to<br />
Wet<br />
Area<br />
(square<br />
miles)<br />
Dry<br />
Wet Dry<br />
Wet<br />
Estimated unit (average)<br />
ETaw 1957–1961 ETaw 1966-–1973 ETaw 1968–1978<br />
"Variable"<br />
to<br />
Dry<br />
0<br />
1962 1964 1966 1968 1970 1972 1974 1976 1978 1980 1982 1984 1986 1988 1990 1992 1994 1996 1998 2000 2002<br />
Simulated ETaw<br />
average<br />
(1962–2003)<br />
5,981 2.4 (2.49) 2.3 (2.84) 1.9 (3.04) 1.8 (2.20)<br />
2,388 2.2 (1.86) 2.1 (1.96) 1.8 (1.91) 1.9 (1.00)<br />
3,782 2.5 (2.76) 2.0 (2.48) 2.3 (3.16) 2.3 (2.90)<br />
7,780 2.1 (4.46) 2.2 (6.390) 2.2 (7.13) 2.3 (8.20)<br />
19,389 2.3 (11.57) 2.1 (13.67) 2.1 (15.24) 2.1( 14.30)<br />
YEAR<br />
EXPLANATION<br />
Simulated agricultural<br />
Estimated from<br />
power usage<br />
Figure C22. Agricultural pumpage from 1961–77 estimated from power records (Diamond <strong>and</strong> Williamson, 1983) compared to <strong>Central</strong><br />
<strong>Valley</strong> Hydrologic Model simulated agricultural pumpage for the <strong>Central</strong> <strong>Valley</strong>, California.
Water-Delivery Observations<br />
<br />
<br />
<br />
<br />
<br />
<br />
<br />
<br />
<br />
<br />
<br />
).<br />
<br />
<br />
<br />
<br />
<br />
<br />
<br />
<br />
<br />
<br />
<br />
<br />
<br />
<br />
<br />
<br />
<br />
<br />
<br />
Model Parameters<br />
-<br />
<br />
<br />
<br />
-<br />
<br />
<br />
<br />
Model Calibration <strong>and</strong> Sensitivity 181<br />
<br />
<br />
<br />
<br />
<br />
<br />
<br />
less than ten estimated at any one time. These parameters<br />
included hydraulic properties of the aquifer system, streambed<br />
<br />
(<br />
<br />
mated<br />
parameters.<br />
<br />
<br />
-<br />
<br />
<br />
<br />
<br />
<br />
-<br />
<br />
<br />
” section<br />
of this report, K h <strong>and</strong> K v <br />
<br />
K <strong>and</strong> K <br />
K h <br />
K v <br />
<br />
initial calibration efforts, the same end-member hydraulic con-<br />
<br />
<br />
<br />
<br />
K <strong>and</strong> K <br />
<br />
<br />
<br />
<br />
mean (<br />
<br />
system there (). The estimated end-member hydraulic<br />
<br />
<br />
().
182 Groundwater Availability of the <strong>Central</strong> <strong>Valley</strong> <strong>Aquifer</strong>, California<br />
A<br />
B<br />
SURFACE-WATER DELIVERIES, IN MILLIONS OF ACRE-FEET PER YEAR<br />
SURFACE-WATER DELIVERIES, IN THOUSANDS OF ACRE-FEET PER YEAR<br />
1.6<br />
1.2<br />
0.8<br />
0.4<br />
"Variable"<br />
to<br />
Dry<br />
"Variable"<br />
to<br />
Wet<br />
Dry<br />
Wet Dry<br />
Wet<br />
"Variable"<br />
to<br />
Dry<br />
0<br />
1962 1964 1966 1968 1970 1972 1974 1976 1978 1980 1982 1984 1986 1988 1990 1992 1994 1996 1998 2000 2002<br />
300<br />
250<br />
200<br />
150<br />
100<br />
50<br />
0<br />
YEAR<br />
1977 1978 1979 1980 1981 1982 1983 1984<br />
WATER YEAR<br />
EXPLANATION<br />
Deliveries taken (modeled) Deliveries available<br />
Figure C23. A, Annual water deliveries. B, monthly water deliveries from the mid 1970s to mid 1980s for water-balance subregion 14.
CROP COEFFICIENT, UNITLESS<br />
1.20<br />
1.00<br />
0.80<br />
0.60<br />
0.40<br />
0.20<br />
0.00<br />
JAN FEB MAR APR MAY JUN<br />
MONTH<br />
EXPLANATION<br />
<br />
<br />
<br />
<br />
<br />
<br />
<br />
<br />
<br />
K<br />
model layers <strong>and</strong> 0.5, 0.37, 0.24, 0.15, <strong>and</strong> 0.08 for layers<br />
<br />
<br />
).<br />
<br />
<br />
<strong>and</strong> <br />
<br />
-<br />
<br />
<br />
-<br />
<br />
<br />
<br />
Single cropped<br />
Double cropped<br />
Figure C24. Single <strong>and</strong> double cropped crop coefficient values for truck crops.<br />
Model Calibration <strong>and</strong> Sensitivity 183<br />
JUL AUG SEP OCT NOV DEC<br />
<br />
<br />
<br />
<br />
<br />
-<br />
<br />
<br />
<br />
). Trends in subsidence<br />
that are inaccurately simulated indicate some error in the<br />
<br />
eter<br />
to estimate accurately.<br />
<br />
<br />
<br />
<br />
<br />
<br />
-
184 Groundwater Availability of the <strong>Central</strong> <strong>Valley</strong> <strong>Aquifer</strong>, California<br />
A<br />
B<br />
EVAPOTRANSPIRATION, IN INCHES<br />
EVAPOTRANSPIRATION, IN INCHES<br />
12<br />
10<br />
8<br />
6<br />
4<br />
2<br />
0<br />
12<br />
10<br />
8<br />
6<br />
4<br />
2<br />
0<br />
TRUCK CROPS<br />
JAN FEB MAR APR MAY JUN<br />
COTTON CROPS<br />
JAN FEB MAR APR MAY JUN<br />
MONTH<br />
MONTH<br />
EXPLANATION<br />
Crop evapotranspiration<br />
JUL AUG SEP OCT NOV DEC<br />
JUL AUG SEP OCT NOV DEC<br />
Adjusted evapotranspiration<br />
Figure C25. Original <strong>and</strong> adjusted crop coefficient values for truck <strong>and</strong> cotton crops.
Table C10. Parameter values estimated for the <strong>Central</strong> <strong>Valley</strong> Hydrologic Model.<br />
Table C10. Parameter values estimated for the <strong>Central</strong> <strong>Valley</strong> Hydrologic Model.—Continued<br />
<br />
<br />
Parameter<br />
name<br />
Parameter<br />
description<br />
Value Units<br />
Model Calibration <strong>and</strong> Sensitivity 185<br />
Estimated<br />
using<br />
automated<br />
methods<br />
Composite<br />
scaled<br />
sensitivity<br />
Parameter<br />
group<br />
L<strong>and</strong>-use Properties<br />
10.55 feet yes 1.37 <br />
<br />
<br />
<br />
<br />
<br />
<br />
<br />
<br />
<br />
for urban l<strong>and</strong>-use class<br />
<br />
<br />
class<br />
<br />
<br />
<br />
for idle l<strong>and</strong>-use class<br />
<br />
<br />
<br />
<br />
class<br />
<br />
deciduous l<strong>and</strong>-use class<br />
<br />
rice l<strong>and</strong>-use class<br />
<br />
citrus l<strong>and</strong>-use class<br />
<br />
pasture l<strong>and</strong>-use class<br />
<br />
<br />
<br />
<br />
class<br />
<br />
truck crop l<strong>and</strong>-use class<br />
<br />
<br />
<br />
<br />
<br />
deciduous l<strong>and</strong>-use class<br />
<br />
rice l<strong>and</strong>-use class<br />
<br />
cotton l<strong>and</strong>-use class<br />
<br />
other l<strong>and</strong>-use class<br />
properties<br />
0.98 multiplier yes 1.1810 2 <br />
properties<br />
1.18 multiplier yes 2.2010 1 <br />
properties<br />
Runoff<br />
5.00 yes 1.671010 <br />
properties<br />
1.50 yes 1.23 <br />
properties<br />
20.71 yes 3.76 <br />
properties<br />
10.25 yes 1.41 <br />
properties<br />
6.04 yes 1.38 <br />
properties<br />
1.30 yes 3.64 <br />
properties<br />
32.29 yes 6.67109 <br />
properties<br />
10.67 yes 1.34 <br />
properties<br />
10.62 yes 3.52 <br />
properties<br />
1.00 yes 1.23 <br />
properties<br />
1.72 yes 2.671011 <br />
properties<br />
6.08 yes 1.01 <br />
properties<br />
4.46 yes 1.23 <br />
properties<br />
10.00 yes 1.40 <br />
properties<br />
7.72 yes 1.24 <br />
properties<br />
1.20 yes 1.40 <br />
properties<br />
4.82 yes 3.66 <br />
properties<br />
3.00 yes 1.001010 <br />
properties<br />
10.16 yes 2.001010 <br />
properties<br />
7.76 yes 1.28 <br />
properties
186 Groundwater Availability of the <strong>Central</strong> <strong>Valley</strong> <strong>Aquifer</strong>, California<br />
Table C10. Parameter values estimated for the <strong>Central</strong> <strong>Valley</strong> Hydrologic Model.—Continued<br />
<br />
Parameter<br />
name<br />
Parameter<br />
description<br />
Value Units<br />
Estimated<br />
using<br />
automated<br />
methods<br />
Composite<br />
scaled<br />
sensitivity<br />
Parameter<br />
group<br />
Soil Properties<br />
<br />
9.08 feet yes 3.51 <br />
silty-clay<br />
properties<br />
7.10 feet yes 1.12 <br />
properties<br />
<br />
9.32 feet yes 3.81 <br />
s<strong>and</strong>y-loam<br />
properties<br />
Irrigation efficiency<br />
0.971 multiplier yes 2.4710<br />
<br />
1964<br />
1 <br />
properties<br />
0.991 multiplier yes 1.5310<br />
<br />
1977<br />
10 <br />
properties<br />
1.030 multiplier no 6.7510<br />
<br />
1 <br />
properties<br />
1.040 multiplier no 2.46 <br />
<br />
properties<br />
1.050 multiplier no 2.42 <br />
<br />
properties<br />
1.060 multiplier no 1.86 <br />
<br />
properties<br />
1.065 multiplier no 3.06 <br />
<br />
properties<br />
1.070 multiplier no 6.66 <br />
<br />
properties<br />
1.074 multiplier yes 1.3210<br />
<br />
2003<br />
1 <br />
properties<br />
60.30 yes 4.51 <br />
<br />
properties<br />
80.00 yes 1.21 <br />
properties<br />
Hydraulic Conductivity<br />
<br />
<br />
<br />
672.93 feet/day yes 4.091011 <br />
<br />
<br />
<br />
0.24 feet/day yes 1.26101 <br />
<br />
<br />
<br />
4921.50 feet/day yes 2.71 <br />
<br />
<br />
<br />
0.08 feet/day yes 4.42 <br />
<br />
<br />
1.57 feet/day yes 4.17107 <br />
0.17 feet/day yes 1.33 <br />
<br />
multipliers<br />
<br />
the dissected upl<strong>and</strong>s<br />
0.68 feet/day yes 1.40101 <br />
1.57 feet/day yes 1.26 <br />
bedrock<br />
multipliers
Table C10. Parameter values estimated for the <strong>Central</strong> <strong>Valley</strong> Hydrologic Model.—Continued<br />
<br />
Parameter<br />
name<br />
Parameter<br />
description<br />
Value Units<br />
Model Calibration <strong>and</strong> Sensitivity 187<br />
Estimated<br />
using<br />
automated<br />
methods<br />
Composite<br />
scaled<br />
sensitivity<br />
Parameter<br />
group<br />
0.17 feet/day yes 2.64 <br />
<br />
multipliers<br />
0.68 feet/day yes 1.93 <br />
the dissected upl<strong>and</strong>s<br />
multipliers<br />
Multiplier on hydraulic properties of Corcoran Clay<br />
0.010 multiplier yes 1.35 <br />
<br />
multipliers<br />
<br />
0.002 multiplier yes 7.45 <br />
<br />
multipliers<br />
Horizontal Conductivity Depth Decay<br />
1.000 multiplier no 2.35 <br />
<br />
multipliers<br />
1.000 multiplier no 1.8310<br />
<br />
11 <br />
multipliers<br />
0.181 multiplier yes 2.0810<br />
<br />
14)<br />
10 <br />
multipliers<br />
0.914 multiplier yes 1.46 <br />
<br />
multipliers<br />
0.614 multiplier yes 3.8410<br />
<br />
11 <br />
multipliers<br />
0.100 multiplier no 9.59 <br />
<br />
multipliers<br />
0.370 multiplier no 4.1910<br />
<br />
1 <br />
multipliers<br />
0.240 multiplier no 1.0010<br />
<br />
11 <br />
multipliers<br />
0.075 multiplier no 8.59 <br />
<br />
multipliers<br />
0.240 multiplier no 4.1710<br />
<br />
1 <br />
multipliers<br />
0.180 multiplier no 4.1710<br />
<br />
10 <br />
multipliers<br />
- 0.060 multiplier no 4.36 <br />
<br />
multipliers<br />
0.150 multiplier no 1.52 <br />
<br />
multipliers<br />
0.040 multiplier no 1.84 <br />
<br />
multipliers<br />
0.040 multiplier no 3.14 <br />
<br />
multipliers<br />
0.080 multiplier no 1.0010<br />
<br />
11 <br />
multipliers<br />
0.020 multiplier no 1.73 <br />
<br />
multipliers<br />
0.020 multiplier no 1.4210<br />
<br />
11 <br />
multipliers
188 Groundwater Availability of the <strong>Central</strong> <strong>Valley</strong> <strong>Aquifer</strong>, California<br />
Table C10. Parameter values estimated for the <strong>Central</strong> <strong>Valley</strong> Hydrologic Model.—Continued<br />
<br />
Parameter<br />
name<br />
Parameter<br />
description<br />
Value Units<br />
Estimated<br />
using<br />
automated<br />
methods<br />
Composite<br />
scaled<br />
sensitivity<br />
Parameter<br />
group<br />
Vertical Conductivity Depth Decay<br />
1.000 multiplier no 1.61 <br />
<br />
multipliers<br />
1.000 multiplier no 5.94 <br />
<br />
multipliers<br />
0.180 multiplier no 2.18 <br />
<br />
14)<br />
multipliers<br />
0.663 multiplier yes 1.67 <br />
<br />
multipliers<br />
0.463 multiplier yes 5.34 <br />
<br />
multipliers<br />
0.150 multiplier no 1.61 <br />
<br />
multipliers<br />
0.370 multiplier no 1.40 <br />
<br />
multipliers<br />
0.200 multiplier no 2.14 <br />
<br />
multipliers<br />
0.100 multiplier no 1.53 <br />
<br />
multipliers<br />
0.240 multiplier no 1.62 <br />
<br />
multipliers<br />
0.150 multiplier no 1.78 <br />
<br />
multipliers<br />
0.060 multiplier no 1.66 <br />
<br />
multipliers<br />
0.150 multiplier no 1.94 <br />
<br />
multipliers<br />
0.040 multiplier no 4.1710<br />
<br />
10 <br />
multipliers<br />
0.040 multiplier no 1.51 <br />
<br />
multipliers<br />
0.080 multiplier no 4.0010<br />
<br />
11 <br />
multipliers<br />
0.020 multiplier no 2.52 <br />
<br />
multipliers<br />
0.020 multiplier no 1.2510<br />
<br />
10 <br />
multipliers
Table C10. Parameter values estimated for the <strong>Central</strong> <strong>Valley</strong> Hydrologic Model.—Continued<br />
<br />
Parameter<br />
name<br />
Parameter<br />
description<br />
Value Units<br />
Model Calibration <strong>and</strong> Sensitivity 189<br />
Estimated<br />
using<br />
automated<br />
methods<br />
Composite<br />
scaled<br />
sensitivity<br />
Conductance<br />
3281.00 feet/day no 1.36 <br />
<br />
<br />
<br />
<br />
<br />
<br />
<br />
<br />
<br />
<br />
<br />
<br />
<br />
<br />
<br />
<br />
<br />
<br />
<br />
<br />
<br />
<br />
<br />
<br />
<br />
<br />
<br />
Stream Bed Hydraulic Conductivity<br />
Parameter<br />
group<br />
0.04 feet/day yes 1.70 <br />
<br />
0.16 feet/day yes 1.101011 <br />
<br />
0.48 feet/day yes 4.58 <br />
<br />
2.71 feet/day yes 1.49 <br />
<br />
0.33 feet/day yes 1.21 <br />
<br />
5.64 feet/day yes 2.3710 11 <br />
<br />
3.31 feet/day yes 1.3310 10 <br />
<br />
0.19 feet/day yes 1.40 <br />
<br />
Storage Properties<br />
<br />
<br />
<br />
1.33 multiplier yes 5.93 <br />
<br />
deposits<br />
25.00 no 1.26 <br />
<br />
deposits<br />
50.00 no 2.371011 <br />
<br />
dissected upl<strong>and</strong>s<br />
1.00 multiplier yes 3.33109 <br />
<br />
<br />
1.00 multiplier yes 5.73 <br />
1.37E-04 per foot yes 6.67109
190 Groundwater Availability of the <strong>Central</strong> <strong>Valley</strong> <strong>Aquifer</strong>, California<br />
0 50 100 Miles<br />
0 50 100 Kilometers<br />
Shaded relief derived from U.S. Geological Survey<br />
National Elevation Dataset, 2006. Albers Equal Area Conic Projection<br />
EXPLANATION<br />
Stream cell hydraulic conductivity,<br />
in feet per day—<br />
0.0413406<br />
0.0564332<br />
0.16405<br />
0.193579<br />
0.326131<br />
0.3281<br />
0.479026<br />
0.588939<br />
1.29271<br />
2.71358<br />
3.31381<br />
5.63676<br />
32.81<br />
328.133<br />
(K_SACRIVN)<br />
(K_TRIB_NWB)<br />
(K_SACRIV)<br />
(K_TRIB_SW)<br />
(K_TRIB_NE)<br />
(K_OTHER1)<br />
(K_SJRIV)<br />
(K_TRIB_SEB)<br />
(K_TRIB_NEB)<br />
(K_SO_RIV)<br />
(K_TRIB_SE)<br />
(K_TRIB_NW)<br />
(K_OTHER2)<br />
(K_TRIB_SEC)<br />
Active model grid boundary<br />
Model water-balance subregions<br />
Inflow locations<br />
Figure C26. Distribution of cells used for streams, colored by streambed hydraulic conductivity values for cells estimated during<br />
calibration.
Sensitivity Analysis<br />
<br />
-<br />
<br />
<br />
limited the use of systematic parameter-estimation techniques<br />
-<br />
<br />
estimation techniques based on perturbation approaches for<br />
<br />
<br />
<br />
used to identify the parameters to include in the parameter<br />
<br />
<br />
<br />
<br />
-<br />
<br />
<br />
<br />
-<br />
<br />
<br />
<br />
(<br />
<br />
K -<br />
<br />
<br />
-<br />
<br />
<br />
-<br />
<br />
-<br />
<br />
<br />
<br />
<br />
<br />
<br />
<br />
<br />
<br />
Simulation Results <strong>and</strong> Budget 191<br />
Simulation Results <strong>and</strong> Budget<br />
<br />
<br />
<br />
-<br />
<br />
42-year simulation. This chapter focuses on the simulation of<br />
<br />
<br />
<br />
are the focus of .<br />
<br />
<br />
<br />
<br />
<br />
<br />
<br />
<br />
<br />
<br />
<br />
aquifer-system compaction <strong>and</strong> l<strong>and</strong> subsidence.<br />
<br />
<br />
<br />
( <strong>and</strong>
192 Groundwater Availability of the <strong>Central</strong> <strong>Valley</strong> <strong>Aquifer</strong>, California<br />
COMPOSITE SCALED SENSITIVITY, UNITLESS<br />
10 12<br />
10 10<br />
10 8<br />
10 6<br />
10 4<br />
10 2<br />
10 0<br />
KC<br />
VK_LN10_VF<br />
HK_LS6_VF<br />
PAS_IRO<br />
K_TRIB_NW<br />
PHI_F<br />
Recharge <strong>and</strong> Discharge<br />
<br />
<br />
<br />
<br />
<br />
<br />
-<br />
<br />
HK_US_VF<br />
HK_WS10_VF<br />
K_SACRIVN<br />
HK_LN10_VF<br />
HK_LS7_VF<br />
HK_LS8_VF<br />
Parameter groups—<br />
VK_LS9_VF<br />
Hydraulic conductivity<br />
HK_UWS_VF<br />
COT_IRO<br />
H2O_PRO<br />
EFF_MLT2<br />
PARAMETER IDENTIFIER<br />
Hydraulic conductivity multipliers<br />
Farm process properties<br />
EXPLANATION<br />
K_TRIB_SE<br />
RIC_IRO<br />
SEM_PRO<br />
Storage properties<br />
SUB_I<br />
Streambed conductance<br />
Figure C27. Relative composite sensitivity of computed water-level altitudes, flows, <strong>and</strong> subsidence information at calibration points to<br />
changes in parameters. Composite scaled sensitivity values are used here to show relative sensitivity; the definition <strong>and</strong> derivation are<br />
described in Hill <strong>and</strong> others (2000). The top 30 composite scaled sensitivities are plotted.<br />
VK_WS10_VF<br />
SS_QPC_MULT<br />
HK_BEDRX<br />
-<br />
<br />
<br />
-<br />
<strong>and</strong> <strong>and</strong><br />
<br />
<br />
<br />
<br />
mechanisms.<br />
KC_S<br />
HK_LN7_VF<br />
HK_LN8_VF<br />
EFF_MLT1<br />
KC_W<br />
HK_QPC
23%<br />
FLOW RANGE, IN MILLIONS OF ACRE-FEET PER YEAR<br />
17%<br />
p<br />
nrd<br />
srdin<br />
wells<br />
egwin<br />
tgwin<br />
7%<br />
20<br />
15<br />
10<br />
5<br />
0<br />
-5<br />
-10<br />
-15<br />
3%<br />
INFLOWS<br />
Precipitation<br />
p<br />
nrd<br />
10%<br />
Non-routed deliveries<br />
into farm<br />
Semi-routed deliveries<br />
into farm<br />
Groundwater well pumping<br />
deliveries into farm<br />
Evaporation from groundwater<br />
into the farm<br />
Transpiration from groundwater<br />
into the farm<br />
srd in<br />
wells<br />
40%<br />
egwin tgwin<br />
ei<br />
egwout<br />
ep<br />
egw out<br />
ti<br />
3%<br />
30%<br />
3%<br />
tp<br />
8%<br />
Evaporation from irrigation<br />
out of the farm<br />
Evaporation from precipitation<br />
out of the farm<br />
Evaporation from groundwater<br />
out of the farm<br />
Transpiration from irrigation<br />
out of the farm<br />
Transpiration from precipitation<br />
out of the farm<br />
tgw out run<br />
Figure C28. Average annual components of farm budget for water years 1962–2003.<br />
ei<br />
ep<br />
ti<br />
tp<br />
dp<br />
Simulation Results <strong>and</strong> Budget 193<br />
8%<br />
OUTFLOWS<br />
tgwout<br />
run<br />
dp<br />
29%<br />
12%<br />
7%<br />
Transpiration from groundwater<br />
out of the farm<br />
Overl<strong>and</strong> runoff out<br />
of the farm<br />
Deep percolation out<br />
of the farm
194 Groundwater Availability of the <strong>Central</strong> <strong>Valley</strong> <strong>Aquifer</strong>, California<br />
WATER FLOW, IN MILLIONS OF ACRE-FEET PER YEAR<br />
60<br />
40<br />
20<br />
0<br />
-20<br />
-40<br />
-60<br />
1962 1964 1966 1968 1970 1972 1974 1976 1978 1980 1982 1984 1986 1988 1990 1992 1994 1996 1998 2000 2002<br />
Evapotranspiration<br />
Runoff<br />
Deep percolation<br />
-<br />
<br />
<br />
( <strong>and</strong> <strong>and</strong> , , <strong>and</strong> <br />
1962 <strong>and</strong> 2003, <br />
-<br />
<br />
<br />
<br />
<br />
-<br />
<br />
YEAR<br />
EXPLANATION<br />
Figure C29. Farm budget changes through time for the <strong>Central</strong> <strong>Valley</strong>, California.<br />
Evapotranspiration from groundwater<br />
Groundwater pumpage<br />
Surface-water deliveries<br />
Precipitation<br />
Flow into l<strong>and</strong>scape<br />
system<br />
Flow out of l<strong>and</strong>scape<br />
system<br />
<br />
-<br />
<br />
<br />
<br />
son<br />
<strong>and</strong> others (1989) (<br />
<br />
).
A<br />
ESTIMATED WATER USAGE,<br />
IN MILLIONS OF ACRE-FEET PER YEAR<br />
B<br />
ESTIMATED WATER USAGE,<br />
IN MILLIONS OF ACRE-FEET PER YEAR<br />
6<br />
5<br />
4<br />
3<br />
2<br />
1<br />
0<br />
6<br />
5<br />
4<br />
3<br />
2<br />
1<br />
0<br />
Simulation Results <strong>and</strong> Budget 195<br />
"Variable"<br />
to<br />
Dry Wet<br />
Dry Wet<br />
1962 1964 1966 1968 1970 1972 1974 1976 1978 1980 1982<br />
WATER YEAR<br />
1977 1978 1979 1980 1981 1982 1983 1984 1985<br />
WATER YEAR<br />
Total farm delivery requirements<br />
Routed surface-water deliveries<br />
EXPLANATION<br />
Non-routed surface-water deliveries<br />
Groundwater pumpage<br />
Figure C30. Farm budget changes through time for water-balance subregion 13, western San Joaquin <strong>Valley</strong>, <strong>Central</strong> <strong>Valley</strong>, California.<br />
A, Water years 1962–2003. B, Water years 1977–1985.
196 Groundwater Availability of the <strong>Central</strong> <strong>Valley</strong> <strong>Aquifer</strong>, California<br />
A (continued)<br />
Wet Dry<br />
Wet<br />
<br />
to year <strong>and</strong> month to month (<br />
<br />
<br />
<br />
opposite effects.<br />
Water pumped from the aquifer system may or may not<br />
<br />
<br />
<br />
areas, replenishment only occurs in years of abundant precipi-<br />
<br />
<br />
<br />
"Variable"<br />
to<br />
Dry<br />
1983 1985 1987 1989 1991 1993 1995 1997 1999 2001 2003<br />
WATER YEAR<br />
Figure C30. Continued.<br />
ESTIMATED WATER USAGE,<br />
IN MILLIONS OF ACRE-FEET PER YEAR<br />
<br />
<br />
<br />
<br />
-<br />
<br />
<br />
this report.<br />
6<br />
5<br />
4<br />
3<br />
2<br />
1<br />
0
WATER FLOW, IN MILLIONS OF ACRE-FEET PER YEAR<br />
A<br />
40<br />
30<br />
20<br />
10<br />
0<br />
-10<br />
-20<br />
-30<br />
<strong>Aquifer</strong>-System Storage<br />
<br />
<br />
( <strong>and</strong> <br />
<br />
-<br />
<br />
<br />
Simulation Results <strong>and</strong> Budget 197<br />
-40<br />
1962 1964 1966 1968 1970 1972 1974 1976 1978 1980 1982 1984 1986 1988 1990 1992 1994 1996 1998 2000 2002<br />
L<strong>and</strong>scape recharge<br />
General-head boundary<br />
Farm wells<br />
Pumpage<br />
Stream leakage<br />
Subsidence<br />
Storage<br />
YEAR<br />
EXPLANATION<br />
Groundwater Surface water<br />
L<strong>and</strong>scape recharge<br />
General-head boundary<br />
Pumpage<br />
Figure C31. Groundwater budget changes through time for the <strong>Central</strong> <strong>Valley</strong>. A, All values. B, Net values.<br />
Stream leakage<br />
Subsidence<br />
Storage<br />
Flow into groundwater<br />
system<br />
Flow from groundwater<br />
system<br />
<br />
<br />
<strong>and</strong> <br />
<br />
<br />
-
198 Groundwater Availability of the <strong>Central</strong> <strong>Valley</strong> <strong>Aquifer</strong>, California<br />
WATER FLOW, IN MILLIONS OF ACRE-FEET PER YEAR<br />
B<br />
20<br />
15<br />
10<br />
5<br />
0<br />
-5<br />
-10<br />
-15<br />
-20<br />
1962 1964 1966 1968 1970 1972 1974 1976 1978 1980 1982 1984 1986 1988 1990 1992 1994 1996 1998 2000 2002<br />
Figure C31. Continued.<br />
Specific yield <strong>and</strong><br />
compressibility of water<br />
General-head boundary<br />
YEAR<br />
EXPLANATION<br />
Elastic <strong>and</strong> inelastic storage<br />
Stream leakage<br />
L<strong>and</strong>scape recharge<br />
Pumpage<br />
Flow into groundwater<br />
system<br />
Flow out of groundwater<br />
system
Table C11. Simulated farm budget for the <strong>Central</strong> <strong>Valley</strong>, California, in acre-feet per year.<br />
bold italicbolditalic.<br />
Year Precipitation<br />
Surface-water<br />
deliveries<br />
Groundwater<br />
pumpage<br />
Evapotrans- piration<br />
Runoff<br />
Simulation Results <strong>and</strong> Budget 199<br />
Evapotrans-<br />
piration from<br />
groundwater<br />
Deep percolation<br />
1962 14,281,000 10,808,000 11,271,000 25,505,000 1,310,000 3,522,000 12,967,000<br />
1963 17,119,000 9,625,000 9,096,000 26,300,000 1,097,000 3,056,000 11,391,000<br />
1964 9,877,000 9,079,000 12,156,000 24,584,000 795,000 3,484,000 9,108,000<br />
1965 15,590,000 9,915,000 9,355,000 25,448,000 1,221,000 3,337,000 11,425,000<br />
1966 10,876,000 9,619,000 12,918,000 24,920,000 1,071,000 3,663,000 10,976,000<br />
1967 19,718,000 10,583,000 8,743,000 25,748,000 1,652,000 3,514,000 15,012,000<br />
1968 11,127,000 9,322,000 12,734,000 26,118,000 820,000 3,639,000 9,798,000<br />
1969 23,300,000 11,002,000 8,231,000 25,937,000 2,015,000 4,039,000 18,433,000<br />
1970 18,345,000 10,261,000 10,738,000 26,122,000 1,675,000 4,342,000 15,723,000<br />
1971 14,102,000 9,701,000 10,569,000 25,198,000 1,159,000 4,114,000 11,973,000<br />
1972 8,042,000 10,200,000 12,875,000 25,015,000 716,000 4,139,000 9,394,000<br />
1973 21,343,000 11,136,000 8,253,000 25,934,000 1,772,000 4,043,000 16,914,000<br />
1974 17,548,000 11,581,000 7,854,000 26,366,000 1,311,000 3,966,000 13,154,000<br />
1975 14,527,000 11,279,000 7,925,000 25,525,000 1,024,000 3,927,000 10,995,000<br />
1976 9,301,000 9,560,000 10,558,000 25,581,000 453,000 3,894,000 7,177,000<br />
1977 7,152,000 7,034,000 15,551,000 25,389,000 436,000 3,445,000 7,279,000<br />
1978 24,651,000 10,546,000 6,768,000 27,474,000 1,755,000 3,521,000 16,088,000<br />
1979 14,134,000 12,364,000 7,661,000 26,325,000 941,000 3,857,000 10,657,000<br />
1980 18,453,000 11,735,000 6,230,000 26,189,000 1,257,000 3,616,000 12,472,000<br />
1981 12,350,000 11,440,000 9,108,000 26,510,000 810,000 3,965,000 9,435,000<br />
1982 22,260,000 11,133,000 4,956,000 26,990,000 1,386,000 3,360,000 13,176,000<br />
1983 28,589,000 10,166,000 4,341,000 26,664,000 2,050,000 3,532,000 17,703,000<br />
1984 13,603,000 12,098,000 7,258,000 25,091,000 1,148,000 4,640,000 11,233,000<br />
1985 11,972,000 10,760,000 7,647,000 25,435,000 700,000 4,055,000 8,204,000<br />
1986 19,712,000 11,273,000 5,836,000 26,435,000 1,324,000 3,809,000 12,738,000<br />
1987 10,048,000 10,509,000 8,843,000 25,282,000 581,000 4,171,000 7,620,000<br />
1988 12,796,000 9,390,000 9,815,000 26,129,000 792,000 3,880,000 8,850,000<br />
1989 12,632,000 9,663,000 9,830,000 26,131,000 741,000 3,549,000 8,662,000<br />
1990 10,121,000 8,356,000 11,690,000 25,993,000 487,000 3,331,000 6,919,000<br />
1991 11,763,000 8,009,000 12,549,000 25,424,000 793,000 3,436,000 9,395,000<br />
1992 13,684,000 7,889,000 12,229,000 26,666,000 821,000 3,334,000 9,546,000<br />
1993 22,192,000 10,538,000 6,958,000 26,430,000 1,645,000 3,262,000 14,726,000<br />
1994 11,690,000 9,676,000 9,522,000 26,196,000 617,000 3,332,000 7,295,000<br />
1995 24,818,000 10,345,000 5,737,000 25,428,000 1,913,000 3,366,000 16,739,000<br />
1996 17,151,000 11,843,000 6,485,000 25,973,000 1,240,000 3,814,000 11,969,000<br />
1997 16,299,000 11,567,000 6,644,000 24,859,000 1,294,000 4,120,000 12,347,000<br />
8,946,000 4,535,000 25,846,000 2,139,000 3,190,000 18,646,000<br />
1999 12,511,000 10,006,000 4,831,000 22,538,000 757,000 3,969,000 7,885,000<br />
2000 15,602,000 10,116,000 4,887,000 23,765,000 1,019,000 4,157,000 9,822,000<br />
2001 13,197,000 9,099,000 6,127,000 24,232,000 673,000 3,925,000 7,316,000<br />
2002 12,868,000 9,425,000 7,137,000 23,175,000 943,000 4,050,000 9,238,000<br />
2003 16,050,000 9,571,000 5,643,000 24,252,000 1,009,000 3,695,000 9,554,000<br />
15,752,000 10,171,000 8,621,000 25,598,000 1,128,000 3,740,000 11,427,000
200 Groundwater Availability of the <strong>Central</strong> <strong>Valley</strong> <strong>Aquifer</strong>, California<br />
Table C12. Simulated groundwater budget for the <strong>Central</strong> <strong>Valley</strong>, California, in acre-feet per year.<br />
Table C12. Simulated groundwater budget for the <strong>Central</strong> <strong>Valley</strong>, California, in acre-feet per year—Continued.<br />
[bold italic<br />
bold bolditalic<br />
italic<br />
bolditalic<br />
OUT]<br />
OUT]<br />
Year<br />
Specific yield <strong>and</strong><br />
compressibility<br />
of water IN<br />
GHB IN<br />
Elastic <strong>and</strong> inelastic<br />
storage IN<br />
Stream<br />
leakage IN<br />
Farm<br />
recharge IN<br />
Pumpage<br />
IN 1<br />
1962 8,613,000 57,000 3,150,000 3,791,000 12,166,000 439,000<br />
1963 6,688,000 32,000 2,582,000 2,619,000 10,597,000 448,000<br />
1964 8,424,000 58,000 3,320,000 1,957,000 8,299,000 451,000<br />
1965 6,990,000 49,000 2,559,000 2,715,000 10,638,000 452,000<br />
1966 8,331,000 63,000 3,369,000 2,171,000 10,197,000 465,000<br />
1967 6,527,000 37,000 2,389,000 3,284,000 14,196,000 463,000<br />
1968 8,849,000 59,000 3,206,000 1,684,000 8,957,000 464,000<br />
1969 8,351,000 35,000 1,950,000 5,879,000 17,582,000 479,000<br />
1970 9,620,000 23,000 2,515,000 2,425,000 14,898,000 565,000<br />
1971 8,774,000 25,000 2,326,000 1,891,000 11,129,000 558,000<br />
1972 9,570,000 56,000 2,859,000 1,445,000 8,511,000 557,000<br />
1973 7,424,000 26,000 1,839,000 2,919,000 16,122,000 490,000<br />
1974 7,262,000 20,000 1,643,000 2,398,000 12,247,000 463,000<br />
1975 7,667,000 29,000 1,664,000 1,901,000 10,189,000 436,000<br />
1976 9,005,000 60,000 2,099,000 1,224,000 6,313,000 430,000<br />
1977 10,460,000 102,000 3,827,000 1,347,000 6,436,000 477,000<br />
1978 7,231,000 46,000 1,409,000 4,261,000 15,387,000 478,000<br />
1979 7,636,000 42,000 1,429,000 1,719,000 9,930,000 395,000<br />
1980 6,741,000 29,000 1,195,000 2,600,000 11,765,000 374,000<br />
1981 8,560,000 47,000 1,693,000 1,405,000 8,731,000 367,000<br />
1982 5,916,000 21,000 995,000 2,781,000 12,536,000 343,000<br />
1983 5,928,000 8,000 827,000 4,266,000 17,069,000 301,000<br />
1984 9,222,000 12,000 1,340,000 1,825,000 10,613,000 313,000<br />
1985 8,734,000 22,000 1,457,000 1,387,000 7,597,000 356,000<br />
1986 7,199,000 17,000 1,177,000 2,712,000 12,106,000 340,000<br />
1987 9,340,000 25,000 1,782,000 1,062,000 7,085,000 338,000<br />
1988 9,462,000 34,000 2,136,000 1,211,000 8,202,000 344,000<br />
1989 8,803,000 42,000 2,198,000 1,300,000 8,065,000 362,000<br />
1990 9,428,000 62,000 2,991,000 1,113,000 6,292,000 394,000<br />
1991 10,969,000 67,000 3,188,000 3,908,000 8,830,000 470,000<br />
1992 9,813,000 67,000 3,153,000 1,324,000 8,941,000 497,000<br />
1993 7,367,000 40,000 1,589,000 2,339,000 14,114,000 425,000<br />
1994 8,959,000 55,000 2,310,000 1,417,000 6,773,000 381,000<br />
1995 10,261,000 26,000 1,337,000 8,331,000 16,185,000 414,000<br />
1996 8,420,000 20,000 1,237,000 2,296,000 11,452,000 312,000<br />
1997 9,249,000 22,000 1,277,000 3,735,000 11,851,000 299,000<br />
<br />
1999 8,626,000 17,000 1,133,000 1,715,000 7,381,000 248,000<br />
2000 8,730,000 20,000 1,245,000 1,862,000 9,176,000 264,000<br />
2001 9,324,000 25,000 1,622,000 1,680,000 6,716,000 283,000<br />
2002 9,699,000 26,000 1,877,000 2,011,000 8,686,000 316,000<br />
2003 8,533,000 24,000 1,560,000 2,197,000 8,950,000 305,000<br />
8,465,000 37,000 2,011,000 2,561,000 10,739,000 401,000
Table C12. Simulated groundwater budget for the <strong>Central</strong> <strong>Valley</strong>, California, in acre-feet per year—Continued.<br />
Simulation Results <strong>and</strong> Budget 201<br />
bold italic<br />
bolditalic<br />
OUT]<br />
Year<br />
Specific yield <strong>and</strong><br />
compressibility of<br />
water OUT<br />
GHB OUT<br />
Elastic <strong>and</strong> inelastic<br />
storage OUT<br />
Stream<br />
leakage OUT<br />
Farm recharge<br />
OUT 2<br />
Pumpage<br />
OUT 3<br />
Farm wells<br />
OUT<br />
1962 10,634,000 105,000 1,153,000 1,850,000 2,648,000 1,628,000 10,185,000<br />
1963 8,192,000 120,000 1,007,000 1,738,000 2,209,000 1,513,000 8,170,000<br />
1964 4,694,000 53,000 809,000 1,689,000 2,618,000 1,720,000 10,911,000<br />
1965 8,013,000 98,000 1,058,000 1,729,000 2,493,000 1,548,000 8,449,000<br />
1966 5,811,000 65,000 864,000 1,667,000 2,807,000 1,815,000 11,548,000<br />
1967 11,462,000 132,000 1,259,000 1,983,000 2,630,000 1,468,000 7,948,000<br />
1968 4,601,000 56,000 793,000 1,814,000 2,729,000 1,986,000 11,220,000<br />
1969 17,398,000 263,000 1,537,000 2,905,000 3,122,000 1,738,000 7,290,000<br />
1970 11,241,000 182,000 1,164,000 2,558,000 3,439,000 2,151,000 9,297,000<br />
1971 6,685,000 126,000 1,030,000 2,361,000 3,197,000 2,158,000 9,129,000<br />
1972 3,466,000 46,000 875,000 1,976,000 3,168,000 2,328,000 11,119,000<br />
1973 12,662,000 165,000 1,406,000 2,333,000 3,169,000 1,962,000 7,109,000<br />
1974 8,543,000 154,000 1,201,000 2,457,000 2,999,000 1,953,000 6,708,000<br />
1975 6,496,000 115,000 1,125,000 2,361,000 3,060,000 1,963,000 6,752,000<br />
1976 2,127,000 39,000 892,000 1,922,000 2,945,000 2,154,000 9,037,000<br />
1977 1,918,000 10,000 531,000 1,552,000 2,527,000 2,502,000 13,593,000<br />
1978 14,447,000 164,000 1,564,000 2,131,000 2,736,000 1,862,000 5,889,000<br />
1979 6,590,000 86,000 935,000 1,982,000 3,040,000 1,984,000 6,516,000<br />
1980 9,350,000 142,000 1,081,000 2,146,000 2,845,000 1,885,000 5,242,000<br />
1981 4,987,000 61,000 787,000 1,963,000 3,168,000 2,173,000 7,641,000<br />
1982 10,469,000 182,000 1,122,000 2,225,000 2,660,000 1,799,000 4,123,000<br />
1983 15,728,000 331,000 1,134,000 3,009,000 2,858,000 1,737,000 3,583,000<br />
1984 7,235,000 232,000 666,000 3,051,000 3,966,000 2,169,000 5,988,000<br />
1985 4,195,000 118,000 772,000 2,504,000 3,400,000 2,247,000 6,298,000<br />
1986 9,712,000 186,000 1,006,000 2,597,000 3,133,000 2,070,000 4,825,000<br />
1987 3,336,000 94,000 673,000 2,203,000 3,586,000 2,398,000 7,321,000<br />
1988 4,666,000 68,000 778,000 1,957,000 3,182,000 2,481,000 8,238,000<br />
1989 4,546,000 55,000 756,000 1,775,000 2,894,000 2,505,000 8,221,000<br />
1990 2,779,000 33,000 582,000 1,641,000 2,635,000 2,724,000 9,871,000<br />
1991 8,216,000 99,000 728,000 2,041,000 2,785,000 2,847,000 10,702,000<br />
1992 5,346,000 49,000 856,000 1,547,000 2,644,000 2,820,000 10,513,000<br />
1993 11,676,000 116,000 1,325,000 1,881,000 2,584,000 2,290,000 5,992,000<br />
1994 3,835,000 52,000 818,000 1,686,000 2,728,000 2,627,000 8,133,000<br />
1995 20,424,000 384,000 1,475,000 4,125,000 2,756,000 2,398,000 4,970,000<br />
1996 8,814,000 231,000 933,000 2,510,000 3,245,000 2,475,000 5,509,000<br />
1997 10,716,000 249,000 1,012,000 2,610,000 3,568,000 2,645,000 5,614,000<br />
<br />
1999 4,894,000 240,000 688,000 2,793,000 3,422,000 3,130,000 3,938,000<br />
2000 7,112,000 195,000 732,000 2,411,000 3,468,000 3,306,000 4,052,000<br />
2001 4,471,000 137,000 636,000 2,166,000 3,284,000 3,869,000 5,068,000<br />
2002 6,189,000 130,000 710,000 2,086,000 3,448,000 4,053,000 5,979,000<br />
2003 6,966,000 137,000 879,000 2,041,000 3,046,000 3,768,000 4,712,000<br />
8,131,000 142,000 972,000 2,240,000 2,988,000 2,314,000 7,410,000
202 Groundwater Availability of the <strong>Central</strong> <strong>Valley</strong> <strong>Aquifer</strong>, California<br />
Table C12. Simulated groundwater budget for the <strong>Central</strong> <strong>Valley</strong>, California, in acre-feet per year—Continued.<br />
bold italic<br />
bolditalic<br />
OUT]<br />
Year<br />
Net specific<br />
yield <strong>and</strong> compressibility<br />
of water<br />
Net GHB<br />
Net elastic<br />
<strong>and</strong> inelastic<br />
storage<br />
Net stream<br />
leakage<br />
Net farm<br />
recharge<br />
Net Pumpage 4<br />
1962 1,997,000 1,941,000 9,519,000 <br />
1963 1,575,000 881,000 8,388,000 <br />
1964 3,730,000 4,000 2,511,000 268,000 5,681,000 <br />
1965 1,500,000 986,000 8,145,000 <br />
1966 2,521,000 2,505,000 504,000 7,389,000 <br />
1967 1,129,000 1,301,000 11,566,000 <br />
1968 4,247,000 2,000 2,413,000 6,229,000 <br />
1969 413,000 2,974,000 14,460,000 <br />
1970 1,351,000 11,459,000 <br />
1971 2,089,000 1,296,000 7,932,000 <br />
1972 6,103,000 10,000 1,984,000 5,343,000 <br />
1973 433,000 586,000 12,953,000 <br />
1974 442,000 9,247,000 <br />
1975 1,171,000 –86,000 539,000 –461,000 7,129,000 –8,279,000<br />
1976 6,878,000 22,000 1,208,000 3,368,000 <br />
1977 8,542,000 92,000 3,296,000 3,909,000 <br />
1978 2,130,000 12,651,000 <br />
1979 1,046,000 494,000 6,890,000 <br />
1980 114,000 454,000 8,920,000 <br />
1981 3,573,000 906,000 5,562,000 <br />
1982 556,000 9,877,000 <br />
1983 1,258,000 14,211,000 <br />
1984 1,987,000 674,000 6,647,000 <br />
1985 4,539,000 685,000 4,197,000 <br />
1986 171,000 116,000 8,973,000 <br />
1987 6,004,000 1,109,000 3,499,000 <br />
1988 4,796,000 1,358,000 5,020,000 <br />
1989 4,257,000 1,442,000 5,171,000 <br />
1990 6,649,000 29,000 2,409,000 –528,000 3,657,000 –12,201,000<br />
1991 2,753,000 2,460,000 1,868,000 6,045,000 <br />
1992 4,467,000 18,000 2,297,000 6,297,000 <br />
1993 264,000 459,000 11,531,000 <br />
1994 5,124,000 3,000 1,492,000 4,045,000 <br />
1995 4,206,000 13,428,000 <br />
1996 303,000 8,206,000 <br />
1997 266,000 1,125,000 8,283,000 <br />
<br />
1999 3,732,000 445,000 3,959,000 <br />
2000 1,619,000 513,000 5,708,000 <br />
2001 4,853,000 986,000 3,432,000 <br />
2002 3,510,000 1,168,000 5,237,000 <br />
2003 1,566,000 680,000 155,000 5,904,000 <br />
334,000 1,039,000 321,000 7,751,000 <br />
1 <br />
2 <br />
3 <br />
4
Model Uncertainty <strong>and</strong> Limitations<br />
<br />
<br />
<br />
<br />
<br />
-<br />
<br />
<br />
to facilitate addition of more detailed features that may be<br />
<br />
<br />
<br />
of the study, the use of numerical models to simulate hydro-<br />
<br />
<br />
<br />
<br />
<br />
-<br />
<br />
<br />
<strong>and</strong> Whealan, 2005). One component of model error relates to<br />
<br />
<br />
<br />
2 model<br />
cells <strong>and</strong> features smaller cells that are not simulated. In reality,<br />
the model is likely only to represent features accurately<br />
2 <br />
<br />
<br />
<br />
<br />
<br />
-<br />
<br />
<br />
<br />
able<br />
model solutions to mass-balance residuals of less than<br />
<br />
<br />
<br />
<br />
-<br />
<br />
<br />
<br />
<br />
<br />
<br />
<br />
<br />
Model Uncertainty <strong>and</strong> Limitations 203<br />
<br />
-<br />
<br />
<br />
<br />
<br />
near the l<strong>and</strong> surface to 256,000 acre-ft at depth. Within each<br />
of these cells, the hydraulic properties are interpolated or<br />
<br />
<br />
<br />
<br />
<br />
<br />
<br />
-<br />
<br />
<br />
<br />
results <strong>and</strong> analyses that depend on the early part of the simu-<br />
<br />
<br />
<br />
<br />
<br />
-<br />
<br />
tain<br />
include hydraulic properties, the location <strong>and</strong> properties<br />
<br />
<br />
<br />
<br />
<br />
-<br />
<br />
<br />
-<br />
<br />
<br />
<br />
<br />
-<br />
<br />
-<br />
<br />
<br />
<br />
<br />
<br />
-
204 Groundwater Availability of the <strong>Central</strong> <strong>Valley</strong> <strong>Aquifer</strong>, California<br />
<br />
<br />
<br />
<br />
<br />
<br />
<br />
<br />
<br />
<br />
<br />
<br />
<br />
<br />
<br />
<br />
<br />
<br />
<br />
<br />
<br />
<br />
<br />
<br />
<br />
to constrain these features.<br />
<br />
-<br />
<br />
<br />
<br />
<br />
<br />
<br />
<br />
<br />
<br />
-<br />
<br />
<br />
of the skin factor is uncertain. This skin factor promotes or<br />
-<br />
<br />
<br />
<br />
<br />
<br />
<br />
<br />
<br />
<br />
these areas.<br />
<br />
<br />
<br />
<br />
<br />
<br />
<br />
<br />
<br />
<br />
<br />
<br />
<br />
K <br />
-<br />
<br />
<br />
<br />
<br />
<br />
addition to K <br />
<br />
<br />
<br />
<br />
<br />
<br />
<br />
<br />
<br />
<br />
<br />
<br />
-<br />
<br />
<br />
<br />
<br />
<br />
<br />
<br />
source of model error <strong>and</strong> may affect the local accuracy of the<br />
-
(<br />
<br />
<br />
<br />
<br />
the quality <strong>and</strong> spatial distribution of input data <strong>and</strong> of<br />
<br />
<br />
<br />
-<br />
<br />
<br />
<br />
<br />
<br />
<br />
<br />
<br />
-<br />
<br />
<br />
<br />
<br />
<br />
<br />
<br />
<br />
<br />
<br />
<br />
<br />
<br />
<br />
Future Work 205<br />
<br />
<br />
tional<br />
features.<br />
<br />
<br />
<br />
<br />
l<strong>and</strong>-use <strong>and</strong> crop distributions are used to estimate pump-<br />
<br />
<br />
<br />
<br />
<br />
<br />
<br />
<br />
<br />
<br />
<br />
<br />
<br />
<br />
-<br />
<br />
<br />
<br />
<br />
<br />
Future Work<br />
The performance, utility, detail, <strong>and</strong> accuracy of the<br />
-<br />
-<br />
<br />
<br />
-<br />
<br />
<br />
enhancements may create more accurate or realistic simulations.<br />
In order for these simulations to be as accurate <strong>and</strong> real-<br />
<br />
<br />
<br />
limitations of the current state of the model. The simulation<br />
<br />
<br />
<br />
simulation of aquifer-system compaction. Thick interbeds<br />
-
206 Groundwater Availability of the <strong>Central</strong> <strong>Valley</strong> <strong>Aquifer</strong>, California<br />
-<br />
<br />
<br />
<br />
<br />
-<br />
<br />
<br />
<br />
<br />
-<br />
<br />
<br />
<br />
-<br />
<br />
-<br />
<br />
<br />
<br />
-<br />
<br />
<br />
<br />
<br />
-<br />
<br />
<br />
-<br />
-<br />
<br />
<br />
<br />
<br />
<br />
<br />
commun., 2008).<br />
-<br />
<br />
<br />
<br />
<br />
<br />
<br />
<br />
<br />
-<br />
<br />
<br />
<br />
<br />
<br />
<br />
<br />
<br />
<br />
<br />
-<br />
<br />
<br />
<br />
<br />
<br />
<br />
<br />
<br />
<br />
<br />
<br />
-<br />
<br />
<br />
<br />
<br />
<br />
<br />
<br />
<br />
-<br />
<br />
<br />
<br />
<br />
<br />
-<br />
<br />
<br />
<br />
<br />
<br />
<br />
<br />
<br />
<br />
2006a).<br />
<br />
<br />
<br />
-<br />
<br />
<br />
<br />
distributions could be based on l<strong>and</strong>-use distributions that<br />
<br />
<br />
<br />
-
-<br />
<br />
<br />
<br />
<br />
-<br />
<br />
<br />
<br />
<br />
<br />
<br />
<br />
<br />
<br />
<br />
<br />
<br />
<br />
-<br />
<br />
<br />
<br />
<br />
<br />
<br />
<br />
<br />
<br />
<br />
<br />
<br />
<br />
nia<br />
<strong>and</strong> other stakeholders an ability to forecast the potential<br />
<br />
-<br />
<br />
<br />
-<br />
<br />
<br />
<br />
<br />
<br />
-<br />
<br />
<br />
<br />
<br />
<br />
<br />
<br />
<br />
<br />
References Cited<br />
References Cited 207<br />
<br />
<br />
<br />
<br />
<br />
<br />
2009, at <br />
html<br />
<br />
<br />
<br />
<br />
<br />
<br />
<br />
http://<br />
<br />
html<br />
<br />
<br />
-<br />
<br />
-<br />
<br />
<br />
<br />
-<br />
<br />
<br />
<br />
<br />
<br />
<br />
<br />
<br />
<br />
<br />
<br />
map.<br />
<br />
<br />
<br />
44 p.<br />
-
208 Groundwater Availability of the <strong>Central</strong> <strong>Valley</strong> <strong>Aquifer</strong>, California<br />
<br />
<br />
<br />
<br />
91 p.<br />
-<br />
<br />
<br />
<br />
-<br />
<br />
<br />
<br />
<br />
<br />
<br />
<br />
<br />
-<br />
<br />
<br />
<br />
<br />
-<br />
<br />
<br />
-<br />
<br />
<br />
<br />
<br />
<br />
<br />
<br />
<br />
16, 2009, at <br />
<br />
<br />
<br />
<br />
<br />
<br />
<br />
<br />
<br />
<br />
<br />
<br />
<br />
<br />
<br />
<br />
2009, at <br />
html<br />
<br />
<br />
<br />
<br />
-<br />
<br />
<br />
<br />
<br />
<br />
<br />
<br />
<br />
<br />
<br />
<br />
http://water.usgs.gov/pubs/<br />
<br />
<br />
<br />
-<br />
<br />
<br />
<br />
<br />
<br />
<br />
-<br />
<br />
<br />
<br />
<br />
<br />
<br />
<br />
-<br />
<br />
letin<br />
190, 508 p.
References Cited 209<br />
<br />
<br />
<br />
-<br />
<br />
<br />
<br />
<br />
<br />
<br />
<br />
5211, 36 p.<br />
<br />
<br />
<br />
<br />
<br />
-<br />
<br />
<br />
<br />
<br />
-<br />
<br />
<br />
-<br />
-<br />
<br />
-<br />
-<br />
<br />
<br />
-<br />
<br />
<br />
<br />
<br />
<br />
<br />
-<br />
<br />
<br />
<br />
<br />
-<br />
nia, doctoral dissertation, 175 p.<br />
<br />
<br />
<br />
<br />
-<br />
<br />
<br />
<br />
<br />
<br />
-<br />
<br />
<br />
<br />
<br />
<br />
<br />
<br />
<br />
-<br />
<br />
<br />
<br />
-<br />
<br />
<br />
<br />
-<br />
<br />
<br />
<br />
<br />
<br />
<br />
<br />
-<br />
<br />
<br />
<br />
<br />
<br />
<br />
<br />
-
210 Groundwater Availability of the <strong>Central</strong> <strong>Valley</strong> <strong>Aquifer</strong>, California<br />
<br />
<br />
<br />
<br />
<br />
-<br />
<br />
<br />
<br />
<br />
<br />
-<br />
<br />
<br />
<br />
<br />
<br />
tion<br />
no. 207, 83 p.<br />
-<br />
<br />
<br />
<br />
<br />
<br />
<br />
<br />
<br />
<br />
<br />
<br />
<br />
-<br />
<br />
<br />
-<br />
<br />
<br />
-<br />
<br />
<br />
<br />
<br />
<br />
<br />
<br />
<br />
<br />
-<br />
<br />
<br />
<br />
<br />
<br />
<br />
<br />
<br />
<br />
<br />
<br />
<br />
<br />
<br />
-<br />
<br />
<br />
<br />
-<br />
<br />
<br />
<br />
<br />
<br />
<br />
<br />
<br />
76-41, 46 p.<br />
<br />
-<br />
<br />
54 p.<br />
<br />
<br />
-<br />
<br />
<br />
<br />
<br />
<br />
http://pubs.usgs.
References Cited 211<br />
<br />
-<br />
<br />
<br />
<br />
<br />
<br />
<br />
<br />
<br />
<br />
<br />
<br />
<br />
-<br />
<br />
<br />
-<br />
<br />
<br />
<br />
<br />
<br />
<br />
<br />
<br />
<br />
<br />
<br />
<br />
<br />
-<br />
<br />
<br />
-<br />
<br />
-<br />
<br />
<br />
<br />
<br />
<br />
<br />
-<br />
-<br />
<br />
<br />
<br />
<br />
<br />
<br />
<br />
<br />
<br />
<br />
<br />
<br />
<br />
<br />
2009, at <br />
<br />
-<br />
<br />
<br />
<br />
<br />
<br />
<br />
<br />
<br />
<br />
<br />
<br />
<br />
<br />
-<br />
<br />
<br />
<br />
<br />
<br />
-<br />
<br />
<br />
<br />
<br />
<br />
<br />
<br />
<br />
<br />
-
212 Groundwater Availability of the <strong>Central</strong> <strong>Valley</strong> <strong>Aquifer</strong>, California<br />
-<br />
<br />
<br />
<br />
<br />
-<br />
<br />
<br />
<br />
<br />
<br />
<br />
<br />
-<br />
<br />
<br />
<br />
<br />
<br />
<br />
<br />
<br />
<br />
<br />
<br />
93-1, 170 p.<br />
<br />
-
Appendix 1. Supplemental Information—Modifications to<br />
Modflow-2000 Packages <strong>and</strong> Processes<br />
By Wolfgang Schmid <strong>and</strong> R.T. Hanson<br />
Introduction<br />
<br />
-<br />
<br />
<br />
<br />
<br />
-<br />
<br />
<br />
-<br />
<br />
http://water.usgs.gov/nrp/<br />
).<br />
Layer-Property Flow Package (LPF)<br />
<br />
-<br />
<br />
-<br />
-<br />
<br />
<br />
-<br />
<br />
<br />
<br />
Multiplier Package (MULT)<br />
tion<br />
as an additional binary operator that could be performed<br />
<br />
<br />
-<br />
<br />
<br />
<br />
<br />
a cell-by-cell basis (<br />
<br />
<br />
<br />
<br />
-<br />
-<br />
<br />
<br />
<br />
<br />
<br />
<br />
uses the “^” as a binary operator similar to the other binary<br />
-<br />
<br />
<br />
-<br />
tion<br />
needs to occur prior to other mathematical operations,<br />
the user should make this binary operation a separate input<br />
comm<strong>and</strong> prior to other mathematical operations.<br />
Time-Series Package (HYDMOD)<br />
<br />
<br />
<br />
<br />
<br />
-<br />
<br />
<br />
<br />
<br />
<br />
<br />
-
214 Groundwater Availability of the <strong>Central</strong> <strong>Valley</strong> <strong>Aquifer</strong>, California<br />
Streamflow Routing Package (SFR1)<br />
ers,<br />
2004) includes an additional option to compute streambed<br />
-<br />
<br />
<br />
<br />
<br />
<br />
The Farm Process (FMP1)<br />
<br />
<br />
<br />
<br />
<br />
<br />
<br />
<br />
<br />
<br />
<br />
<br />
<br />
<br />
<br />
<br />
<br />
-<br />
<br />
<br />
-<br />
<br />
<strong>and</strong> by crop for the entire simulation or each stress period. The<br />
<br />
-<br />
<br />
<br />
<br />
<br />
<br />
-<br />
-<br />
<br />
<br />
<br />
-<br />
<br />
<br />
<br />
<br />
<br />
-<br />
<br />
<br />
<br />
Concepts <strong>and</strong> Input Instructions for<br />
New FMP1 Features<br />
-<br />
<br />
<br />
-
Data for each Simulation<br />
Item No. Input instruction for each item<br />
0 <br />
The Farm Process (FMP1) 215<br />
1 <br />
2 ICUFL<br />
ISRDFLISRRFL<br />
IFBPFL {Option} read<br />
3 <br />
4 [xyz] read*<br />
<br />
<br />
5 <br />
6 <br />
or [Farm-ID OFE(FID,CID ), OFE(FID,CID ), … , OFE(FID,CID )]<br />
7<br />
1 2 <br />
<br />
8 <br />
9 <br />
<br />
10 <br />
11 <br />
12 <br />
13 <br />
14 PSI(1) PSI(2) PSI(3) PSI(4)<br />
15 0 1 2 3 {NONIRR}<br />
<br />
16 <br />
<br />
<br />
17 <br />
18 <br />
19 <br />
<br />
20 Reach<br />
[Farm-ID Row Column Segment Reach]
216 Groundwater Availability of the <strong>Central</strong> <strong>Valley</strong> <strong>Aquifer</strong>, California<br />
Data for each Stress Period<br />
Item No. Input instruction for each item<br />
21 <br />
22 <br />
23 <br />
24<br />
)]<br />
1 2 <br />
<br />
25 <br />
26 <br />
27 <br />
<br />
28 <br />
29 <br />
30 <br />
31<br />
<br />
32 <br />
<br />
33<br />
1 2 <br />
<br />
t .<br />
34 <br />
<br />
35 <br />
36
Root Uptake Under Variably Saturated<br />
Conditions (PSI specified in Item 14)<br />
<br />
the simulation of transpiration uptake from unsaturated root<br />
<br />
-<br />
<br />
<br />
<br />
<br />
<br />
<br />
<br />
<br />
<br />
<br />
http://<br />
).<br />
Current Concept of Root Uptake from<br />
Unsaturated Conditions<br />
<br />
<br />
<br />
<br />
<br />
uptake from saturated conditions.<br />
<br />
-<br />
<br />
<br />
<br />
<br />
<br />
-<br />
<br />
<br />
1<br />
4 2, 3 ). The<br />
<br />
<br />
1 2 3 4 <br />
<br />
<br />
<br />
<br />
<br />
4 3 2 1 are con-<br />
<br />
<br />
h b <br />
The Farm Process (FMP1) 217<br />
<br />
<br />
<br />
<br />
<br />
<br />
<br />
<br />
<br />
<br />
ux ).<br />
AURZ(h) = TRZ AZ WZ, hh ≥ h<br />
GSE AZ h, h h ≥ h<br />
0 h ≥ ux<br />
b w0<br />
w0 ux<br />
<br />
<br />
<br />
with :<br />
T<br />
T h T , AURZ h / TRZ<br />
c− pot<br />
( )= ( )<br />
gw−act −unsat c− pot<br />
Tgw−act −unsat<br />
= potential transpiration;<br />
= actual transpiration<br />
(root uptake) from groundwater .<br />
Exp<strong>and</strong>ed Concept of Root Uptake from Variably<br />
Saturated Conditions<br />
<br />
<br />
<br />
<br />
<br />
<br />
<br />
-<br />
<br />
uptake from both unsaturated <strong>and</strong> saturated conditions occurs.<br />
<br />
<br />
-<br />
1 2 <br />
<br />
<br />
<br />
(<br />
(1)<br />
(2)
218 Groundwater Availability of the <strong>Central</strong> <strong>Valley</strong> <strong>Aquifer</strong>, California<br />
Ground<br />
Surface<br />
Groundwater<br />
Level<br />
Bottom of<br />
Root Zone<br />
Wilting<br />
| |<br />
4 | |<br />
3 2<br />
1<br />
Depth below Surface<br />
= 1<br />
= 0<br />
Anoxia &<br />
High<br />
Pressure<br />
ln (| |), for < 0 Soil Water Pressure Head , for 0<br />
| | =<br />
| |(d)<br />
Stress Response<br />
= h - z<br />
Depth below Surface<br />
User specified stress response function,<br />
Simplified stress response function in FMP<br />
Pressure head distribution in unsaturated root<br />
zone: | | = | |(d) solved by analytical solution<br />
Hydrostatic pressure heads in saturated root<br />
zone: = h - z = head minus elevation<br />
Unsaturated Zone within Root Zone<br />
Saturated Zone within Root Zone<br />
Saturated Zone below Root Zone<br />
Zero uptake Full uptake<br />
0 Stress Response 1<br />
Wilting Zone with<br />
zero uptake (WZ)<br />
Active Unsaturated<br />
Root Zone with full<br />
uptake (AURZ)<br />
Active Saturated<br />
Root Zone with<br />
full uptake<br />
(ASRZ1)<br />
Active Saturated<br />
Root Zone with<br />
reduced<br />
uptake<br />
(ASRZ2)<br />
Inactive<br />
Saturated<br />
Zone below<br />
Root Zone<br />
with zero uptake<br />
Inactive Saturated<br />
Zone with zero<br />
uptake due to<br />
High Pressure (> 1)<br />
<strong>and</strong> Anoxia<br />
Figure 1-1. Evaluation of active <strong>and</strong> inactive parts of a variably saturated root zone in FMP (Concept of stress response, , as a<br />
function of pressure heads, , varying over depth, d).
2<br />
<br />
<br />
<br />
displayed in <br />
is found.<br />
2<br />
<br />
(full 2<br />
<br />
1<br />
<br />
<br />
<br />
<br />
<br />
<br />
<strong>and</strong> the pressure head at the bottom of<br />
2 1<br />
is not found<br />
1<br />
<br />
but by the pressure<br />
1<br />
<br />
<br />
<br />
the uptake from saturated conditions is formulated as<br />
<br />
Tgw−act−sat ( h)= Tc−pot i( ASRZ1( h) + ASRZ 2( h) i<br />
( h)) / TRZ (3)<br />
<br />
<br />
( )= ( ( ) + ( )+<br />
ASRZ 2( h) i<br />
( h)) / TRZ<br />
T h T i AURZ h ASRZ1 h<br />
gw−act c− pot<br />
<br />
<strong>and</strong><br />
1 2 1<br />
<br />
2<br />
depend on the simulated<br />
<br />
ASRZ 2( h) i ( h)<br />
<br />
-<br />
<br />
<br />
k k<br />
gw−act ( )= c− pot ( ( )+ ( )+<br />
k<br />
T h T i AURZ h ASRZ1 h<br />
( ) ( ))<br />
k k−1<br />
ASRZ 2 h i<br />
h / TRZ<br />
can<br />
be split into non-head-dependent <strong>and</strong> head-dependent terms.<br />
, is separated into terms either dependent<br />
or not dependent on the head of the current iteration. While<br />
(4)<br />
(5)<br />
The Farm Process (FMP1) 219<br />
<br />
<br />
<br />
<br />
<br />
<br />
<br />
made here.<br />
<br />
<br />
<br />
<br />
<br />
<br />
<br />
<br />
possible transpiration.<br />
<br />
<br />
<br />
transpiration components. These components are fed either by<br />
<br />
-<br />
,<br />
-<br />
<br />
<br />
<br />
<br />
possible transpiration may be supplemented by precipitation<br />
,<br />
<br />
<br />
<br />
<br />
<br />
<br />
<br />
<br />
<br />
<br />
-<br />
<br />
<br />
<br />
stress response, <br />
<br />
1 2 <br />
1 2 ) may<br />
<br />
<br />
response, <br />
2 is found<br />
2 <br />
1 2
220 Groundwater Availability of the <strong>Central</strong> <strong>Valley</strong> <strong>Aquifer</strong>, California<br />
Example 1:<br />
= 30 inches<br />
1<br />
Head-dependent Combinations<br />
of Transpiration Components<br />
Case 1: Transpiration =<br />
Uptake from saturated root zone<br />
Case 2: Transpiration =<br />
Uptake from saturated root zone plus<br />
Capillary uptake from unsat. root zone<br />
Case 3: Transpiration =<br />
Uptake from saturated root zone plus<br />
Capillary uptake from unsat. root zone<br />
plus uptake from irrigation <strong>and</strong><br />
precipitation<br />
Case 4: Transpiration =<br />
Capillary uptake from unsat. root zone<br />
plus Uptake from irrigation <strong>and</strong><br />
precipitation<br />
Case 5: Transpiration =<br />
Uptake from irrigation <strong>and</strong><br />
precipitation<br />
T<br />
c-pot Potential Transpiration<br />
Tgw-sat Transpiration fed by groundwater<br />
uptake in saturated root zone<br />
Tgw-unsat Transpiration fed by capillary<br />
groundwater uptake in unsaturated<br />
root zone<br />
Ti Transpiration fed by irrigation<br />
Tp Transpiration fed by precipitation<br />
Ec-pot Potential Evaporation<br />
Egw-sat Surface Evaporation from<br />
ponding groundwater<br />
Egw-unsat Surface Evaporation fed by<br />
capillary rise from groundwater<br />
Ei Evaporation fed by irrigation<br />
Ep Evaporation fed by precipitation<br />
1<br />
EXPLANATION<br />
Positive pressure head with<br />
maximum transpiration<br />
2 Positive pressure head with<br />
zero transpiration<br />
Transpiration from fully active<br />
portion of the saturated<br />
rootzone (ASRZ1)<br />
Transpiration from partially<br />
active portion of the<br />
saturated rootzone (ASRZ2)<br />
Total Transpiration from the<br />
saturated root zone<br />
Ground<br />
Surface<br />
Root<br />
zone<br />
Capillary<br />
Fringe<br />
water<br />
level<br />
Tgw<br />
-Extinction<br />
1<br />
1<br />
water level<br />
2<br />
2<br />
water level<br />
Components of Transpiration <strong>and</strong><br />
Evaporation with varying Water Level<br />
T gw-unsat<br />
T c-pot<br />
E<br />
c-pot<br />
Capillary<br />
Fringe<br />
E -Extinction<br />
gw<br />
water<br />
level<br />
c-pot<br />
Tc-pot Tc-pot<br />
Flux<br />
Example 2:<br />
Root zone = 30 inches<br />
1<br />
2<br />
T gw-sat<br />
= 30 inches<br />
= 10 inches<br />
E gw<br />
T i T p E i<br />
Subcomponents of Transpiration<br />
from Saturated Conditions<br />
Root<br />
Zone<br />
E p<br />
Ground<br />
Surface<br />
1<br />
1<br />
1<br />
1<br />
2<br />
2<br />
2<br />
2<br />
water level<br />
water level<br />
Subcomponents of Transpiration<br />
from Saturated Conditions<br />
T<br />
Example 1:<br />
Root zone = 30 inches<br />
1<br />
2<br />
= 20 inches<br />
= 10 inches<br />
Flux<br />
Example 3:<br />
Root zone = 30 inches<br />
1<br />
2<br />
= 40 inches<br />
= 10 inches<br />
Flux<br />
Subcomponents of Transpiration<br />
from Saturated Conditions<br />
Figure 1-2. Conceptualization to the change of transpiration uptake from a saturated root zone with varying water level (Three<br />
examples with different 1 values; example 1 at top includes conceptualization of all transpiration <strong>and</strong> evaporation components with<br />
varying water level).<br />
Root<br />
Zone<br />
Root<br />
Zone
Input Instructions<br />
-<br />
<br />
<br />
<br />
<br />
<br />
<br />
<br />
after the section titles.<br />
<br />
<br />
<br />
pressure heads. Therefore, the user must be able to enter any<br />
<br />
<br />
<br />
<br />
1 <strong>and</strong><br />
2 <br />
2 <br />
1 -<br />
3 4 <br />
3 4 )<br />
<br />
<br />
<br />
<br />
<br />
<br />
<br />
<br />
<br />
<br />
<br />
<br />
<br />
<br />
Matrix of On-Farm Efficiencies (OFE specified<br />
in Items 7 or 24)<br />
<br />
<br />
<br />
<br />
-<br />
The Farm Process (FMP1) 221<br />
<br />
<br />
<br />
<br />
Input Requirements<br />
<br />
<br />
<br />
<br />
<br />
<br />
<br />
<br />
... <br />
<br />
1 1,1 1,2 … 2 2,1 2,2 … … … … … … …<br />
<br />
<br />
… CAUTION<br />
<br />
<br />
<br />
<br />
<br />
Data Output<br />
<br />
<br />
each iteration, each time step, or selected time steps either to
222 Groundwater Availability of the <strong>Central</strong> <strong>Valley</strong> <strong>Aquifer</strong>, California<br />
Non-Irrigation Crops (NONIRR Specified in<br />
Items 15 or 27)<br />
<br />
<br />
<br />
<br />
<br />
<br />
<br />
<br />
<br />
<br />
<br />
<br />
-<br />
<br />
<br />
<br />
<br />
-<br />
<br />
<br />
<br />
<br />
percolation.<br />
<br />
<br />
<br />
<br />
<br />
<br />
<br />
…<br />
1<br />
2<br />
…<br />
1 2 …<br />
1 2 …<br />
<br />
Or<br />
-<br />
<br />
<br />
<br />
<br />
1 1 … 1<br />
2 2 … 2<br />
… … … … …<br />
… <br />
Consumptive Use Options (ICUFL Specified in<br />
Item 2; ETR Specified as New Item)<br />
1. <br />
c <br />
<br />
c c-pot ) <strong>and</strong><br />
<br />
<br />
2. <br />
<br />
<br />
<br />
<br />
<br />
3. -<br />
<br />
-<br />
<br />
<br />
<br />
<br />
<br />
4. -<br />
c <br />
<br />
c c<br />
c c-pot <br />
<br />
<br />
-<br />
<br />
<br />
<br />
after item 27).<br />
Semi-Routed Delivery (ISRDFL in Item 2; REACH<br />
in Items 20 or 34)<br />
<br />
<br />
<br />
<br />
<br />
<br />
<br />
<br />
<br />
<br />
<br />
<br />
<br />
<br />
ber<br />
<strong>and</strong> reach number. Therefore, option 5 became obsolete
Semi-Routed Surface-Water Runoff-Return Flow<br />
(ISRRFL in Item 2 <strong>and</strong> ROW COLUMN SEGMENT<br />
REACH Specified as New Item)<br />
<br />
<br />
-<br />
<br />
<br />
<br />
<br />
<br />
<br />
<br />
<br />
<br />
<br />
<br />
<br />
<br />
<br />
<br />
of the farm.<br />
<br />
<br />
<br />
<br />
<br />
<br />
<br />
<br />
<br />
<strong>and</strong> reach numbers is read for the entire<br />
simulation.<br />
<br />
<strong>and</strong> reach numbers is read for each stress<br />
period.<br />
-<br />
<br />
a farm. If none of these are found, then, by second priority,<br />
<br />
<br />
<br />
<br />
<br />
<br />
<br />
<br />
<br />
<br />
<br />
<br />
The Farm Process (FMP1) 223<br />
-<br />
<br />
<br />
<br />
<br />
<br />
<br />
<br />
<br />
<br />
<br />
<br />
<br />
<br />
<br />
-<br />
<br />
<br />
<br />
<br />
<br />
<br />
-<br />
<br />
-<br />
-<br />
<br />
<br />
<br />
<br />
<br />
Farm-Related Data List for Semi-Routed Runoff-Return<br />
Flow Locations (New Item Added After Items 20 or 34):<br />
<br />
are attributed<br />
<br />
<br />
<br />
<br />
<br />
<br />
<br />
<br />
<br />
simulation.<br />
<br />
<br />
must be equal to the sequential number of a
224 Groundwater Availability of the <strong>Central</strong> <strong>Valley</strong> <strong>Aquifer</strong>, California<br />
<br />
<br />
<br />
<br />
full set of informa- -<br />
mation<br />
if more than one<br />
<br />
<br />
<br />
<br />
the cell<br />
0 0 if more than one<br />
<br />
<br />
<br />
location by<br />
coordinates<br />
<br />
of location<br />
by reach<br />
<br />
numbers<br />
<br />
Additional Auxiliary Variable (AUX NOCIRNOQ<br />
Specified in Item 2)<br />
<br />
<br />
<br />
<br />
<br />
<br />
<br />
<br />
<br />
<br />
<br />
<br />
<br />
<br />
<br />
<br />
<br />
<br />
<br />
<br />
<br />
<br />
<br />
<br />
<br />
<br />
<br />
<br />
Farm Budget Output Options (IFBPFL Specified<br />
in Item 2)<br />
<br />
<br />
-<br />
<br />
IFBPFL = 1 -<br />
<br />
<br />
<br />
<br />
Time step<br />
<br />
<br />
<br />
Flow rates into a farm:<br />
<br />
<br />
<br />
<br />
<br />
Flow rates out of farm:
-<br />
<br />
IEBPFL=2 <br />
<br />
<br />
<br />
Time step<br />
<br />
<br />
Flowrates into a farm:<br />
<br />
<br />
<br />
<br />
<br />
<br />
farm<br />
<br />
the farm<br />
<br />
<br />
Flowrates out of a farm:<br />
<br />
farm<br />
<br />
the farm<br />
<br />
the farm<br />
<br />
farm<br />
Transpiration from precipitation out of<br />
the farm<br />
<br />
the farm<br />
<br />
<br />
<br />
<br />
-<br />
<br />
<br />
<br />
-<br />
<br />
<br />
<br />
-<br />
<br />
<br />
<br />
<br />
-<br />
<br />
<br />
<br />
References Cited<br />
References Cited 225<br />
<br />
<br />
<br />
<br />
<br />
<br />
<br />
-<br />
<br />
<br />
<br />
-<br />
<br />
<br />
<br />
<br />
<br />
-<br />
<br />
<br />
<br />
<br />
<br />
<br />
46 p.<br />
<br />
<br />
<br />
<br />
<br />
<br />
<br />
<br />
<br />
-<br />
-<br />
<br />
<br />
<br />
<br />
<br />
-
Manuscript appproved on April 16, 2009<br />
Prepared by the USGS Publishing Network,<br />
Publishing Service Center, Sacramento, California<br />
For more information concerning the research in this report, contact<br />
the<br />
California Water Science Center Director,<br />
U.S. Geological Survey, 6000 J Street<br />
Sacramento, California 95819
Printed on recycled paper<br />
Groundwater Availability of<br />
the <strong>Central</strong> <strong>Valley</strong> <strong>Aquifer</strong>, California<br />
Faunt — Groundwater Availability of the <strong>Central</strong> <strong>Valley</strong> <strong>Aquifer</strong>, California Professional Paper 1766