A Case Study of Numu - Linguistics - University of California, Berkeley
A Case Study of Numu - Linguistics - University of California, Berkeley
A Case Study of Numu - Linguistics - University of California, Berkeley

You also want an ePaper? Increase the reach of your titles
YUMPU automatically turns print PDFs into web optimized ePapers that Google loves.
Phonetic and Phonological Acquisition in Endangered Languages Learned by Adults:<br />
A <strong>Case</strong> <strong>Study</strong> <strong>of</strong> <strong>Numu</strong> (Oregon Northern Paiute)<br />
by<br />
Erin Flynn Haynes<br />
A dissertation submitted in partial satisfaction <strong>of</strong> the<br />
requirements for the degree <strong>of</strong><br />
Doctor <strong>of</strong> Philosophy<br />
in<br />
<strong>Linguistics</strong><br />
in the<br />
Graduate Division<br />
<strong>of</strong> the<br />
<strong>University</strong> <strong>of</strong> <strong>California</strong>, <strong>Berkeley</strong><br />
Committee in charge:<br />
Pr<strong>of</strong>essor Alice Gaby, Co-Chair<br />
Pr<strong>of</strong>essor Leanne Hinton, Co-Chair<br />
Pr<strong>of</strong>essor Keith Johnson<br />
Pr<strong>of</strong>essor Thomas Biolsi<br />
Spring 2010
ABSTRACT<br />
Phonetic and Phonological Acquisition in Endangered Languages Learned by Adults:<br />
A <strong>Case</strong> <strong>Study</strong> <strong>of</strong> <strong>Numu</strong> (Oregon Northern Paiute)<br />
by<br />
Erin Flynn Haynes<br />
Doctor <strong>of</strong> Philosophy in <strong>Linguistics</strong><br />
<strong>University</strong> <strong>of</strong> <strong>California</strong>, <strong>Berkeley</strong><br />
Pr<strong>of</strong>essor Alice Gaby, Co-Chair<br />
Pr<strong>of</strong>essor Leanne Hinton, Co-Chair<br />
This dissertation compares the phonetic and phonological features <strong>of</strong> adult non-speakers’<br />
productions <strong>of</strong> words in an endangered Native American language, Oregon Northern Paiute (also<br />
known, and hereafter referred to, as <strong>Numu</strong>), to productions by fluent speakers. The purpose <strong>of</strong><br />
this comparison is two-fold. The first purpose is to examine the differences in pronunciation that<br />
non-speakers bring to the language, which point to possible directions <strong>of</strong> future language change<br />
in a language that is no longer being learned as a first language by children. Changes brought to<br />
the language by second language learners are likely to occur due to transfer effects from English<br />
and processes <strong>of</strong> regularization, but may also occur due to the intensification <strong>of</strong> socially salient<br />
language features, or hypercorrection (see Wolfram, 2002). For this reason, two groups <strong>of</strong> nonspeakers<br />
were included in the study: English speaking members <strong>of</strong> the community where <strong>Numu</strong><br />
is spoken (Warm Springs, Oregon) and English speakers from outside the community. It was<br />
hypothesized that the latter group would only exhibit transfer effects or regularization, while the<br />
Warm Springs group would also exhibit hypercorrection <strong>of</strong> what they perceive to be salient<br />
features <strong>of</strong> <strong>Numu</strong>. By comparing the productions <strong>of</strong> the two non-speaker groups, specific aspects<br />
<strong>of</strong> potential change are identified and classified as transfer, regularization, or hypercorrection.<br />
The second purpose <strong>of</strong> the comparison between speaker and non-speaker productions is to<br />
ascertain specific differences in pronunciation that result in perceivably accented speech. This<br />
research goal is achieved by examining fluent speakers’ reactions to non-speakers’ productions.<br />
It was hypothesized that not all features unique to non-speaker produced speech would result in a<br />
perceivable accent. Learners who wish to improve their pronunciation from the perspective <strong>of</strong><br />
the <strong>Numu</strong> community could then focus particularly on the features that do contribute to a<br />
noticeable accent.<br />
This research makes contributions to our understanding <strong>of</strong> phonetic and phonological change in<br />
endangered language contexts, both from a second language acquisition perspective and a sociophonetic<br />
perspective. The theoretical framework for this research is described in Chapter 1,<br />
along with information about <strong>Numu</strong> and about the Warm Springs community. The second<br />
1
TABLE OF CONTENTS<br />
ABSTRACT ....................................................................................................................................... 1<br />
LIST OF FIGURES ............................................................................................................................ V<br />
LIST OF TABLES ............................................................................................................................ VII<br />
ACKNOWLEDGMENTS .................................................................................................................... IX<br />
CHAPTER 1 .................................................................................................................................. 1<br />
1.1 Overview ............................................................................................................................... 1<br />
1.2 Language acquisition and language change .......................................................................... 2<br />
1.3 The <strong>Numu</strong> language .............................................................................................................. 3<br />
1.3.1 <strong>Numu</strong> people in Warm Springs...................................................................................... 4<br />
1.3.2 The Warm Springs languages ........................................................................................ 7<br />
1.3.3 The Warm Springs language program ........................................................................... 7<br />
1.4 Overview <strong>of</strong> the research and methodology ....................................................................... 11<br />
1.4.1 Methods........................................................................................................................ 11<br />
1.4.2 Research philosophy .................................................................................................... 12<br />
1.4.3 Non-speakers vs. learners ............................................................................................ 12<br />
1.4.4 Phonetic vs. phonological change ................................................................................ 13<br />
1.5 Theoretical and practical contributions ............................................................................... 13<br />
1.6 Organization <strong>of</strong> the dissertation .......................................................................................... 14<br />
CHAPTER 2 ................................................................................................................................ 16<br />
2.1 Introduction ......................................................................................................................... 16<br />
2.2 Methods............................................................................................................................... 17<br />
2.3 Consonants .......................................................................................................................... 18<br />
2.3.1 Fortis and lenis consonants .......................................................................................... 18<br />
2.3.1.1 Fortis and lenis obstruent VOT ............................................................................. 20<br />
2.3.1.2 Fortis and lenis obstruent/fricative duration ......................................................... 21<br />
2.3.1.3 Fortis and lenis nasal duration .............................................................................. 23<br />
2.3.1.4 Acoustic measurements <strong>of</strong> the fortis and lenis burst ............................................ 25<br />
2.3.1.5 Acoustic correlates <strong>of</strong> the <strong>Numu</strong> lenis/fortis contrast ........................................... 28<br />
2.3.2 Onset obstruents ........................................................................................................... 29<br />
2.3.3 Comparison <strong>of</strong> VOT in onsets, fortis, and lenis obstruents ......................................... 29<br />
2.4 Vowels ................................................................................................................................ 30<br />
2.4.1. Vowel quality .............................................................................................................. 31<br />
ii
2.4.2 Vowel duration............................................................................................................. 33<br />
2.5 Spectral and temporal relations <strong>of</strong> <strong>Numu</strong> vowels ............................................................... 35<br />
2.6 Variation among speakers ................................................................................................... 39<br />
2.7 Conclusion .......................................................................................................................... 42<br />
CHAPTER 3 ................................................................................................................................ 43<br />
3.1 Introduction ......................................................................................................................... 43<br />
3.2 Methods............................................................................................................................... 43<br />
3.2.1 Background .................................................................................................................. 43<br />
3.2.2 <strong>Study</strong> participants......................................................................................................... 44<br />
3.2.2.1 Other language experience .................................................................................... 46<br />
3.2.2.2 American Indian English ...................................................................................... 47<br />
3.2.3 Stimuli .......................................................................................................................... 48<br />
3.2.4 <strong>Study</strong> procedure ........................................................................................................... 48<br />
3.3 Phonological contrasts ........................................................................................................ 49<br />
3.3.1 Word-initial /ts/ ............................................................................................................ 49<br />
3.3.2 Uvularization................................................................................................................ 52<br />
3.3.3 Voiceless vowels .......................................................................................................... 54<br />
3.3.4 Ejectives ....................................................................................................................... 56<br />
3.3.5 Suprasegmental features .............................................................................................. 58<br />
3.3.6 Conclusion ................................................................................................................... 59<br />
3.4 Phonetic contrasts: Consonants........................................................................................... 59<br />
3.4.1 Fortis and lenis ............................................................................................................. 60<br />
3.4.1.1. Fortis and lenis obstruent VOT ............................................................................ 60<br />
3.4.1.2 Fortis and lenis obstruent/fricative duration ......................................................... 62<br />
3.4.1.3 The fortis and lenis burst....................................................................................... 64<br />
3.4.2 Singleton and geminate nasal duration ....................................................................... 67<br />
3.4.3 Onset VOT ................................................................................................................... 70<br />
3.4.4 Conclusion ................................................................................................................... 71<br />
3.5 Phonetic contrasts: Vowels ................................................................................................. 72<br />
3.5.1 Vowel quality ............................................................................................................... 72<br />
3.5.2 Vowel duration............................................................................................................. 81<br />
3.5.3 Quality vs. duration ...................................................................................................... 84<br />
3.5.4 Vowel conclusion......................................................................................................... 92<br />
3.6 Conclusion .......................................................................................................................... 92<br />
iii
LIST OF FIGURES<br />
Figure 1. Map <strong>of</strong> Oregon showing the approximate location <strong>of</strong> the Confederated Tribes <strong>of</strong> Warm Springs<br />
Reservation (A), Cascade Mountains (B), the Columbia Plateau (C), and the Blue Mountains (D). The<br />
Columbia River forms Oregon’s northern border. ........................................................................................ 4<br />
Figure 2. 1879 map <strong>of</strong> the Malheur Reservation in southeastern Oregon (arrow added). ........................... 6<br />
Figure 3. Map showing the towns <strong>of</strong> Warm Springs and Madras (the distance between the two towns is<br />
approximately 15 miles). The shaded portion depicts the Confederated Tribes <strong>of</strong> Warm Springs<br />
Reservation. ................................................................................................................................................ 12<br />
Figure 4. Mean VOT for fortis and lenis obstruents at bilabial, coronal, and velar places <strong>of</strong> articulation,<br />
and overall mean VOT for fortis and lenis obstruents. ............................................................................... 21<br />
Figure 5. Mean closure duration for fortis and lenis consonants (bars) and the ratio <strong>of</strong> the difference<br />
between them (dotted line). ......................................................................................................................... 23<br />
Figure 6. Mean closure duration for fortis and lenis obstruent and nasal consonants at all places <strong>of</strong><br />
articulation. ................................................................................................................................................. 24<br />
Figure 7. Mean burst amplitude for fortis and lenis obstruents at all places <strong>of</strong> articulation. ..................... 26<br />
Figure 8. Relative fortis and lenis burst intensity (standard deviations in parentheses). ........................... 27<br />
Figure 9. Average measurements <strong>of</strong> the mean frequency, standard deviation, skewness, and kurtosis <strong>of</strong><br />
fortis and lenis bursts at all places <strong>of</strong> articulation. ...................................................................................... 28<br />
Figure 10. Mean VOT for onset, fortis, and lenis consonants. .................................................................. 30<br />
Figure 11. <strong>Numu</strong> monophthongs................................................................................................................ 30<br />
Figure 12. Scatterplot <strong>of</strong> F2 vs. F1 values for all <strong>Numu</strong> vowel tokens. ..................................................... 32<br />
Figure 13. Scatterplot <strong>of</strong> F3 vs. F2 values for <strong>Numu</strong> high vowels. ........................................................... 33<br />
Figure 14. Mean duration for short medial, short final, long medial, and long final <strong>Numu</strong> vowels by<br />
vowel. .......................................................................................................................................................... 34<br />
Figure 15. Two dimensional overlap figures <strong>of</strong> F2xF1 for a) i~i, b) u~u, and c) a~a ............................ 37<br />
Figure 16. Three dimensional overlap figures <strong>of</strong> F2xF1xDuration for a) i~i, b) u~u, and c) a~a .......... 38<br />
Figure 17. Percentage <strong>of</strong> word-initial tokens <strong>of</strong> /ts/ produced as /ts/, another affricate, /s/, or /t/, by<br />
participant. .................................................................................................................................................. 50<br />
Figure 18. Percentage <strong>of</strong> word-initial tokens <strong>of</strong> /ts/ produced as /ts/, another affricate, /s/, or /t/ by<br />
members <strong>of</strong> the Warm Springs 1 group with previous exposure to Ichishkin or Kiksht, members <strong>of</strong> the<br />
Warm Springs 1 group with no previous exposure to these languages, and members <strong>of</strong> the Warm Springs<br />
2 group. ....................................................................................................................................................... 51<br />
Figure 19. Percentage <strong>of</strong> word-initial tokens <strong>of</strong> /ts/ produced as /ts/, another affricate, /s/, or /t/, by group.<br />
.................................................................................................................................................................... 51<br />
Figure 20. Percentage <strong>of</strong> uvular sounds, velar sounds, and other sounds produced in <strong>Numu</strong> uvular<br />
contexts, by individual. ............................................................................................................................... 53<br />
Figure 21. Percentage <strong>of</strong> uvular sounds, velar sounds, and other sounds produced in <strong>Numu</strong> uvular<br />
contexts, by group. ...................................................................................................................................... 53<br />
Figure 22. Percentage <strong>of</strong> uvular sounds, velar sounds, and other sounds produced in <strong>Numu</strong> uvular<br />
contexts, by members <strong>of</strong> the Warm Springs 1 group with previous exposure to Ichishkin or Kiksht,<br />
members <strong>of</strong> the Warm Springs 1 group with no previous exposure to these languages, and members <strong>of</strong> the<br />
Warm Springs 2 group. ............................................................................................................................... 54<br />
Figure 23. Number and percentage <strong>of</strong> spontaneously devoiced productions (triangles) as compared to the<br />
total number <strong>of</strong> devoiced productions (rectangles), by participant. ............................................................ 55<br />
Figure 24. Number and percentage <strong>of</strong> spontaneously devoiced productions (triangles) as compared to the<br />
total number <strong>of</strong> devoiced productions (rectangles), by group. .................................................................... 55<br />
Figure 25. Waveform and spectrogram <strong>of</strong> /k'a/ produced by WS5. Arrow (a) indicates the oral release,<br />
arrow (b) indicates the glottal release, and arrow (c) indicates creaky voicing. ......................................... 57<br />
Figure 26. Mean percentage <strong>of</strong> accurate stress production by group. ........................................................ 58<br />
v
Figure 27. Mean fortis VOT across groups by consonant. ......................................................................... 61<br />
Figure 28. Fortis and lenis VOT (bars) and the difference between fortis and lenis VOT (line), by group.<br />
.................................................................................................................................................................... 62<br />
Figure 29. Mean fortis and lenis duration (bars) and fortis to lenis ratio (line) by group. ......................... 64<br />
Figure 30. Mean nasal duration for each nasal type by group. .................................................................. 70<br />
Figure 31. Mean VOT for <strong>Numu</strong> onsets produced by each group, by consonant. ..................................... 71<br />
Figure 32. Mean F2 and F1 values for all groups. ..................................................................................... 73<br />
Figure 33. Summary plot <strong>of</strong> dimension 1 (horizontal) and dimension 2 (vertical) <strong>of</strong> the multi-dimensional<br />
scaling similarity distances <strong>of</strong> <strong>Numu</strong> high vowels. ..................................................................................... 75<br />
Figure 34. Summary plot <strong>of</strong> dimension 1 (horizontal) and dimension 2 (vertical) <strong>of</strong> the multi-dimensional<br />
scaling similarity distances <strong>of</strong> <strong>Numu</strong> back vowels. .................................................................................... 76<br />
Figure 35. Summary plot <strong>of</strong> dimension 1 (horizontal) and dimension 2 (vertical) <strong>of</strong> the multi-dimensional<br />
scaling similarity distances <strong>of</strong> all <strong>Numu</strong> vowels. ........................................................................................ 77<br />
Figure 36. Results <strong>of</strong> a hierarchical clustering analysis <strong>of</strong> the multi-dimensional scaling similarity<br />
distances <strong>of</strong> <strong>Numu</strong> high vowels. ................................................................................................................. 78<br />
Figure 37. Results <strong>of</strong> a hierarchical clustering analysis <strong>of</strong> the multi-dimensional scaling similarity<br />
distances <strong>of</strong> <strong>Numu</strong> back vowels. ................................................................................................................. 79<br />
Figure 38. Results <strong>of</strong> a hierarchical clustering analysis <strong>of</strong> the multi-dimensional scaling similarity<br />
distances <strong>of</strong> all <strong>Numu</strong> vowels. .................................................................................................................... 80<br />
Figure 39. Comparison <strong>of</strong> mean vowel duration for short and long medial and final vowels (bars –error<br />
bars indicate one standard deviation) and ratios <strong>of</strong> long to short medial and final vowels (lines). ....... 83<br />
Figure 40. F1xF2 overlap <strong>of</strong> i~i for a) Madras, b) Warm Springs 1, c) Warm Springs 2, and d) Fluent<br />
Speakers. ..................................................................................................................................................... 85<br />
Figure 41. F1xF2xDuration overlap <strong>of</strong> i~i for a) Madras, b) Warm Springs 1, c) Warm Springs 2, and d)<br />
Fluent Speakers. .......................................................................................................................................... 86<br />
Figure 42. F1xF2 overlap <strong>of</strong> u~u for a) Madras, b) Warm Springs 1, c) Warm Springs 2, and d) Fluent<br />
Speakers. ..................................................................................................................................................... 87<br />
Figure 43. F1xF2xDuration overlap <strong>of</strong> u~u for a) Madras, b) Warm Springs 1, c) Warm Springs 2, and<br />
d) Fluent Speakers. ...................................................................................................................................... 88<br />
Figure 44. F1xF2 overlap <strong>of</strong> a~a for a) Madras, b) Warm Springs 1, c) Warm Springs 2, and d) Fluent<br />
Speakers. ..................................................................................................................................................... 89<br />
Figure 45. F1xF2xDuration overlap <strong>of</strong> a~a for a) Madras, b) Warm Springs 1,c) Warm Springs 2, and d)<br />
Fluent Speakers. .......................................................................................................................................... 90<br />
Figure 46. Comparison <strong>of</strong> overall F2xF1 overlap and overall F2xF1xDuration overlap (bars), plotted<br />
with the difference in overlap values between the two models (line), by group. ........................................ 91<br />
Figure 47. Mean VOT for <strong>Numu</strong> onsets produced by each group, by consonant. ................................... 107<br />
Figure 48. Screen shot from Experiment 5 (Taibo means non-Native or White person). ........................ 116<br />
Figure 49. Count and percentage <strong>of</strong> each rating given by Rater 1 and by Rater 2. .................................. 118<br />
vi
Table 48. Two-dimensional (2D) and three-dimensional (3D) overlap percentages, and the difference<br />
between them (Diff.) for each peripheral vowel pair, by group. ................................................................. 90<br />
Table 49. Hypothesized patterns for changes due to transfer from English. .............................................. 97<br />
Table 50. Hypothesized patterns for changes due to regularization to a universal grammar. .................. 100<br />
Table 51. Hypothesized patterns for changes due to hypercorrection. ..................................................... 103<br />
Table 52. Production patterns for measurements <strong>of</strong> fortis and lenis productions by speakers and nonspeakers<br />
<strong>of</strong> <strong>Numu</strong>. .................................................................................................................................... 104<br />
Table 53. English and <strong>Numu</strong> voiced obstruent VOT values. ................................................................... 104<br />
Table 54. English and <strong>Numu</strong> voiced obstruent duration values. .............................................................. 105<br />
Table 55. Measures <strong>of</strong> the burst on which fortis v. lenis distinctions are made, by group....................... 105<br />
Table 56. Production patterns for measurements <strong>of</strong> nasal productions by speakers and non-speakers <strong>of</strong><br />
<strong>Numu</strong>. ....................................................................................................................................................... 106<br />
Table 57. Production patterns for measurements <strong>of</strong> vowel duration by speakers and non-speakers <strong>of</strong><br />
<strong>Numu</strong>. ....................................................................................................................................................... 108<br />
Table 58. Production patterns for two- and three-dimensional vowel overlap models by speakers and nonspeakers<br />
<strong>of</strong> <strong>Numu</strong>. .................................................................................................................................... 109<br />
Table 59. Production patterns for observations <strong>of</strong> phonological productions by speakers and non-speakers<br />
<strong>of</strong> <strong>Numu</strong>. ................................................................................................................................................... 110<br />
Table 60. Stimuli type and number <strong>of</strong> tokens for all perception experiments. ......................................... 117<br />
Table 61. Count and percentage <strong>of</strong> each rating given by Rater 1 and Rater 2. ........................................ 118<br />
Table 62. The difference in ratings between Rater 1 and Rater 2 for each token, presented as a count and<br />
a percentage <strong>of</strong> total ratings. ..................................................................................................................... 119<br />
Table 63. Amount <strong>of</strong> variance accounted for by individual random effects for each Rater. .................... 120<br />
Table 64. Regression results for phonological factors, by rater. .............................................................. 120<br />
Table 65. Rater 1 regression results for subphonemic factors. ................................................................. 122<br />
Table 66. Rater 2 regression results for subphonemic factors. ................................................................. 123<br />
Table 67. Count and percentage <strong>of</strong> the ratings given by both raters for the 540 non-speaker productions<br />
that were analyzed using narrow transcriptions. ....................................................................................... 124<br />
Table 68. Results <strong>of</strong> an ordinal regression <strong>of</strong> participant, gender, group, and input on ratings, by rater. 125<br />
viii
ACKNOWLEDGMENTS<br />
There are so very many people without whose support this dissertation never would have come<br />
to be. I will try to thank each <strong>of</strong> you here individually, but know that if I miss you, it’s due to my<br />
faulty memory at this final hour <strong>of</strong> writing, not due to my lack <strong>of</strong> appreciation for your help and<br />
support along the way.<br />
This dissertation topic originally arose from long conversations with Myra Johnson, director <strong>of</strong><br />
the Warm Springs Language Program, who was a constant source <strong>of</strong> encouragement and support<br />
throughout this project. She and the rest <strong>of</strong> the Language Program team have been truly amazing<br />
to me. I looked forward to every visit to Warm Springs in the anticipation <strong>of</strong> working with<br />
Shirley Tufti, Pat Miller, CarlaDean Winishut, and Verleen Holliday. I can never thank them<br />
enough for their help and friendship, and the help and friendship <strong>of</strong> Radine Johnson, Pam<br />
Cardenas, and Arlita Rhoan. Appreciation is also due to Pearl Stwyer and to the participants in<br />
my experiments, without whom I could not have conducted this research.<br />
Chuck and Janice Alexander made my trips to Warm Springs feasible by <strong>of</strong>fering me a<br />
wonderful place to stay with them. I owe them great thanks for making me welcome in their<br />
home and <strong>of</strong>fering me their friendship, support, and some truly amazing meals. They were also<br />
responsible for helping me find and recruit the majority <strong>of</strong> my Madras experiment participants.<br />
On the analysis and writing end <strong>of</strong> this research, I owe many thanks to my advisors, Alice Gaby<br />
and Leanne Hinton, who have guided me on this project since the beginning. Thank-you also to<br />
Keith Johnson, for indispensable advice on phonetic analysis and statistics, and to Susanne Gahl,<br />
for guiding me through more sophisticated statistical models than I would have had the courage<br />
to try on my own. I owe deep appreciation to Christine Beier, who provided incredibly insightful<br />
observations on both my research process and the final written document. Thank-you also to<br />
Wesley Leonard, Charles Chang, Nicole Marcus, Christian DiCanio, Ronald Sprouse, Reiko<br />
Kataoka, Alex Egeler, Melinda Woodley, members <strong>of</strong> the <strong>Berkeley</strong> Phonology Phorum, and<br />
members <strong>of</strong> the <strong>Berkeley</strong> Quorum, for fruitful discussions about this research.<br />
For their endless efforts on the administrative end <strong>of</strong> things, I owe great appreciation to Belén<br />
Flores and Paula Floro. I would also like to thank the funding agencies that both directly and<br />
indirectly made this research possible: the Survey <strong>of</strong> <strong>California</strong> and Other Indian Languages, the<br />
Sven and Astrid Liljeblad Endowment Fund, and the UC <strong>Berkeley</strong> Office <strong>of</strong> the President. In<br />
addition, I would like to thank the creators <strong>of</strong> the free s<strong>of</strong>tware I used to conduct my research,<br />
Praat (Boersma & Weenink, 1992) and R (R Development Core Team, 2009).<br />
Finally, I am grateful to those who started me down the path <strong>of</strong> my current research, especially<br />
Deanna Kingston and Joan Gross, who have been my mentors since my undergraduate years at<br />
Oregon State <strong>University</strong>. My wonderful husband, Michael Taylor, has not only been ceaselessly<br />
supportive and encouraging, he helped me model the spectral overlap assessment metric<br />
(SOAM) used in Chapters 2 and 3. Many thanks are due to him. And last, but certainly not least,<br />
appreciation is due to my parents, James and Amy Haynes, who have supported and encouraged<br />
me from my first day.<br />
ix
This dissertation examines phonetic and phonological changes that adult learners may bring to<br />
the dialect <strong>of</strong> Oregon Northern Paiute (known by speakers, and hereafter referred to, as <strong>Numu</strong>)<br />
spoken in Warm Springs, Oregon. In this community, the majority <strong>of</strong> potential future speakers<br />
are learning the language as teenagers and adults, after the critical period <strong>of</strong> acquisition. The<br />
research therefore compares the productions <strong>of</strong> non-speakers repeating <strong>Numu</strong> words to the<br />
productions <strong>of</strong> fluent speakers in an effort to determine the types <strong>of</strong> changes that adult learners<br />
may bring to the language. However, these changes will not ultimately signal the language’s<br />
demise if the language community continues to accept it as a viable marker <strong>of</strong> their culture. The<br />
second part <strong>of</strong> the research, therefore, examines fluent speakers’ reactions to non-speakers’<br />
productions in order to identify which differences in pronunciation contribute to a perception <strong>of</strong><br />
accented speech. These are the differences that must be addressed if learners wish to produce<br />
unaccented speech.<br />
1.2 Language acquisition and language change<br />
Though the mechanisms by which children and adults acquire phonology are still under debate<br />
(see, for example, Flege, 1987; Flege, 1992; Montrul, 2006), it is widely accepted that the<br />
majority <strong>of</strong> adults learn languages less perfectly than children. Adult-learned language may<br />
include illicit syllables, incorrect stress and intonation, mistimed or misapplied gestures, long or<br />
short phoneme duration, long or short voice onset time (VOT), and a number <strong>of</strong> other aspects<br />
that are noticeable to fluent speakers but difficult for the adult learners to control (Au et al.,<br />
2002; Davidson, 2006). Learner-produced language is described as interlanguage, a term<br />
introduced by Selinker (1969; 1972), which implies that the learner has not yet fully acquired the<br />
second language, but is speaking something that falls in between the first and second language.<br />
The term transfer effects refers to the use <strong>of</strong> linguistic structures from the first language in the<br />
production <strong>of</strong> a second language. Schachter (1993) treats transfer as a by-product <strong>of</strong> language<br />
hypothesis testing rather than its own distinct process. Under her model, adults formulate and test<br />
hypotheses about the new language’s structures, which may be influenced by either what they<br />
know about the language, what they know about their first language, or a mixture <strong>of</strong> both. She<br />
notes that the implication <strong>of</strong> this model is that the first language will have the same amount <strong>of</strong><br />
influence on the second language regardless <strong>of</strong> how related the two languages are, but the<br />
influence itself will differ.<br />
This model is disputed by Corder (1993), who argues that the term transfer does not adequately<br />
describe the process by which an interlanguage is formed. Instead, he contends that learners<br />
speak a simplified form <strong>of</strong> language, more akin to a child’s grammar or even a universal<br />
grammar than to their mother tongue. Stauble (1980) also discusses the language acquisition<br />
process in terms <strong>of</strong> universal grammatical simplification. Initially, the learner reduces the target<br />
language grammar for ease <strong>of</strong> use while still maintaining a minimum ability to communicate.<br />
Later, the learner elaborates on the simplified system with some grammatical elements <strong>of</strong> the<br />
language, but still exhibits features <strong>of</strong> the reduced system. Major (2001), however, incorporates<br />
both processes <strong>of</strong> simplification and transfer effects into his ontogeny phylogeny model (OPM)<br />
<strong>of</strong> second language phonological acquisition. This model proposes that a given interlanguage<br />
(IL) includes three interacting elements: the first language (L1), the second language (L2), and<br />
language universals (U). In the beginning stages, the interlanguage consists almost entirely <strong>of</strong> the<br />
2
first language (IL = L1). As the learner’s ability in the second language increases, the role <strong>of</strong> the<br />
first language decreases, until the interlanguage reaches the idealized state IL = L2. During this<br />
process, the role <strong>of</strong> universal simplification increases and then decreases, so that at some<br />
midpoint, the interlanguage includes all three elements (IL = L1 + U + L2).<br />
Ellis (1989) attributes even more complexity to interlanguage development, exploring it in terms<br />
<strong>of</strong> speakers’ sociolinguistic roles. He states, “Instead <strong>of</strong> measuring interlanguage using the<br />
yardstick provided by the target language... we need to illuminate the inner logic <strong>of</strong> learner<br />
systems by examining how they operate in the ‘pragmatic mode’” (p. 33). According to him,<br />
second language learners exhibit variation in their speech as a result <strong>of</strong> the conflict among<br />
natural simplifications and target norms, variation within the target language itself, and exposure<br />
to multiple varieties <strong>of</strong> the language. In his view, the learner tries out a new form, explores its<br />
potential communicative use in different contexts, and revises the interlanguage accordingly.<br />
Corder (1993, p. 29) states, “Ultimately most, but not all, the incorrect items are eliminated in<br />
the course <strong>of</strong> further learning while the correct items are incorporated into the permanent<br />
structure <strong>of</strong> the interlanguage.” However, adult learners tend not to reach this native-like<br />
endpoint, with their second language abilities instead undergoing fossilization, a term proposed<br />
by Selinker (1972) to describe the barrier to complete acquisition. Markham (1997) attributes<br />
fossilization to the creation <strong>of</strong> a closed-loop system, in which the learner relies on their own<br />
output as reinforcing input, thereby perpetuating any errors present in their own productions.<br />
Similarly, Flege & Liu (2001) argue that in order to move along the interlanguage continuum,<br />
substantial native-speaker input is essential. Furthermore, Lively, Logan, & Pisoni (1993) show<br />
that input from a diverse array <strong>of</strong> native speakers is required for learners to produce robust<br />
generalizations <strong>of</strong> sounds that are contrastive in the target language. Finally, feedback is required<br />
to achieve native-like speech, either directly (e.g., by being corrected) or indirectly (e.g., by not<br />
being understood). For example, Kowal & Swain (1997) find that in classroom situations where<br />
there are many learners and only a single teacher, students’ productive skills do not match their<br />
receptive skills and errors are common, because they have few opportunities to receive feedback.<br />
We might imagine therefore that the phenomenon <strong>of</strong> fossilization is highly pronounced for<br />
learners who have limited access to fluent speakers for input or feedback, which is <strong>of</strong>ten the case<br />
for learners <strong>of</strong> endangered languages. Indeed, the phenomena <strong>of</strong> interlanguage, fossilization, and<br />
transfer effects have been variously incorporated into explanations <strong>of</strong> change in endangered<br />
languages (e.g., Cook, 1995; Goodfellow, 2005; Trudgill, 1989). Pidginization, which likens<br />
endangered language change to the process <strong>of</strong> pidgin formation, has also been proposed<br />
(Dressler & Wodak-Leodolter, 1977; Hinton, 2001a). The factor that unites these theories is that<br />
as a language is spoken by fewer and fewer people, uncorrected “mistakes” become more<br />
prevalent, and eventually become part <strong>of</strong> the language’s permanent structure.<br />
1.3 The <strong>Numu</strong> language<br />
This study examines the phenomena described above associated with language acquisition in<br />
<strong>Numu</strong>, an Uto-Aztecan language <strong>of</strong> the Western Numic branch. Dialects <strong>of</strong> Northern Paiute are<br />
spoken in scattered communities throughout Oregon, Nevada, and <strong>California</strong>, but this study is<br />
concerned primarily with the language as it is currently spoken on the Confederated Tribes <strong>of</strong><br />
3
By the mid 1800s, thousands <strong>of</strong> settlers were entering and crossing the region every year. In<br />
1855, Joel Palmer, the Superintendant for the Oregon Territory, received orders to remove<br />
Native Americans in the Columbia Basin from their land, which he achieved through the<br />
establishment <strong>of</strong> treaties with various groups. In 1855, a treaty was made to establish the Warm<br />
Springs Reservation, signed by the United States and by Warm Springs (Sahaptin) and Wasco<br />
bands. In exchange for a promise <strong>of</strong> protection and support from the U.S. government, including<br />
the rights to fish, hunt, and gather in traditional areas and the right to govern their own affairs,<br />
these bands gave up claims to more than ten million acres <strong>of</strong> traditionally occupied land for a<br />
reservation covering little more than 1000 square miles (CTWS, 1984).<br />
Native American leaders, including members <strong>of</strong> the Walla Walla, Tygh, Wyam, Tenino, and<br />
John Day Bands (collectively known as the Warm Springs Tribe); and the Dalles and Dog<br />
(Hood) River bands (Wasco), were forced to accept the reservation sight unseen. Chief Mark, <strong>of</strong><br />
The Dalles Band, stated, “The place that you have mentioned I have not seen. There are no<br />
Indians or white men there yet, and that is the reason I say I know nothing about that country. If<br />
there were Indians and white there, then I would think it was a good country” (quoted in CTWS,<br />
1984, p. 24). Indeed, land on the reservation is considered generally poor for agriculture; the<br />
majority <strong>of</strong> the Tribes’ outside revenue comes from timber sales and from the tribally owned<br />
Kah-Nee-Ta Hot Springs Resort. These ventures became possible following the construction <strong>of</strong><br />
U.S. Highway 26 in the 1930s and 1940s (Hirst, 1973).<br />
Following the 1866-1868 military campaign <strong>of</strong> General Crook, several Northern Paiute bands<br />
who resided in southeastern Oregon were forced onto the Malheur Reservation, located in<br />
southeastern Oregon (see Figure 2). From there they were forced to move to the Yakima<br />
Reservation in south central Washington following the Bannock War <strong>of</strong> 1878 (the Malheur<br />
Reservation was then returned to the public domain). One small band settled on the Warm<br />
Springs Reservation (Hirst, 1973). In 1937, under the provisions <strong>of</strong> the 1934 Indian<br />
Reorganization Act, the three reservation tribes adopted a constitution and renamed themselves<br />
the Confederated Tribes <strong>of</strong> Warm Springs <strong>of</strong> Oregon. Currently, approximately 4000 tribal<br />
members live on the reservation.<br />
5
1.3.2 The Warm Springs languages<br />
The three indigenous languages spoken on the Confederated Tribes <strong>of</strong> Warm Springs<br />
Reservation are <strong>Numu</strong>, Ichishkin (a Sahaptian language), and Kiksht (a Chinookan language). 1<br />
<strong>Numu</strong> and Ichishkin are still spoken by adults, but are not being transmitted inter-generationally<br />
on the reservation, putting them at Level 7 on Fishman’s (1991) scale <strong>of</strong> endangerment (Level 8<br />
being the most endangered). Kiksht is only spoken by one person who is over 90 years old, and<br />
is therefore a Level 8 language. Ichishkin is the most robust indigenous language in Warm<br />
Springs, though it has fewer than 50 fluent speakers. <strong>Numu</strong> has fewer than 10 speakers in Warm<br />
Springs, but dialects <strong>of</strong> the language are spoken in scattered communities throughout Oregon,<br />
<strong>California</strong>, and Nevada. Nonetheless, it is spoken by fewer than 500 people overall and is<br />
considered endangered (Thornes, 2003).<br />
The current study deals with the future <strong>of</strong> one <strong>of</strong> these languages, <strong>Numu</strong>, but an examination <strong>of</strong><br />
its historical trajectory in Warm Springs in conjunction with the other two languages is crucial to<br />
understanding its possible future outcomes. The next section therefore provides an overview <strong>of</strong><br />
language loss and efforts for revitalization in Warm Springs, presented in the context <strong>of</strong> national,<br />
statewide, and local policies and practices. The discussion centers around education, because the<br />
primary means for language policy enactment in the United States has occurred through its<br />
education system, and because this education system has largely been blamed for the attempted<br />
eradication <strong>of</strong> Native American languages (Crawford, 1996; Gross, 2007). Interestingly, efforts<br />
to revitalize many Native American languages have also involved formal education systems (for<br />
better or for worse), and so the institution <strong>of</strong> education remains central to most discussions <strong>of</strong><br />
North America’s indigenous languages.<br />
1.3.3 The Warm Springs language program<br />
At the turn <strong>of</strong> the nineteenth century, the United States government began instituting policies<br />
aimed at “civilizing” Native American people, primarily through educating their children to<br />
conform to Western cultural norms. These policies began with the funding <strong>of</strong> missionary schools<br />
through the Civilization Fund Act <strong>of</strong> 1819, and continued with the establishment <strong>of</strong> boarding<br />
schools, which were specifically designed to separate Native American children from the<br />
influence <strong>of</strong> their parents and communities (Adams, 1995). Conditions in boarding schools were<br />
<strong>of</strong>ten deplorable. Children experienced intense homesickness, exposure to outbreaks <strong>of</strong><br />
communicable diseases like typhoid and tuberculosis, physical and emotional abuse, and harsh<br />
punishments for speaking their mother tongue (Child, 1998). In 1880, regulations were issued<br />
that all instruction in schools serving Native American students, be they missionary or<br />
government boarding schools, must occur in English (Reyhner, 1993). This directive was<br />
reiterated in 1887 by J.D.C. Atkins, the Commissioner <strong>of</strong> Indian Affairs, who wrote, “The<br />
instruction <strong>of</strong> Indians in the vernacular is not only <strong>of</strong> no use to them, but is detrimental to the<br />
cause <strong>of</strong> their education and civilization, and it will not be permitted in any Indian school”<br />
(Prucha, 2000, p. 174).<br />
In Oregon, the first Western schools were established by Christian missionaries, many <strong>of</strong> whom<br />
attempted to learn local languages and tolerated the use <strong>of</strong> Native American languages in<br />
classrooms (Gross, 2007). However, by the 1850s, federally run schools were beginning to<br />
1 <strong>Numu</strong>, Ichishkin, and Kiksht are the names <strong>of</strong> the Warm Springs languages in those respective languages.<br />
Northern Paiute, Sahaptin, and Wasco are the English names. Non-English names are used throughout this paper.<br />
7
eplace mission schools, including one in Warm Springs. The Treaty <strong>of</strong> 1855 that established the<br />
Confederated Tribes <strong>of</strong> Warm Spring’s <strong>of</strong>ficial relationship with the United States federal<br />
government stipulated that a school house, teacher, books, and supplies be provided to the tribes.<br />
However, Indian Agent William Logan reported that the school building that was eventually<br />
built was “not fit to keep school in during the fall and winter, too small, and not finished”<br />
(quoted in Clemmer, 1980, pg. 32). It was attended sporadically, mostly in the winter, due to<br />
children’s participation in traditional sustenance activities with their parents during the rest <strong>of</strong> the<br />
year. Due to their low rates <strong>of</strong> attendance, in 1861 William H. Rector, Superintendant <strong>of</strong> Indian<br />
Affairs in Oregon, recommended the establishment <strong>of</strong> a boarding school. The boarding school<br />
became a reality in 1870, with a curricular focus on domestic chores and manual labor. Students<br />
who lived nearby still attended it as a day school. Another boarding school on the reservation<br />
was established in 1882 in Simnasho, and in 1880, a large boarding school in Forest Grove, more<br />
than 100 miles from Warm Springs, was established that was also attended by some students<br />
from Warm Springs (Clemmer, 1980).<br />
Despite the presence <strong>of</strong> two boarding schools on the reservation, attendance continued to be<br />
sporadic. In his 1882-83 school report, Indian Agent John Smith stated, “It has been difficult to<br />
keep the children at this school. Their parents and friends do not fully appreciate the advantages<br />
<strong>of</strong> the [industrial] training we aim to give, and too <strong>of</strong>ten take the children’s part, when they run<br />
<strong>of</strong>f home, on account <strong>of</strong> having been corrected, or from getting homesick” (quoted in Clemmer,<br />
1980, p. 108). Clemmer surmises that “being corrected” in the Warm Springs school was similar<br />
to customary discipline at Native American schools throughout the nation, and would have<br />
included harsh, demeaning, and abusive practices.<br />
In 1897, the two reservation boarding schools were combined to form a single boarding school in<br />
Warm Springs (Clemmer, 1980). In another study I conducted in Warm Springs (Haynes, In<br />
Press), one woman who had attended this boarding school said:<br />
Before I went to the boarding school, I was speaking [Ichishkin], and all my sisters and<br />
brothers were speaking it. That’s all we spoke, and then we got into boarding school and<br />
we were not allowed to speak. And I grew up believing that it was something very bad,<br />
because we got punished, or switched, and so they just kind <strong>of</strong> beat it out <strong>of</strong> me. My<br />
mother and father spoke it all the time and my grandmother who lived here spoke it all<br />
the time. But once we started going to school, my grandmother was forbidden even to<br />
speak in the house, especially at our table, because my parents were trying to get us ready<br />
for the new world... And so grandma could not talk to us, because that’s all she spoke,<br />
was that language. That was a very sad time …That boarding school did bad stuff to us,<br />
and they took the most important thing, which was our language.<br />
This woman’s experience is typical <strong>of</strong> an institution aimed at the systematic assimilation <strong>of</strong><br />
Native American people through eradication <strong>of</strong> their language and ties to older or more<br />
traditional family members. However, as early as the late 19 th century, there was visible<br />
opposition to the way in which Native American children were being taught, from the oppression<br />
<strong>of</strong> their languages and cultures to the inferiority <strong>of</strong> instruction they received from ill-prepared<br />
and under-trained teachers (Reyhner, 1993). In 1928, the Meriam Report, commissioned by<br />
Secretary <strong>of</strong> the Interior Hubert Work and directed by Louis Meriam, strongly criticized the<br />
8
oarding school system and English-only policies. Not only did it admonish school <strong>of</strong>ficials to<br />
not separate young children from their families, it recommended an inclusive attitude towards<br />
Native American culture, stating, “The Indians have much to contribute to the dominant<br />
civilization, and the efforts should be made to secure this contribution” (quoted in Prucha, 2000,<br />
p. 220).<br />
The rise <strong>of</strong> the Civil Rights movement in the United States yielded increasingly favorable<br />
mainstream attitudes about Native American cultures and languages and more critical<br />
examinations <strong>of</strong> Native American education. In 1969, Senator Robert F. Kennedy spearheaded<br />
the Report on Indian Education, the summary <strong>of</strong> which stated,<br />
We have concluded that our national policies for educating American Indians are a<br />
failure <strong>of</strong> major proportions. They have not <strong>of</strong>fered Indian children—either in years past<br />
or today—an educational opportunity anywhere near equal to that <strong>of</strong>fered the great bulk<br />
<strong>of</strong> American children (quoted in Prucha, 2000, p. 254).<br />
The rising recognition <strong>of</strong> inequities in Native American education led to the passage <strong>of</strong> the<br />
Indian Education Act in 1972, which provided much needed funds for Native American<br />
education programs, created a new Office <strong>of</strong> Indian Education within the Office <strong>of</strong> Education,<br />
and created the National Advisory Council for Indian Education. The Advisory Council was to<br />
be made up entirely <strong>of</strong> representatives from Native American tribes, who would be responsible<br />
for advising congress on Native American education issues (“The Indian education act”, 1975).<br />
More recently, in 1990, congress passed the ground-breaking Native American Languages Act,<br />
which recognizes the special status <strong>of</strong> Native American languages in the United States and<br />
promotes and encourages their use in public school classrooms. Furthermore, it forbids the<br />
restriction <strong>of</strong> public use <strong>of</strong> Native American languages, including use in public school<br />
classrooms, and allows modification <strong>of</strong> teacher certification to make it easier for fluent speakers<br />
<strong>of</strong> Native American languages to teach in public schools (Native American Languages Act,<br />
1990). Some states have taken advantage <strong>of</strong> this provision, including Oregon, where this study<br />
takes place. In 2001, at the urging <strong>of</strong> several <strong>of</strong> Oregon’s tribes, Oregon’s legislature passed<br />
Oregon Senate Bill 690, which allows speakers <strong>of</strong> Native American languages who don’t hold<br />
teaching certificates to teach in public school classes with a regular classroom teacher present<br />
(Haynes, 2007).<br />
Despite these advances, however, public education in the United States has largely remained a<br />
vehicle <strong>of</strong> Western culture, with curricula and materials that espouse Western historical<br />
narratives and cultural ideals (see Cummins, 1988). Teachers tend to favor Western modes <strong>of</strong><br />
communication in classrooms with Native American students (St. Charles & Costantino, 2000;<br />
Philips, 1983). The introduction <strong>of</strong> Native American cultural and linguistic materials is <strong>of</strong>ten<br />
superficial or marginalized, even in schools with primarily Native American populations (e.g.,<br />
Haynes, 2004; Greymorning, 2001; Suina, 2004; White, 2001). Lomawaima & McCarty (2006)<br />
provide a compelling explanation for such marginalization through their introduction <strong>of</strong> the<br />
safety zone. They argue that this zone demarcates “allowable cultural expression” for Native<br />
Americans within the nation’s schools, fluctuating with the nation’s general tolerance <strong>of</strong> non-<br />
Western cultures and peoples. Through the safety zone, the institution <strong>of</strong> United States education<br />
9
would therefore be inappropriate to refer to them as “learners,” though I do draw heavily on<br />
language acquisition research throughout the study. For the purposes <strong>of</strong> this research, I have<br />
assumed that non-speaker participants represent potential learners, and that their productions<br />
represent the productions <strong>of</strong> people at early stages <strong>of</strong> learning who have not received a great deal<br />
<strong>of</strong> feedback. This may be a more accurate representation than anticipated; with the rising<br />
availability <strong>of</strong> electronic language materials, it is likely that at least some adults will begin (or<br />
have begun) practicing <strong>Numu</strong> words and phrases without direct access to a fluent speaker.<br />
1.4.4 Phonetic vs. phonological change<br />
In this study, several characteristics <strong>of</strong> the <strong>Numu</strong> sound system are examined in a comparison <strong>of</strong><br />
fluent speaker and non-speaker productions. These can be divided into phonological and<br />
phonetic features, though the two categories are interrelated and the distinction is therefore <strong>of</strong>ten<br />
blurred in studies <strong>of</strong> speech acquisition. I have adopted a slightly modified version <strong>of</strong> Markham’s<br />
(1997) dichotomy <strong>of</strong> phonetic and phonological acquisition. He defines phonological acquisition<br />
as the establishment <strong>of</strong> abstract categories for production and perception <strong>of</strong> the target language,<br />
including permissible variation within those categories. He defines phonetic acquisition as the<br />
establishment <strong>of</strong> surface production and perception <strong>of</strong> sounds in the target language, including<br />
the ability to relate perception to performance. Markham’s description is restricted to the<br />
segment level, so I would also add the acquisition <strong>of</strong> syllable and word-level outputs that are not<br />
licensed in the first language to the phonological category. I would also add the establishment <strong>of</strong><br />
sub-phonemic characteristics <strong>of</strong> the target language to the phonetic category (e.g., voice onset<br />
time, vowel duration, etc.) These distinctions are summarized in Table 1.<br />
Table 1. The distinction between phonetic and phonological acquisition.<br />
Phonological acquisition • abstract categories for production and perception<br />
• permissible variation within categories<br />
• rules governing syllable- and word-level outputs<br />
Phonetic acquisition • surface production and perception <strong>of</strong> segments<br />
• surface production and perception <strong>of</strong> sub-phonemic<br />
features<br />
Because the majority <strong>of</strong> the participants in this research have not actively learned <strong>Numu</strong>, and<br />
because their productions are based on an imitation task, it is impossible to directly measure their<br />
phonological acquisition. However, it is possible to determine if non-speakers are able to ignore<br />
English phonological rules in order to correctly produce sounds and sound combinations that are<br />
licensed in <strong>Numu</strong>. Therefore, this research examines several phonological processes in <strong>Numu</strong><br />
resulting in outputs that are not licensed in English. It also examines a number <strong>of</strong> sub-phonemic<br />
features to determine if English speakers achieve <strong>Numu</strong> phonetic targets.<br />
1.5 Theoretical and practical contributions<br />
This research makes contributions to our understanding <strong>of</strong> phonetic and phonological change in<br />
endangered language contexts from a socio-phonetic perspective. For linguists, all changes in<br />
Warm Springs Language and Culture Department has worked on developing electronic media for language learning<br />
purposes.<br />
13
present in a given production in order to determine which features are linked to lower ratings.<br />
These features are considered significant elements <strong>of</strong> accented speech, and are compared to<br />
features that were emphasized in the productions <strong>of</strong> non-speakers from Warm Springs to<br />
determine if socially salient features for non-speakers correspond to salient features for fluent<br />
speakers. Implications for accent in speech produced by learners are discussed. Finally, Chapter<br />
6 concludes the dissertation with a discussion <strong>of</strong> wider implications for endangered language<br />
change and the use <strong>of</strong> electronic media in endangered language learning.<br />
15
danger is in accepting this text as a standard <strong>of</strong> <strong>Numu</strong> speech, as opposed what it is meant to be,<br />
namely a description <strong>of</strong> the language as it is produced by a small group <strong>of</strong> people in a particular<br />
context at a given time.<br />
This danger is more pronounced insomuch as this description is not complete. It is derived<br />
primarily from acoustic measurements <strong>of</strong> segments, particularly vowels, nasals, word initial<br />
consonants, and the intervocalic fortis/lenis distinction. These types <strong>of</strong> segments are <strong>of</strong> particular<br />
interest because they are likely to show transfer effects from English in adult learner speech. A<br />
more complete account would also provide a detailed examination <strong>of</strong> contextual variation, but<br />
such a description would require a larger set <strong>of</strong> data than was available for this study. Another<br />
area for further study is direct measurements <strong>of</strong> articulatory gestures by <strong>Numu</strong> speakers.<br />
However, measurements <strong>of</strong> this kind, such as those produced in palatography,<br />
electroglottography, ultrasounds, and magnetic resonance imaging (MRI), are beyond the scope<br />
<strong>of</strong> the current work, which aims to provide a baseline description for current and future teaching<br />
and research.<br />
We turn next to a description <strong>of</strong> the study methods in §2.2. <strong>Numu</strong> consonants are described in<br />
§2.3, including onset VOT, the fortis/lenis contrast, and nasal duration. Then, spectral and<br />
durational measures <strong>of</strong> vowels are explored in §2.4. The methodology and results <strong>of</strong> the SOAM<br />
procedure are described in §2.5. Next, variation in speaker productions are explored in §2.6, and<br />
the chapter concludes in §2.7.<br />
2.2 Methods 6<br />
All data for this study are drawn from a set <strong>of</strong> recordings that were collected over the course <strong>of</strong><br />
one year, from January 2008 to January 2009, for the purpose <strong>of</strong> creating an on-line audio<br />
dictionary <strong>of</strong> <strong>Numu</strong>. A total <strong>of</strong> four fluent speakers were recorded saying <strong>Numu</strong> words and<br />
phrases. Speakers included Speaker A, who was the head Paiute teacher for Warm Springs<br />
Language Program at the time <strong>of</strong> the recording; Speaker B, who lived in Warm Springs; and<br />
Speaker C and Speaker D, who were both teachers in the Program. Speaker A is originally from<br />
Burns, but has lived most <strong>of</strong> her adult life in Warm Springs. Speakers B, C, and D are all<br />
originally from McDermitt, Nevada (McDermitt is ten miles from the Oregon border). All four<br />
speak <strong>Numu</strong> similarly due to their long residence in Warm Springs, but individual variation<br />
among the speakers will be addressed in §2.6.<br />
Recordings took place at the Culture and Heritage Department on the Confederated Tribes <strong>of</strong><br />
Warm Springs Reservation in the quietest room possible, as no sound-pro<strong>of</strong> room was available.<br />
All four speakers were recorded on either a Marantz PMD660 solid-state recorder with an AKG<br />
C420 head mounted condenser microphone, or an M-AUDIO Mobile-Pre USB preamp audio<br />
interface with an AKG C520 head mounted condenser microphone. All data were sampled at at<br />
least 44.1 kHz. All speakers except Speaker A produced each word a total <strong>of</strong> two times; Speaker<br />
A produced each word once. A total <strong>of</strong> 281 tokens representing 94 words were selected from<br />
these recordings for acoustic analysis. (See Appendix A for a complete list <strong>of</strong> words.) All<br />
analyses were carried out in PRAAT (Boersma & Weenink, 1992).<br />
6 All statistical analyses for this research were performed in R (R Development Core Team, 2009).<br />
17
features because they occur as a final element <strong>of</strong> a morpheme, affecting the following consonant.<br />
As such, these contrasts only occur word-medially; the distinction is neutralized in the onset<br />
position. Final features are a productive morphological phenomenon synchronically. Their<br />
effects are also seen morpheme-internally, a phenomenon that <strong>of</strong>ten (but not always) has a<br />
traceable diachronic explanation (Nichols, 1974).<br />
The presence <strong>of</strong> final features affecting morphophonemic processes in the Numic languages was<br />
first proposed by Sapir (1930), who describes a three-way contrast <strong>of</strong> spirantization, gemination,<br />
and nasalization in Southern Paiute consonants. The southern dialects <strong>of</strong> Northern Paiute exhibit<br />
a three-way contrast between lenis, fortis, and voiced fortis series; the voiced fortis series<br />
appears as nasalized stops in Ute and Shoshone (Liljeblad, 1966). In the dialect examined here,<br />
however, there is only one final feature contrast: that <strong>of</strong> fortis and lenis consonants. Throughout<br />
this chapter, lenis consonants will be differentiated from fortis consonants by writing them as<br />
voiced stops (b, d, and g), though Thornes (2003) reports there is a great deal <strong>of</strong> gradation in<br />
natural speech, so that in careful speech, “a fortis consonant is ideally an unvoiced geminate<br />
stop, whereas a lenis consonant is ideally a voiced fricative” (p. 29).<br />
Waterman (1911) reports on relative length <strong>of</strong> occlusion between lenis and fortis <strong>Numu</strong><br />
obstruents, finding that the fortis sounds are approximately double the length <strong>of</strong> the lenis sounds.<br />
Babel (In Press) also examines closure duration, as well as release duration and percent voicing<br />
<strong>of</strong> the three-way lenis-fortis constrast in Mono Lake Northern Paiute and Carson Desert Northern<br />
Paiute (two southern dialects <strong>of</strong> Northern Paiute). Her findings are similar to those <strong>of</strong> Waterman,<br />
with fortis occlusion approximately double that <strong>of</strong> lenis occlusion. However, measures <strong>of</strong><br />
duration may not fully address previously described differences between these <strong>Numu</strong> sound<br />
contrasts. Waterman (1911, p. 19) notes that a “vigorous explosion” accompanies the fortis<br />
articulations. Thornes (2003, p. 28) also reports that the fortis is “articulated with full and<br />
forceful occlusion <strong>of</strong> the articulatory mechanism.” These observations are impressionistic, and<br />
little data is available about the phonetic correlates <strong>of</strong> the lenis/fortis contrast in this language.<br />
This study will address durational differences (VOT and closure), but will also explore other<br />
acoustic correlates <strong>of</strong> the “forceful” and “vigorous” nature <strong>of</strong> fortis obstruents, following the<br />
DiCanio’s (2008) description <strong>of</strong> fortis and lenis consonants in San Martín Itunyoso Trique and<br />
Sundara’s (2005) cross-linguistic study <strong>of</strong> coronal stops in Canadian French and English.<br />
DiCanio (2008) attributes three acoustic and articulatory correlates to differences in articulatory<br />
strength between segments described as fortis and lenis: degree <strong>of</strong> articulatory constriction,<br />
amplitude <strong>of</strong> the burst, and speed <strong>of</strong> formant transitions. He uses these measures to determine if<br />
strength is a distinctive phonological feature in Trique (as opposed to a secondary correlates <strong>of</strong><br />
another feature). I propose that the distinctiveness <strong>of</strong> strength is also important for the acquisition<br />
<strong>of</strong> a language’s phonetic and phonological system, because learners must make appropriate<br />
decisions about the primary articulatory and acoustic correlates <strong>of</strong> a language’s segments in<br />
order to perceive and produce the language correctly.<br />
Due to limitations in data, only measurements <strong>of</strong> relative burst amplitude are possible in this<br />
study (measurements <strong>of</strong> formant trajectories would have required a larger number <strong>of</strong> nonpreaspirated<br />
consonants than were available in the data set, and no articulatory measurements<br />
were taken). However, Sundara (2005) has found significant differences in four spectral<br />
19
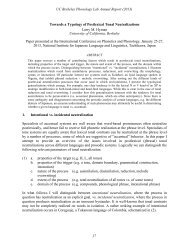
Figure 4 provides a comparison <strong>of</strong> mean VOT values for fortis and lenis consonants at all places<br />
<strong>of</strong> articulation. There here is a much larger range <strong>of</strong> deviation for lenis obstruents, an indication that<br />
they exhibit more variation in pronunciation than fortis consonants. . This is expected, as they<br />
range from voiceless singleton sounds to voiced fricatives (cf. Thornes, 2003). Though only<br />
obstruents were measured here, the onset <strong>of</strong> voicing ranged from the beginning <strong>of</strong> the consonant<br />
closure to the onset <strong>of</strong> the following vowel. A two-sample t-test shows mean n fortis VOT is<br />
significantly longer than mean lenis VOT [t(89 [t(89)=5.63, p < 0.001] by 25.76 ms, though there is no<br />
significant difference at the bilabial place <strong>of</strong> articulation articulation. This result may be attributable to the<br />
fact that lenis bilabials tend to be eithe either r unvoiced or fully spirantized (and thus excluded from the<br />
current measurement), while there are a larger number <strong>of</strong> voiced obstruents in the coronal and<br />
velar lenis data.<br />
Figure 4. Mean VOT for fortis and lenis obstruents aat<br />
t bilabial, coronal, and velar places <strong>of</strong> articulation,<br />
and overall mean VOT for fortis and lenis obstruents.<br />
(Error bars indicate one standard deviation.)<br />
2.3.1.2 Fortis and lenis obstruent/fricative dduration<br />
Closure duration was measured from the closure <strong>of</strong> the articulators until the burst. Closure was<br />
determined by a sudden drop in spectral energy and reduced (or zero) amplitude. It was<br />
measured for 31 tokens <strong>of</strong> fortis /p/, 33 tokens <strong>of</strong> fortis /t/, and 24 tok tokens ens <strong>of</strong> fortis /k/. Table 5<br />
presents mean closure durations and standard deviations for fortis obstruents.<br />
21
Table 5. Mean closure duration and standard deviation for fortis obstruents.<br />
Mean Closure Duration (ms) SD (ms)<br />
p 199.19 32.97<br />
t 191.73 29.40<br />
k 177.34 26.83<br />
All 190.44 30.95<br />
Closure duration was measured for 97 tokens <strong>of</strong> lenis /b/, 31 tokens <strong>of</strong> lenis /d/, and 42 tokens <strong>of</strong><br />
lenis /g/. For lenis obstruents, closure was measured from the closure <strong>of</strong> the articulators to the<br />
burst. For lenis fricatives, closure was measured from the beginning <strong>of</strong> frication to the first<br />
increased vocal fold pulse indicating the onset <strong>of</strong> the following vowel. Table 6 presents mean<br />
closure durations and standard deviations for lenis obstruents.<br />
Table 6. Mean closure duration and standard deviation for lenis obstruents and fricatives.<br />
Mean Closure Duration (ms) SD (ms)<br />
b 98.82 48.46<br />
d 50.87 19.01<br />
g 79.41 33.83<br />
All 88.25 44.40<br />
As observed with VOT, lenis sounds have a greater range <strong>of</strong> durational variation. <strong>Numu</strong> fortis<br />
sounds are nonetheless more than double the length <strong>of</strong> <strong>Numu</strong> lenis sounds, a finding that is<br />
consistent with the findings <strong>of</strong> both Waterman (1911) and Babel (In Press). Duration ratios are<br />
provided in Table 7. Note that coronal sounds exhibit the largest mean fortis:lenis duration ratio,<br />
with fortis coronals more than three times as long as lenis coronals. This may be due to the<br />
frequent use <strong>of</strong> a coronal flap, which has short contact time, as a lenis coronal allophone.<br />
Table 7. Mean closure duration ratios for fortis:lenis consonants.<br />
POA Fortis:Lenis Duration<br />
bilabial 2.02<br />
coronal 3.77<br />
velar 2.23<br />
All 2.16<br />
Figure 5 shows a comparison <strong>of</strong> mean fortis and lenis duration, as well as the ratio <strong>of</strong> the<br />
difference between them. The overall difference in mean duration between fortis and lenis<br />
consonants is significant at the p
a) b)<br />
c)<br />
Figure 15. Two dimensional overlap figures <strong>of</strong> F2xF1 for a) i~i, b) u~u, and c) a~a<br />
(Long vowels are red circles, short vowels are blue diamonds, and overlapping points are green x’s.)<br />
37
generally speak American Indian English (AIE) in addition to the variety <strong>of</strong> Standard American<br />
English (SAE) spoken in the Central Oregon region. Impressionistically, AIE as it is spoken in<br />
Warm Springs differs from SAE largely at a lexical and discourse level, not phonetically. Leap<br />
(1993), who provides a detailed description <strong>of</strong> AIE, also does not report a great deal <strong>of</strong> phonetic<br />
variation from SAE in different varieties <strong>of</strong> AIE, stating, “Sound systems <strong>of</strong> Indian English<br />
rearrange sound contrasts found in standard English usage, but contain very few sound segments<br />
that are completely alien to standard English phonology” (p. 45).<br />
Furthermore, if AIE as it is spoken in Warm Springs has been influenced by the indigenous<br />
languages spoken there, it will have been influenced by all three <strong>of</strong> the indigenous languages,<br />
with no particular advantage given to <strong>Numu</strong>. As we have seen in the previous section, Ichishkin<br />
and Kiksht provide very few advantages to speaking <strong>Numu</strong>, with the possible exception <strong>of</strong><br />
vowel lengthening. Indeed, phonological vowel lengthening has been observed in some varieties<br />
<strong>of</strong> AIE as a result <strong>of</strong> influence from local indigenous languages (Leap, 1993). This aspect <strong>of</strong> nonspeaker<br />
productions will therefore have to be analyzed with some caution.<br />
3.2.3 Stimuli<br />
Stimuli for this experiment included 281 <strong>Numu</strong> tokens produced by four fluent speakers. Tokens<br />
had been recorded in a quiet room at the Warm Springs Culture and Heritage Department with an<br />
M-AUDIO pre-amp and AKG C520 head-mounted condenser microphone, as described in<br />
Chapter 2. The words were produced during general language elicitation sessions, and as a result,<br />
not every token selected for this experiment was produced by all four speakers. However, most<br />
tokens were produced by at least two <strong>of</strong> the fluent speakers.<br />
A total <strong>of</strong> 94 separate words were included in the data set. (See Appendix A for a complete list <strong>of</strong><br />
words and the number <strong>of</strong> tokens <strong>of</strong> each.) Words were selected to maximize the number <strong>of</strong><br />
contrastive <strong>Numu</strong> features that were represented, while at the same time minimizing the total<br />
number <strong>of</strong> words that would be presented to study participants.<br />
3.2.4 <strong>Study</strong> procedure<br />
Participants completed the experiment individually in a quiet room either in the Warm Springs<br />
Culture and Heritage Department, or at a private house or small <strong>of</strong>fice in Madras. Tokens were<br />
presented in blocks by speakers at a comfortable volume over open-air digital headphones with a<br />
frequency range <strong>of</strong> 20-20,000 Hz, sensitivity <strong>of</strong> 105 dB/1 mW, and impedance <strong>of</strong> 32 ohms <br />
10%. Open-air headphones were used in order to simulate the same level <strong>of</strong> outside noise that<br />
language learners might experience should they ever attempt to learn <strong>Numu</strong>, either in a class or<br />
using a home computer, though outside noise was minimal in the experiment environs.<br />
The experiment interface was designed using Praat’s Multiple Forced Choice (MFC) listening<br />
experiment function (Boersma & Weenink, 2008). At the beginning <strong>of</strong> the experiment, each<br />
participant was given a practice test with five English tokens repeated three times, or until the<br />
participant indicated that they were comfortable with the procedure. At the beginning <strong>of</strong> the<br />
procedure and preceding each speaker block, participants were presented with a screen that read,<br />
“Repeat each word you hear into the microphone, then push NEXT. Click to start.” Upon<br />
clicking the screen with a mouse, they heard a single token. They were presented with a “repeat”<br />
button that allowed the token to be repeated a single time. After hearing each token, participants<br />
48
the consonants /t/ and d /s/ across syllables (e.g. ‘we ‘wet.suit’) or morphological boundaries<br />
‘wets’), ’), participants who fully transfer English phonological rules to <strong>Numu</strong> words will not<br />
produce the sound word-initially. initially. 13<br />
uit’) or morphological boundaries (e.g.<br />
’), participants who fully transfer English phonological rules to <strong>Numu</strong> words will not<br />
Word-initial initial /ts/ occurred in 19 <strong>of</strong> the tokens presented to participants. Their productions <strong>of</strong> this<br />
sound were examined and individual results are presented in Figure 17. This figure includes the<br />
percentage <strong>of</strong> total words correctly produced with /ts/, percent percentage <strong>of</strong> productions <strong>of</strong> other<br />
affricates that are licensed word-initially<br />
in English<br />
productions <strong>of</strong> /s/, and percentage<br />
cases where the total does not reach 100%, other sounds were produced or the word was not<br />
produced at all. This figure indicates that participants fro<br />
produce word-initial /ts/, though some individual participants from Madras produced the sound<br />
frequently (e.g., M7, a 50-year-old female with no previous <strong>Numu</strong> experience).<br />
14 initial /ts/ occurred in 19 <strong>of</strong> the tokens presented to participants. Their productions <strong>of</strong> this<br />
This figure includes the<br />
<strong>of</strong> productions <strong>of</strong> other<br />
(i.e., /t/ and //), percentage age <strong>of</strong><br />
age <strong>of</strong> productions <strong>of</strong> /t/, also licensed word-initially initially in English. In<br />
cases where the total does not reach 100%, other sounds were produced or the word was not<br />
produced at all. This figure indicates that participants from m Warm Springs were more likely to<br />
initial /ts/, though some individual participants from Madras produced the sound<br />
old female with no previous <strong>Numu</strong> experience).<br />
Figure 17. Percentage <strong>of</strong> word--initial<br />
initial tokens <strong>of</strong> /ts/ produced as /ts/, another affricate, /s/, or /t/, /t/ by<br />
participant.<br />
Some ome advantage in onset /ts/ production may be expected <strong>of</strong> people who know or have learned<br />
Ichishkin or Kiksht, languages that license this affricate word-initially.<br />
explored in Figure 18, which shows a comparison <strong>of</strong> word<br />
Warm Springs 1 group who have had exposure to Ichishkin or Kiksht, people in the Warm<br />
Springs 1 group who reported no pre<br />
group. In fact, there appears to be no advantage to having some knowledge <strong>of</strong> Ichishkin or<br />
15 ome advantage in onset /ts/ production may be expected <strong>of</strong> people who know or have learned<br />
This possibility is<br />
, which shows a comparison <strong>of</strong> word-initial initial /ts/ production by people in the<br />
Warm Springs 1 group who have had exposure to Ichishkin or Kiksht, people in the Warm<br />
Springs 1 group who reported no previous vious exposure to these languages, and the Warm Springs 2<br />
group. In fact, there appears to be no advantage to having some knowledge <strong>of</strong> Ichishkin or<br />
13<br />
Similarly, in borrowings from other languages, English speakers produce /ts/ word word-internally internally or word-finally word (e.g.,<br />
the German surname Katz), ), but not word word-initially (e.g., the Japanese word tsunami is frequently pronounced with a<br />
word-initial /s/).<br />
14<br />
In the case <strong>of</strong> some Warm Springs participants, the “other affricate” category also included some productions <strong>of</strong><br />
ejective /ts'/. /. These cases will be examined in more detail in § 3.3.4.<br />
15<br />
No advantage is expected for people who speak or have learned Spanish because, like English, it do does do not license<br />
word-initial /ts/.<br />
50
Kiksht; this group’s production <strong>of</strong> word word-initial initial /ts/ was lower than the productions <strong>of</strong> the other<br />
two groups.<br />
Figure 18. Percentage <strong>of</strong> word-initial<br />
initial tokens <strong>of</strong> /ts/ produced as /ts/, another affricate, /s/, or /t/ by<br />
members <strong>of</strong> the Warm Springs 1 group with previous exposure to Ichishkin or Kiksht, members <strong>of</strong> the<br />
Warm Springs rings 1 group with no previous exposure to these languages, and members <strong>of</strong> the Warm Springs<br />
2 group.<br />
Figure 19. Percentage <strong>of</strong> word-initial initial tokens <strong>of</strong> /ts/ produced as /ts/, another affricate, /s/, or /t/, by group.<br />
51
Figure 19 shows word-initial /ts/ production by participant group. Here, we see that the<br />
percentage <strong>of</strong> correct productions <strong>of</strong> word-initial /ts/ follow the pattern <strong>of</strong> amount <strong>of</strong> exposure to<br />
<strong>Numu</strong>, with the percentage <strong>of</strong> Warm Springs 2 productions > Warm Springs 1 productions ><br />
Madras productions. A chi-square test <strong>of</strong> the frequency <strong>of</strong> /ts/ production reveals that the three<br />
non-speaker groups differ significantly from each other and from the Fluent Speaker group [ 2<br />
(3)=107, p
Figure 20. Percentage <strong>of</strong> uvular sounds, velar sounds, and other sounds produced in <strong>Numu</strong> uvular<br />
contexts, by individual.<br />
Figure 21 shows the percentage <strong>of</strong> production <strong>of</strong> uvular sounds by group. A chi<br />
frequency <strong>of</strong> uvular productions confirms a significant difference between fluent speakers and<br />
the non-speaker groups [ 2 shows the percentage <strong>of</strong> production <strong>of</strong> uvular sounds by group. A chi-square square test <strong>of</strong><br />
frequency <strong>of</strong> uvular productions confirms a significant difference between fluent speakers and<br />
(3)=67, p
Figure 24 presents the vowel devoicing data by group. Here, the average number <strong>of</strong> devoiced<br />
tokens per group member is represented by the red bars, and the average number <strong>of</strong><br />
spontaneously devoiced tokens per group member is represented by the yellow triangles. Overall,<br />
more devoicing was found in productions by Warm Springs participants, and all Warm Springs<br />
participants devoiced vowels in several tokens. Surprisingly, members <strong>of</strong> the Warm Springs 2<br />
group produced more devoiced tokens on average than the Fluent Speaker group. Members <strong>of</strong><br />
the Warm Springs 2 group also produced more tokens <strong>of</strong> spontaneous devoicing than the other<br />
non-speaker groups. These average are presented in Table 25. A chi-square analysis reveals that<br />
the four groups differ significantly in average voiceless productions [ 2 (3)=280, p
voicing in the following vowel (arrow c), a secondary feature <strong>of</strong> some ejective productions (see<br />
Ladefoged & Maddieson, 1996).<br />
Table 26. Ejective production by Warm Springs participants.<br />
Participant WS1 WS2 WS3 WS5 WS6 WS9 WS11 WS14<br />
Warm Springs Group 1 2 2 2 2 2 1 1<br />
Total ejectives produced 19 1 1 16 1 2 8 12<br />
Types <strong>of</strong> ejectives<br />
produced<br />
<br />
<br />
<br />
<br />
<br />
<br />
<br />
<br />
<br />
<br />
<br />
k' a<br />
Figure 25. Waveform and spectrogram <strong>of</strong> /k'a/ produced by WS5. Arrow (a) indicates the oral release,<br />
arrow (b) indicates the glottal release, and arrow (c) indicates creaky voicing.<br />
Both <strong>of</strong> the participants who have had exposure to Kiksht (WS1 and WS14) and one <strong>of</strong> the<br />
participants who has had exposure to Ichishkin (WS11) produced ejectives. This is not<br />
surprising, as both Kiksht and Ichishkin have an extensive inventory <strong>of</strong> ejective consonants,<br />
including obstruent ejectives and affricate ejectives. The fluent speaker <strong>of</strong> Ichishkin did not<br />
produce ejectives, and it is likely that her fluency in Ichishkin allowed her to recognize the<br />
57
Figure 27. . Mean fortis VOT across groups by consonant.<br />
(Error bars indicate one standard deviation from the mean.)<br />
For lenis sounds, VOT was measured only in obstruents obstruents, as discussed in Chapter 2. 2 Table 28<br />
presents mean values and standard deviations <strong>of</strong> lenis VOT for both groups <strong>of</strong> non non-speakers non and<br />
fluent speakers. An analysis <strong>of</strong> variance shows no significant effect <strong>of</strong> Group, though the main<br />
effect <strong>of</strong> Consonant (b, d, and g) is significan significant t [F(2)=59.7, p
Table 30. Mean closure duration for fortis <strong>Numu</strong> consonants by group.<br />
(Standard deviations are in parentheses.)<br />
Madras<br />
Closure Duration<br />
(ms)<br />
Warm Springs 1<br />
Closure Duration<br />
(ms)<br />
63<br />
Warm Springs 2<br />
Closure Duration<br />
(ms)<br />
Fluent Speaker<br />
Closure Duration<br />
(ms)<br />
p 165.23 (66.3) 184.41 (67.6) 192.20 (61.0) 199.19 (33.0)<br />
t 168.65 (51.2) 175.76 (46.1) 178.31 (45.3) 191.73 (29.4)<br />
k 147.84 (44.0) 160.09 (53.3) 167.19 (53.3) 177.34 (26.8)<br />
All 161.93 (55.9) 174.43 (57.1) 180.22 (54.3) 190.44 (31.0)<br />
Table 31 reports duration results for lenis consonants. Note that the pattern here is different than<br />
fortis duration, with the Fluent Speaker group showing the shortest duration, followed by the<br />
Madras group, then the two Warm Spring groups. For lenis sounds, the main effects <strong>of</strong> Group<br />
and Consonant (b, d, and g) are significant (Group: F(3)=7.4, p
Table 37. Mean standard deviation <strong>of</strong> the burst for <strong>Numu</strong> obstruents by group.<br />
(Standard deviations are in parentheses.)<br />
Mean Fortis<br />
Burst SD (Hz)<br />
Mean Lenis<br />
Burst SD (Hz)<br />
67<br />
Difference Significance <strong>of</strong><br />
Difference<br />
Fluent Speaker 2982 (1088) 3351 (1378) -369 p < 0.01<br />
Warm Springs 2 3440 (1024) 3556 (1044) -116 —<br />
Warm Springs 1 3570 (992) 3487 (996) 83 —<br />
Madras 3612 (1013) 3510 (1109) 102 —<br />
There were no significant interactions <strong>of</strong> Type by Group for skewness <strong>of</strong> the burst or for kurtosis<br />
<strong>of</strong> the burst, indicating that none <strong>of</strong> the groups distinguish fortis and lenis sounds along these<br />
acoustic parameters. Table 38 summarizes the measures by which the four groups distinguished<br />
fortis and lenis sounds.<br />
Table 38. Acoustic correlates <strong>of</strong> the fortis v. lenis distinction, by group.<br />
Group Acoustic fortis v. lenis distinction<br />
Fluent Speakers Duration<br />
VOT<br />
Burst Relative Intensity<br />
Burst Standard Deviation<br />
Warm Springs 2 Duration<br />
VOT<br />
Burst Relative Amplitude<br />
Burst Relative Intensity<br />
Warm Springs 1 Duration<br />
VOT<br />
Madras Duration<br />
VOT<br />
Burst Relative Amplitude<br />
Burst Mean Frequency<br />
3.4.2 Singleton and geminate nasal duration<br />
All study participants were presented with 28 tokens <strong>of</strong> singleton /m/, 43 tokens <strong>of</strong> singleton /n/,<br />
and 8 tokens <strong>of</strong> //. They were also presented with 15 tokens <strong>of</strong> geminate /mm/ and 7 tokens <strong>of</strong><br />
geminate /nn/. Unlike fluent speakers, the non-speaker groups distinguish onset nasal duration<br />
from intervocalic nasal duration [t(1778)=-11.2, p
eveal that the only significant differences are between the Madras group and the two Warm<br />
Springs groups; no non-speaker group differs significantly from the Fluent Speaker group.<br />
Table 39. Mean duration for onset nasals by group.<br />
(Standard deviations are in parentheses.)<br />
Madras Warm Springs 1 Warm Springs 2 Fluent Speaker<br />
Nasal Duration (ms) Nasal Duration (ms) Nasal Duration (ms) Nasal Duration (ms)<br />
m 62.79 (39.5) 82.08 (36.6) 91.39 (39.5) 75.52 (33.9)<br />
n 85.15 (47.5) 103.37 (53.3) 105.73 (50.9) 100.93 (43.6)<br />
All 72.92 (44.7) 91.61 (46.0) 97.77 (45.4) 87.00 (40.4)<br />
Mean durations for intervocalic singleton nasals are shown in Table 40. Note that for the nonspeaker<br />
groups, these are substantially longer than onset singleton nasals. They are also much<br />
longer than the Fluent Speaker group for all nasals. This result is expected for /m/ and /n/, as<br />
Waterman (1911) describes these consonants as having a shorter duration in <strong>Numu</strong> than in<br />
English. Thus, transfer effects from English would cause non-speakers to produce longer bilabial<br />
and coronal nasals in <strong>Numu</strong>. However, it is a surprising result for <strong>Numu</strong> //, as Waterman (1911)<br />
describes <strong>Numu</strong> // as longer than its English counterpart. Note that like the fluent speakers, all<br />
non-speaker groups produce longer mean duration for singleton // than for the other two<br />
singleton nasals.<br />
Madras<br />
Nasal Duration (ms)<br />
Table 40. Mean duration for intervocalic singleton nasals by group.<br />
(Standard deviations are in parentheses.)<br />
Warm Springs 1<br />
Nasal Duration (ms)<br />
68<br />
Warm Springs 2<br />
Nasal Duration (ms)<br />
Fluent Speaker<br />
Nasal Duration (ms)<br />
m 109.49 (66.5) 117.07 (27.7) 134.70 (36.8) 82.65 (27.2)<br />
n 101.24 (49.2) 100.83 (38.6) 112.62 (35.8) 72.28 (22.9)<br />
131.09 (75.2) 131.10 (36.1) 127.91 (47.3) 104.61 (26.2)<br />
All 107.11 (57.8) 107.64 (38.0) 118.93 (38.7) 79.12 (26.5)<br />
An analysis <strong>of</strong> variance in the intervocalic singleton nasal duration data shows that there is a<br />
significant main effect <strong>of</strong> both Group and Nasal (m, n, and ) [Group: F(3)=14.2, p < 0.001;<br />
Nasal: F(2)=23.8, p
Figure 30. Mean nasal duration for each nasal type by group.<br />
(Error bars indicate the 95% confidence interval.)<br />
3.4.3 Onset VOT<br />
Onset VOT was examined in 19 tokens <strong>of</strong> /p/, 68 tokens <strong>of</strong> /t/, and 41 tokens <strong>of</strong> /k/ for each<br />
participant. Results are show in Table 43, where we see the longest mean VOT in the Fluent<br />
Speaker group.<br />
Table 43. Mean onset obstruent VOT by group.<br />
(Standard deviations are in parentheses.)<br />
Madras Warm Springs 1 Warm Springs 2 Fluent Speaker<br />
Onset VOT (ms) Onset VOT (ms) Onset VOT (ms) Onset VOT (ms)<br />
p 13.92 (48.0) -2.32 (55.5) 19.73 (32.2) 16.25 (8.0)<br />
t 7.21 (51.1) -9.84 (56.4) 8.51 (46.1) 14.40 (6.8)<br />
k 35.70 (48.5) 29.86 (54.9) 35.61 (48.7) 37.81 (17.9)<br />
All 16.59 (51.4) 3.74 (58.6) 18.58 (46.8) 22.04 (15.8)<br />
70
However, the only mean VOT that shows significant differences from the other means is that <strong>of</strong><br />
the Warm Springs 1 group. This group had several members who produced a substantial number<br />
<strong>of</strong> pre-voiced voiced tokens, as is especially evident for /p/ and /t/ in Figure 31, resulting in lower mean<br />
scores overall. <strong>Study</strong> participants in the other two non non-speaker speaker groups produced occasional pre-<br />
voiced tokens ens as well, which accounts for their generally lower mean VOT values than those <strong>of</strong><br />
the Fluent Speaker group, who produced no pre pre-voiced tokens.<br />
Figure 31. Mean VOT for <strong>Numu</strong> onsets produced by each group, by consonant.<br />
(Error bars indicate one standard deviation.)<br />
Standard deviations are substantially larger (sometime by a factor <strong>of</strong> as much as 8) in the nonspeaker<br />
groups s than in the Fluent Speaker group group, , indicating a great deal <strong>of</strong> fluctuation between<br />
long VOTs and short VOTs for non non-speakers. It is possible that non-speakers speakers perceived voiced<br />
onset obstruents rather than the <strong>Numu</strong> voiceless unaspirated obstruents, as the latter are<br />
unlicensed in onset position in English. As a result, non non-speakers sometimes produced onsets<br />
with negative or very short VOT values, and when they perceived voiceless onsets, they<br />
produced them with aspiration as in English, resulting in long VOT values. This hypothesis is<br />
supported by the presence <strong>of</strong> a great many negative VOT valu values in the non-speakers’ speakers’ dataset.<br />
3.4.4 Conclusion<br />
The predicted pattern Madras < Warm Springs 1 < Warm Springs 2 < Fluent Speakers (or vice<br />
versa) held true for some, but not all, subphonemic measures <strong>of</strong> consonants. Fortis VOT<br />
decreases with <strong>Numu</strong> experience, ce, as does the difference between fortis and lenis VOT. Similarly,<br />
fortis duration increases with <strong>Numu</strong> experience, and the ratio <strong>of</strong> fortis to lenis duration increases<br />
with experience as well. However, the Warm Springs groups threw <strong>of</strong>f the pattern for leni lenis leni VOT,<br />
duration, and measures <strong>of</strong> the burst. The Warm Springs 2 group also consistently had the highest<br />
nasal durations (though the difference between that group and other groups was not always<br />
71
significant), and the Warm Springs 1 group had the lowest onset obstruent VOT values. One<br />
hypothesis that will be explored in further detail in Chapter 4 is that the Warm Springs groups<br />
may exhibit effects <strong>of</strong> hypercorrection due to their exposure to social norms associated with this<br />
and other Native American languages. These effects <strong>of</strong> hypercorrection may also interact with<br />
transfer effects from English.<br />
3.5 Phonetic contrasts: Vowels<br />
This section explores duration and qualitative measures <strong>of</strong> <strong>Numu</strong> stressed vowels as produced by<br />
non-native speakers in comparison to vocalic productions by fluent speakers. As with the<br />
consonants, it is expected that productions will follow a pattern <strong>of</strong> experience, with the Warm<br />
Springs 2 group producing vowels that are most like fluent speaker vowels, followed by the<br />
Warm Springs 1 group, and finally the Madras group.<br />
All study participants were presented with 50 tokens <strong>of</strong> short /i/, 6 tokens <strong>of</strong> long /i/, 32 tokens<br />
<strong>of</strong> short //, 23 tokens <strong>of</strong> long //, 14 tokens <strong>of</strong> short /u/, 6 tokens <strong>of</strong> long /u/, 30 tokens <strong>of</strong> short<br />
//, 9 tokens <strong>of</strong> long //, 64 tokens <strong>of</strong> short /a/, and 20 tokens <strong>of</strong> long /a/. Measurements made<br />
on participants’ productions were categorized according to the input regardless <strong>of</strong> output in order<br />
to compare their <strong>Numu</strong> vowel space to that <strong>of</strong> fluent speakers. For example, if the input was //,<br />
but the participant produced /u/, it was still categorized as // so that the lower F2 values would<br />
be reflected in that participant’s data for //.<br />
Vowel quality is examined first in the next section, followed by long and short stressed vowel<br />
duration. Finally, an analysis comparing these two descriptive dimensions <strong>of</strong> vowel production is<br />
presented in §3.5.3.<br />
3.5.1 Vowel quality<br />
Mean first, second, and third formant values were measured by hand in Praat (Boersma &<br />
Weenink, 2008) for all study tokens. The measurements were made over the middle section <strong>of</strong><br />
each stressed vowel in order to mitigate the effects <strong>of</strong> preceding and following consonants.<br />
Results for each vowel are given in Table 44. The mean F2 and F1 values are also plotted in<br />
Figure 32. Though it appears that the non-speaker groups have lower F1 and F2 values for all<br />
vowels, this is not a valid comparison, as there are male participants in the non-speaker groups,<br />
but no male fluent speakers. Indeed, an analysis <strong>of</strong> variance reveals a significant effect <strong>of</strong> Gender<br />
on both F1 [F(1) = 140, p
Table 44. Mean F1, F2, and F3 values for each <strong>Numu</strong> vowel by group.<br />
(Values alues given in Hertz; standard deviations are in parentheses.)<br />
Madras Warm Springs 1 Warm Springs 2 Fluent Speaker<br />
F1 F2 F3 F1 F2 F3 F1 F2 F3 F1 F2 F3<br />
i 337 2330 2988 343 2247 2904 357 2466 3030 409<br />
2352 2855<br />
(64) (413) (323) (52) ) (342) (352) (61) (320) (246) (63) ) (279) (151)<br />
i 341<br />
(63)<br />
2303<br />
(542)<br />
3029<br />
(297)<br />
338<br />
(50) )<br />
2398<br />
(332)<br />
3056<br />
(396)<br />
332<br />
(59)<br />
2606<br />
(268)<br />
3155<br />
(307)<br />
423<br />
(38) )<br />
2446<br />
(121)<br />
2840<br />
(144)<br />
407<br />
(133)<br />
1458<br />
(462)<br />
2603<br />
(479)<br />
399<br />
(90) )<br />
1381<br />
(354)<br />
2744<br />
(413)<br />
412<br />
(118)<br />
1417<br />
(406)<br />
2847<br />
(369)<br />
512<br />
(105 105)<br />
1625<br />
(290)<br />
2771<br />
(212)<br />
370<br />
(79)<br />
1466<br />
(357)<br />
2608<br />
(394)<br />
361<br />
(65) )<br />
1452<br />
(329)<br />
2691<br />
(352)<br />
371<br />
(74)<br />
1482<br />
(292)<br />
2850<br />
(298)<br />
453<br />
(79) )<br />
1712<br />
(209)<br />
2677<br />
(142)<br />
u 352 1036 2608 360 1104 2691 357 1073 2855 498<br />
1014 2746<br />
(92) (216) (446) (80) ) (243) (435) (100) (178) (324) (124 124) (179) (289)<br />
u 345<br />
(44)<br />
1153<br />
(208)<br />
2612<br />
(358)<br />
332<br />
(43) )<br />
1226<br />
(256)<br />
2702<br />
(281)<br />
339<br />
(51)<br />
1091<br />
(205)<br />
2839<br />
(214)<br />
427<br />
(60) )<br />
1056<br />
(181)<br />
2740<br />
(60)<br />
483<br />
(131)<br />
1144<br />
(235)<br />
2614<br />
(389)<br />
453<br />
(99) )<br />
1138<br />
(202)<br />
2719<br />
(320)<br />
478<br />
(125)<br />
1090<br />
(211)<br />
2834<br />
(365)<br />
648<br />
(76) )<br />
1131<br />
(161)<br />
2613<br />
(291)<br />
503<br />
(149)<br />
1063<br />
(196)<br />
2603<br />
(403)<br />
458<br />
(117) )<br />
1029<br />
(152)<br />
2842<br />
(434)<br />
430<br />
(122)<br />
974<br />
(142)<br />
2851<br />
(373)<br />
638<br />
(166 166)<br />
1072<br />
(183)<br />
2584<br />
(368)<br />
a 575 1311 2562 579 1358 2731 621 1393 2759 760<br />
1514 2688<br />
(166) (261) (481) (140) ) (228) (481) (195) (253) (418) (81) ) (177) (209)<br />
a 644<br />
(183)<br />
1286<br />
(219)<br />
2603<br />
(461)<br />
633<br />
(171) )<br />
1334<br />
(226)<br />
2795<br />
(580)<br />
632<br />
(234)<br />
1340<br />
(194)<br />
2827<br />
(471)<br />
880<br />
(57) )<br />
1418<br />
(147)<br />
2753<br />
(290)<br />
Figure 32. Mean F2 and F1 values for all groups.<br />
(Vowel owel symbol corresponds to mean values.)<br />
73
77<br />
Figure 35. Summary plot <strong>of</strong> dimension 1 (horizontal) and dimension 2 (vertical) <strong>of</strong> the multi-dimensional scaling similarity<br />
distances <strong>of</strong> all <strong>Numu</strong> vowels.<br />
(M = Madras, W1 = Warm Springs 1, W2 = Warm Springs 2, S = Fluent Speaker, e = , e: = , o = , o: = )
long vowels (30 milliseconds and 31 milliseconds, respectively) than participants without<br />
previous Ichishkin, Kiksht, or <strong>Numu</strong> experience [F(2)=7.0, p
Long to short vowel ratios are computed in Table 47 for medial and final vowels. Fluent<br />
speakers have the largest final vowel ratio, followed bby<br />
y Warm Springs 2, Warm Springs 1, 1 and<br />
the Madras group. For medial vowels, however, the Warm Springs 2 group has the largest ratio,<br />
followed by the Fluent Speakers group, and the other two non-speaker speaker groups in order <strong>of</strong><br />
experience. These relationships are expressed graphically in Figure 39, , with the medial and final<br />
vowel ratios plotted as lines on the right right-hand hand vertical axis, and the mean durational values for<br />
each vowel series (short medial, short final, long medial, long final) plotted as bars on the lefthand<br />
axis.<br />
Table 47. Mean long to short vowel ratios for medial and final vowels by group.<br />
Madras Warm Springs 1 Warm Springs 2 Fluent Speaker<br />
Long:Short Long:Short Long:Short Long:Short<br />
Vowel Ratio Vowel Ratio Vowel Ratio Vowel Ratio<br />
Medial Final Medial Final Medial Final Medial Final<br />
i 1.48 2.11 1.48 2.31 1.61 2.18 1.81 2.08<br />
1.48 1.34 1.65 1.36 1.88 1.49 1.70 1.85<br />
u 1.70 n/a 1.85 n/a 2.30 n/a 1.76 n/a<br />
1.68 1.51 2.15 1.29 2.08 1.40 2.21 1.94<br />
a 1.45 n/a 1.70 n/a 1.86 n/a 1.73 n/a<br />
All 1.57 1.72 1.80 1.80 1.92 1.84 1.84 2.00<br />
Figure 39. Comparison <strong>of</strong> mean vowel duration for short and long medial and final vowels (bars –error<br />
bars indicate one one standard deviation) and ratios <strong>of</strong> long to short rt medial and final vowels (lines).<br />
(lines<br />
83
a) b)<br />
c) d)<br />
Figure 44. F1xF2 overlap <strong>of</strong> a~a for a) Madras, b) Warm Springs 1, c) Warm Springs 2, and d) Fluent<br />
Speakers.<br />
(Long vowels are red circles, short vowels are blue diamonds, and overlapping points are green x’s.)<br />
89
a) b)<br />
c) d)<br />
Figure 45. F1xF2xDuration overlap <strong>of</strong> a~a for a) Madras, b) Warm Springs 1,c) Warm Springs 2, and d)<br />
Fluent Speakers.<br />
(Long vowels are red circles, short vowels are blue diamonds, and overlapping points are green x’s.)<br />
Table 48. Two-dimensional (2D) and three-dimensional (3D) overlap percentages, and the difference<br />
between them (Diff.) for each peripheral vowel pair, by group.<br />
Madras Warm Springs 1 Warm Springs 2 Fluent Speakers<br />
2D 3D Diff. 2D 3D Diff. 2D 3D Diff. 2D 3D Diff.<br />
i~i 87% 76% 11% 92% 82% 10% 100% 35% 65% 83% 32% 51%<br />
u~u 96% 40% 56% 87% 25% 62% 96% 36% 60% 59% 1% 58%<br />
a~a 83% 75% 8% 77% 64% 13% 98% 66% 32% 64% 12% 52%<br />
All 89% 64% 25% 85% 57% 28% 98% 46% 53% 69% 15% 54%<br />
90
the amount <strong>of</strong> overlap between two dimensional and three dimensional models <strong>of</strong> these<br />
languages’ vowels.<br />
3.5.4 Vowel conclusion<br />
Participants in the Warm Springs groups seem to have a greater sensitivity to differences in<br />
vowel duration than participants in the Madras group, and occasionally even exceed fluent<br />
speaker durational values (though not significantly). In a comparison <strong>of</strong> the interaction <strong>of</strong><br />
temporal and durational measures in the four groups, it was found that the predicted pattern <strong>of</strong><br />
Madras < Warm Springs 1 < Warm Springs 2 < Fluent Speakers holds true in terms <strong>of</strong> the degree<br />
<strong>of</strong> difference between vowel distinctions made on spectral measures and vowel distinctions made<br />
on temporal measures. It also holds true for long medial vowel durations and long to short vowel<br />
final vowel ratios, despite possible effects <strong>of</strong> Kiksht or Ichishkin experience among some<br />
members <strong>of</strong> the Warm Springs 1 group.<br />
However, it does not appear that members <strong>of</strong> the Warm Springs groups have the same advantage<br />
in the spectral measures <strong>of</strong> <strong>Numu</strong> vowels. They pattern closely with the other non-speaker<br />
groups in cluster analyses <strong>of</strong> normalized Euclidean distances between vowels along F1, F2, and<br />
F3 dimensions.<br />
3.6 Conclusion<br />
At the beginning <strong>of</strong> this chapter, it was predicted that members <strong>of</strong> the Warm Springs groups,<br />
especially the Warm Springs 2 group, would exceed the members <strong>of</strong> the Madras group in<br />
reaching fluent speaker production targets. While this pattern has held true in some cases, it has<br />
not in others, with one or both <strong>of</strong> the Warm Springs groups occasionally patterning with the<br />
Madras group, falling far behind the other non-speaker groups, or exceeding fluent speakers on<br />
some phonological or phonemic measure. Instances <strong>of</strong> overproduction <strong>of</strong> voiceless vowels and<br />
productions <strong>of</strong> ejectives are two especially striking cases <strong>of</strong> Warm Springs participants<br />
exceeding fluent speaker productions.<br />
In the next chapter, phonological and phonemic differences among the groups will be examined<br />
in light <strong>of</strong> current proposals <strong>of</strong> endangered language change, which include transfer effects from<br />
a more socio-politically dominant language, regression to language universals (e.g., Cook, 1995),<br />
and socio-culturally motivated intensification <strong>of</strong> prominent language features (e.g., Wolfram,<br />
2002). In Chapter 5, the differences will be submitted to ratings by fluent speakers, in an attempt<br />
to discover which <strong>of</strong> the potential changes that are manifested in these production differences<br />
contribute to a perceivable accent in non-speakers.<br />
92
4.2 Transfer effects<br />
One <strong>of</strong> the most widely accepted views <strong>of</strong> rapid language change in endangered languages is that<br />
there is convergence towards a more dominant language due to extensive contact with that<br />
language and widespread bilingualism. As Silva-Corvalán (1990) notes, convergence may be<br />
caused by internally motivated changes (e.g., the acceleration <strong>of</strong> an already actuated change), but<br />
contact is a major contributor. Indeed, for languages that will be spoken and taught primarily by<br />
second language learners in coming generations, it is very likely that their first language will<br />
have a pr<strong>of</strong>ound effect. Most, if not all, second language acquisition researchers agree that one’s<br />
first language affects the phonology <strong>of</strong> the second language, though the mechanism by which<br />
this occurs remains somewhat controversial. This section briefly reviews the proposed theories<br />
<strong>of</strong> transfer from the first language to the second, upon which predictions are then made about the<br />
effects <strong>of</strong> English on <strong>Numu</strong> in adult learners’ productions.<br />
Early explanations <strong>of</strong> language transfer effects in adults proposed that they were due to<br />
lateralization and loss <strong>of</strong> plasticity in the brain (Lenneberg, 1967; Penfield & Roberts, 1966;<br />
Scovel, 1969). These proposals led to widespread acceptance <strong>of</strong> the Critical Period Hypothesis<br />
(CPH), which postulated loss <strong>of</strong> the ability to acquire native-like phonological skills by the onset<br />
<strong>of</strong> puberty or earlier. However, the CPH has been called into question due to a lack <strong>of</strong><br />
neurological evidence that native-like acquisition and relevant stages <strong>of</strong> brain development<br />
coincide (see Flege, 1987), and because it does not appear to be universal among all cultural<br />
groups (Hill, 1970). Though neurological explanations have not been entirely abandoned (see<br />
Sebastián-Gallés, 2005), it is generally acknowledged that other factors are at play in the<br />
development <strong>of</strong> a second language accent.<br />
Flege (1995) has proposed that a person maintains their ability to acquire sounds throughout their<br />
entire life. However, the presence <strong>of</strong> a complete first language sound system, as found in older<br />
children and adults, “interferes” with the acquisition <strong>of</strong> the second language sound system (and<br />
vice versa to some degree), as the sounds must exist in a single phonological space. This<br />
proposal, the Speech Learning Model (SLM), predicts that a person “assimilates” sounds from<br />
the second language that are closest to sounds in the native language (i.e., perceiving and<br />
producing second language sounds as similar to first language sounds), while establishing new<br />
phonological categories for sounds in the second language that are the most dissimilar from<br />
sounds in the native language. Moreover, as new sounds are acquired, the combined first<br />
language-second language space becomes more crowded. In order to maintain phonological<br />
contrasts within and between languages, sounds may “deflect away” from each other, causing<br />
sounds in both the first language and the second language to differ slightly (or greatly) from<br />
sounds produced by a monolingual speaker <strong>of</strong> either language.<br />
Similarly, Best’s (1994; 1995) Perceptual Assimilation Model (PAM) predicts that a second<br />
language sound which is similar to a native language sound will be perceived as the native<br />
exemplar, whereas second language sounds that are sufficiently different will not be perceived as<br />
exemplars <strong>of</strong> native speech sounds. Discrimination <strong>of</strong> phonological contrasts in the second<br />
language therefore depend on whether the sounds are associated with same or different native<br />
categories from the perspective <strong>of</strong> the learner.<br />
95
Based on these models, we can predict that non-speakers <strong>of</strong> <strong>Numu</strong> will have varying degrees <strong>of</strong><br />
success in producing <strong>Numu</strong> sounds, depending on the similarity <strong>of</strong> a given <strong>Numu</strong> sound to<br />
sounds in the English language inventory. Experience may also have an effect, as Flege & Liu<br />
(2001) have demonstrated that ability in a second language is commensurate with the quantity<br />
(and quality) <strong>of</strong> input (see also Flege, 2009 and Moyer, 2009). Even ambient exposure to the<br />
language may have a positive production effect, as we saw among the different non-speaker<br />
groups in Chapter 3, or as demonstrated for Spanish learners by Knightly et al. (2003). In cases<br />
where a <strong>Numu</strong> sound can be easily assimilated to an English phonological category, we expect to<br />
see assimilation <strong>of</strong> the <strong>Numu</strong> sound to English, in a process commonly called transfer in second<br />
language acquisition literature. To incorporate the possible effects <strong>of</strong> previous language<br />
experience, let us divide transfer into two categories: full transfer and gradient transfer. In full<br />
transfer, all non-speaker groups are predicted to perform significantly differently from fluent<br />
speakers, with productions that are similar to what we would expect to find in English. In<br />
gradient transfer, production ability is correlated with experience, with the more experienced<br />
non-speakers performing significantly better than less experienced non-speakers; the more<br />
experienced group may or may not achieve fluent speaker targets in their productions. 17 Finally,<br />
if a given feature is sufficiently similar in both languages, native-like pronunciation may be<br />
achieved by all non-speakers. This effect has been termed positive transfer in second language<br />
acquisition literature (see Major, 2001). Here, to emphasize that the languages share similar<br />
features, I will call it equivalency.<br />
These three possibilities are presented in Table 49. Hypothesized production patterns are<br />
presented for each prediction, based on the average measurement <strong>of</strong> a given feature for each<br />
study participant group. The groups are presented in order <strong>of</strong> magnitude for a given quantifiable<br />
measurement (e.g., VOT, vowel duration, percentage <strong>of</strong> voiceless vowels produced). Each<br />
pattern is presented with double-headed arrows () to indicate that the measurement may be<br />
either increasing or decreasing across groups. An equal sign (=) is used to represent similarity (or<br />
non-significant differences).<br />
The predictions presented here account for differences in production by non-speakers due to<br />
transfer effects from English, but they do not account for the fact that in some cases, learners<br />
produce segments that are found in neither the first or the second language. For example,<br />
Goodfellow (2005) notes that the youngest generation <strong>of</strong> K w ak w ala speakers (an endangered<br />
indigenous language <strong>of</strong> British Columbia) have introduced labialized velar fricatives to maintain<br />
lexical contrasts that are threatened by the loss <strong>of</strong> uvulars and glottalized stops. While the loss <strong>of</strong><br />
uvulars and glottalized stops may be attributed to the influence <strong>of</strong> English, it is difficult to make<br />
this argument for the introduction <strong>of</strong> labialized velar fricatives, which are not part <strong>of</strong> the English<br />
phonological inventory.<br />
Indeed, analogous situations are common in second language acquisition, leading many<br />
researchers to adopt a view <strong>of</strong> acquisition that encompasses both transfer effects and other<br />
factors. For example, Major (2001) proposes that in the beginning stages <strong>of</strong> language learning,<br />
the interlanguage (i.e., the language that second language learners produce before achieving<br />
fluency; see Chapter 1) consists almost entirely <strong>of</strong> features from the first language. As<br />
17 Gradient performance in subphonemic measures has been shown by both Babel (In Press) and Yu (2008) in<br />
endangered language productions.<br />
96
competence in the second language increases, the role <strong>of</strong> the first language decreases, until<br />
ideally the learner reaches a state <strong>of</strong> complete second language phonology acquisition. Major<br />
attributes all deviations from both first language and second language phonological features to<br />
universal phenomena, a view that is shared by many second language acquisition researchers<br />
(e.g., Epstein, Flynn, & Martohardjono, 1996; Escudero & Boersma, 2004; Schwartz & Sprouse,<br />
1996; but see O’Grady, 2008). The next section will discuss the adoption <strong>of</strong> universal<br />
grammatical features in second language acquisition.<br />
Table 49. Hypothesized patterns for changes due to transfer from English.<br />
(Group names refer to average group measurements for a given feature.)<br />
Change Type Hypothesized Production Pattern Notes<br />
Full<br />
Transfer<br />
Gradient<br />
Transfer<br />
Speaker WS2 = WS1 = Madras = English English transfer effects<br />
override previous exposure to<br />
the language.<br />
Speaker WS2 WS1 Madras = English<br />
or<br />
Speaker WS2 WS1 = Madras = English<br />
or<br />
Speaker = WS2 WS1 = Madras = English<br />
or<br />
Speaker = WS2 = WS1 Madras = English<br />
97<br />
Amount <strong>of</strong> previous exposure<br />
to the language determines<br />
magnitude <strong>of</strong> English transfer<br />
effects.<br />
Equivalency Speaker = WS2 = WS1 = Madras = English The target language feature is<br />
the same as the corresponding<br />
feature in English.<br />
4.3 Universals<br />
The classical view <strong>of</strong> language change favors explanations that incorporate endogenous<br />
(internal) factors rather than contact-induced factors (Lass, 1997). This view has also been<br />
proposed for rapid change in endangered language situations (Cook, 1995; Trudgill, 1989).<br />
These proposals generally hold that languages change in the direction <strong>of</strong> universally unmarked<br />
features, maintaining marked features only when they have a high functional load (i.e., when<br />
they contribute crucially to meaning). In research on second language acquisition, universal<br />
features have been invoked by incorporating markedness constraints into proposed interlanguage<br />
grammars (Eckman, 1991; Major & Kim, 1996). For example, Broselow, Chen, & Wang (1998)<br />
employ universal markedness constraints in an Optimality Theory framework to explain<br />
unexpected productions by Mandarin speakers in the acquisition <strong>of</strong> English.
articulation” (Hyman, 2008, p. 93). These rules, while important to developing an understanding<br />
<strong>of</strong> human language, are not <strong>of</strong> much use to our current study, as they are not sufficiently specific.<br />
One possible avenue for discovering phonological universals is in the study <strong>of</strong> pidgins and<br />
creoles, as these languages tend to have highly regular grammars that have been compared to the<br />
process <strong>of</strong> endangered language change (see the discussion on pidginization, above). There are,<br />
however, a number <strong>of</strong> problems with this approach. The first is that a comparison <strong>of</strong> endangered<br />
language change and pidgin formation may not be appropriate, as discussed above. The second<br />
issue is that the superstrate languages <strong>of</strong> the majority <strong>of</strong> pidgins and creoles under study today<br />
are European languages, and as such are not typologically diverse. We thus return to the old<br />
problem <strong>of</strong> teasing apart universal tendencies from Indo-European tendencies. Finally, the<br />
research in this area is sparse. Though much has been written about universal syntactic and<br />
morphological features in pidgins, there has been little work in this area on defining<br />
phonological universals (see Singh & Muysken, 1995). One exception is Bender (1987, p. 42),<br />
who provides a tentative (and sparsely populated) list <strong>of</strong> six phonological universals as observed<br />
in pidgins, creoles, and low varieties in diglossic situations:<br />
1) No fortis/lenis or emphatic-plain contrasts and no affricates<br />
2) There is a universal list <strong>of</strong> phonemes: p, t, k, b, d, g, f, s, m, n, l~r, w, y<br />
3) No initial or final consonant clusters or geminates<br />
4) There is a simple vowel system: i, u, e, o, a (plus possibly or )<br />
5) No use <strong>of</strong> tone, stress, or intonation in lexical or morphological contrasts<br />
6) No morphophonemic processes aside from automatic variation (e.g., assimilation)<br />
Some attempts have also been made to define phonetic universals (see Cho & Ladefoged, 1999<br />
and Kawasaki-Fukumori, 1992, for example), but naturally occurring variation in natural speech<br />
belies assumptions that phonetic features can be defined as discrete or static (Flege & Port, 1981;<br />
Port & Leary, 2005). As Maddieson (2009) argues, this variation is an entirely natural element <strong>of</strong><br />
human speech, and derives “from imprecise motor control <strong>of</strong> the speech apparatus, from<br />
reproducing the results <strong>of</strong> misperceptions, and from other effects that are a consequence <strong>of</strong> the<br />
fact that humans are not automata” (p.136). For this reason, phonetic universals tend to be<br />
relational, based on the aerodynamic and mechanical properties <strong>of</strong> the speech apparatus, the<br />
properties <strong>of</strong> adjoining segments, or perceptual factors. Maddieson (1997) provides eight such<br />
phonetic universals, all other factors being equal:<br />
1) Higher vowels have higher f0 than lower vowels<br />
2) Higher vowels are shorter in duration than lower vowels<br />
3) Higher vowels have a greater tendency to devoice than lower vowels<br />
4) A vowel before a voiced consonant is longer than a vowel before its voiceless counterpart<br />
5) In many languages, a vowel in a closed syllable is shorter than a vowel in an open<br />
syllable<br />
6) The f0 <strong>of</strong> a vowel is higher after a voiceless consonant than a voiced consonant<br />
7) Bilabial stops have longer closure duration than velar stops (coronal stops may have<br />
shorter durations than velar stops)<br />
8) Stops that are articulated further back in the mouth have longer VOTs (however, uvulars<br />
do not tend to differ much from velars, and there is a great deal <strong>of</strong> variation in coronals<br />
depending on the manner <strong>of</strong> articulation)<br />
99
Under full universal feature adoption, non-speakers exhibit universal features in their<br />
productions despite any amount <strong>of</strong> previous exposure to the language. Under gradient universal<br />
feature adoption, the amount <strong>of</strong> exposure to the language is correlated with the appearance <strong>of</strong><br />
universal features as in gradient transfer, and native-like targets may or may not be achieved by<br />
those who have more experience with the language. The final hypothesis, termed universal<br />
equivalency, denotes situations in which the target language feature is identical to an unmarked<br />
universal feature, and productions by all four groups are therefore similar.<br />
The primary difference between these predictions and those made for English transfer effects is<br />
that non-speaker deviations pattern with the features <strong>of</strong> a universal grammar rather than with the<br />
features <strong>of</strong> English. The reliance on definable universal phonological and phonetic features<br />
diminishes the predictive power <strong>of</strong> these hypotheses, so we are therefore forced to work from the<br />
assumption that any non-speaker deviation that resembles English is due to transfer effects from<br />
English. Other types <strong>of</strong> deviations will be analyzed in terms <strong>of</strong> general linguistic tendencies, or<br />
in terms <strong>of</strong> statistical universals, as discussed above.<br />
4.4 Hypercorrection<br />
The predictions proposed in the previous two sections may not fully account for all changes<br />
brought to <strong>Numu</strong> by second language learners. The idea that languages change solely due to<br />
endogenous factors such as regularization has been refuted by a number <strong>of</strong> scholars. Thomason<br />
& Kaufman (1988) emphasize that sociocultural context is a crucial factor in language change,<br />
and Silva-Corvalán (1990) maintains that though cognitive and interactional processes are<br />
important aspects <strong>of</strong> language change, the ultimate outcome is mediated by the sociolinguistic<br />
history <strong>of</strong> the speakers. Taking this line <strong>of</strong> reason further, both Blust (2005) and Milroy (2003)<br />
have argued that social factors are important not only in the spread <strong>of</strong> language change, but also<br />
in the actuation (the emergence) <strong>of</strong> some changes. For example, Blust (2005) analyzes ten<br />
historical changes in languages <strong>of</strong> the Austronesian language family, finding that they were<br />
socially motivated. Milroy (2003) questions why a given “natural” change (e.g., nasalization <strong>of</strong><br />
vowels) will occur in some languages but not others, or at a given time in history. He states,<br />
“Linguistic change is multi-causal and the etiology <strong>of</strong> a change may include social,<br />
communicative and cognitive, as well as linguistic factors” (p. 148). His argument is not new,<br />
nor is it excluded from consideration in Native American languages; as far back as the middle <strong>of</strong><br />
the last century, Jacobs (1954) urged linguists to consider cultural factors in any analysis <strong>of</strong> the<br />
historic spread <strong>of</strong> features in indigenous languages <strong>of</strong> the American Northwest.<br />
Though Blust and Milroy are primarily considering changes in thriving languages, these<br />
arguments give rise to the prediction that some language changes in endangered language<br />
communities may occur due to cultural factors, a notion that is supported by Wolfram (2002). He<br />
takes issue with the notion that endangered languages change due only to contact with a<br />
dominant language or due to regularization, arguing that, “circumstances framing obsolescing<br />
language varieties are as multidimensional and complex as any other sociolinguistic situation”<br />
(p. 781). He presents examples from endangered languages where distinctive features have<br />
persisted to support his concentration model, in which socially salient features are intensified due<br />
to social factors or direct intervention. Woolard (1989) also reviews several examples <strong>of</strong><br />
endangered language situations in which a given distinctive feature has been maintained and uses<br />
101
these examples to support her argument that any analysis <strong>of</strong> language revitalization and change<br />
must center on the human actors involved.<br />
Hinton & Ahlers (1999, p. 61) note that, “not all <strong>of</strong> the changes in the restoration [<strong>of</strong> endangered<br />
languages] involve simplification and interference. Some are consciously engineered changes.”<br />
They refer specifically to lexical changes, and indeed, many endangered language communities<br />
in the United States actively discourage the borrowing <strong>of</strong> English words, preferring instead to<br />
create neologisms or to borrow words from other indigenous languages for new or foreign<br />
technologies and concepts. For example, in their discussion <strong>of</strong> ethical issues associated with<br />
revitalizing the sleeping language Mutsun, Warner, Luna, & Butler (2007) report that for the<br />
creation <strong>of</strong> new lexical items, the Mutsun community has decided to use compounding and<br />
affixation as much as possible rather than borrowing words from other languages, especially<br />
English. In the Hawaiian language community, Kapono (1994) describes the Lexicon Committee<br />
that was created to develop new vocabulary. It looks to other Polynesian languages to coin new<br />
Hawaiian words, and for wildlife words not encountered in the Pacific, it tends to choose words<br />
from mainland Native American languages (like Blackfoot or Mohawk). Moore (1988) reports<br />
that speakers <strong>of</strong> Kiksht, one <strong>of</strong> the indigenous languages spoken in Warm Springs, attribute<br />
language obsolescence to loss <strong>of</strong> vocabulary items. He says that for these speakers, “‘words’<br />
have taken on certain objectual qualities, and ‘language,’ seen as a collection <strong>of</strong> words, has<br />
become a special kind <strong>of</strong> property” (p. 463).<br />
More traditional morphological and syntactical forms may also be preferred to those that are<br />
perceived as affected by the dominant language. Dorian (1994b) reports on the case <strong>of</strong> Tiwi, an<br />
endangered language <strong>of</strong> Australia, where a newer form <strong>of</strong> the language is denoted by fewer verb<br />
inflections, simpler imperative forms, and loan verbs from English. In the local bilingual school<br />
program, community members have insisted on the use <strong>of</strong> the traditional language, and have<br />
reacted strongly against any publication or teaching using the new form, though it is commonly<br />
used in homes. Woolard (1989) also describes several cases <strong>of</strong> very conservative features being<br />
maintained in endangered language situations, and notes that features that diverge from a socially<br />
dominant language are retained and even emphasized in order to create a distance between the<br />
two languages.<br />
As these examples suggest, many endangered language communities actively try to differentiate<br />
their languages from more socially dominant languages at the morpheme and word level. It<br />
stands to reason that these ideologies extend also to pronunciation, with language communities<br />
attempting to increase the perceptual distance <strong>of</strong> particularly salient features <strong>of</strong> their<br />
phonological system from features <strong>of</strong> the dominant language’s phonology. In that case, we<br />
would expect members <strong>of</strong> a given community to take particular care in the production <strong>of</strong> these<br />
features, and in doing so, possibly exceed the actual fluent speaker target, resulting in the<br />
intensification or overuse <strong>of</strong> some features, or the overapplication <strong>of</strong> target language<br />
phonological rules. In fact, Campbell & Muntzel (1989) provide examples this phenomenon in<br />
several threatened languages.<br />
Because such hypercorrection is socioculturally based, we would expect it to appear only in the<br />
productions <strong>of</strong> community members, and not at all in non-community members (those who have<br />
not had exposure to cultural ideals associated with the language). Expected patterns are presented<br />
102
4.5.1.1 Fortis and lenis consonants<br />
Measurements <strong>of</strong> intervocalic fortis and lenis sounds included VOT, duration, relative burst<br />
amplitude, relative burst intensity, and spectral measures <strong>of</strong> the burst. Table 52 summarizes the<br />
durational measurements in terms <strong>of</strong> relative magnitude (or magnitude <strong>of</strong> difference between<br />
fortis and lenis) for the four participant groups. A third column lists the predicted change type<br />
that matches the production pattern. Note that though no data were collected on these speakers’<br />
productions <strong>of</strong> similar sounds in English, transfer is assumed rather than universal feature<br />
adoption, as I am unaware <strong>of</strong> any previous research that provides universal measurements <strong>of</strong><br />
these subphonemic features.<br />
Table 52. Production patterns for measurements <strong>of</strong> fortis and lenis productions by speakers and nonspeakers<br />
<strong>of</strong> <strong>Numu</strong>.<br />
Feature Production Pattern Type<br />
Fortis VOT Speaker = WS2 < WS1 = Madras gradient transfer<br />
Lenis VOT Speaker = WS2 = WS1 = Madras equivalency ?<br />
Fortis Duration Speaker = WS2 = WS1 > Madras gradient transfer<br />
Lenis Duration Speaker < Madras < WS2 = WS1 unpredicted<br />
Fortis v. Lenis VOT Speaker < WS2 < WS1 < Madras gradient transfer<br />
Fortis v. Lenis Duration Speaker > WS2 > WS1 > Madras gradient transfer<br />
For comparisons <strong>of</strong> speaker and non-speaker fortis and lenis productions, there were four<br />
instances <strong>of</strong> gradient transfer: fortis VOT, fortis duration, and the difference between fortis and<br />
lenis VOT and fortis and lenis duration. For lenis VOT values, it is possible that we are<br />
observing an instance <strong>of</strong> equivalency, as the values do not differ significantly among the groups.<br />
However, a comparison <strong>of</strong> <strong>Numu</strong> lenis VOT values and the VOT values for English voiced<br />
obstruents reported in Byrd (1993) reveal large differences in magnitude at each place <strong>of</strong><br />
articulation (see Table 53). There are therefore three possibilities: 1) the VOT values reported by<br />
Byrd (1993) differ largely from the VOT values in the dialect <strong>of</strong> English spoken in Central<br />
Oregon; 2) <strong>Numu</strong> lenis VOT values match some universal tendency for VOT, which was also<br />
matched by the non-speakers; or 3) the calculation <strong>of</strong> differences among groups on this measure<br />
represents a Type 2 statistical error, caused by the large amount <strong>of</strong> variation in lenis consonant<br />
production in <strong>Numu</strong>. The first possibility is unlikely, given that Byrd (1993) performed<br />
measurements on 7985 voiced oral stop releases by 630 speakers <strong>of</strong> eight major dialects <strong>of</strong><br />
American English. The second possibility is not disprovable, given that there is currently no<br />
measure <strong>of</strong> universal VOT tendencies (and there will likely never be such a measure, as human<br />
speech is highly variable subphonemically). The third possibility is the likeliest, and we can<br />
therefore draw no firm conclusions about language change from the measure <strong>of</strong> <strong>Numu</strong> lenis<br />
VOT.<br />
Table 53. English and <strong>Numu</strong> voiced obstruent VOT values.<br />
Consonant <strong>Numu</strong> VOT (ms) English VOT (ms)<br />
/b/ 9 18<br />
/d/ -27 24<br />
/g/ -7 27<br />
104
Similarly, lenis closure duration yielded unpredicted results, with both Warm Springs groups<br />
exhibiting the largest values, followed by the Madras group, and finally the fluent speakers. In<br />
this case, target achievement does not seem to be commensurate with experience. However, as<br />
with lenis VOT, the results may be affected by variation in pronunciation <strong>of</strong> these sounds. It is<br />
unlikely that transfer effects play a role; in a comparison <strong>of</strong> values reported by Byrd (1993),<br />
English voiced obstruent closure duration is generally shorter than <strong>Numu</strong> lenis closure duration<br />
(see Table 54). One possible explanation for the extended lenis consonant duration among the<br />
Warm Springs community members is that they are aware that fortis sounds exist in the language<br />
and overapply closure lengthening to lenis consonants. However, this does not explain why the<br />
Madras group overshoots the lenis duration target. Given the large variability observed in lenis<br />
consonants, it would be useful in this case to conduct an additional study with more participants<br />
to determine if the patterns reported here are applicable to a larger population.<br />
Table 54. English and <strong>Numu</strong> voiced obstruent duration values.<br />
<strong>Numu</strong> Closure<br />
Consonant<br />
Duration (ms)<br />
English Closure<br />
Duration (ms)<br />
/b/ 162 64<br />
/d/ 48 52<br />
/g/ 81 54<br />
Table 55 is adapted from Table 38 in Chapter 3 to show the measures <strong>of</strong> the burst on which each<br />
group distinguishes fortis and lenis sounds.<br />
Table 55. Measures <strong>of</strong> the burst on which fortis v. lenis distinctions are made, by group.<br />
Speaker<br />
Warm<br />
Springs 2<br />
Warm<br />
Madras<br />
Springs 1<br />
Pattern<br />
Burst Relative Amplitude x x unpredicted<br />
Burst Relative Intensity x x gradient transfer<br />
Burst Mean Frequency x gradient transfer<br />
Burst Standard Deviation x full transfer<br />
Burst Skewness equivalency<br />
Burst Kurtosis equivalency<br />
The fact that no group distinguishes fortis and lenis sounds on burst skewness or burst kurtosis<br />
may be attributable to a type <strong>of</strong> negative equivalency; these acoustic parameters are likely not<br />
correlated with consonant distinction in either <strong>Numu</strong> or English. The use <strong>of</strong> relative burst<br />
intensity appears to exhibit gradient transfer, with the Fluent Speaker and Warm Springs 2<br />
groups patterning together in their use <strong>of</strong> it. Burst mean frequency also appears to exhibit<br />
gradient transfer, with only the Madras group using it to distinguish fortis and lenis sounds. The<br />
use <strong>of</strong> burst standard deviation appears to be a case <strong>of</strong> full transfer; only fluent speakers use it to<br />
distinguish fortis and lenis sounds. It is unclear why the Warm Springs 2 group patterns with the<br />
Madras group in the use <strong>of</strong> relative burst amplitude to make the fortis-lenis distinction, or<br />
alternatively, why the Warm Springs 1 group does not use it. One possible explanation is that<br />
105
five members <strong>of</strong> the Warm Springs 1 group are affected by previous exposure to Kiksht or<br />
Ichishkin, though measurements <strong>of</strong> Kiksht and Ichishkin bursts are not available to verify or<br />
disprove this claim.<br />
4.5.1.2 Nasal duration<br />
Duration was measured in onset nasals (which are always singletons), intervocalic singleton<br />
nasals, and intervocalic geminate nasals. An analysis <strong>of</strong> the comparison <strong>of</strong> these measurements<br />
in speakers and non-speakers is summarized in Table 56. (Parentheses indicate that the group’s<br />
average measurement does not differ significantly from the other groups’ measurements).<br />
Table 56. Production patterns for measurements <strong>of</strong> nasal productions by speakers and non-speakers <strong>of</strong><br />
<strong>Numu</strong>.<br />
Feature Production Pattern Type<br />
Onset Nasal WS2 > WS1 > Madras (Speaker) unknown<br />
Intervocalic Singleton Nasal Speaker < Madras = WS1 < WS2 unpredicted<br />
Intervocalic Geminate Nasal Speaker = WS2 > Madras (WS1) gradient transfer<br />
Geminate vs Singleton Nasals Speaker > WS1 > WS2 = Madras unpredicted<br />
For onset nasals, the three groups <strong>of</strong> non-speakers differed significantly, but the fluent speaker<br />
group did not differ significantly from any <strong>of</strong> the non-speaker groups. This result may be because<br />
fluent speakers do not differentiate singleton nasals in onset position from intervocalic singleton<br />
nasals, while all <strong>of</strong> the non-speaker groups do so. Because no comparison to fluent speakers is<br />
possible, we cannot determine the potential direction <strong>of</strong> change that these types <strong>of</strong> productions<br />
will lead to. However, the fact that all three non-speaker groups distinguish onset from<br />
intervocalic singletons while speakers do not is attributable to full transfer. Interestingly, we<br />
observe that members <strong>of</strong> the Warm Springs 2 group have the longest onset nasal duration <strong>of</strong> the<br />
non-speaker groups, as well as the longest durations for both singleton and geminate intervocalic<br />
nasals. It is possible that they have an awareness <strong>of</strong> nasal gemination in <strong>Numu</strong>, and overapply it<br />
to non-geminate nasals.<br />
The Warm Springs 2 group also falls into an unexpected pattern in intervocalic singleton nasal<br />
production, with their average nasal closure being the longest, fluent speakers’ average nasal<br />
closure being the shortest, and the Madras and Warm Springs 1 groups falling in between. This<br />
may be a case <strong>of</strong> interaction between hypercorrection and transfer effects, where transfer from<br />
English causes non-speakers to produce longer singleton nasals in general, but awareness <strong>of</strong><br />
geminates causes the Warm Springs 2 to produce nasals that are even longer. This conjecture is<br />
supported by the fact that the Warm Springs 2 group achieves the fluent speaker production<br />
target for geminate nasals, ahead <strong>of</strong> the Madras group, an exhibition <strong>of</strong> gradient transfer. The<br />
Warm Springs 1 group does not differ significantly from the other groups for geminate nasals,<br />
probably as a result <strong>of</strong> excessive intergroup variation; it is possible that some members <strong>of</strong> this<br />
group are aware <strong>of</strong> and able to produce geminate nasals, while others pattern with the shorter<br />
productions <strong>of</strong> the non-experienced Madras group.<br />
The groups’ differentiation <strong>of</strong> intervocalic geminates and singletons also follows an unpredicted<br />
pattern, but this pattern is not unexpected given the patterns <strong>of</strong> singleton nasal production and<br />
106
geminate nasal production. Though the Warm Springs 2 group exhibits the longest geminate<br />
nasal duration <strong>of</strong> any non-speaker speaker group, they also exhibit the longest singleton nasal duration,<br />
reducing the magnitude <strong>of</strong> difference between the two nasal types. Note that it is unlikely that<br />
Warm Springs rings 1 group members’ exposure to Ichishkin or Kiksht had any effect on this measure,<br />
as neither Ichishkin nor Kiksht contrast geminate and singleton consonants.<br />
4.5.1.3 Onset VOT<br />
The production pattern for onset VOT is Speaker = WS2 = Madras > WS1, where re the group with<br />
a mid-level level <strong>of</strong> experience patterns differently from all other groups. This pattern is not predicted<br />
by any <strong>of</strong> the theories <strong>of</strong> language acquisition. However, an analysis comparing the different<br />
groups’ onset VOT presents a significant chal challenge lenge due to the large amount <strong>of</strong> variation found in<br />
non-speakers’ speakers’ productions. Figure 47, repeated from Figure 31 in Chapter 3, demonstrates this<br />
variation in its remarkably long standard deviation bars. Note that the fluent speakers do not<br />
produce this level vel <strong>of</strong> variation. Note also that while all <strong>of</strong> the speakers’ productions are positive,<br />
the non-speakers’ speakers’ productions extend well into the negative region <strong>of</strong> the graph. As discussed in<br />
Chapter 3, it is likely that non-speakers speakers sometimes perceived the speaker speakers’ s’ productions <strong>of</strong> nonaspirated<br />
voiceless stops as voiced stops, and indeed, some individuals produced a large number<br />
<strong>of</strong> pre-voiced voiced stops, especially in the Warm Springs 1 group. Perhaps members <strong>of</strong> this group<br />
have enough knowledge <strong>of</strong> the language to know tthat<br />
hat <strong>Numu</strong> onset obstruents are “different”<br />
from English onset obstruents (voiceless stops in English are always aspirated), but do not have<br />
sufficient experience with the language to produce the difference accurately.<br />
Figure 47. Mean VOT for <strong>Numu</strong> onsets produced by each group, by consonant.<br />
(Error bars indicate one standard deviation.)<br />
Figure repeated from Figure 31 in Chapter 3.<br />
107
In the production <strong>of</strong> onset //, the three non-speaker groups performed significantly differently<br />
from each other and from the speaker group, with the frequency <strong>of</strong> correct productions<br />
increasing by the amount <strong>of</strong> <strong>Numu</strong> experience for each group. This production pattern is<br />
predicted by both gradient transfer and gradient universal feature adoption. However,<br />
distinguishing which <strong>of</strong> these two theories applies to the // data is difficult. Bender’s (1987) list<br />
<strong>of</strong> phonological features that are universal to simplification specifies a lack <strong>of</strong> affricates. But<br />
English also disallows word initial //, though some other affricates are licensed in initial<br />
position. The affricate // was reduced to /s/ in most cases in the data, but in some cases, another<br />
affricate (e.g., /t/ and //) was substituted. Though it is not certain that reduction to /s/ does not<br />
represent adoption <strong>of</strong> universal features, the use <strong>of</strong> other affricates is almost certainly a case <strong>of</strong><br />
transfer from English. Thus, this pattern is classified as gradient transfer.<br />
Table 59. Production patterns for observations <strong>of</strong> phonological productions by speakers and non-speakers<br />
<strong>of</strong> <strong>Numu</strong>.<br />
Feature Production Pattern Type<br />
//<br />
Speaker > WS2 > WS1 > Madras gradient transfer<br />
uvularization Speaker > WS2 = WS1 = Madras full transfer<br />
vowel devoicing WS2 > Speaker > WS1 > Madras linguistic hypercorrection<br />
stress Speaker = WS2 = WS1 = Madras equivalency<br />
ejectives WS2, WS1 Speaker, Madras areal hypercorrection<br />
In the case <strong>of</strong> uvularization <strong>of</strong> velar consonants, it was observed that the non-speaker groups had<br />
significantly lower production frequency than did speakers, but that the production did not differ<br />
significantly among non-speaker groups. This pattern appears to be a case <strong>of</strong> either full transfer<br />
or full universal feature adoption, but again, it is difficult to tease the two possibilities apart.<br />
Maddieson (1984) reports that while 99.4% <strong>of</strong> the languages in the UCLA Phonological Segment<br />
Inventory Database (UPSID) have velar stops, only 14.8% have uvular stops; velar fricatives are<br />
also more frequent than uvular fricatives. In terms <strong>of</strong> statistical universals, then, velar<br />
consonants appear to be more universally unmarked than uvular consonants. As non-speakers<br />
produced far more velar than uvular stops in low vowel contexts, this may be considered an<br />
adoption <strong>of</strong> a universal feature. However, it is also the case that English does not license uvular<br />
consonants. Because velar and uvular stops are close in articulation, it is possible that the<br />
production <strong>of</strong> velar stops in a uvular stop context is a product <strong>of</strong> phonological category<br />
assimilation, as predicted by Flege’s (1995) Speech Learning Model. Though the theories <strong>of</strong><br />
transfer and universal features are indistinguishable in this case, I will assume full transfer, as I<br />
previously adopted the stance that any non-speaker deviation that resembles English is due to<br />
transfer effects from English (see §4.3).<br />
For word-final vowels, it was found that the number <strong>of</strong> voiceless vowel productions by<br />
participants in the Warm Springs 2 group exceeded the number <strong>of</strong> voiceless vowel productions<br />
by fluent speakers, a case <strong>of</strong> linguistic hypercorrection. Moreover, two participants, one in each<br />
<strong>of</strong> the Warm Springs groups, produced devoicing in contexts that are not licensed by <strong>Numu</strong><br />
phonology. This is a case <strong>of</strong> cultural hypercorrection, with the pattern WS2 = WS1 > Speaker ><br />
Madras. As only two participants produced unlicensed devoicing, it is unclear how important this<br />
110
The possibility that these sounds could be adopted by second language learners whose first<br />
language does not have them, into a language whose inventory also does not have them, is<br />
particularly interesting for two reasons. The first reason is that areal hypercorrection represents<br />
the appearance <strong>of</strong> distinctive features with no contrastive function, which is opposed to what is<br />
predicted by Anderson (1982). He argues that phonological distinctions are reduced in<br />
endangered languages except for those present in the matrix language (e.g., English) and those<br />
with a “high functional load,” by which he means sounds that are necessary to distinguish word<br />
contrasts. Though sounds borrowed from other indigenous languages may develop a contrastive<br />
meaning over time, it is unlikely that they fulfill this purpose for the second language learners<br />
who introduce them. Instead, it is likely that the sounds are used to create a perceptual distance<br />
from English, and possibly to index speakers’ identities as a Native American (cf. Ahlers, 2006).<br />
However, it is possible to retain Anderson’s thesis if we reconsider what is meant by “functional<br />
load” and include both the ability to communicate content and to communicate social norms.<br />
Therefore, though features borrowed from a geographically close indigenous language may not<br />
have contrastive function, they have a strong social function. This view is supported by Wolfram<br />
(2002), who argues that it is possible for some linguistic structures to take on unique social<br />
meaning in endangered language change. He states, “This is not to say that all variability in<br />
obsolescing language varieties is socially meaningful, but it is certainly possible for some<br />
receding features to take on social significance” (p. 780).<br />
Secondly, the presence <strong>of</strong> ejectives in non-speakers’ productions, and the possibility that these<br />
could one day become features <strong>of</strong> the language may raise the question <strong>of</strong> the “naturalness” <strong>of</strong><br />
such a sound change. If viewed from the perspective <strong>of</strong> endogenous change, areal<br />
hypercorrection appears highly unnatural. However, this type <strong>of</strong> change would represent a very<br />
traditional sound change for the Northwest region. As Hill (1978) discusses, historically, the<br />
presence <strong>of</strong> tribal exogamy, areal network systems, and widespread intergroup communication in<br />
the Northwest contributed to the spreading <strong>of</strong> unique phonological features throughout the<br />
indigenous languages <strong>of</strong> the region. Multilingualism was widespread, and a rich oral tradition<br />
required the use <strong>of</strong> multiple languages for proper retelling <strong>of</strong> myths. Thus, this type <strong>of</strong> sound<br />
change would appear to be very natural for members <strong>of</strong> an indigenous Northwest community,<br />
and the introduction <strong>of</strong> ejectives into <strong>Numu</strong> can be interpreted as the continuance <strong>of</strong> a longstanding<br />
historical tradition <strong>of</strong> areal phonological spread in the region.<br />
4.6 Discussion<br />
This examination <strong>of</strong> the hypotheses <strong>of</strong> endangered language change has revealed that future<br />
changes in <strong>Numu</strong> brought into the language by second language learners will likely include a<br />
mixture <strong>of</strong> transfer effects from English, adoption <strong>of</strong> universal features, hypercorrection, and the<br />
adoption <strong>of</strong> salient features from neighboring languages, or areal hypercorrection. Gradient<br />
transfer appears to be the most likely avenue <strong>of</strong> language change for subphonemic features <strong>of</strong><br />
<strong>Numu</strong>. Of the 26 group comparisons <strong>of</strong> subphonemic measures made in §4.5.1, there were 10<br />
clear cases <strong>of</strong> this type. Evidence <strong>of</strong> full transfer and both types <strong>of</strong> equivalency were also<br />
apparent in some subphonemic features. For measures <strong>of</strong> the phonological features, evidence was<br />
found for gradient transfer, full transfer, equivalency, linguistic hypercorrection, cultural<br />
hypercorrection, and areal hypercorrection.<br />
112
5.1 Introduction<br />
CHAPTER 5<br />
Speaker Perceptions <strong>of</strong> Non-Speaker Productions <strong>of</strong> <strong>Numu</strong><br />
In Chapter 3, I examined differences in speaker and non-speaker productions <strong>of</strong> <strong>Numu</strong> from a<br />
phonetic and phonological perspective, and in Chapter 4, I analyzed these differences in terms <strong>of</strong><br />
several theories <strong>of</strong> endangered language change. However, variation and change in speech is<br />
common in any language and does not always result in social judgment (see, e.g., Labov, 2001,<br />
p. 28). Therefore, the only changes in <strong>Numu</strong> that are likely to matter to the speech community<br />
are the changes that result in a perception <strong>of</strong> “accented” speech. This chapter makes an attempt<br />
to determine which differences between fluent speaker and non-speaker productions are salient<br />
to fluent speakers by means <strong>of</strong> a perception study. The results <strong>of</strong> this study provide clues as to<br />
how learner-produced speech will be received by fluent speakers and may have important<br />
implications for learners <strong>of</strong> <strong>Numu</strong>, if they wish to attain pronunciation skills that will be<br />
evaluated as native-like. The results may also indicate which features have particular social<br />
saliency for speakers, which can be compared to features that were found to be salient to nonspeakers<br />
in the Warm Springs community.<br />
Woolard (1989) points out that changes in a minority language are always in reference to the<br />
dominant language, whether they are convergent or divergent with that language. She makes this<br />
observation in reference to the languages themselves, stating, “Both convergent and divergent<br />
changes ... deform languages systematically in response to the contact situation” (p. 363). I<br />
would argue that linguists frequently work from the same perspective, describing changes to an<br />
endangered language in terms <strong>of</strong> a socially dominant language. While this information is<br />
valuable for gaining an understanding <strong>of</strong> the effects <strong>of</strong> language contact, it does not provide<br />
information about the effects <strong>of</strong> language change within the endangered language community.<br />
The study described in this chapter therefore examines fluent speaker perceptions, so that<br />
potential changes can be described with reference to <strong>Numu</strong>.<br />
Before discussing the study or its results, however, it is useful to explore some <strong>of</strong> the underlying<br />
assumptions inherent in discussing accentedness in the context <strong>of</strong> endangered languages. One<br />
issue <strong>of</strong> particular concern to many individuals involved with language revitalization is that <strong>of</strong><br />
retaining the language’s authenticity. Wong (1999, p.95) states, “Instead <strong>of</strong> restoring cultural and<br />
ethnic pride to a community, [language revitalization] can generate resentment from some<br />
segments <strong>of</strong> that community towards what they might view as a threat to the existence <strong>of</strong> the<br />
values embedded in the traditional version <strong>of</strong> the language.” Brody (2001) discusses several<br />
cases in which indigenous communities have purged words and grammatical elements (with or<br />
without the help <strong>of</strong> a linguist) that have been borrowed from socially dominant languages, even<br />
though, as she argues, borrowing is a natural language process.<br />
Authenticity is closely tied to historical and cultural legitimacy. Hornberger & King (1998, p.<br />
391) state, “For some language users, the claim <strong>of</strong> authenticity suggests that a particular variety<br />
<strong>of</strong> the language is not artificially constructed, but interwoven with their own traditions and<br />
unique heritage.” For learners <strong>of</strong> Native American languages, this might mean that an accent,<br />
114
and a subphonemic analysis <strong>of</strong> the results, which are discussed with reference to the findings <strong>of</strong><br />
Chapter 4 in §5.4. Section 5.5 concludes the chapter.<br />
5.2 Methods<br />
Two <strong>of</strong> the fluent <strong>Numu</strong> speakers from the production experiment participated in this portion <strong>of</strong><br />
the research. Both were teachers in the language program at Warm Springs at the time the study<br />
occurred. They were separately presented with 992 non-speaker word productions in eight<br />
separate experiment sessions and asked to rate them on a Likert scale <strong>of</strong> 1 (non-native) to 5<br />
(native). The Likert scale appeared on a computer screen along with a written English translation<br />
<strong>of</strong> the <strong>Numu</strong> word they were presented with, using Praat’s Multiple Forced Choice (MFC)<br />
listening experiment function (Boersma & Weenink, 2008). The sessions were conducted in<br />
quiet rooms, and the <strong>Numu</strong> stimuli were presented at a comfortable volume over dynamic closed<br />
ear headphones with a frequency range <strong>of</strong> 10-22,000 Hz, sensitivity <strong>of</strong> 106 dB/mW 3 dB, and<br />
impedance <strong>of</strong> 38 ohms 15%. All stimuli were normalized to the mean amplitude <strong>of</strong> all <strong>of</strong> the<br />
stimuli in each experimental session, ranging from 71.30 to 74.66 dB. The experiment<br />
participants were allowed to repeat each token as <strong>of</strong>ten as they desired, and they were given the<br />
option to rest after every 40 tokens.<br />
Figure 48. Screen shot from Experiment 5 (Taibo means non-Native or White person).<br />
Figure 48 is a screen shot <strong>of</strong> the page that appeared in Experiment 5 as a non-speaker token <strong>of</strong><br />
the <strong>Numu</strong> word for taste played over the headphones (Taibo means non-Native or White person<br />
in <strong>Numu</strong> and is <strong>of</strong>ten used to describe speech that sounds accented). The study participants were<br />
116
informed that some <strong>of</strong> the stimuli had, indeed, been produced by White people from the nearby<br />
town <strong>of</strong> Madras. This step was taken in order to encourage participants to use the full range <strong>of</strong><br />
the rating scale, in case the perception that all stimuli were produced by Warm Springs<br />
community members would produce results skewed towards the positive end <strong>of</strong> the scale. 22<br />
Experimental stimuli were selected based on findings in Chapter 3, with a focus on phonological<br />
and phonetic features that differed significantly between speaker and non-speaker groups. Table<br />
60 provides details about the primary and secondary stimuli types for each experiment. Note that<br />
each experiment features at least two primary stimuli types in order to reduce priming effects.<br />
Every experiment featured an equal or near-equal number <strong>of</strong> tokens from each non-speaker<br />
(because none <strong>of</strong> the non-speakers from the Madras group produced ejectives, there were fewer<br />
tokens from this group in Experiment 7). Recall that each non-speaker recorded four tokens <strong>of</strong><br />
each word for the experiment in Chapter 3. Only one <strong>of</strong> these tokens was selected to represent<br />
each non-speaker’s production <strong>of</strong> a given word in the current experiment, using a randomization<br />
function in Excel.<br />
Table 60. Stimuli type and number <strong>of</strong> tokens for all perception experiments.<br />
Experiment Primary<br />
Stimuli Type(s)<br />
1 Vowel length<br />
(Block) Nasal duration<br />
2 Fortis and lenis obstruents<br />
(Random) Onset VOT<br />
3 Vowel length<br />
(Block) Nasal duration<br />
4 Fortis and lenis obstruents<br />
(Random) Onset VOT<br />
5 Nasal duration<br />
(Random) Onset VOT<br />
6 Nasal duration<br />
(Random) Onset VOT<br />
7 Ejectives<br />
(Random) Devoiced vowels<br />
8 Onset //<br />
(Random) Vowel quality<br />
117<br />
Secondary<br />
Stimuli Type(s)<br />
Onset VOT<br />
High vowel quality<br />
Onset VOT<br />
High vowel quality<br />
Vowel length<br />
Vowel length<br />
Uvularization<br />
Nasal duration<br />
Number <strong>of</strong> Tokens<br />
Tokens in Experiments 1 and 3 were presented as blocks by non-speaker, with words randomly<br />
presented within the blocks, and the blocks randomly presented to the experiment participants.<br />
These two experiments primarily explored duration, and this step was taken to allow experiment<br />
participants to hear within-speaker duration ratios. There were ten words presented in<br />
Experiments 1 and 3, for a total <strong>of</strong> 250 tokens by the 25 non-speakers. Therefore, the blocks<br />
22 As will be discussed in §5.3.3, tokens were presented randomly or in randomly organized blocks in order to<br />
minimize any possible recognition <strong>of</strong> voices. Ideally, the raters should have recognized no one, but knowing that a<br />
portion <strong>of</strong> the tokens came from outside the community, they should have felt less discomfort in assigning lower<br />
ratings.<br />
130<br />
100<br />
120<br />
100<br />
100<br />
100<br />
145<br />
197
their ratings differ by 3 or 4 points. Though this situation is somewhat troublesome for analysis,<br />
it is not entirely unexpected. Recall from Chapter 2 that there were many significant differences<br />
in production among the four fluent speakers. For the measures performed in this study, these<br />
two raters (Rater 1 is Speaker A and Rater 2 is Speaker C) differed significantly in lenis duration,<br />
and as they come from different regions originally, they likely differ along other parameters as<br />
well. It stands to reason that there would also be variation in their perception. As both raters are<br />
active teachers <strong>of</strong> <strong>Numu</strong> and recognized within the Warm Springs community as language<br />
experts, the variation in their perception <strong>of</strong> accentedness is reflective <strong>of</strong> the variation that<br />
language learners would encounter in seeking feedback about their productions.<br />
Table 62. The difference in ratings between Rater 1 and Rater 2 for each token, presented as a count and<br />
a percentage <strong>of</strong> total ratings.<br />
Rating Difference Count Percentage<br />
0 345 34.8%<br />
1 234 23.6%<br />
2 166 16.7%<br />
3 144 14.5%<br />
4 103 10.4%<br />
The current analysis therefore proceeds with separate analyses <strong>of</strong> the ratings given by each<br />
speaker for phonological and phonetic differences between fluent speaker and non-speaker<br />
productions.<br />
5.3.1 Phonological factors<br />
Six phonological factors were regressed against the ratings from each rater. These six factors<br />
were those that were examined in Chapter 3, and include non-speakers’: 1) production <strong>of</strong> /ts/ in<br />
the onset; 2) production <strong>of</strong> a uvular consonant following a low vowel; 3) production <strong>of</strong> a<br />
devoiced vowel; 4) vowel devoicing in the same context as the fluent speaker input; 5)<br />
production <strong>of</strong> an ejective; and 6) production <strong>of</strong> the same stress pattern as present in the fluent<br />
speaker input. It was determined that a binary model was necessary to achieve sufficient data<br />
points in each <strong>of</strong> the independent variable categories. 23 Therefore, the ratings 1-3 were recoded<br />
as “non-native” and the ratings 4-5 were recoded as “native.” The 4 rating was included with the<br />
5 rating to allow a small margin <strong>of</strong> error in the “native” category; anything less than 4, however,<br />
must be a result <strong>of</strong> some non-native sounding aspect <strong>of</strong> the word, and thus “non-native.”<br />
It was also important to account for any variance in the data caused by random effects such as<br />
the specific word being rated or the individual participants whose voices were recorded in the<br />
imitation study. Therefore, five factors were entered as random effects into a mixed effects<br />
regression model. 24 The model takes into account the amount <strong>of</strong> variance contributed by each <strong>of</strong><br />
23 A rule <strong>of</strong> thumb for performing a logistic regression is that each cell formed by a categorical independent variable<br />
should contain at least one case, and no more than 20% <strong>of</strong> the cells should contain less than five cases. See Garson<br />
(2010).<br />
24 For more information about mixed-effects models in linguistics, see Baayen (2008, p.278).<br />
119
these factors in the regression analysis. The amount <strong>of</strong> this variance is reported in Table 63 for<br />
each rater. The <strong>Numu</strong> words that raters listened to in the study and the individual non-<strong>Numu</strong><br />
speakers who produced them are represented by Word and Participant, respectively. Also<br />
included is a variable called Input, which refers to the four fluent <strong>Numu</strong> speakers whose words<br />
were repeated by the non-<strong>Numu</strong> speakers. Group is the group that the participants were assigned<br />
to (Madras, Warm Springs 1, and Warm Springs 2). Gender <strong>of</strong> the participants whose voiced<br />
were recorded is the final random effect included in the regression model; for Rater 2, Gender<br />
did not contribute significantly to the model fit, so it was therefore not included.<br />
Table 63. Amount <strong>of</strong> variance accounted for by individual random effects for each Rater.<br />
Random Effect Rater 1 Variance Rater 2 Variance<br />
Word 0.408 0.571<br />
Participant 0.373 0.284<br />
Input 0.026 0.017<br />
Group 0.143 0.077<br />
Gender 0.317 -<br />
The results <strong>of</strong> a model regressing the phonological factors described above against fluent speaker<br />
ratings, with an incorporation <strong>of</strong> the random effects, are presented in Table 64 by rater. The<br />
coefficient is in respect to the “native” rating; negative odds indicate a decrease in the likelihood<br />
<strong>of</strong> obtaining this rating. For Rater 1, four <strong>of</strong> the phonological factors contributed significantly to<br />
increased odds <strong>of</strong> a reduced, or “non-native” rating, including the production <strong>of</strong> something other<br />
than /ts/ in onset position; the production <strong>of</strong> a /ts/ in onset position; vowel voicing/devoicing that<br />
differed from the voicing present in the recordings <strong>of</strong> the fluent speakers that the non-<strong>Numu</strong><br />
speakers repeated; and the production <strong>of</strong> an ejective. Incorrect stress approached significance for<br />
Rater 1. For Rater 2, only vowel voicing/devoicing that differed from the input was a significant<br />
factor in a reduced rating; the production <strong>of</strong> an ejective and the production <strong>of</strong> incorrect stress<br />
approached significance.<br />
Table 64. Regression results for phonological factors, by rater.<br />
Factor<br />
Rater 1<br />
Coefficient Std. Error p-value<br />
Rater 2<br />
Coefficient Std. Error p-value<br />
No /ts/ -1.9462 0.50 0.000 ***<br />
/ts/<br />
No uvular<br />
Devoiced vowel<br />
-1.4615 0.47 0.002 **<br />
Different vowel voicing -0.7094 0.26 0.006 ** -0.6836 0.26 0.008 **<br />
Ejective -1.7763 0.42 0.000 *** -0.06134 0.35 0.076 ^<br />
Incorrect stress -0.9865 0.51 0.051 ^ -0.7602 0.45 0.089 ^<br />
It is interesting that both the production <strong>of</strong> /ts/ and the non-production <strong>of</strong> /ts/ in onset position<br />
resulting in an increased odds <strong>of</strong> lower rating for Rater 1. It is likely that the production <strong>of</strong> /ts/<br />
sounded accented, even when phonologically correct. So far, this chapter has focused on<br />
120
phonological factors that may affect the native-likeness rating given by fluent speakers <strong>of</strong> <strong>Numu</strong><br />
to words produced by non-speakers. However, in a series <strong>of</strong> perception experiments with French<br />
speakers producing English phrases and segments (/t/, /i/, and /u/), Flege (1983) found that adult<br />
English speakers, “possess the ability to detect within-category (subphonemic) differences<br />
between language varieties, and to use this information in detecting foreign accent” (p. 680). The<br />
next section therefore explores several subphonemic factors found to be significantly different<br />
between fluent speaker and non-speaker groups in Chapter 3 to determine if these have an effect<br />
on fluent speakers’ perception <strong>of</strong> accent.<br />
5.3.2 Subphonemic factors<br />
In this section, the subphonemic factors that were examined in Chapter 3 are regressed on the<br />
recoded accentedness ratings (1-3 = “non-native”; 4-5 = “native). The continuous independent<br />
variables were recoded as ordinal variables for the regression analysis, with four levels (or cutpoints)<br />
defined at the four quartiles for each variable. The random effects described above were<br />
also included in the model for each rater. Tables 65 and 66 provide the results for the regressions<br />
for Rater 1 and Rater 2 respectively. The first column, Factor, names the subphonemic<br />
independent variables. The next column lists each quartile (Quar.), followed by a column (Level)<br />
that defines the value at each quartile (quartile calculations are based on the data included in the<br />
current perception study). The next three columns provide regression results, including the<br />
coefficient, standard error (Std. Error), and p-value. Note that the coefficient is the log odds <strong>of</strong> a<br />
factor affecting a rater’s rating; positive odds indicate an increase in the likelihood <strong>of</strong> a “native”<br />
rating. The final columns report the variance in the model as the result <strong>of</strong> each random effect.<br />
Shaded rows represent non-significant factors or levels.<br />
The raters differ in which subphonemic factors result in an increased odds <strong>of</strong> a different rating,<br />
but onset VOT, intervocalic singleton and geminate nasal duration, and long vowel duration are<br />
not significant factors for either rater. For Rater 1, fortis duration, fortis VOT, fortis relative<br />
burst amplitude, and fortis relative burst intensity play significant roles in ratings, as do lenis<br />
duration, nasal onset duration, and short vowel duration. Rater 2 also relies significantly on all<br />
four fortis measures, though for her, ratings <strong>of</strong> lenis sounds are dependent on VOT and relative<br />
burst intensity rather than on duration. Rater 2’s ratings were also significant for short vowel<br />
duration. Like Rater 1, nasal onset duration in the third quartile greatly increases the odds <strong>of</strong> a<br />
“native-like” rating.<br />
It is worth noting that Rater 2’s results include two factors for which performance at any quartile<br />
resulted in increased odds <strong>of</strong> a “native” rating: fortis VOT and short vowel duration. For this<br />
rater, it appears that any production <strong>of</strong> these features is positive. The short vowel duration factor<br />
may help explain the high number <strong>of</strong> 4- and 5-ratings she assigned, as the majority <strong>of</strong> the words<br />
in the data set included a short stressed vowel (recall that all vowel measurements were made on<br />
stressed vowels).<br />
121
Factor<br />
Onset VOT<br />
Fortis Duration<br />
Fortis VOT<br />
Fortis Amplitude<br />
Fortis Intensity<br />
Lenis Duration<br />
Lenis VOT<br />
Lenis Amplitude<br />
Lenis Intensity<br />
Nasal Onset<br />
Duration<br />
Singleton Nasal<br />
Geminate Nasal<br />
Short Vowel Duration<br />
Long Vowel Duration<br />
Table 66. Rater 2 regression results for subphonemic factors.<br />
Quar. Level Coeff-<br />
icient<br />
Fixed Effects Random Effects Variance<br />
5.3.3 Difference ratings<br />
Phonological and subphonemic factors do appear to play a role in fluent speakers’ perception <strong>of</strong><br />
accent in non-speakers. However, what the models above do not test is the importance <strong>of</strong> degree<br />
<strong>of</strong> difference from the fluent speakers’ pronunciation. To test this factor, all <strong>of</strong> the rated nonspeaker<br />
productions were narrowly transcribed using the international phonetic alphabet. The<br />
fluent speaker inputs to their productions and the raters’ productions <strong>of</strong> the same words were also<br />
123<br />
Std.<br />
Error<br />
1 143 ms 1.08 0.48 < 0.05<br />
2 166 ms<br />
3 200 ms 1.73 0.57 < 0.01<br />
4 438 ms<br />
1 17 ms 0.98 0.46 < 0.05<br />
2 28 ms 1.71 0.51 < 0.001<br />
3 43 ms 1.34 0.49 < 0.01<br />
4 130 ms 1.33 0.51 < 0.01<br />
1 0.10 Pa<br />
2 0.19 Pa<br />
3 0.29 Pa 1.33 0.49 < 0.01<br />
4 0.71 Pa 0.99 0.46 < 0.05<br />
1 12 dB<br />
2 15 dB 1.56 0.53 < 0.01<br />
3 18 dB<br />
4 36 dB 1.12 0.47 < 0.05<br />
1 -67 ms<br />
2 14 ms 0.96 0.41 < 0.05<br />
3 29 ms 1.16 0.45 < 0.05<br />
4 146 ms<br />
1 13 dB 1.53 0.66 < 0.05<br />
2 17 dB<br />
3 21 dB<br />
4 32 dB<br />
1 56 ms<br />
2 86 ms<br />
3 110 ms 2.16 0.083 < 0.01<br />
4 301 ms<br />
1 118 ms 3.09 1.17 < 0.01<br />
2 150 ms 3.17 1.17 < 0.01<br />
3 180 ms 3.26 1.18 < 0.01<br />
4 345 ms 3.38 1.19 < 0.01<br />
p-value Word Parti-<br />
cipant<br />
Input Group<br />
0.703 0.269 0.026 0.052<br />
0.866 0.292 0.023 0.061<br />
0.698 0.299 0.020 0.059<br />
0.700 0.294 0.019 0.056<br />
0.613 0.293 0.032 0.042<br />
0.582 0.277 0.028 0.053<br />
0.519 0.287 0.029 0.047<br />
0.507 0.135 - 0.078
narrowly transcribed. 25 All cases where the fluent speaker inputs and the raters’ productions were<br />
appreciably different (e.g., words that showed significant dialectal difference) were removed. All<br />
cases were also removed where the two raters differed in their rating <strong>of</strong> the production by more<br />
than 1 so that both raters could be included in the same model. The resulting list <strong>of</strong> 540<br />
transcriptions <strong>of</strong> non-speaker productions were then compared to the transcriptions <strong>of</strong> each <strong>of</strong> the<br />
raters’ productions, and any differences between non-speaker and rater productions were<br />
recorded. Table 67 provides the combined distribution and percentage <strong>of</strong> ratings from both raters<br />
for these 540 words.<br />
Table 67. Count and percentage <strong>of</strong> the ratings given by both raters for the 540 non-speaker productions<br />
that were analyzed using narrow transcriptions.<br />
Rating Count Percentage<br />
1 219 20.28%<br />
2 95 8.80%<br />
3 56 5.19%<br />
4 172 15.93%<br />
5 538 49.81%<br />
Note that the middle rating, 3, makes up only 5.19% <strong>of</strong> data for this set, which precludes the use<br />
<strong>of</strong> ordinal logistic regression due to insufficient cases. However, excluding the 3-rated data<br />
allows the use <strong>of</strong> ordinal logistic regression <strong>of</strong> the number <strong>of</strong> production differences against<br />
ratings without a substantial loss <strong>of</strong> input. The result, which is significant at the p
Table 68. Results <strong>of</strong> an ordinal regression <strong>of</strong> participant, gender, group, and input on ratings, by rater.<br />
Factor<br />
Comparative<br />
Groups<br />
Coefficient<br />
Rater 1<br />
Std.<br />
Error<br />
p-value<br />
Coefficient<br />
Rater 2<br />
Std.<br />
Error<br />
p-value<br />
Participant WS03 0.888 0.35 0.012 *<br />
WS05 1.466 0.34 0.000 ***<br />
WS09 1.477 0.37 0.000 ***<br />
Gender male -0.793 0.14 0.000 ***<br />
Group Warm Springs 1 0.345 0.13 0.010 ** 0.435 0.14 0.002 **<br />
Warm Springs 2 0.689 0.14 0.000 *** 0.565 0.16 0.000 ***<br />
Input Speaker B -0.469 0.17 0.005 **<br />
Speaker C<br />
Speaker D<br />
-0.465 0.16 0.004 **<br />
For Rater 1, being one <strong>of</strong> the three individual non-speakers who emerged as significant in the<br />
Participant factor increases the odds <strong>of</strong> an increase in native-likeness ratings (note that none <strong>of</strong><br />
these participants had previous exposure to Kiksht or Ichishkin). It is unclear why these three<br />
individuals have a tendency to sound more native-like to Rater 1; perhaps they have better<br />
pronunciation than other individuals, or perhaps Rater 1 recognized their voices. Davies (2003)<br />
argues that people’s perception <strong>of</strong> accent depends a great deal on whether or not they recognize a<br />
speaker as part <strong>of</strong> a speech community. The fact that no one from the Madras group is<br />
represented here may indicate that the latter possibility is true. On the other hand, only three <strong>of</strong><br />
fourteen participants from the Warm Springs community have significant results, though Rater 1<br />
is acquainted with the majority <strong>of</strong> these participants. Also, raters were presented with a large<br />
number <strong>of</strong> randomly organized tokens by the non-speakers during the experimental sessions,<br />
which was meant to make voice recognition difficult.<br />
Gender was also a significant factor for Rater 1. Being male increases the odds <strong>of</strong> a decrease in<br />
native-likeness. Also, as compared to non-speaker productions from input given by Rater 1<br />
(Speaker A), productions <strong>of</strong> words from input from Speakers B and D resulted in the odds <strong>of</strong> a<br />
decrease in native-likeness for her. For both Raters, being a member <strong>of</strong> the Warm Springs 1<br />
Group or the Warm Springs 2 Group increases the odds <strong>of</strong> an increased native-likeness rating, as<br />
compared to being a member <strong>of</strong> the Madras Group (the Madras group forms the comparative<br />
group and is therefore not included in the table). This result is not likely linked to voicerecognition,<br />
as the raters are acquainted with members <strong>of</strong> both groups, and because we see a<br />
pattern <strong>of</strong> increased native-likeness in the group with the most previous <strong>Numu</strong> experience.<br />
5.4 Discussion<br />
It is interesting that all four fortis obstruent measures played significant roles in both raters’<br />
assignments <strong>of</strong> ratings, though relative fortis burst amplitude does not significantly distinguish<br />
fortis from lenis sounds in fluent speaker productions. However, recall from Chapter 3 that fluent<br />
speakers have larger mean fortis burst amplitudes and mean fortis burst intensities than any <strong>of</strong><br />
the non-speaker groups. The current perception results show that non-speaker productions with<br />
higher magnitude amplitude and intensity tend to result in higher ratings for both raters. It is<br />
125
certainly possible that fortis sounds are associated with specific subphonemic features for fluent<br />
speakers, independent <strong>of</strong> comparisons with lenis sounds. Fortis sounds do appear to be very<br />
relevant to fluent speakers, which may partially account for the presence <strong>of</strong> ejectives in the nonspeaker<br />
data. Warm Springs community members are perhaps aware <strong>of</strong> the importance <strong>of</strong><br />
“strong” fortis sounds in <strong>Numu</strong>, and conflate these sounds with the ejectives found in the two<br />
other Warm Springs languages. However, note that ejectives occurred in non-fortis positions in<br />
some non-speakers’ productions, suggesting that additional factors are at play, as discussed in<br />
Chapter 4.<br />
The two raters differed in their evaluation <strong>of</strong> lenis sounds. For Rater 1, low lenis duration was<br />
associated with higher ratings, while Rater 2 tended to give higher ratings to words with low<br />
intensity lenis sounds and lenis sounds with mid-range VOT values. Recall that fluent speakers<br />
tend to differentiate fortis and lenis sounds by duration more so than by VOT, though both are<br />
significant factors. Again, perception <strong>of</strong> lenis sounds as independent segments may be associated<br />
with specific features for both raters that do not necessarily correlate with fortis/lenis<br />
differentiation.<br />
It is also interesting that intervocalic nasal duration measures did not significantly affect ratings<br />
for either rater, though both raters tended to give higher ratings to words with longer onset nasal<br />
durations. In Chapter 3, we saw that non-speakers significantly distinguish onset from<br />
intervocalic singleton nasal duration, though fluent speakers do not, and we also observed that<br />
fluent speakers have the second shortest onset nasal duration values (following the Madras<br />
Group, which exhibited the shortest onset nasal duration). So it appears that though fluent<br />
speakers produce relatively short onset nasal duration, they value longer values in perception. It<br />
is possible that it was easier for them to distinguish which nasal was produced by non-speakers<br />
when the duration was longer, but the pay<strong>of</strong>f for learners from the Warm Springs area is a<br />
valuation <strong>of</strong> their production tendencies. However, Rater 2 did not give significantly higher<br />
ratings for onset nasals produced in the highest duration quartile, so for her at least, there is a<br />
limit to the positive effects <strong>of</strong> onset nasal length.<br />
Though Waterman (1911) reports that English and <strong>Numu</strong> onset VOT differ, this measure was not<br />
a significant factor in raters’ ratings. Uvularization <strong>of</strong> velar consonants following a low vowel<br />
and stress placement were also not factors. It is likely that none <strong>of</strong> these factors affected raters’<br />
ratings because none <strong>of</strong> them play contrastive roles in the language. Similarly, it is unsurprising<br />
to find a correlation between the number <strong>of</strong> mistakes (i.e., differences between non-speaker and<br />
rater productions) made and the odds <strong>of</strong> receiving a lower rating. It is likely that fluent speakers<br />
find it easy to overlook a single mistake in a non-speaker production, perhaps even attributing it<br />
to the natural variation that occurs in human speech, but multiple mistakes begin to decrease the<br />
comprehensibility <strong>of</strong> the word. Likewise, differences in onset VOT, uvularization, and stress<br />
placement can be more easily attributed to natural variation, as they do not affect word<br />
meanings.<br />
The production <strong>of</strong> ejectives by non-speakers from Warm Springs was also hypothesized to carry<br />
socially contrastive rather than linguistically contrastive information, and for Rater 2, ejective<br />
production was not a significant factor in ratings (though it approached significance). For Rater<br />
1, however, the presence <strong>of</strong> ejectives in the data resulted in lower ratings. For both raters, vowel<br />
126
These results provide a potential resource for language learners who wish to improve their<br />
pronunciation from a <strong>Numu</strong> perspective. It also demonstrates that features that draw particular<br />
attention by linguistic researchers (e.g., onset VOT) may not be very relevant to a speech<br />
community, while other aspects <strong>of</strong> speech (e.g., fortis production) are particularly salient. The<br />
implication <strong>of</strong> these findings is that it is not safe for non-community linguists to assume what<br />
language change will mean to an endangered language speech community without a thorough<br />
examination <strong>of</strong> the situation from the perspective <strong>of</strong> fluent speakers. While I do not necessarily<br />
recommend that a study such as this should be conducted in every case, I do recommend taking a<br />
collaborative approach with community members in determining what is salient (cf. Leonard &<br />
Haynes, In Press). A second implication is that <strong>Numu</strong> (and other endangered languages in similar<br />
social contexts) may continue to be an authentic marker <strong>of</strong> <strong>Numu</strong> culture, even if it incorporates<br />
some <strong>of</strong> the features <strong>of</strong> second language learner speech. This is especially true for second<br />
language learners who have had some previous exposure to fluent speakers <strong>of</strong> the language.<br />
128
6.1 Summary <strong>of</strong> research<br />
CHAPTER 6<br />
Concluding Remarks<br />
This dissertation has compared phonetic and phonological features <strong>of</strong> <strong>Numu</strong> words produced by<br />
fluent speakers to those produced by non-speakers. The differences between speaker and nonspeaker<br />
pronunciation point to possible future language changes, as there are few remaining<br />
native speakers <strong>of</strong> <strong>Numu</strong> in Warm Springs, and the language is likely to be carried on primarily<br />
by second language learners. Most <strong>of</strong> the differences exhibit characteristics <strong>of</strong> gradient transfer<br />
effects, or effects correlated with previous language experience. This result was expected based<br />
on research showing that previous exposure may improve both language perception (e.g., Oh et<br />
al., 2003) and language production (e.g., Knightly et al., 2003). Non-speakers’ productions also<br />
show evidence <strong>of</strong> adoption <strong>of</strong> universal features and hypercorrection. Finally, a fourth<br />
possibility for endangered language change, areal hypercorrection, was proposed, based on the<br />
emergence <strong>of</strong> ejectives in some non-speakers’ productions. Ejectives are common to the<br />
indigenous languages <strong>of</strong> the Northwest, including the two other indigenous languages spoken in<br />
Warm Springs, but are not a feature <strong>of</strong> <strong>Numu</strong>.<br />
The second part <strong>of</strong> the research examined fluent speakers’ reactions to non-speakers’ productions<br />
in an effort to identify which differences in pronunciation are perceivable. It was found that<br />
variation in non-contrastive sounds draws little attention, but that multiple deviations from fluent<br />
productions within a word contribute to a lower rating <strong>of</strong> native-likeness. Fluent speakers also<br />
tend to give higher ratings to the non-speakers with the most previous <strong>Numu</strong> experience, loosely<br />
following the gradient transfer effects pattern. <strong>Case</strong>s <strong>of</strong> hypercorrection and areal<br />
hypercorrection, on the other hand, were found to be less acceptable.<br />
6.2 Implications and future research<br />
This research highlights the possible implications <strong>of</strong> using electronic media in language<br />
revitalization, an approach that has gained popularity as more and more people have access to<br />
computers and other devices that can display and transmit large amounts <strong>of</strong> data, including sound<br />
files. On the one hand, this approach gives much broader access to people interested in learning<br />
the language and provides people an opportunity to participate in language revitalization even if<br />
their schedule or physical location would otherwise prevent it. On the other hand, without<br />
feedback from fluent speakers, learners are likely to use their own output as language input,<br />
reinforcing any errors present in their productions (see Markham, 1997, p.90). What the current<br />
research suggests is that learners with previous exposure to the language, even ambient exposure,<br />
make fewer deviations from fluent speaker productions and tend to be perceived as more nativelike<br />
by fluent speakers. Thus, the use <strong>of</strong> electronic media should be supplemented by interactions<br />
with fluent speakers as <strong>of</strong>ten as possible.<br />
Because there are cases where such interactions are impossible or infrequent (e.g., many Warm<br />
Springs teenagers attend high school at boarding schools away from the Warm Springs<br />
129
community and do not have much direct exposure to the Warm Springs languages during the<br />
school year), one potentially important future line <strong>of</strong> research is ways in which to address learner<br />
accents through electronic means. For example, Bradlow et al. (1997) have found that adult<br />
speakers <strong>of</strong> Japanese can improve their perception, and to some degree their production, <strong>of</strong><br />
English /r/ and /l/ using a technique called perceptual learning. Perceptual learning involves a<br />
forced-choice task in which a participant listens to a minimal pair <strong>of</strong> words featuring a given<br />
phonological contrast and selects the word that contains the appropriate phoneme. They are<br />
given immediate feedback on their choice (correct or incorrect) before moving on to the next<br />
pair.<br />
While a perceptual learning task could be easily adapted to a web-accessible learning portal, for<br />
example, further study is required to determine if it is tenable as a method for improving<br />
pronunciation in endangered language contexts. Though none <strong>of</strong> the subjects in Bradlow et al.<br />
(1997) had lived in an English-speaking country, they had all had several years <strong>of</strong> formal English<br />
training (as is typical in Japan). It would be useful to learn if these results would be reproducible<br />
in a language context where learners had little previous training or fluent speaker input. It would<br />
also be useful to know if there is an effect <strong>of</strong> type <strong>of</strong> phonological contrast on perception and<br />
production results (i.e., whether some types <strong>of</strong> contrasts are more amenable to this type <strong>of</strong><br />
learning task). Francis & Nusbaum (2002) have partially addressed both <strong>of</strong> these questions. In a<br />
study <strong>of</strong> the acquisition <strong>of</strong> the Korean three-way stop contrast by English speakers, they found<br />
that perceptual learning can improve non-speakers’ perception <strong>of</strong> both within-category similarity<br />
and between-category differences. Their subjects had no previous experience with Korean.<br />
However, they explored only perception, not production, and they concluded that it is unclear if<br />
these results extend to more general circumstances <strong>of</strong> phonetic learning. Finally, for perceptual<br />
learning tasks to be practical for language learning, they must be able to efficiently address<br />
multiple contrasts. The final question that must therefore be researched is how many contrasts<br />
can be included in a perceptual learning session before learners’ perception and production<br />
outcomes diminish significantly.<br />
These are all areas <strong>of</strong> study that merit further research, but only ins<strong>of</strong>ar as a given community<br />
(and/or individuals within the community) determines the need for improving language learners’<br />
pronunciation through electronic means. The current research has been inconclusive about social<br />
factors that influence <strong>Numu</strong> speakers’ perception <strong>of</strong> accented speech, though it suggests that<br />
such factors may be significant. Further study using ethnographic methods are required to<br />
determine the weight <strong>of</strong> such factors and how they affect accent perception. In any given<br />
community, this information would provide important information about the acceptability <strong>of</strong><br />
developing electronic resources for language learning and pronunciation improvement.<br />
6.3 Conclusion<br />
Though further research is required to better understand the place <strong>of</strong> non-speaker <strong>Numu</strong><br />
productions in Warm Springs society, this study provides information about how these<br />
productions differ from fluent speaker productions. It also provides acoustic correlates to<br />
judgments <strong>of</strong> accented speech in <strong>Numu</strong>. My hope is that it furthers our understanding <strong>of</strong> phonetic<br />
and phonological change in an endangered language context, both from the perspective <strong>of</strong><br />
linguistic science and from the perspective <strong>of</strong> fluent <strong>Numu</strong> speakers.<br />
130
Best, C. T. (1994). The emergence <strong>of</strong> native-language phonological influences in infants: A<br />
perceptual assimilation model. In J. Goodman & H. C. Nusbaum (Eds.), The development<br />
<strong>of</strong> speech perception: The transition from speech sounds to spoken words (pp. 167-224).<br />
Cambridge, MA: MIT Press.<br />
Best, C. T. (1995). A direct realist view <strong>of</strong> cross-language speech perception. In W. Strange<br />
(Ed.), Speech perception and linguistic experience: Issues in cross-language research<br />
(pp. 171-204). Baltimore, MD: York Press.<br />
Blust, R. (2005). Must sound change be linguistically motivated? Diachronica, 22(2), 219-269.<br />
Boersma, P. & Weenink, D. (2008). Praat: Doing phonetics by computer. http://www.praat.org.<br />
Bradlow, A., Pisoni, D. B., Akahane-Yamada, R., & Tohkura, Y. (1997). Training Japanese<br />
listeners to identify English /r/ and /l/: IV. Some effects <strong>of</strong> perceptual learning on speech<br />
production. Journal <strong>of</strong> the Acoustical Society <strong>of</strong> America, 101(4), 2299-2310.<br />
Brody, J. J. (2001). 1999 presidential address: From Conquistadores to Zapatistas: Language<br />
contact, change, and judgments <strong>of</strong> authenticity. Southwest Journal <strong>of</strong> <strong>Linguistics</strong>, 20(2),<br />
1-17.<br />
Broselow, E., Chen, S.-I., & Wang, C. (1998). The emergence <strong>of</strong> the unmarked in second<br />
language phonology. Studies in Second Language Acquisition, 20(2), 261-280.<br />
Byrd, D. (1993). 54,000 American stops. UCLA Working Papers in Phonetics, 83, 97–116.<br />
Campbell, L. & Muntzel, M. A. (1989). The structural consequences <strong>of</strong> language death. In N.<br />
Dorian (Ed.), Investigating obsolescence: Studies in language contraction and death (pp.<br />
181-196). Cambridge, England: Cambridge <strong>University</strong> Press.<br />
Carpenter, V. (1997). Teaching children to “unlearn” the sounds <strong>of</strong> English. In J. Reyhner (Ed.),<br />
Teaching indigenous languages (pp. 31-39). Flagstaff, AZ: Northern Arizona <strong>University</strong>.<br />
Celce-Murcia, M., Brinton, D. M., & Goodwin, J. M. (1996). Teaching pronunciation: A<br />
reference for teachers <strong>of</strong> English to speakers <strong>of</strong> other languages. New York, NY:<br />
Cambridge <strong>University</strong> Press.<br />
Chang, C. B. (2007). Acoustic measures <strong>of</strong> sound change in language obsolescence. Poster<br />
presented at the 154th Meeting <strong>of</strong> the Acoustical Society <strong>of</strong> America. New Orleans, LA:<br />
Sheraton New Orleans Hotel, November 28.<br />
Chang, C. B. (2009). Phonological categories in early L2 acquisition. Poster presented at the<br />
83rd Annual Meeting <strong>of</strong> the Linguistic Society <strong>of</strong> America. San Francisco, CA: Hilton San<br />
Francisco, January 10.<br />
132
Dorian, N. C. (1994a). Varieties <strong>of</strong> variation in a very small place: Social homogeneity, prestige<br />
norms, and linguistic variation. Language, 70(4), 631-96.<br />
Dorian, N. C. (1994b). Purism vs. compromise in language revitalization and language revival.<br />
Language in Society, 23, 479-494.<br />
Dorian, N. C. (2006). Negative borrowing in an indigenous-language shift to the dominant<br />
national language. International Journal <strong>of</strong> Bilingual Education and Bilingualism, 9(5),<br />
557-577.<br />
Dressler, W. U. & Wodak-Leodolter, R. (1977). Language preservation and language death in<br />
Brittany. International Journal <strong>of</strong> the Sociology <strong>of</strong> Language, 12, 33-44.<br />
Eckman, F. R. (1991). The Structural Conformity Hypothesis and the acquisition <strong>of</strong> consonant<br />
clusters in the interlanguage <strong>of</strong> ESL learners. Studies in Second Language Acquisition,<br />
13, 23-41.<br />
Eckman, F. R. (2004). From phonemic differences to constraint rankings. Studies in Second<br />
Language Acquisition, 26, 513-549.<br />
Eguchi, S. (1976). Difference limens for the formant frequencies: Normal adult values and their<br />
development in children. Journal <strong>of</strong> the American Audiology Society, 1(4), 145-149.<br />
Ellis, R. (1989). Sources <strong>of</strong> intra-learner variability in language use and their relationship to<br />
second language acquisition. In S. Gass, C. Madden, D. Preston, & L. Selinker (Eds.),<br />
Variation in second language acquisition: Psycholinguistic issues (pp. 22-45).<br />
Philadelphia, PA: Multilingual Matters.<br />
Epstein, S., Flynn, S., & Martohardjono, G. (1996). Second language acquisition: Theoretical<br />
and experimental issues in contemporary research. Behavioral and Brain Sciences, 19,<br />
677–758.<br />
Escudero, P. & Boersma, P. (2004). Bridging the gap between L2 speech perception research and<br />
phonological theory. Studies in Second Language Acquisition, 26, 551-585.<br />
Evans, N. (2001). The last speaker is dead -Long live the last speaker! In P. Newman and M.<br />
Ratliff (Eds.), Linguistic fieldwork (pp. 250-281). Cambridge, England: Cambridge<br />
<strong>University</strong> Press.<br />
Fishman, J. (1991). Reversing language shift: Theoretical and empirical foundations <strong>of</strong><br />
assistance to threatened languages. Clevedon, England: Multilingual Matters.<br />
Flanagan, J. L. (1955). A difference limen for vowel formant frequency. The Journal <strong>of</strong> the<br />
Acoustical Society <strong>of</strong> America, 27(3), 613-617.<br />
134
Flege, J. E. (1983). Detection <strong>of</strong> foreign accentedness. In M. P. R. Van den Broecke & A. Cohen<br />
(Eds.), Proceedings <strong>of</strong> the tenth international conference <strong>of</strong> phonetic sciences (pp. 677-<br />
681). Dordrecht, The Netherlands: Foris.<br />
Flege, J. E. (1987). A critical period for learning to pronounce foreign languages? Applied<br />
<strong>Linguistics</strong>, 8, 162–177.<br />
Flege, J. E. (1992). Speech learning in a second language. In C. A. Ferguson, L. Menn, & C.<br />
Stoel-Gammon (Eds.), Phonological development: Models, research, implications (pp.<br />
565-604). Timonium, MD: York Press.<br />
Flege, J. E. (1995). Second language speech learning: Theory, findings, and problems. In W.<br />
Strange (Ed.), Speech perception and linguistic experience: Issues in cross-language<br />
speech research (pp. 233-277). Timonium, MD: York.<br />
Flege, J. E. (2009). Give input a chance! In T. Piske & M. Young-Scholten (Eds.), Input matters<br />
in SLA (pp. 175-190). Tonawanda, NY: Multilingual Matters.<br />
Flege, J. E. & Liu, S. (2001). The effects <strong>of</strong> experience on adults’ acquisition <strong>of</strong> a second<br />
language. Studies in Second Language Acquisition, 23, 527-552.<br />
Flege, J. E. & Port, R. (1981). Cross-language phonetic interference: Arabic to English.<br />
Language & Speech, 24(2), 125-146.<br />
Flemming, E., Ladefoged, P., & Thomason, S. (2008). Phonetic structures <strong>of</strong> Montana Salish.<br />
Journal <strong>of</strong> Phonetics, 36, 465-491.<br />
Foley, W. (2006). Universal constraints and local conditions in pidginization: <strong>Case</strong> studies from<br />
New Guinea. Journal <strong>of</strong> Pidgin and Creole Languages, 21(1), 1-44.<br />
Francis, A. L. & Nusbaum, H. C. (2002). Selective attention and the acquisition <strong>of</strong> new phonetic<br />
categories. Journal <strong>of</strong> Experimental Psychology: Human Perception and Performance,<br />
28(2), 349-366.<br />
Garson, G. D. (2010). Logistic regression.<br />
http://faculty.chass.ncsu.edu/garson/PA765/logistic.htm<br />
Goldsmith, J. A. (1976). Autosegmental phonology (Doctoral dissertation). Massachusetts<br />
Institute <strong>of</strong> Technology, Cambridge, MA.<br />
Goodfellow, A. M. (2003). The development <strong>of</strong> “new” languages in Native American<br />
communities. American Indian Culture and Research Journal, 27(2), 41-59.<br />
Goodfellow, A. M. (2005). Talking in context: Language and identity in K w ak w aka’wak w society.<br />
Montreal, QC: McGill-Queen’s <strong>University</strong> Press.<br />
135
Greymorning, S. (2001). Reflections on the Arapaho language project, or when Bambi spoke<br />
Arapaho and other tales <strong>of</strong> Arapaho language revitalization efforts. In L. Hinton & K.<br />
Hale (Eds.), The green book <strong>of</strong> language revitalization in practice (pp. 287−297). San<br />
Diego, CA: Academic Press.<br />
Gross, J. (2007). Forging a monolingual country. In J. Gross (Ed.), Teaching Oregon Native<br />
languages (pp. 7-34). Corvallis, OR: Oregon State <strong>University</strong> Press.<br />
Hamp, E. P. (1989). On signs <strong>of</strong> health and death. In N. Dorian (Ed.), Investigating<br />
obsolescence: Studies in language contraction and death (pp. 197-210). Cambridge,<br />
England: Cambridge <strong>University</strong> Press.<br />
Hawk, J. W. (1994). Difference limens for formant patterns <strong>of</strong> vowel sounds. Journal <strong>of</strong> the<br />
Acoustical Society <strong>of</strong> America, 95(2), 1074-1084.<br />
Haynes, E. (2004). Obstacles facing tribal language programs in Warm Springs, Klamath, and<br />
Grand Ronde. Coyote Papers (<strong>University</strong> <strong>of</strong> Arizona), 13, 87-102.<br />
Haynes, E. (2007). The present climate for Native language education. In Gross, J. (Ed.),<br />
Teaching Oregon’s Native languages (pp. 69-93). Corvallis, OR: Oregon State<br />
<strong>University</strong> Press.<br />
Haynes, E. (In Press). When support for language revitalization is not enough: The end <strong>of</strong><br />
indigenous language classes at Warm Springs Elementary School. International Journal<br />
<strong>of</strong> the Sociology <strong>of</strong> Language.<br />
Hill, J. H. (1970). Foreign accents, language acquisition, and cerebral dominance revisited.<br />
Language Learning, 20(2), 237-248.<br />
Hill, J. H. (1978). Language contact systems and human adaptations. Journal <strong>of</strong> Anthropological<br />
Research, 34(1), 1-26.<br />
Hill, J. H. (2002). “Expert rhetorics” in advocacy for endangered languages: Who is listening,<br />
and what do they hear? Journal <strong>of</strong> Linguistic Anthropology, 12(2), 119-133.<br />
Hinton, L. (2001a). Language revitalization: An overview. In L. Hinton & K. Hale (Eds.), The<br />
green book <strong>of</strong> language revitalization in practice (pp. 3-18). San Diego, CA: Academic<br />
Press.<br />
Hinton, L. (2001b). Teaching methods. In L. Hinton & K. Hale (Eds.), The green book <strong>of</strong><br />
language revitalization in practice (pp. 179-189). San Diego, CA: Academic Press.<br />
Hinton, L. & Ahlers, J. (1999). The issue <strong>of</strong> “authenticity” in <strong>California</strong> language restoration.<br />
Anthropology and Education Quarterly, 30(1), 56-67.<br />
136
Maddieson, I. (2009). Phonology, naturalness, and universals. Poznán Studies in Contemporary<br />
<strong>Linguistics</strong>, 45(1), 131-140.<br />
Major, R. C. (2001). Foreign accent: The ontogeny and phylogeny <strong>of</strong> second language<br />
phonology. Mahwah, NJ: Lawrence Erlbaum.<br />
Major, R. C., & Kim, E. (1996). The similarity differential rate hypothesis. Language Learning,<br />
46, 465–496.<br />
Markham, D. (1997). Phonetic imitation, accent, and the learner. Lund, Sweden: Lund<br />
<strong>University</strong> Press.<br />
Miller, W. R. (1986). Numic languages. In W. L. d’Azevedo (Ed.), Handbook <strong>of</strong> North American<br />
Indians, volume 11: Great Basin (pp. 98-106). Washington, DC: Smithsonian Institution.<br />
Milroy, J. (2003). On the role <strong>of</strong> the speaker in language change. In R. Hickey (Ed.), Motives for<br />
language change (pp. 143-157). West Nyack, NY: Cambridge <strong>University</strong> Press.<br />
Mitlieb, F. (1983). Timing <strong>of</strong> English vowels spoken with an Arabic accent. In M. P. R. Van den<br />
Broecke & A. Cohen (Eds.), Proceedings <strong>of</strong> the tenth international conference <strong>of</strong><br />
phonetic sciences (pp. 700-705). Dordrecht, The Netherlands: Foris.<br />
Montrul, S. (2006). Incomplete acquisition as a feature <strong>of</strong> bilingual and L2 grammars. In R.<br />
Slabakova, S. A. Montrul, & P. Prévost (Eds.), Inquiries in linguist development: In<br />
honor <strong>of</strong> Lydia White (pp. 335-359). Philadelphia, PA: John Benjamins.<br />
Moore, R. E. (1988). Lexicalization versus lexical loss in Wasco-Wishram language<br />
obsolescence. International Journal <strong>of</strong> American <strong>Linguistics</strong>, 54(4), 453-468.<br />
Moyer, A. (2009). Input as a critical means to an end: Quantity and quality <strong>of</strong> experience in L2<br />
phonological attainment. In T. Piske & M. Young-Scholten (Eds.), Input matters in SLA<br />
(pp. 159-174). Tonawanda, NY: Multilingual Matters.<br />
Mufwene, S. (1993). Investigating Gullah: Difficulties in ensuring ‘authenticity’. In W. Glowka<br />
& D. Lance (Eds.), Language variation in North American English: Research and<br />
teaching (pp.178-190). New York, NY: Modern Language Association <strong>of</strong> America.<br />
Native American Languages Act <strong>of</strong> 1990, 104, 25 U.S.C. 2901-2906.<br />
Nearey, T. M. (1977). Phonetic feature systems for vowels (Doctoral dissertation). <strong>University</strong> <strong>of</strong><br />
Alberta, Canada.<br />
Nichols, M. P. (1974). Northern Paiute historical grammar (Doctoral dissertation). <strong>University</strong> <strong>of</strong><br />
<strong>California</strong>, <strong>Berkeley</strong>, CA.<br />
Ogbu, J. (1987). Variability in minority school performance: A problem in search <strong>of</strong> an<br />
explanation. Anthropology and Education Quarterly, 18(4), 312−334.<br />
139
Sundara, M. (2005). Acoustic-phonetics <strong>of</strong> coronal stops: A cross-language study <strong>of</strong> Canadian<br />
French and Canadian English. Journal <strong>of</strong> the Acoustic Society <strong>of</strong> America, 118(2), 1026-<br />
1037.<br />
The Indian education act <strong>of</strong> 1972. (1975). Journal <strong>of</strong> American Indian Education, 14(3), 5-6.<br />
Thomason, S. G. & Kaufman, T. (1988). Language contact, creolization, and genetic linguistics.<br />
<strong>Berkeley</strong>, CA: <strong>University</strong> <strong>of</strong> <strong>California</strong> Press.<br />
Thornes, T. (2003). A Northern Paiute grammar with texts (Doctoral dissertation). <strong>University</strong> <strong>of</strong><br />
Oregon, Eugene, OR.<br />
Tr<strong>of</strong>imovich, P. & Baker, W. (2007). Learning prosody and fluency characteristics <strong>of</strong> second<br />
language speech: The effect <strong>of</strong> experience on child learners’ acquisition <strong>of</strong> five<br />
suprasegmentals. Applied Psycholinguistics, 28(2), 251-276.<br />
Trudgill, P. (1989). Interlanguage, interdialect and typological change. In S. Gass, C. Madden,<br />
D. Preston, & L. Selinker (Eds.), Variation in second language acquisition:<br />
Psycholinguistic issues (pp. 243-253). Philadelphia, PA: Multilingual Matters.<br />
Warner, N., Luna, Q., & Butler, L. (2007). Ethics and revitalization <strong>of</strong> dormant languages: The<br />
Mutsun language. Language Documentation and Conservation, 1(1), 58-76.<br />
http://nflrc.hawaii.edu/ldc/June2007/warner/warner.pdf<br />
Wassink, A. B. (1999). A sociophonetic analysis <strong>of</strong> Jamaican vowels (Doctoral dissertation).<br />
<strong>University</strong> <strong>of</strong> Michigan, Ann Arbor, MI.<br />
Wassink, A. B. (2006). A geometric representation <strong>of</strong> spectral and temporal vowel features:<br />
Quantification <strong>of</strong> vowel overlap in three linguistic varieties. Journal <strong>of</strong> the Acoustic<br />
Society <strong>of</strong> America, 119(4), 2334-2350.<br />
Waterman, T. T. (1911). The phonetic elements <strong>of</strong> the Northern Paiute language. <strong>University</strong> <strong>of</strong><br />
<strong>California</strong> Publications in American Archaeology and Ethnology, 10, 13-44.<br />
White, C. M. (2002). Language, authenticity, and identity: Indigenous Fijian students and<br />
language use in schools. Language, Culture and Curriculum, 15(1), 16-29.<br />
White, F. (2001). Participation and learning styles <strong>of</strong> the Haida: A study <strong>of</strong> a Haida language<br />
class (Doctoral dissertation). <strong>University</strong> <strong>of</strong> <strong>California</strong>, Los Angeles, CA.<br />
Wolfram, W. (2002). Language death and dying. In J. K. Chambers, P. Trudgill, & N. Schilling-<br />
Estes (Eds.), The handbook <strong>of</strong> language variation and change (pp.764-787). Malden,<br />
MA: Blackwell.<br />
Wong, L. (1999). Authenticity and the revitalization <strong>of</strong> Hawaiian. Anthropology and Education<br />
Quarterly, 30(1), 94-115.<br />
142
Woolard, K. A. (1989). Language convergence and language death as social processes. In N.<br />
Dorian (Ed.), Investigating obsolescence: Studies in language contraction and death (pp.<br />
355-367). Cambridge, England: Cambridge <strong>University</strong> Press.<br />
Young-Scholten, M. (2002). Orthographic input in L2 phonological development. In P.<br />
Burmeister, T. Piske, & A. Rohde (Eds.), An integrated view <strong>of</strong> language development:<br />
Papers in honor <strong>of</strong> Henning Wode (pp. 263-279). Trier, Germany: Wissenschaftlicher<br />
Verlag.<br />
Yu, A. C. L. (2008). The phonetics <strong>of</strong> quantity alternation in Washo. Journal <strong>of</strong> Phonetics, 36,<br />
508-520.<br />
143
Warm Springs<br />
Orthography<br />
Translation<br />
Narrow Transcription Total<br />
Tokens<br />
Speaker A Speaker B Speaker C Speaker D<br />
mogo'ne woman 4<br />
atsaba woodpecker 1<br />
atsabana<br />
woodpecker<br />
(existential)<br />
2<br />
tupo write 2<br />
tupo'o wrote 2<br />
i Thornes (2003) notes that a subset <strong>of</strong> Northern Paiute nouns bare a historical “absolute” suffix in their citation<br />
form. He states, “[These suffixes] neither involve a change in word class nor do they alter the meaning <strong>of</strong> the stem in<br />
any way. They simply form independent stems from otherwise dependent roots” (p. 105).<br />
ii literally means ‘one is missing’, using the base form <strong>of</strong> ‘one’, :<br />
<br />
one be.missing-PERFECTIVE (see Thornes, 2003, p. 212)<br />
, appearing in Speaker D’s version <strong>of</strong> ‘nine,’ is the nominative/predicative form <strong>of</strong> ‘one.’ I am not certain<br />
why this speaker produced ‘nine’ differently.<br />
147