

the production of thymoquinone from thymol and carvacrol
the production of thymoquinone from thymol and carvacrol
the production of thymoquinone from thymol and carvacrol

Create successful ePaper yourself
Turn your PDF publications into a flip-book with our unique Google optimized e-Paper software.
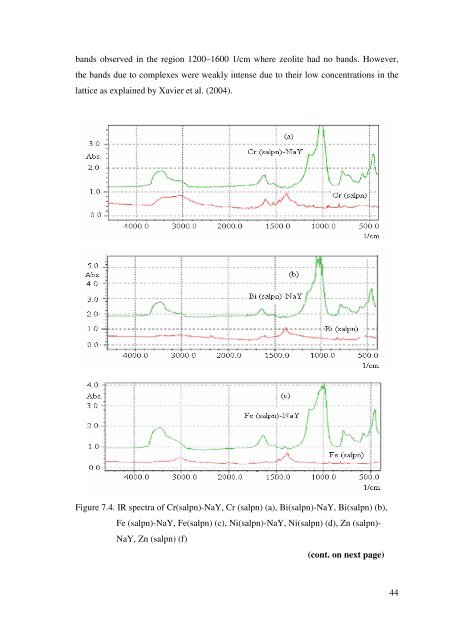
<strong>and</strong>s observed in <strong>the</strong> region 1200–1600 1/cm where zeolite had no b<strong>and</strong>s. However,<br />
<strong>the</strong> b<strong>and</strong>s due to complexes were weakly intense due to <strong>the</strong>ir low concentrations in <strong>the</strong><br />
lattice as explained by Xavier et al. (2004).<br />
Figure 7.4. IR spectra <strong>of</strong> Cr(salpn)-NaY, Cr (salpn) (a), Bi(salpn)-NaY, Bi(salpn) (b),<br />
Fe (salpn)-NaY, Fe(salpn) (c), Ni(salpn)-NaY, Ni(salpn) (d), Zn (salpn)-<br />
NaY, Zn (salpn) (f)<br />
(cont. on next page)<br />
44


