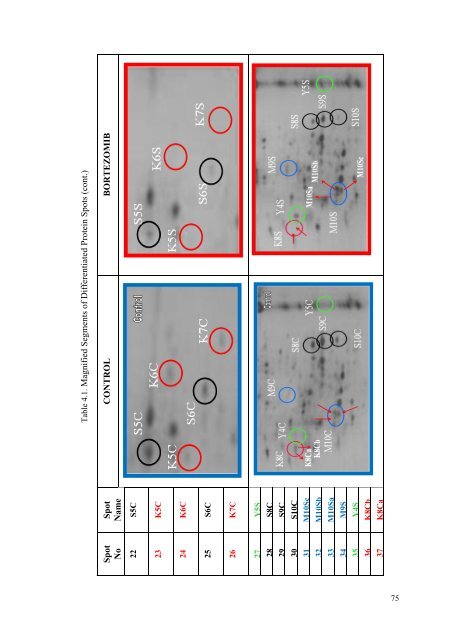
Table 4.1. Magnified Segments of Differentiated Prote<strong>in</strong> Spots (cont.) BORTEZOMIB CONTROL Spot Name Spot No S5C 22 K5C 23 K6C 24 S6C 25 K7C 26 Y5S S8C S9C S10C M10Sc M10Sb M10Sa M9S Y4S K8Cb K8Ca 27 28 29 30 31 32 33 34 35 36 37 75
After label<strong>in</strong>g, black and red colored spots were cut out from Control group while the others (green and blue ones) from Bortezomib <strong>applied</strong> group for enzymatic digestion by us<strong>in</strong>g tryps<strong>in</strong>. Then samples were analyzed by MALDI-TOF-TOF Mass Spectrometry and mass spectrometric data was compared to the prote<strong>in</strong> database for sequence matches. If the am<strong>in</strong>o acid sequence of a peptide could be identified, it would be used to f<strong>in</strong>d out the prote<strong>in</strong> from which it was derived. In addition to this, <strong>in</strong> order to identify an unknown prote<strong>in</strong> spot, it was necessary for a mass spectrometric analysis to match more than two peptide’s sequences. In our experiments, prote<strong>in</strong> spot determ<strong>in</strong>ation was carried out thanks to parameters such as isoelectric po<strong>in</strong>t, molecular mass, sequence coverage, and mascot mowse score, but the desired peptide matches were not observed. Although we cannot say that the results obta<strong>in</strong>ed mass spectrometric analysis are def<strong>in</strong>ite, they are the most probable results because of their parameters and functions. These results were shown <strong>in</strong> Table 4.2. Table 4.2 summarizes the 37 differentially expressed prote<strong>in</strong>s that were characterized. The prote<strong>in</strong>s were identified as follow: Sixteen prote<strong>in</strong>s were not identified due to some personal and <strong>in</strong>strumental errors dur<strong>in</strong>g the experiment. These were Spot 1, 13, 16, 17, 19, 20, 21, 24, 26, 28, 30, 31, 32, 33, 36 and 37, namely M1S, S4Cb, K3C, K4C, M6S, M7S, M8S, K6C, S8C, S10C, M10Sc, M10Sb, M10Sa, K8Cb and K8Ca, respectively. Spot 2, Caspase-3 is <strong>in</strong>volved <strong>in</strong> the activation cascade of caspases responsible for apoptosis execution. At the onset of apoptosis, it proteolytically cleaves poly (ADP- ribose) polymerase (PARP) at a '216-Asp-|-Gly-217' bond and activates sterol regulatory element b<strong>in</strong>d<strong>in</strong>g prote<strong>in</strong>s (SREBPs) between the basic helix-loop-helix leuc<strong>in</strong>e zipper doma<strong>in</strong> and the membrane attachment doma<strong>in</strong>. Additionally, it cleaves and activates caspase-6, -7 and -9. Caspase-3 found <strong>in</strong> many cell l<strong>in</strong>es, highest expression <strong>in</strong> cells of the immune system. Because of its function and role <strong>in</strong> apoptosis, after apply<strong>in</strong>g Bortezomib (17 nM) to MM U-266 cells, the <strong>in</strong>creas<strong>in</strong>g expression level of this prote<strong>in</strong> was expected results. Spot 3 were signed to uncharacterized prote<strong>in</strong> C7orf46. Although its function does not know exactly, it is thought that this prote<strong>in</strong> may be <strong>in</strong>volved <strong>in</strong> alternative splic<strong>in</strong>g. Spot 18, C-type lect<strong>in</strong> doma<strong>in</strong> family 5 member A has a function as a positive regulator of osteoclastogenesis. Thus, it was upregulated after the cells exposed to Bortezomib. 76
- Page 1 and 2:
CHANGES IN PROTEIN PROFILES IN BORT
- Page 3 and 4:
ACKNOWLEDGEMENTS First of all, with
- Page 5 and 6:
ÖZET BORTEZOMĠB UYGULANAN MULTĠP
- Page 7 and 8:
2.1.4.1.2. Two-Dimensional Gel Elec
- Page 9 and 10:
LIST OF FIGURES Figure Page Figure
- Page 11 and 12:
LIST OF TABLES Table Page Table 1.1
- Page 13 and 14:
When normal cells in the body begin
- Page 15 and 16:
Figure 1.2. Development of Cancer S
- Page 17 and 18:
the myeloma cells does not help fig
- Page 19 and 20:
A rare form of MM called Nonsecreto
- Page 21 and 22:
1.2.3. Risk Factors for MM A risk f
- Page 23 and 24:
of the mineralizations by adjusting
- Page 25 and 26:
To measure the levels of red cells,
- Page 27 and 28:
The levels of blood urea nitrogen (
- Page 29 and 30:
By using the system introduced by D
- Page 31 and 32:
1.2.7.2. Biology of The Proteasome
- Page 33 and 34:
Figure 1.10. Ubiquitin-Proteasome P
- Page 35 and 36: Figure 1.12. Effect of Bortezomib o
- Page 37 and 38: encompasses the investigation of pr
- Page 39 and 40: of modification. Ubiquitin is a sma
- Page 41 and 42: the given cells. On the other hand,
- Page 43 and 44: is-acrylamide (N,N'-methylene-bisac
- Page 45 and 46: 2.1.4.2. Detection of Protein Spots
- Page 47 and 48: ange of 600-2500 Da. This is the id
- Page 49 and 50: ions resolved by the mass analyzer
- Page 51 and 52: 2.1.4.5.2. Mass Analyzers Figure 2.
- Page 53 and 54: There is no doubt that different ma
- Page 55 and 56: mask low-quantity proteins that may
- Page 57 and 58: 3.1. Materials 3.1.1. Medias CHAPTE
- Page 59 and 60: 3.2.5. Cell Proliferation Assay Ant
- Page 61 and 62: After 72 hour incubation period at
- Page 63 and 64: eceptors of the Tumor Necrosis Fact
- Page 65 and 66: The preparation of stock BSA Standa
- Page 67 and 68: 3.2.6.3. Detection of the Loss of M
- Page 69 and 70: centrifugation, the supernatant was
- Page 71 and 72: selected symmetrically to load the
- Page 73 and 74: approximately 35 ml, the volume of
- Page 75 and 76: After electrophoresis was finished,
- Page 77 and 78: 7 Day Two: Reduction, Alkylation, a
- Page 79 and 80: CHAPTER 4 RESULTS AND DISCUSSION 4.
- Page 81 and 82: % Changes in Cytoplasmic/Mitochondr
- Page 83 and 84: Table 4.1. Magnified Segments of Di
- Page 85: Table 4.1. Magnified Segments of Di
- Page 89 and 90: 78 7 8 Y2S Y3S Table 4.2. Results o
- Page 91 and 92: 80 12 S4Ca Table 4.2. Results of Di
- Page 93 and 94: 82 27 Y5S Table 4.2. Results of Dif
- Page 95 and 96: Spot 4, Ubiquitin-conjugating enzym
- Page 97 and 98: is a transcriptional repressor, but
- Page 99 and 100: activity and loss of mitochondrial
- Page 101 and 102: distributed, but correlate with nat
- Page 103 and 104: DeMartino, G. N. and Slaughter, C.
- Page 105 and 106: proteomic analyses of a systematica
- Page 107 and 108: Mahindraa, A., Hideshimab, T. and A
- Page 109 and 110: Richardson, P. G., Hideshima, T. an
- Page 111 and 112: Terpos, E. 2008. Bortezomib Directl
- Page 113 and 114: A.1. RPMI-1640 Growth Medium APPEND
- Page 115 and 116: Table B.1. Chemicals and Reagents U
- Page 117 and 118: B.4.3. Standard Curve for BSA Table
- Page 119 and 120: Urea (8M) 4.8 g CHAPS (%2) 0.2 g DT
- Page 121 and 122: E. F. G. STOCK REAGENT PREPARATION