Belay Zeleke Dilnesa - Eawag-Empa Library
Belay Zeleke Dilnesa - Eawag-Empa Library
Belay Zeleke Dilnesa - Eawag-Empa Library

You also want an ePaper? Increase the reach of your titles
YUMPU automatically turns print PDFs into web optimized ePapers that Google loves.
Fe-containing hydrates and their fate during cement<br />
hydration: thermodynamic data and experimental<br />
study<br />
THÈSE N O 5262(2011)<br />
PRÉSENTÉE le 07 DECEMBRE 2011<br />
À LA FACULTE SCIENCES ET TECHNIQUES DE L'INGÉNIEUR<br />
LABORATOIRE DES MATÉRIAUX DE CONSTRUCTION<br />
PROGRAMME DOCTORAL EN STRUCTURES<br />
ÉCOLE POLYTECHNIQUE FÉDÉRALE DE LAUSANNE<br />
POUR L'OBTENTION DU GRADE DE DOCTEUR ÈS SCIENCES<br />
PAR<br />
<strong>Belay</strong> <strong>Zeleke</strong> <strong>Dilnesa</strong><br />
acceptée sur proposition du jury:<br />
Prof. Nava Setter, président du jury<br />
Prof. Karen Scrivener, Dr. Barbara Lothenbach, directeur de thèse<br />
Dr. Guillaume Renaudin, rapporteur<br />
Dr. Thomas Matschei, rapporteur<br />
Dr. Paul Bowen, rapporteur<br />
Proposée en decembre, 2011
ABSTRACT<br />
Thermodynamic modeling is a versatile tool for predicting the chemical composition<br />
cement during the hydration of cement. The quality of the thermodynamic modeling<br />
depends directly on the quality and completeness of thermodynamic database used. One<br />
of the main limitations of modeling the hydration of cement is the lack of thermodynamic<br />
data for Fe containing hydrates. In addition, the formation of solid solutions between Fe-<br />
and Al-containing hydrates could stabilize mixed solids. However, it is unclear to what<br />
extent such solid solution formation occurs. Also experimentally it is very difficult to<br />
identify Fe-containing hydrates in hydrating cements by standard analytical techniques as<br />
the signals from Fe-containing phases significantly overlap with those from the<br />
corresponding Al-containing phases.<br />
Thus, in this study, potential Fe-containing hydrates like Fe-hemicarbonate (Fe-Hc), Fe-<br />
monocarbonate (Fe-Mc), Fe-monosulphate (Fe-Ms), Fe-Friedel’s salt (Fe-Fr), Fe-<br />
strätlingite (Fe-St), Fe-katoite (C3FH6) and Fe-siliceous hydrogarnet (Fe-Si-Hg) were<br />
synthesised at 20, 50 and 80 °C. The solid phases were characterized by X-ray powder<br />
diffraction (XRD), Thermogravimetric analysis (TGA), scanning electron microscopy<br />
(SEM), vibrational spectroscopy (Raman and Infrared spectroscopy) and Extended X-ray<br />
absorption fine structure spectroscopy (EXAFS). The compositions of the liquid phases<br />
were analyzed using inductively-coupled plasma optical emission spectrometry and mass<br />
spectrometry (ICP-OES and MS). At ambient temperature Fe-Mc, Fe-Ms, Fe-Fr and Fe-<br />
Si-Hg were stable, while Fe-Hc, Fe-katoite and Fe-St were metastable. Fe-Mc, Fe-Ms,<br />
Fe-Fr and Fe-Si-Hg were stable also at 50°, but the Fe-AFm phases were unstable at 80<br />
°C while Fe-Si-Hg were stable up to above 100 °C.<br />
i
The measured composition of the liquid phase was used to calculate the solubility<br />
products at 20 and 50 °C and to derive the data for standard conditions (25 °C, 1 atm).<br />
The solubility products of Fe-Fr was similar to the solubility product of Al-Fr, while the<br />
solubility products of Fe-Mc and Fe-Ms were about 3 log unit lower than that of Al-Mc<br />
and Al-Ms indicating that in Fe-Friedel’s salt is probably not stable in cements. The very<br />
low solubility product of Fe-Si-Hg (5 to 7 log units lower than that of Al-Si-Hg) implies<br />
that Fe-Si-Hg could be a stable phase in hydrated cements.<br />
Also the mixed Al- and Fe-containing hydrates were synthesized to study the extent of<br />
solid solution formation. Both XRD and thermodynamic modelling of the liquid<br />
compositions indicated that Al- and Fe-monosulphate and Al- and Fe-Friedel’s formed<br />
solid solutions with a miscibility gap, while Al- and Fe- monocarbonate existed as two<br />
separate hydrates due to their different crystal structure (Al-Mc: monoclinic, Fe-Mc:<br />
rhombohedral). The formation of solid solution between Al and Fe-siliceous hydrogarnet<br />
seemed probable.<br />
To understand to what extent the findings from the synthesised hydrates were relevant for<br />
real cements, the speciation of iron was determined in hydrating cement using EXAFS<br />
spectroscopy. Identification of Fe-containing hydrates and quantification of their<br />
contributions was achieved by combining principal component analysis with iterative<br />
target tests, and linear combination. The results show that several Fe species already<br />
contributed to the overall Fe K-edge spectra of cement pastes during the first day of<br />
hydration. While ferrite was the dominant Fe-containing phase in the unhydrated cement,<br />
Fe-hydroxide was detected shortly after starting the hydration process. With time the<br />
formation of stable Al/Fe-siliceous hydrogarnet was observed, while the amounts of Fe-<br />
hydroxide and ferrite clinker slowly decreased. The latter finding agrees with results from<br />
ii
thermodynamic modeling of the hydration process, which predicts formation of stable<br />
Al/Fe-siliceous hydrogarnet in cement system.<br />
The determination of the solubility products of these hydrates will help to extend the<br />
thermodynamic data base of cement minerals and establish whether and to which extent<br />
Fe-containing hydrates are stable in fresh and in leached cementitious systems. The<br />
results from this study on the Fe speciation in cementitious systems are important for a<br />
better understanding of cement-water interactions with a view to the durability of<br />
cementitious materials.<br />
Keywords: Fe-containing hydrates; solubility product; solid solution; crystal structure;<br />
thermodynamic modeling; thermodynamic data<br />
iii
ZUSAMMENFASSUNG<br />
Thermodynamische Modellierung ermöglicht die Mineral-Zusammensetzung von Zement<br />
während der Hydratisierung zu berechnen. Die Qualität der Modellierung hängt dabei<br />
stark von der Qualität und der Vollständigkeit der verwendeten thermodynamischen<br />
Datenbanken ab. Eine wesentliche Einschränkung bei der Modellierung der<br />
Hydratisierung von Zement ist das Fehlen von thermodynamischen Daten für die<br />
eisenhaltigen Zementhydrate. Zudem könnte die Bildung von festen Lösungen (solid<br />
solution) von Fe- und Al-haltigen Hydraten gemischte Festphasen stabilisieren. Zurzeit<br />
ist allerdings nicht bekannt, ob und in welchem Ausmass diese festen Lösungen<br />
entstehen. Die Identifikation der eisenhaltigen Hydrate in Zementstein mittels<br />
Standardtechniken ist sehr schwierig, weil die charakteristischen Signale der Fe-haltigen<br />
Phasen oft stark mit denjenigen der Al-haltigen Phasen überlappen.<br />
In dieser Studie wurden potentiell Fe-haltige Hydrate, wie Fe-Hemikarbonat (Fe-Hc), Fe-<br />
Monokarbonat (Fe-Mc), Fe-Monosulfat (Fe-Ms), Fe-Friedel’s Salz (Fe-Fr), Fe-Strätlingit<br />
(Fe-St), Fe-katoite (C3FH6) und Fe-Si-Hydrogranat (Fe-Si-Hg), bei 20, 50 und 80 C<br />
synthetisert. Die Festphasen wurden mittels Röntgenpulverdiffraktometrie (XRD),<br />
Thermo-gravimetrie (TGA), Raserelektronenmikroskopie (SEM), Raman und Infrarot-<br />
Spektroskopie, und synchrotron-basierter Röntgenabsorptionsspektroskopie (EXAFS)<br />
charakterisiert. Die Zusammensetzung der Flüssigphase wurde mittels induktiv<br />
gekoppelter Emissions-spektroskopie mit optischer oder massenspektrometrischer<br />
Detektion (ICP-OES oder MS) bestimmt. Die Untersuchungen zeigen, dass bei<br />
Raumtemperatur Fe-Mc, Fe-Ms, Fe-Fr und Fe-Si-Hg stabil sind während Fe-Hc, Fe-<br />
katoite und Fe-St metastabil sind. Fe-Mc, Fe-Ms, Fe-Fr und Fe-Si-Hg sind auch bei 50° C<br />
iv
stabil. Die Fe-AFm Phasen sind nicht stabil bei 80° C während Fe-Si-Hg bis 100° C<br />
stabil ist.<br />
Die gemessenen Lösungszusammensetzungen wurden verwendet um die Löslichkeits-<br />
produkte der Festphasen bei 20° C und 50° C und die thermodynamischen Parameter<br />
unter Standardbedingungn (25° C, 1 atm) zu berechnen. Das Löslichkeitsprodukt von Fe-<br />
Fr ist vergleichbar mit demjenigen der entsprechenden Al Phase (Al-Fr) während die<br />
Löslichkeits-produkte von Fe-Mc und Fe-Ms etwa 3 Grössenordnungen tiefer liegen als<br />
diejenigen von Al-Mc und Al-Ms. Dies deutet darauf hin, dass Fe-Friedel’s Salz in<br />
hydratisiertem Zement wahrscheinlich nicht stabil ist während Fe-haltige AFm Phasen<br />
sich bilden könnten. Das sehr tiefe Löslickeitsprodukt von Fe-Si-Hg (5-7 logarithmische<br />
Einheiten tiefer als dasjenige von Al-Si-Hg) impliziert, dass Fe-Si-Hg in hydratisiertem<br />
Zement eine stabile Phase ist.<br />
Im Weiteren wurden gemischte Al- und Fe-haltigen Hydrate synthetisiert um die<br />
Möglichkeit der Bildung von festen Lösungen (solid solution) zu untersuchen. Sowohl<br />
XRD Messungen an den Festphasen wie auch die thermodynamische Modellierung der<br />
Lösungszusam-mensetzung zeigen, dass Al-/Fe-Monsulfat wie auch Al-/Fe-Friedel’s Salz<br />
feste Lösungen mit und ohne Mischungslücke bilden während die Al-/Fe-Monokarbonate<br />
aufgrund der unterschiedlichen Kristallstrukturen (Al-Mc: monoklinisch, Fe-Mc:<br />
rhomboedrisch) als zwei separate Hydrate existieren. Möglicherweise findet auch die<br />
Bildung einer festen Lösung bei Al-/Fe-Si-Hydrogranat statt.<br />
Die Speziation von Fe wurde mittels EXAFS Spektroskopie in hydratisiertem Zement<br />
bestimmt um festzustellen, ob die Resultate aus den Untersuchungen mit Einzelphasen<br />
auch auf reale Zementsysteme übertragen werden können. Durch Faktoranalyse<br />
(principal component analysis, iterative target transformation) und Linearkombination<br />
v
konnten die Fe-haltigen Hydrate im Zementstein identifiziert und deren Anteile<br />
quantifiziert werden. Die Resultate zeigen, dass bereits nach einem Tag Hydratisierung<br />
des Zements mehrere Fe Spezies zum EXAFS Spektrum von Zementstein, das an der Fe<br />
K-Kante bestimmt wurde, beitragen. Während Ferrit die dominierende Fe Spezies im<br />
unhydratisierten Zement ist, erfolgte bereits kurz nach Beginn des<br />
Hydratisierungsprozesses die Bildung von Fe-Hydroxid. Mit der Zeit wurde die Bildung<br />
von stabilem Al/Fe-Si-Hydrogranat beobachtet, während die Anteile von Ferrit und Fe-<br />
Hydroxid langsam abnahmen. Diese Beobachtungen stehen im Einklang mit der<br />
thermodynamischen Modellierung, welche die Bildung von stabilem Al/Fe-Si-<br />
Hydrogranat in Zementstein voraussagt.<br />
Die Bestimmung der Löslichkeitsprodukte der einzelnen Hydratphasen ermöglicht es die<br />
bestehende, thermodynamische Datenbasis für Zementmineralien zu erweitern und eine<br />
quantitative Beurteilung, ob und in welchem Ausmass Fe-haltige Hydrate in frischen und<br />
gealterten Zementsystemen stabil sind, vorzunehmen. Die Resultate aus dieser Studie zur<br />
Speziation von Fe in Zement sind für ein besseres Verständnis der Wechselwirkung von<br />
Wasser und Zement wichtig und damit für die Beurteilung der Dauerhaftigkeit von<br />
zementartigen Materialien von grosser Bedeutung.<br />
Stichworte: Eisenhaltige Hydratphasen, Löslichkeitsprodukt, Feste Lösungen,<br />
Krystallstruktur; thermodynamische Modellierung; thermodynamische Daten<br />
vi
ACKNOWLEDGEMENT<br />
First I would like to thank Swiss National Foundation (SNF) for financial assistance<br />
during my study. I owe my deepest gratitude to my thesis supervisor and director Dr.<br />
Barbara Lothenbach, EMPA for excellent supervision. The thesis would not have been<br />
possible without the assistance and guidance of her. I will never find words to thank her<br />
for sharing her time. All you have done for me as a supervisor and as a friend are<br />
unforgettable.<br />
I would like to express my sincere acknowledgement to my thesis director Prof. Karen<br />
Scrivener for all the supervision, supports and valuable discussion throughout my thesis.<br />
It has been a great pleasure to be a member of her team and work together with her.<br />
It is with immense gratitude that I acknowledge my co-supervisor Dr. Erich Wieland, PSI<br />
Switzerland for teaching and guiding me during my study in particular on EXAFS<br />
techniques. He has made available his support all the time.<br />
It gives me great pleasure in acknowledging the support and help of Dr. Guillaume<br />
Renaudin and Dr. Adel Mesbah for synchrotron X-ray diffraction and Raman<br />
measurements and data analysis. I would like to thank many people who have helped me<br />
through the completion of this dissertation: Dr. Rainer Daehn for his assistance on XAS,<br />
Dr. Adrian Wichser for ICP measurement, Dr. Gwenn La Saout for Rietveld refinement,<br />
Dr. Mohsen Ben haha and Florian Deschner for assisting me on the SEM measurement,<br />
Dr. Frank Winnefeld for all the valuable discussions. Dr.Göril Möschner preparation for<br />
old samples and Dr. Konstantin Rozov for Fe-hydrotalcite sample.<br />
vii
I owe to thank all the laboratory technicians at EMPA particularly Luigi Brunetti, Boris<br />
Ingold and Angela Steffen for helping me in the laboratory. I would like to thank all my<br />
members of lab 135. who have given me love and respect thought my study. All the good<br />
times with friends (Wolfi, Walti, Lucy, Flo, Laura) are memorable.<br />
Many thanks to Trindler family for their care during my stay in Switzerland. My<br />
gratitude goes to my Ethiopian friends living in Switzerland who has given me their<br />
encouragement, care and affection during my study.<br />
Most especially I am grateful to my family particularly my mother Tiruwork and my<br />
father <strong>Zeleke</strong> for giving me all their cares and love throughout my life. Their support and<br />
inspiration as a parent from my childhood up to now is immense. This is for you.<br />
Last but not least this work is not possible without the support, love, care of my wife<br />
Fasika. Thanks to the almighty God for all you have done for me.<br />
viii
LIST OF TABLES<br />
Table 1 Oxide and the phase composition of the cements used. ...................................... 17<br />
Table 2 The compositions of the synthetic Fe-cement mixes with varying gypsum<br />
(CsH2) and calcite (Cc) content. ............................................................................... 18<br />
Table 3 Reference reactions used to estimate unknown heat capacities of cement<br />
minerals. .................................................................................................................... 25<br />
Table 4 Dissolution reaction used for thermodynamic calculation. ................................. 29<br />
Table 5 Thermodynamic data at standard conditions (298 K, 1 atm) used for the<br />
calculation of the liquid phase compositions and for computation of<br />
thermodynamic parameters for the synthesized solids. ............................................ 30<br />
Table 6 Multi pattern refinement (from two sample-to-detector distances: 1/ 150 mm,<br />
and 2/ 350 mm) and crystal data of Fe-Mc. .............................................................. 43<br />
Table 7 Fractional coordinate of non hydrogen atoms and isotropic displacement. ........ 45<br />
Table 8 Selected interatomic distances (Å) in Fe-Mc. ...................................................... 45<br />
Table 9 EXAFS structural parameters of Fe-Mc equilibrated for three years. ................. 48<br />
Table 10 IR vibrations of Ca4[(AlxFe1-x)2(OH)12] . CO3 . nH2O. .......................................... 53<br />
Table 11 Measured ion concentrations and calculated solubility products at different<br />
equilibration times. ................................................................................................... 57<br />
Table 12 Compositions of Al/Fe-monocarbonate after synthesis at 20 °C equilibrated<br />
for 3 years at supersaturated and undersaturated condition. ..................................... 58<br />
Table 13 Thermodynamic parameters of carbonate containing AFm phases at<br />
standard conditions (25°C, 1 atm). ........................................................................... 61<br />
Table 14 Quantitative phases analyses from Rietveld refinement. ................................... 71<br />
Table 15 Refined structural parameters of Fe-monosulfate (standard deviation in<br />
parentheses). .............................................................................................................. 71<br />
Table 16 Refined interatomic distances in Fe-monosulfate (standard deviation is<br />
given in parentheses). ................................................................................................ 74<br />
Table 17 Measured ion concentrations and calculated solubility products at different<br />
equilibration times. ................................................................................................... 81<br />
Table 18 Thermodynamic parameters of Fe-monosulfate at standard conditions<br />
(25°C, 1 atm). ............................................................................................................ 83<br />
i
Table 19 Compositions of Al/Fe-monosulfate after synthesis at 20°C equilibrated for<br />
680 days in supersaturated condition. ....................................................................... 85<br />
Table 20 Solubility products of all the solids formed during the synthesis of Al/Femonosulfate<br />
solid solution series at 20 °C equilibrated for 680 days under<br />
supersaturated condition. .......................................................................................... 87<br />
Table 21 Refined structural parameters of 3CaO.Fe2O3.CaCl2.10H2O (standard<br />
deviation is given in parentheses). ............................................................................ 97<br />
Table 22 Measured ion concentrations and calculated solubility products at 20 °C and<br />
sampled after different equilibration times synthesized from FeCl3.6H2O and<br />
CaO in 0.1M K OH. ................................................................................................ 102<br />
Table 23 Measured ion concentrations and calculated solubility products at 20 and<br />
50°C and sampled after different equilibration times synthesized from C2F,<br />
CaCl2.2H2O and CaO in distilled water and in 0.1 M KOH. .................................. 102<br />
Table 24 Thermodynamic parameters of Friedel’s salt at standard conditions (25 °C, 1<br />
atm). ........................................................................................................................ 104<br />
Table 25 Compositions of Al/Fe-Friedel’s salt synthesized at 20°C and equilibrated<br />
for 270 days under supersaturated condition. ......................................................... 105<br />
Table 26 Measured ion concentrations at different equilibration times in 0.1 M KOH . 114<br />
Table 27 Thermodynamic parameters at standard conditions determined in this study<br />
(25°C, 1 atm). .......................................................................................................... 116<br />
Table 28 Measured concentration of mixed C3AH6-C3FH6 systems equilibrated for<br />
three years ............................................................................................................... 121<br />
Table 29 Measured ion concentrations in the solution of solids synthesized at 110°C<br />
and re dissolved and equilibrated for 4 months at 20 °C and 50 °C. ...................... 126<br />
Table 30 Refined structure parameters of Fe siliceous hydrogarnet (standards<br />
deviation are indicated in parentheses). .................................................................. 133<br />
Table 31 Measured ion concentrations of solids synthesized at 110 °C (re dissolved<br />
and equilibrated for 4 months at 20 °C and 50 °C) and at 20 °C(equilibrated for 3<br />
years under oversaturated condition). ..................................................................... 134<br />
Table 32 Measured ion concentration of Ca3(AlxFe1-x)2(SiO4)(OH)8 equilibrated for<br />
four months from dissolution (undersaturation) experiment. ................................. 140<br />
Table 33 Summary of the results obtained in chapter 3 and comparison with their Alanalogues.<br />
................................................................................................................ 146<br />
Table 34 Relative weights of Fe-containing phases in hydrated OPC at 20 °C and 50<br />
°C obtained from LC fitting. ................................................................................... 165<br />
ii
Table 35 Relative weights of Fe-containing phases in HS hydrated at 20 °C and 50 °C<br />
obtained from LC fitting. ........................................................................................ 166<br />
iii
LIST OF FIGURES<br />
Fig. 1 Calculated volume changes during the hydration of OPC. ...................................... 5<br />
Fig. 2 Calculated (lines) and measured (dots) composition of the liquid phase of<br />
ordinary Portland cement during hydration [6]. ......................................................... 5<br />
Fig. 3 A sample of edges and the corresponding electronic transitions [25]. ..................... 8<br />
Fig. 4 Sample XAS Spectrum of FeO with XANES and EXAFS region [26]. .................. 9<br />
Fig. 5 Time-dependent XRD pattern of Fe-Hc (and Fe-Mc) synthesized at 20 °C; C2F:<br />
2CaOFe2O3, Fe-Mc: Fe-monocarbonate, Fe-Hc: Fe-hemicarbonate. ...................... 38<br />
Fig. 6 TGA and DTG curves of Fe-Hc formation at 20 °C for different equilibration<br />
times. CH: Portlandite, C: carbonates. ...................................................................... 38<br />
Fig. 7 Time-dependent XRD pattern of Fe-Mc formed at 20 °C. * unidentified ............. 40<br />
Fig. 8. TGA and DTG curves of Fe-Mc formation at 20 °C for different equilibration<br />
times. CH: Portlandite, C: carbonates. ...................................................................... 41<br />
Fig. 9 Comparison of XRD pattern of Fe-Mc equilibrated for one year at 20, 50 and<br />
80 °C. CH: portlandite, C: carbonate, Fe2O3: hematite. ............................................ 42<br />
Fig. 10 Rietveld plot from powder pattern recorded with a sample-to-detector distance<br />
of 150 mm (red crosses are experimental data, black line is calculated pattern,<br />
blue line is the difference pattern, green sticks are Bragg peaks positions for Fe-<br />
Mc and calcite). ......................................................................................................... 44<br />
Fig. 11a. Projection of the Fe-Mc structure along b axis (the interlayer part of the<br />
structure is ordered for clarity; i.e. the statistical distribution between one<br />
carbonate and two water molecule has been alternatively ordered). b. 3D<br />
cohesion in Fe-Mc structure (representation of the main hydrogen bonds). ............ 46<br />
Fig. 12. Fe K-edge EXAFS data of Fe-Mc: Experimental (solid line) and theoretical<br />
(dots) Fourier transform (modulus) obtained from k 3 -weighted, normalized,<br />
background-subtracted spectrum (inset). .................................................................. 47<br />
Fig. 13 a) Raman spectra on Fe-Mc in the frequencies range 200 cm -1 – 1800 cm -1 b)<br />
Raman spectra on Fe-Mc in the frequencies range 2800 cm -1 – 4000 cm -1 . ............. 49<br />
Fig. 14 SEM micrographs of Fe-Mc. ................................................................................ 50<br />
Fig. 15 Thermal analysis (DTG and TGA) of Ca3(AlxFe1-x)2O3.CaCO3.nH2O. ............... 51<br />
Fig. 16 IR spectra of Al-Mc and Fe-Mc. .......................................................................... 52<br />
iv
Fig. 17 XRD pattern of the Al/Fe-Mc after 3 years hydration time at 20 °C * peak due<br />
to additional water in Mc. ......................................................................................... 54<br />
Fig. 18 Layer thickness for Al-Mc and Fe-Mc after refinement by Le Bail fitting and<br />
Rietveld analysis. C4FcH12: Fe-Mc, C4AcH11: Al-Mc. ............................................. 55<br />
Fig. 19 Values of a-parameters for Al-Mc and Fe-Mc. .................................................... 55<br />
Fig. 20. Calculated solubility products of Fe-Mc and Fe-Hc from the solubility<br />
experiments. Squares: experimental solubility product of Fe-Hc, Triangles:<br />
experimental solubility product of Fe-Mc. ............................................................... 60<br />
Fig. 21 Measured (symbols) and calculated (lines) concentrations in the liquid phases<br />
of the synthesized monocarbonate at different Al/Al+Fe ratios. .............................. 62<br />
Fig. 22 Changes in the total volume of phases of a hydrated model mixture consisting<br />
of Al2O3, Fe2O3 and a fixed SO3/(Al,Fe)2O3 ratio of 1 as a function of the calcite<br />
content (CO2/(Al,Fe)2O3 ratio) at 20 °C at constant amount of solids: (Al2O3 +<br />
Fe2O3 + CaSO4 + CaO + CaCO3). ............................................................................ 63<br />
Fig. 23 XRD pattern of C4FsH12 formed at 20 °C after different equilibration times. ..... 68<br />
Fig. 24 TGA and DTG curves of C4FsH12 formation at 20°C after different<br />
equilibration times. ................................................................................................... 69<br />
Fig. 25 XRD pattern of C4FsH12 equilibrated for 360 days at 20, 50 and 80 °C. ............. 70<br />
Fig. 26. Rietveld plot for Fe-monosulfate samples (synthesized at 20 °C: top, and at<br />
50 °C: bottom) with = 1.5418Å. ............................................................................ 72<br />
Fig. 27 Details of the Rietveld plot from the sample Fe-Ms-50 °C. ................................. 73<br />
Fig. 28 Spectral range 100 cm -1 – 1500 cm -1 of Raman spectra from sample Fe-Ms-20<br />
°C (comparison with Al-monosulfate spectra [79]). ................................................. 75<br />
Fig. 29 Spectral range 2800 cm -1 – 4000 cm -1 of Raman spectra from sample Fe-Ms-<br />
50 °C (comparison with Al-monosulfate spectra [79]). ............................................ 76<br />
Fig. 30 Thermal analysis (TGA and DTG) of Al and Fe-monosulfate after 680 days. .... 77<br />
Fig. 31 XRD pattern of the C4AsH12-C4FsH12 series after 680 days equilibration at<br />
20 °C. Al-monosulfate (2θ = 19.89°), Fe-monosulfate (2θ = 19.99°) and *Alettringite.<br />
# Al-monocarbonate (2θ = 23.50°). .......................................................... 78<br />
Fig. 32 Layer thickness observed for the C4(A,F)sH12 solid solution in this study and<br />
reported in literature [12, 87, 88]. ............................................................................. 79<br />
Fig. 33 Values of a-parameters for the C4(A,F)sH12 solid solution series determined in<br />
this study and reported in literature [12, 87, 88]. ...................................................... 79<br />
v
Fig. 34 Calculated solubility products of Fe-monosulfate from the solubility<br />
experiments. symbols: experimental data. ................................................................ 84<br />
Fig. 35 Lippmann diagram illustrating the total solubility products of Al/Femonosulfate<br />
solid solution series: total experimentally determined solubility<br />
product (symbols), modeled total solubility products assuming ideal solid<br />
solution (dashed lines), modeled total solubility products assuming a non-ideal<br />
solid solution with a miscibility gap (a0= 1.26 and a1= 1.57) (solid lines) and<br />
solubility products assuming no solid solution (dotted lines). X-axis: Al/(Al +<br />
Fe) ratios in the solid and Al/(Al + Fe) ratios in the liquid. ...................................... 89<br />
Fig. 36 Measured (points) and calculated (lines) concentrations in the liquid phases of<br />
the synthesized monosulfate with different Al/(Al+Fe) mole ratio, assuming a<br />
continuous solid solution with a miscibility gap. ...................................................... 90<br />
Fig. 37 XRD pattern of 3CaO . Fe2O3 . CaCl2 . 10H2O (Fe-Fr) synthesized at 20 °C and<br />
sampled after different equilibration times from FeCl3.6H2O and CaO in 0.1 M<br />
KOH. ......................................................................................................................... 93<br />
Fig. 38 Comparison of the XRD patterns of Fe-Friedel’s salts equilibrated for three<br />
years at different pH values: synthesized a). FeCl3.6H2O and CaO in 0.1M KOH<br />
(pH = 11.94), b). C2F, CaCl2.2H2O and CaO in distilled water (pH = 12.39) and<br />
c). C2F, CaCl2.2H2O, and CaO in 0.1 M KOH (pH = 12.84), CH-portlandite. ........ 94<br />
Fig. 39 TGA-DTG curves of Fe-Friedel’s salt synthesized at 20 °C and sampled after<br />
different equilibration times from FeCl3.6H2O and CaO in 0.1M KOH. ................. 95<br />
Fig. 40 Rietveld plot for Fe-Friedel’s salt recorded at = 0.697751 Å and at a<br />
sample-to-detector distance of 150 mm. ................................................................... 96<br />
Fig. 41 Thermal analysis (TGA and DTG) of Al and Fe-Friedel’s salt synthesized<br />
from FeCl3.6H2O and CaO in 0.1 M KOH and equilibrated for 270 days. .............. 98<br />
Fig. 42 Raman spectra recorded for Fe-Friedel’s salt crystal. .......................................... 99<br />
Fig. 43 Values of a-parameters for the Al/Fe-Friedel’ salt solid solution determined in<br />
this study compared to the findings by Kuzel et al. [88], Goetz Neunhoeffer et al.<br />
[100], Rapin et al. [99] and Rousselot et al. [96]. ................................................... 100<br />
Fig. 44 Experimental determined solubility products of Fe-Friedel’s salt as a function<br />
of pH. ...................................................................................................................... 103<br />
Fig. 45 Calculated solubility products of Fe-Friedel’s salt from the solubility<br />
experiments compared with the solubility product Al-Friedel’s salt calculated<br />
from measured concentrations reported in literature [54, 94, 101-103]. ................ 104<br />
Fig. 46 Measured (points) and calculated (lines) concentrations in the liquid phases of<br />
the synthesized Friedel’s salt at different Al/(Al+ Fe) ratio, assuming ideal solid<br />
solution. ................................................................................................................... 106<br />
vi
Fig. 47 Nomenclature of minerals of the hydrogarnet group. ......................................... 110<br />
Fig. 48 Time-dependent XRD pattern of C3AH6 synthesized at 20 °C, * C4AcH11. ...... 112<br />
Fig. 49 Thermal analysis (TGA and DTG) of C3AH6 and C3FH6 synthesized at 20 °C<br />
and sampled after different equilibration times. ..................................................... 113<br />
Fig. 50 Solubility products of C3AH6 calculated from the solubility experiments<br />
carried out in this study and from different published data [7, 111, 112, 114-<br />
116]. ........................................................................................................................ 115<br />
Fig. 51 Time-dependent XRD pattern of C3FH6 synthesized at 20 °C and the sample<br />
synthesized at 110 °C and equilibrated for 5 days. ................................................. 118<br />
Fig. 52 XRD pattern of mixed Al and Fe hydrogarnets after 3 years equilibration. ...... 120<br />
Fig. 53 Calculated solids in the CaO-Al2O3-Fe2O3-H2O system in 0.1 M KOH using<br />
the solubility products as given in Table 28. .......................................................... 122<br />
Fig. 54 The XRD pattern of Al containing Si-hydrogarnet synthesized at 20 °C and<br />
110 °C. * Al-Si-hydrogarnet with two different compositions (see inlet); o<br />
C3AH6; - KNO3 present as impurity; +CaF2 added as an internal standard. ........... 123<br />
Fig. 55 Thermal analysis (TGA and DTG) of Al-and Fe-Si hydrogarnet synthesized at<br />
20 °C and 110 °C. The circle region indicates the water loss of hydrogarnets<br />
with different compositions. ................................................................................... 124<br />
Fig. 56 Estimation of the silica content for synthesized Al-containing hydrogarnet;<br />
PDF: Powder Diffraction File. ICSD: Inorganic Crystal Structure Database. The<br />
composition of the synthesized solid solution series was estimated from the unit<br />
cell size as indicated by the line. ............................................................................. 125<br />
Fig. 57 Comparison of published solubility products of Al-Si-hydrogarnet calculated<br />
in this study from the data reported in [7, 110, 112, 117], C3AH6 (dashed line),<br />
C3AS0.41H5.18 (solid line), C3AS0.84H4.32 (dotted line).............................................. 128<br />
Fig. 58 Solubility products as a function of Si content between C3AH6 and C3AS3 end<br />
members at 25 °C. ................................................................................................... 129<br />
Fig. 59 Time-dependent XRD pattern of C3FSH4 synthesized at 20 °C from C2F, * the<br />
solid synthesized at 110 °C. R: rutile. ..................................................................... 130<br />
Fig. 60 Rietveld plot for Fe-Si-Hydrogarnet sample with = 0.697751Å and a<br />
sample-to-detector distance of 150 mm (top) and 400 mm (bottom). .................... 132<br />
Fig. 61 Zoom of the Rietveld plot from pattern recorded for a sample-to-detector<br />
distance of 400 mm showing the two hydrogarnet phases (systematic shoulders,<br />
right side, for hydrogarnet diffraction peaks). ........................................................ 133<br />
vii
Fig. 62 Calculated solubility products of Fe-Si-hydrogarnets from the solubility<br />
experiments. (lines show calculated values, full symbols show the measured<br />
values from undersaturation and empty symbols from oversaturation). ................. 135<br />
Fig. 63 XRD pattern of the solid solution series of Ca3Fe2(SiO4)3-y(OH)4y, + CH. The<br />
dotted lines indicate the peak shifts. *Main reflections of the hydroandradite end<br />
members. Note that Xsi = y = 3 ............................................................................... 136<br />
Fig. 64 Solubility products as a function of Si content in between C3FH6 and C3FS3<br />
end members at 25 °C. The dotted line connects the solubility products of C3FH6<br />
and C3FS3. ............................................................................................................... 138<br />
Fig. 65 XRD pattern of the solid solution series of Ca3(AlxFe1-x)2(SiO4)(OH)8<br />
synthesized at 110 °C. ............................................................................................. 139<br />
Fig. 66 Lippmann diagram illustrating the total solubility products of Al/Fe-siliceous<br />
hydrogarnet solid solution series Ca3(AlxFe1-x)2(SiO4)0.9(OH)8.4 at a) 20 °C b) 50<br />
°C: .experimentally determined total solubility products (filled symbols),<br />
modeled total solubility products assuming ideal solid solution (dashed lines). In<br />
addition also the solubility product of C3AS0.84H4.32 and C3FS0.95H4.1 derived<br />
from the experimental data (empty symbols) and the solubility products<br />
assuming no solid solution (dotted lines) are given. X-axis: Al/(Al + Fe) ratio in<br />
the solid or liquid phases, respectively. .................................................................. 143<br />
Fig. 67 XRD patterns of OPC (+) and HS (*) cements hydrated at 20 °C. .................... 149<br />
Fig. 68 TGA-DTG curves of OPC (+) and HS (*) cements hydrated at 20 °C. ............. 150<br />
Fig. 69 XRD patterns of OPC (+) and HS (*) cement hydrated for 1 year at 50 °C:<br />
The XRD peak at 2θ ~ 11.30 is between the monosulfate and monocarbonate<br />
peaks. ...................................................................................................................... 151<br />
Fig. 70 TGA-DTG curves of OPC (+) and HS (*) cement hydrated for 1 year at 50 °C 152<br />
Fig. 71 XRD patterns of OPC (+) and HS (*) hydrated at 20 °C after selective<br />
dissolution using SAM. Note that the samples suffered from carbonation during<br />
SAM extraction. ...................................................................................................... 153<br />
Fig. 72 TGA-DTG curves of OPC (+) and HS (*) hydrated at 20 °C after selective<br />
dissolution with SAM. ............................................................................................ 154<br />
Fig. 73 XRD patterns of OPC (+) and HS (*) hydrated at 50 °C for 150 days after<br />
selective dissolution with SAM. ............................................................................. 154<br />
Fig. 74 SEM/EDX of hydrated OPC for 2 years at (a) 20 °C and (b) 50 °C after<br />
selective dissolution with SAM. ............................................................................. 156<br />
Fig. 75 Atomic ratio of hydrated OPC for 2 years at (a) 20 °C and (b) 50 °C after<br />
selective dissolution with SAM. ............................................................................. 157<br />
viii
Fig. 76 Fe K-edge XANES spectra of Fe-containing hydrates. The broken lines<br />
indicate the position of related spectral features. .................................................... 159<br />
Fig. 77 k 3 -weigthed experimental bulk-EXAFS spectra of Fe-containing phases used<br />
as reference compounds. The broken lines indicate the position of related<br />
spectral features. ..................................................................................................... 160<br />
Fig. 78 EXAFS spectra of hydrated OPC at 20 °C and at different ages (line:<br />
experimental data; dots: modelled data). The broken lines outline selected<br />
spectral features. ..................................................................................................... 161<br />
Fig. 79 EXAFS spectra of hydrated OPC at 50 °C and at different ages (line:<br />
experimental data; dots: modeled data). The broken lines outline selected<br />
spectral features. ..................................................................................................... 162<br />
Fig. 80 EXAFS spectra of hydrated HS at 20 °C and at different ages (line:<br />
experimental data; dots: modeled data). The broken lines outline selected<br />
spectral features. ..................................................................................................... 163<br />
Fig. 81 EXAFS spectra of hydrated HS at 50 °C and at different ages (line:<br />
experimental data; dots: modeled data). The broken lines outline selected<br />
spectral features. ..................................................................................................... 163<br />
Fig. 82 Volume changes of hydrated phases at different hydration ages during<br />
hydration of OPC at room temperature. .................................................................. 168<br />
Fig. 83 Heat flow of the hydration of C2F and synthetic Fe-cement in the presence of<br />
different amounts of gypsum. ................................................................................. 172<br />
Fig. 84 XRD (above) and TGA-DTG (below) analysis of C2F and synthetic Fecement<br />
after 3 days of hydration in the presence of different amounts of gypsum<br />
*Fe-OH-AFm +unidentified. .................................................................................. 173<br />
Fig. 85 XRD (above) and TGA-DTG (below) analysis of C2F and synthetic Fecement<br />
after 3 months of hydration in the presence of different amounts of<br />
gypsum *Fe-AFm hydroxyl. ................................................................................... 175<br />
Fig. 86 Calculated phase diagram of thermodynamic stable hydrate assemblages of<br />
synthetic Fe-cement with different amounts of gypsum. ........................................ 176<br />
Fig. 87 Conduction calorimeter curve of the hydration of synthetic Fe-cement with<br />
different amounts of gypsum and calcite. ............................................................... 177<br />
Fig. 88 XRD (above) and TGA-DTG (below) analysis of synthetic Fe-cement after 3<br />
months of hydration with different amounts of gypsum and calcite ...................... 179<br />
Fig. 89 Calculated phase diagram of thermodynamic stable hydrate assemblages of<br />
Fe-synthetic cement with different amounts of gypsum and calcite. ...................... 180<br />
ix
Table of Contents<br />
TABLE OF CONTENTS<br />
Abstract ................................................................................................................................ i<br />
Zusammenfassung .............................................................................................................. iv<br />
Acknowledgement ............................................................................................................. vii<br />
List of Tables ........................................................................................................................ i<br />
List of Figures ...................................................................................................................... iv<br />
1 INTRODUCTION ........................................................................................................... 1<br />
1.1 Ordinary Portland cement (OPC) ............................................................................ 1<br />
1.2 Cement hydration and thermodynamic modeling ................................................. 1<br />
1.3 The fate of iron oxides during the hydration of cements ....................................... 6<br />
1.4 Characterization of cementitious system ............................................................... 7<br />
1.4.1 Standard analytical techniques ....................................................................... 7<br />
1.4.2 X‐ray absorption spectroscopy (XAS) .............................................................. 7<br />
1.5 Objective of this study .......................................................................................... 10<br />
1.6 Outline of the thesis .............................................................................................. 11<br />
2 MATERIALS AND METHODS ...................................................................................... 12<br />
2.1. Synthesis of Fe‐containing phases .................................................................... 12<br />
2.1.1. Fe‐hemicarbonate and Fe/Al‐monocarbonate ............................................. 12<br />
2.1.2. Fe‐monosulfate ............................................................................................. 13<br />
2.1.3. Fe‐Friedel’s Salt ............................................................................................. 14<br />
i
TABLE OF CONTENTS<br />
2.1.4. Fe‐strätlingite ................................................................................................ 14<br />
2.1.5. Synthesis of hydrogarnets ............................................................................ 14<br />
2.1.5.1. Silica free hydrogarnets: Ca3(AlxFe1‐x)2(OH)12 ....................................... 14<br />
2.1.5.2. Siliceous hydrogarnets: Ca3(AlxFe1‐x)2(SiO4)(OH)8 ................................. 15<br />
2.1.6. Hydrated cement samples ............................................................................ 16<br />
2.1.7. Synthesis of synthetic Fe‐cement ................................................................. 17<br />
2.2. Analytical methods ........................................................................................... 18<br />
2.2.1. Powder X‐ray diffraction ............................................................................... 18<br />
2.2.2. Synchrotron powder diffraction ................................................................... 19<br />
2.2.3. Thermogravimetric analysis .......................................................................... 19<br />
2.2.4. Vibrational spectroscopy (Raman and Infrared spectroscopy) .................... 20<br />
2.2.5. Scanning electron microscopy (SEM) ........................................................... 20<br />
2.2.6. Liquid phase analysis .................................................................................... 20<br />
2.2.7. Selective dissolution ..................................................................................... 21<br />
2.2.8. Synchrotron‐based X‐ray absorption spectroscopy (XAS) ............................ 22<br />
2.2.8.1. Data collection and reduction............................................................... 22<br />
2.2.8.2. Data analysis and fitting ........................................................................ 23<br />
2.2.9. Calorimetry ................................................................................................... 24<br />
2.3. Thermodynamic modeling ................................................................................ 24<br />
2.3.1. Estimation of heat capacity of Fe‐containing phases ................................... 25<br />
2.3.2. Determination of solubility products ............................................................ 25<br />
2.3.3. Thermodynamics of solid solutions .............................................................. 31<br />
2.3.4. Thermodynamic modeling of cement hydration .......................................... 34<br />
ii
TABLE OF CONTENTS<br />
3. SYNTHETIC FE‐CONTAINING HYDRATES ................................................................... 35<br />
3.1. Iron containing carbonate AFm phases ............................................................ 35<br />
3.1.1. Introduction .................................................................................................. 35<br />
3.1.2. Fe‐hemicarbonate ......................................................................................... 37<br />
3.1.3. Fe‐monocarbonate ....................................................................................... 40<br />
3.1.3.1. Kinetics of formation ............................................................................ 40<br />
3.1.3.2. Effect of temperature ........................................................................... 42<br />
3.1.3.3. Structure of Fe‐Mc ................................................................................ 43<br />
3.1.3.4. Comparison of pure Fe‐ and Al‐Mc ....................................................... 50<br />
3.1.4. Mixed CaO.(AlxFe1‐x)2O3.CaCO3.nH2O systems .............................................. 53<br />
3.1.5. Solubility ........................................................................................................ 55<br />
3.1.5.1. Determination of solubility products at 20 °C and 50 °C ...................... 56<br />
3.1.5.2. Estimation of the solubility product under standard conditions ......... 59<br />
3.1.5.3. Modeling of mixed CaO(AlxFe1‐x)2O3CaCO3nH2O systems ................. 61<br />
3.1.6. Modeling of C3A‐C2F‐CaCO3‐CaSO4‐H2O system in cement hydration ......... 62<br />
3.1.7. Conclusions ................................................................................................... 64<br />
3.2. Fe‐containing monosulfate ............................................................................... 67<br />
3.2.1. Introduction .................................................................................................. 67<br />
3.2.2. Kinetics of formation .................................................................................... 67<br />
3.2.3. Effects of temperature .................................................................................. 69<br />
3.2.4. Structure of C4FsH12 ...................................................................................... 70<br />
3.2.5. Comparison of C4AsH12 with C4FsH12 ............................................................ 74<br />
3.2.6. Solid solution between Al and Fe‐monosulfate (C4(A,F)sH12) ...................... 77<br />
iii
TABLE OF CONTENTS<br />
3.2.7. Solubility of Al/Fe‐monosulfate .................................................................... 80<br />
3.2.7.1. Determination of solubility products at 20, 50 and 80 °C .................... 80<br />
3.2.7.2. Determination of solubility products under standard condition ......... 82<br />
3.2.7.3. Determination of solubility product of the solid solution and modeling<br />
of the liquid phase ................................................................................................ 84<br />
3.2.8. Conclusions ................................................................................................... 91<br />
3.3. Fe‐Friedel’s salt (3CaO . Fe2O3 . CaCl2 . 10H2O) ....................................................... 92<br />
3.3.1. Introductions ................................................................................................. 92<br />
3.3.2. Kinetics of formation .................................................................................... 92<br />
3.3.3. Structure of Fe‐Friedel’s salt ......................................................................... 95<br />
3.3.4. Comparison of Al‐Friedel’s salt and Fe‐Friedel’s .......................................... 97<br />
3.3.5. Solid solution between Al and Fe‐Friedel’s salt (3CaO(AlxFe1‐x)2CaCl2.10H2O ..<br />
....................................................................................................................... 99<br />
3.3.6. Solubility ...................................................................................................... 100<br />
3.3.6.1. Solubility of Fe‐Friedel’s salt ............................................................... 100<br />
3.3.6.2. Determination of the solubility products of the solid solution and<br />
modeling of the liquid phase .............................................................................. 105<br />
3.3.7. Conclusions ................................................................................................. 106<br />
3.4. Fe‐strätlingite .................................................................................................. 108<br />
3.5. Hydrogarnets .................................................................................................. 109<br />
3.5.1. Introduction ................................................................................................ 109<br />
3.5.2. Al‐Katoite, C3AH6 ......................................................................................... 111<br />
3.5.3. Fe‐Katoite, C3FH6 ......................................................................................... 117<br />
iv
TABLE OF CONTENTS<br />
3.5.4. Solid solution between aluminum and iron katoite, C3(A,F)H6 .................. 119<br />
3.5.5. Aluminum siliceous hydrogarnet, C3ASH4 ................................................... 122<br />
3.5.6. Iron siliceous hydrogarnet, C3FSH4 ............................................................. 129<br />
3.5.7. Solid solution between Ca3Fe2(OH)12 and Ca3Fe2O6(SiO2)3 (hydroandradite,<br />
Ca3Fe2(SiO4)3‐y(OH)4y) .............................................................................................. 136<br />
3.5.8. Solid solution between aluminum and iron siliceous hydrogarnet, C3(A,F)SH4<br />
..................................................................................................................... 138<br />
3.5.9. Conclusions ................................................................................................. 143<br />
3.6. Summary ......................................................................................................... 145<br />
4. FE‐CONTAINING HYDRATES IN HYDRATED CEMENT .............................................. 147<br />
4.1. Identification of Fe‐containing hydrates in hydrated cement ........................ 147<br />
4.1.1. Introduction ................................................................................................ 147<br />
4.1.2. Characterization of hydrated cement using standard analytical techniques ...<br />
..................................................................................................................... 149<br />
4.1.3. Spectroscopic investigation ........................................................................ 158<br />
4.1.3.1. XANES and EXAFS spectra of Fe‐containing reference compounds ... 158<br />
4.1.3.2. Identification of Fe‐containing hydrates ............................................ 160<br />
4.1.4. Thermodynamic modeling .......................................................................... 167<br />
4.1.5. Conclusions ................................................................................................. 169<br />
4.2. Synthetic Fe‐cement ....................................................................................... 171<br />
4.2.1. Introduction ................................................................................................ 171<br />
4.2.2. Effects of gypsum on the of hydration of synthetic Fe‐cement ................. 172<br />
4.2.3. Effects of calcite on the of hydration of synthetic Fe‐cement ................... 177<br />
v
TABLE OF CONTENTS<br />
4.2.4. Conclusions ................................................................................................. 180<br />
5. GENERAL CONCLUSION AND OUTLOOK ................................................................. 182<br />
5.1. General conclusion ......................................................................................... 182<br />
5.2. Outlook ........................................................................................................... 186<br />
ABBREVATIONS ............................................................................................................... 188<br />
APPENDIX ........................................................................................................................ 191<br />
Appendix A: Additional fitted structural parameters ................................................. 191<br />
Appendix B: Additional figures ................................................................................... 192<br />
REFERENCES .................................................................................................................... 197<br />
vi
1 INTRODUCTION<br />
CHAPTER 1 INTRODUCTION<br />
In this chapter a general overview about the hydration of Portland cements, different<br />
characterization techniques, thermodynamic modeling and the reaction of ferrite phases is<br />
given. Moreover, the objective of the study is briefly explained.<br />
1.1 Ordinary Portland cement (OPC)<br />
The raw materials for Portland cement production are a mixture of limestone and clay<br />
minerals containing calcium oxide, silicon oxide, aluminum oxide, ferric oxide, and<br />
magnesium oxide. The raw materials are ground together in a raw mill and then heated in<br />
a cement kiln at a temperature between 1400-1500 °C which produces nodules of clinker.<br />
The clinker is mixed with a few percent of gypsum and finely ground to make cement.<br />
The clinker contains four major phases, called alite (Ca3SiO5 or C3S), belite (C2S or<br />
Ca2SiO4), aluminate (C3A or Ca3Al2O3) and ferrite (C2(A,F)). The formulas given are<br />
idealized, as all clinker phases contain in addition a number of minor elements [1]. Ferrite<br />
designates a solid solution series with the formula Ca2(AlxFe1-x)2O5 with 0 ≤ x < 0.7. It<br />
crystallizes in the orthorhombic crystal system, the unit-cell dimensions vary with the<br />
Al2O3/Fe2O3 ratio. In ferrite as present in cement clinker, a part of Fe 3+ can be replaced<br />
by Mg 2+ in combination with Si 4+ or Ti 4+ resulting in the typical clinker ferrite<br />
composition of approximately Ca2AlFe0.6Mg0.2Si0.15Ti0.05O5.<br />
1.2 Cement hydration and thermodynamic modeling<br />
Alite and belite constitute over 80 wt.% of most Portland cements. Alite is the most<br />
important phase for strength development during the first month, while C2S reacts much<br />
slowly and contributes rather to the long-term strength of the cement. Both the silicate<br />
1
CHAPTER 1 INTRODUCTION<br />
phases react with water as shown below to form calcium hydroxide and calcium-silicate<br />
hydrate (C-S-H) with Ca/Si ratio of 1.5 to 1.9:<br />
C3S + 5.3H2O → C1.7SH4 + 1.3CH<br />
C2S + 4.3H2O → C1.7SH4 + 0.3CH<br />
Tricalcium aluminate (Ca3Al2O3) constitutes 5-10% of most Portland cement clinkers. In<br />
the absence of any additives, C3A reacts with water to form two intermediate hexagonal<br />
phases, C2AH8 and C4AH13. The structure of C2AH8 is not precisely known, but C4AH13<br />
has a layered structure based on the calcium hydroxide structure. All of the aluminum in<br />
C4AH13 is octahedral. C2AH8 and C4AH13 are metastable phases that transform with time<br />
into the thermodynamically more stable cubic phase C3AH6.<br />
2C3A + 21H2O → C2AH8 + C4AH13 → 2C3AH6 + 9H2O<br />
In the presence of gypsum, anhydrite or bassanite, C3A reacts slowly and forms Al-<br />
ettringite, which can convert to Al-monosulfate after the depletion of calcium sulfates<br />
and further Al-ettringite.<br />
C3A + 3CsH2 + 26H2O → C6As3H32<br />
2C3A + C6As3H32 + 4H2O → 3C4AsH12<br />
In the presence of carbonate, C3A forms Al-hemicarbonate or Al-monocarbonate,<br />
depending of the availability of calcite [2].<br />
C3A + 0.5Cc + 0.5CH + 11.5H2O → C4Ac0.5H12<br />
C3A + Cc + 11H2O → C4AcH11<br />
The reaction of ferrite (C2(A,F)) is similar to the reactions of C3A though the presence of<br />
Fe makes it more complicated. The Al from C2(A,F) can form as discussed above Al-<br />
containing OH-AFm phases (C2AH8 and C4AH13) or Al-katoite (C3AH6). In the presence<br />
of gypsum or carbonate, monosulfate, hemicarbonate, monocarbonate and ettringite can<br />
2
CHAPTER 1 INTRODUCTION<br />
be formed. The fate of Fe is unclear. If we assume partial substitution of Al by Fe, a solid<br />
solution can be formed as in<br />
C2(A,F) + 2CH + 19H2O → C2(A,F)H8 + C4(A,F)H13 → 2C3(A,F)H6 + 9H2O<br />
In the presence of gypsum,<br />
C2(A,F) + 6CsH2 + 2CH + 50H2O → 2C6(A,F)s3H32<br />
C2(A,F) + C6(A,F)s3H32 + 2CH + 2H2O → 3C4(A,F)sH12<br />
In the presence of calcite,<br />
C2(A,F) + Cc + 11H2O → C4(A,F)cH11<br />
The hydration of cement is far more complex than the sum of the hydration reactions of<br />
the individual minerals. The major constituents of OPC are alite, belite, aluminate and<br />
ferrite and in addition a number of other minerals such as calcium sulfates (gypsum,<br />
hemihydrate and/or anhydrite), calcite, calcium oxide, magnesium oxide, Na- and K-<br />
sulfates are usually present. In contact with water, the easily soluble solids in the cement,<br />
such as gypsum, alkali sulfate and calcium oxide, react until equilibrium with the pore<br />
solution is reached or they are dissolved completely. The clinker phases hydrate slowly<br />
and release continuously Ca, Si, Al, Fe and OH - to solution, which then precipitate as<br />
calcium silicate hydrates (C-S-H), ettringite or as other hydrate phases. The balance<br />
between dissolution rates of the clinker phases and precipitation rates of the secondary<br />
phases determines the amount of Ca, Al, Fe, Si, and OH - released and the rate of<br />
formation of C-S-H, ettringite and the other hydrates.<br />
Thermodynamic modeling of the interactions between solid and liquid phase in cements<br />
using geochemical speciation codes helps to provide a basis for the interpretation of the<br />
hydration process [3, 4]. Furthermore, it allows the composition of the hydrate<br />
3
CHAPTER 1 INTRODUCTION<br />
assemblages to be predicted under different conditions (e.g., initial clinker composition,<br />
water-to-cement (w/c) ratios, etc.) and for longer time scales.<br />
Hydration models have been developed in the past years to quantify the composition of<br />
the solid phases and liquid phases in cementitious systems during hydration [3-6]. For<br />
OPC systems, thermodynamic modeling in combination with calculated hydration rates<br />
correctly predicts the depletion of gypsum within the first day of hydration (Fig. 1). In<br />
this phase a strong decrease of the sulfate concentration in the pore solution is observed<br />
as ettringite continues to precipitate (Fig. 2). The depletion of aqueous sulfate during the<br />
first day is compensated by the release of OH - to fulfill conditions of electroneutrality in<br />
solution, which gives rise to a significant increase in pH. This increase in pH decreases<br />
the Ca concentration constrained by the portlandite solubility (Fig. 2). After the first day<br />
the precipitation of ettringite (6Ca(OH)2·(AlxFe1-x)2(SO4)3·26H2O(s)) ends as gypsum is<br />
exhausted. Subsequently, calcium monocarbonate (3CaO·(AlxFe1-<br />
x)2O3·CaCO3·11H2O(s)) and hydrotalcite (Mg4Al2(OH)14·3H2O) start forming. Calcite is<br />
slowly consumed due to the formation of monocarbonate. After hydration time of one<br />
month and longer, the solid paste is mainly composed of C-S-H, portlandite, ettringite<br />
and monocarbonate. With the exception of ettringite, the amount of hydration products<br />
continues to slowly increase with time.<br />
4
cm 3 /100 g cement<br />
85<br />
80<br />
75<br />
70<br />
65<br />
60<br />
55<br />
50<br />
45<br />
40<br />
35<br />
30<br />
25<br />
20<br />
15<br />
10<br />
gypsum<br />
C AF 4 C3A C S 2<br />
C S 3<br />
CHAPTER 1 INTRODUCTION<br />
ettringite<br />
monocarbonate<br />
C-S-H<br />
portlandite<br />
5<br />
0<br />
0.01 0.1 1 10 100 1000<br />
hydration time [days]<br />
pore solution<br />
Fig. 1 Calculated volume changes during the hydration of OPC.<br />
[mM]<br />
600<br />
500<br />
400<br />
300<br />
200<br />
100<br />
0<br />
CaSO 4,Ca(OH) 2<br />
C-S-H, ettringite,<br />
brucite<br />
Ca<br />
SO 4<br />
K<br />
K OH-<br />
Na SO4<br />
Ca Si<br />
C-S-H, Ca(OH) 2,<br />
ettringite,<br />
monocarbonate,<br />
hydrotalcite<br />
calcite<br />
hydrotalcite<br />
0.01 0.1 1 10 100 1000 10000<br />
time [hours]<br />
Fig. 2 Calculated (lines) and measured (dots) composition of the liquid phase of ordinary Portland<br />
cement during hydration [6].<br />
Application of thermodynamic models requires that the thermodynamic data of the<br />
hydrates formed in OPC are known. In the past years a set of thermodynamic data for<br />
selected hydrates have been critically reviewed [6]. Additionally, the solubility of<br />
OH -<br />
Na<br />
Si<br />
5
CHAPTER 1 INTRODUCTION<br />
numerous hydrates particularly Al-containing phases have been investigated<br />
experimentally between 5 to 85 °C, which served as a basis to extend the cement database<br />
[3, 7]. However, there is a lack of thermodynamic data on Fe-hydrates that limits<br />
thermodynamic modeling to predict the fate of Fe-during cement hydration.<br />
1.3 The fate of iron oxides during the hydration of cements<br />
Ferrite C2(A,F) (Ca4(Fex-1Alx)4O10) is an important clinker phase in Portland cements<br />
(5-15%). The rate at which it reacts with water appears to be somewhat variable perhaps<br />
due to differences in composition or other characteristics, but it reacts fast initially and<br />
much more slowly at later ages [8, 9].<br />
In pure system, i.e. in the presence of Ca, Al, Fe, and sulfate or carbonate only, Fe-<br />
containing ettringite, monosulfate and monocarbonate were found to precipitate and to<br />
form solid solutions with their Al-containing analogues [10-17]. Further, the formation of<br />
an amorphous iron hydroxide phase was reported [16-20]. In the complex cement matrix,<br />
however, the situation appears to be unclear due to the presence of silica. It was<br />
suggested that Fe-containing siliceous hydrogarnets might form in cementitious systems<br />
[21-23]. Harchand et al. [24] found that no Fe(OH)3 was present in hydrated cements<br />
based on Mössbauer spectroscopy but they could not gain any further information from<br />
the spectra concerning the kind of Fe-containing hydrates formed. Whether and to what<br />
extent Al/Fe-ettringite, Al/Fe-monosulfates, Al/Fe-monocarbonate, amorphous Fe(OH)3<br />
or Al/Fe (siliceous) hydrogarnets, respectively, might form in Portland cement is poorly<br />
understood.<br />
6
CHAPTER 1 INTRODUCTION<br />
1.4 Characterization of cementitious system<br />
1.4.1 Standard analytical techniques<br />
Commonly used analytical techniques to characterize cementitious system include XRD,<br />
TGA, microscopic techniques (SEM and TEM) and vibrational spectroscopies (IR and<br />
Raman). X-ray diffraction (XRD) is a key technique for characterizing the crystalline<br />
phase composition of materials. Moreover, it allows phase identification and provides<br />
information about crystal structure. However, it does not give sufficient information<br />
about poorly crystalline and amorphous phases. Thermogravimetric analysis (TGA) helps<br />
to characterize and identify phases from complex cement matrix based on the weight loss<br />
over a specific temperature range. The limitation of TGA is due to the difficulty of<br />
distinguishing different phases within the complex cement matrix which have the weight<br />
loss at the same temperature. Scanning electron microscopy (SEM) is used to study the<br />
microstructure of cement and cementitious materials and in combination with EDX<br />
(energy dispersive X-ray spectroscopy) to characterize the chemical composition of the<br />
different phases and their spatial distribution. The above standard analytical techniques<br />
cannot provide a clear identification of Fe-containing hydrates in hydrated cement as<br />
signals from Fe-containing phases overlap with its Al-analogues.<br />
1.4.2 X-ray absorption spectroscopy (XAS)<br />
X-ray absorption spectroscopy (XAS) is a technique used to obtain structural information<br />
of a compound. It is element specific and accounts for the local geometric and electronic<br />
structures. A synchrotron light source is used as the X-ray photon source. The energy is<br />
tuned to an energy at which the incident photon can excite a core electron of the<br />
absorbing atom to a continuum state. The electron is now considered a photoelectron and<br />
7
CHAPTER 1 INTRODUCTION<br />
propagated as a spherical wave. The energy of this photoelectron is equal to the energy of<br />
the absorbed photon minus the binding energy of the electron to the atom. The energy at<br />
which these photoelectrons are absorbed is related to the edges seen in XAS, K, L and M<br />
which correspond to the particular electronic transitions (Fig. 3).<br />
Fig. 3 A sample of edges and the corresponding electronic transitions [25].<br />
The number of X-ray photons that are transmitted through a sample (It) is equal to the<br />
number of X-ray photons shone on the sample (I0) multiplied by a decreasing exponential<br />
factor that depends on the absorption coefficient (μ) of the type of atoms in the sample<br />
and the thickness of the sample x.<br />
It = I0e<br />
– μx<br />
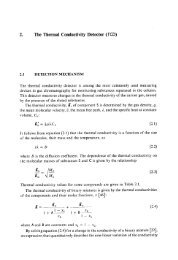
There are two main regions of the XAS spectrum providing structural information:<br />
XANES and EXAFS (Fig. 4).<br />
8
CHAPTER 1 INTRODUCTION<br />
Fig. 4 Sample XAS Spectrum of FeO with XANES and EXAFS region [26].<br />
The X-ray absorption near edge structure, XANES, is the part of the spectrum that gives<br />
qualitative data based on modeling and simulation. XANES is used to give information<br />
about the average oxidation state and coordination environment. By taking unknown<br />
spectra and fitting a linear combination of known reference spectra, one can get an<br />
estimate of the contribution of each reference to the unknown spectra.<br />
Extended X-ray absorption fine structure, EXAFS, is the part of spectrum that gives<br />
quantitative data on the local structure around the absorber atom. From EXAFS mainly<br />
information on the type of neighboring atoms, their distance from absorber atom (bond<br />
length), the number of neighboring atoms (coordination numbers) and ordering effects<br />
(Debye-Waller factor) can be extracted. As described above, the photoelectron can be<br />
thought of as a wave centered at an atom. The wave vector of the photoelectron is related<br />
to the difference in binding energy of the electron, E0, and the energy of the photon, E, as<br />
shown below:<br />
9
, k=2π/λ<br />
CHAPTER 1 INTRODUCTION<br />
When this wave interacts with other atoms, there is either a destructive or constructive<br />
interference. The phase and amplitude of interference that occurs is related to the type<br />
and location of the incident atom. Therefore, analysis of EXAFS data allows structural<br />
information about the type of atom and its coordination environment to be determined.<br />
XANES and EXAFS techniques allow dilute samples to be examined (concentration of<br />
the X-ray absorber down to a few tens of ppm). Most importantly, XAS can be used to<br />
study amorphous solids, surface adsorbed complexes, or species in solution in addition to<br />
crystalline materials. There is growing interest in the application of this technique for<br />
quantification of species in a complex mixture [27].<br />
Synchrotron-based X-ray absorption spectroscopy (XAS) can be used as a<br />
complementary technique to gain molecular-level information from cementitious systems<br />
[28-30]. Furthermore, advanced high resolution synchrotron-based X-ray micro-probe<br />
allows to obtain spatially resolved information on the speciation of the X-ray absorber of<br />
interest in compact matrices, such as cementitious materials [28, 30].<br />
1.5 Objective of this study<br />
As discussed above, the fate of iron during cement hydration is poorly known. Moreover,<br />
experimentally determined thermodynamic solubility products and other thermodynamic<br />
parameters are lacking for Fe-hydrates. The general objectives of this study are the<br />
following:<br />
Synthesis and characterization of Fe-hydrates and investigation of their solid<br />
solution formation with the Al-analogous. Experimental determination of<br />
solubility products and other thermodynamic parameters of Fe-hydrates.<br />
10
CHAPTER 1 INTRODUCTION<br />
Identification of Fe-hydrates in hydrated Portland cements using XAS technique.<br />
Thermodynamic modelling of Portland cement hydration including the newly<br />
determined thermodynamic data for iron phases and compare them to the<br />
experimental data in Portland cements and in synthetic Al-free cements.<br />
1.6 Outline of the thesis<br />
The thesis contains five chapters:<br />
Chapter 1: contains the introduction and the objective of the thesis.<br />
Chapter 2: presents the materials and methods used to study Fe-containing hydrates<br />
possibly present in cementitious system. It explains the procedures followed to synthesize<br />
pure Fe-containing phases and their solid solutions with Al. In the course of this chapter<br />
the analytical techniques used to characterize both the solid and the liquid phases are<br />
presented. Furthermore, the application of thermodynamics in the framework of this<br />
study is explained.<br />
Chapter 3: briefly presents the results obtained on formation of Fe-containing phases,<br />
their crystal structure, and formation of solid solution with their Al-analogues and<br />
determination of thermodynamic data.<br />
Chapter 4: describes identification of hydrated phases in cements particularly Fe-<br />
containing hydrates using EXAFS. It also presents thermodynamic modeling of Portland<br />
cement and hydration study of Al-free Fe-synthetic cement.<br />
Chapter 5: presents the general conclusions of the study and the outlook for future<br />
investigations.<br />
11
CHAPTER 2 MATERIALS AND METHODS<br />
2 MATERIALS AND METHODS<br />
2.1. Synthesis of Fe-containing phases<br />
C3A and C2F clinkers were used as starting materials for the synthesis. C3A and C2F were<br />
prepared by mixing appropriate amounts of CaCO3 with Al2O3 and Fe2O3 powders and<br />
burning at 1400 °C and 1350 °C respectively for 24 hours. The powders were ground to<br />
63 µm. XRD analysis indicated that no other solids than C3A or C2F were present. CaO<br />
was synthesized by burning CaCO3 at 1000 °C.<br />
2.1.1. Fe-hemicarbonate and Fe/Al-monocarbonate<br />
Pure Fe-Mc and Fe-Hc were synthesized by the addition of appropriate amounts of C2F,<br />
CaCO3, and CaO to 0.1 M KOH solution (50 ml) at liquid/solid ratio ~ 20. The<br />
stoichiometry of the reaction is given by:<br />
2CaO . Fe2O3 + CaCO3 + CaO + 12H2O → 3CaO . Fe2O3 . CaCO3 . 12H2O<br />
2CaO . Fe2O3 + 0.5CaCO3 + 1.5CaO + 10H2O → 3CaO . Fe2O3 . Ca(CO3)0.5 . 10H2O<br />
0.1 M KOH solution was used to simulate the high pH present in the pore solution of<br />
Portland cement. Al/Fe-monocarbonates were synthesized by precipitation from<br />
supersaturated solutions. Appropriate amounts of C3A, C2F, CaCO3, and CaO were added<br />
to 0.1 M KOH solution (pH = 13.0). The mole fraction of Al varied from x = 0 to 1. The<br />
overall stoichometric reaction is given by:<br />
xC3A + (1-x)C2F + CaCO3 + (1-x)CaO + nH2O → 3CaO(AlxFe1-x)2O3CaCO3nH2O.<br />
The samples were stored in closed PE-bottles at different temperatures (20, 50 and 80 °C)<br />
and sampled up to three years. After equilibration the solid and liquid phases were<br />
separated by vacuum filtration through 0.45µm nylon filters. All sample preparation and<br />
12
CHAPTER 2 MATERIALS AND METHODS<br />
handling were done in a glove box filled with N2-atmosphere to minimize CO2<br />
contamination.<br />
The mixes used in the undersaturation experiments correspond to those prepared for the<br />
oversaturation experiments. After an equilibration time of 3 years, an additional amount<br />
of 0.1 M KOH solution was added to duplicate the volume of the solution (resulting in<br />
undersaturation) and equilibrated for further 15 months. Note that, all the 3 years old<br />
samples prepared during the previous PhD project [31].<br />
2.1.2. Fe-monosulfate<br />
Pure Fe-monosulfate was synthesized by the addition of appropriate amounts of C2F,<br />
CaSO42H2O and CaO to 50 ml of 0.4 M KOH solution (pH = 13.6) at liquid/solid ratio ~<br />
20. The overall stoichometric reaction is given by:<br />
2CaOFe2O3 + CaSO42H2O + CaO + 10H2O → 3CaOFe2O3CaSO412H2O<br />
0.4 M KOH solution was used to mimic the high pH conditions in the pore solution of<br />
Portland cement in which monosulfate is formed. At lower KOH concentrations the<br />
formation of Fe-ettringite instead of Fe-monosulfate is favored [15]. Mixed Al/Fe-<br />
monosulfate was synthesized by precipitation from supersaturated solutions. Again<br />
appropriate amounts of C3A, C2F, CaSO4 2H2O, and CaO were added to 0.4 M KOH<br />
solution (pH = 13.6). The mole fraction of Al varied from x = 0 to 1. The overall<br />
stoichiometric reaction is given by:<br />
xC3A +(1-x)C2F +CaSO42H2O + (1-x)CaO +10H2O→3CaO(AlxFe1x)2O3CaSO412H2O<br />
Sample handling was as described in section 2.1.1.<br />
13
2.1.3. Fe-Friedel’s Salt<br />
CHAPTER 2 MATERIALS AND METHODS<br />
Pure Fe-Friedel’s salt was synthesized in three different ways:<br />
a. By the addition of appropriate amounts of C2F, CaCl2 . 2H2O, and CaO to<br />
distilled water (50 ml) at liquid/solid ratio ~ 20 according to:<br />
2CaOFe2O3 + CaCl22H2O + CaO + 8H2O → 3CaOFe2O3 . CaCl210H2O<br />
b. By mixing appropriate amounts of C2F, CaCl22H2O, and CaO in 0.1 M KOH<br />
solution (50 ml) at liquid/solid ratio ~ 20 according to the above reaction.<br />
c. By the addition of appropriate amounts of AlCl36H2O, FeCl36H2O, and CaO<br />
in 50 ml of 0.1 M KOH at a liquid/solid ratio ~ 20 to obtain<br />
4CaO (AlxFe1-x)2O3Cl210 H2O.<br />
Sample handling was as described in section 2.1.1.<br />
2.1.4. Fe-strätlingite<br />
Different methods were also used to obtain Fe-strätlingite (C2FSH8). The first method<br />
was mixing appropriate amounts of Fe(OH)3, Na2SiO35H2O and CaO in 0.1 M KOH.<br />
The second method was by mixing 2FeCl36H2O, Na2SiO35H2O, and 2Ca(NO3)24H2O<br />
in 0.1 M KOH. The samples were equilibrated at 7, 28 and 200 days at 20, 50 and 80 °C.<br />
2.1.5. Synthesis of hydrogarnets<br />
2.1.5.1. Silica free hydrogarnets: Ca3(AlxFe1-x)2(OH)12<br />
C3AH6 and C3FH6 were synthesized by mixing appropriate amounts of C3A or C2F and<br />
CaO in 50 ml 0.1 M KOH to obtain a liquid/solid ratio of ~ 20. The suspensions were<br />
equilibrated at 20, 50 and 80 °C up to three years. The stoichiometry of the reactions is<br />
given by:<br />
14
3CaOAl2O3 + 6H2O → 3CaOAl2O36H2O<br />
CHAPTER 2 MATERIALS AND METHODS<br />
2CaOFe2O3 + CaO + 6H2O → 3CaOFe2O36H2O<br />
The samples were stored in closed PE-bottles and sampled after different reaction times.<br />
Sample handling was as described in section 2.1.1.<br />
2.1.5.2. Siliceous hydrogarnets: Ca3(AlxFe1-x)2(SiO4)(OH)8<br />
a) Synthesis at ambient temperature (supersaturation experiments)<br />
In a first attempt, C3ASH4 and C3FSH4 were synthesized by mixing stoichiometric<br />
amounts of C3A or C2F with CaO and Na2SiO35H2O at 20 °C in 50 ml 0.1 M KOH at<br />
liquid/solid ratio of ~ 20. The samples were stored in closed PE-bottles at different<br />
temperatures (20, 50 and 80 °C) and sampled up to three years under supersaturated<br />
conditions. Sample handling was as described in section 2.1.1.<br />
b) Hydrothermal synthesis (undersaturation experiments)<br />
Due the slow reaction of the C2F clinkers and the poor crystallinity of the products<br />
formed at 20 °C, mixed Ca3(AlxFe1-x)2(SiO4)(OH)8 solids were also prepared<br />
hydrothermally at 110 °C. Stoichiometric amounts of AlCl36H2O, FeCl36H2O,<br />
Na2SiO35H2O and Ca(NO3)24H2O were mixed with 200 ml of 1 M KOH at a<br />
liquid/solid ratio of ~ 25 to obtain 3CaO(AlxFe1-x)2O3SiO24H2O. A pH of approximately<br />
13.5 (measured at 20 °C) was observed after mixing. The mixes were stored for 5 days in<br />
closed teflon vessels at approximately 110 °C. The same procedure was used to prepare<br />
Fe-hydrogarnets Ca3Fe2(SiO4)3-y(OH)4y containing different quantities of silica and<br />
hydroxide.<br />
15
CHAPTER 2 MATERIALS AND METHODS<br />
After aging for 5 days at 110 °C, the solid and liquid phases were separated by vacuum<br />
filtration through 0.45µm nylon filters. The residues were dried in N2-filled desiccators<br />
over saturated CaCl2 solutions for 1 week. The dried solids were re-dissolved in 0.1 M<br />
KOH at liquid/solid-ratio of ~ 20 in HDPE bottles and equilibrated at 20 °C and 50 °C for<br />
4 months (undersaturation experiments).<br />
2.1.6. Hydrated cement samples<br />
To study the fate of iron in hydrated cements, hydration experiment were carried out<br />
using an ordinary Portland cement (OPC), CEM I 32.5 R and a sulfate resistant cement<br />
HS (CEM I 42.5 N). The chemical composition of the cements used for this study is<br />
listed in Table 1. The cement pastes were prepared at a water/cement (w/c) ratio of 0.425<br />
and hydrated at 20 and 50 °C. The latter temperature was chosen since the composition of<br />
the hydration assemblage is expected to change around 48 °C [3, 32]. The cements were<br />
hydrated for 4, 8, 16 hours, 1, 28, 150 days, 1 and 3 years at 20 and 50 °C.<br />
The hydration of the cements was stopped using isopropanol. The sample were dried in<br />
an oven at 40 °C for 1 hour. The sample was ground by hand for XRD, EXAFS and TGA<br />
analysis.<br />
16
CHAPTER 2 MATERIALS AND METHODS<br />
Table 1 Oxide and the phase composition of the cements used.<br />
OPC HS OPC HS<br />
CEM I 32.5 R CEM I42.5 N CEM I 32.5 R CEM I42.5 N<br />
a Chemical analysis (g/100g) (g/100g) b<br />
Phase composition (g/100g) (g/100g)<br />
SiO2 20.34 17.55 C3S 53.5 60.0<br />
Al2O3 5.17 4.58 C2S 18.0 5.1<br />
Fe2O3 3.09 7.2 C3A 8.5 0.0<br />
CaO 63.38 60.34 C2(A,F) 9.4 21.9<br />
MgO 2.53 1.98 CaSO4 2.5 2.7<br />
K2O 0.91 1.02<br />
c<br />
K2SO4 1.5 1.5<br />
Na2O 0.2 0.33<br />
c<br />
Na2SO4 0.2 0.2<br />
SO3 2.41 2.67<br />
d<br />
K2O 0.1 0.2<br />
CO2 0.12 0.73<br />
d<br />
Na2O 0.1 0.2<br />
TiO2 0.32 0.53 CaO(free) 1.2 -<br />
Mn2O3 0.06 0.07 CaCO3 0.8 -<br />
P2O5 0.25 0.34<br />
d<br />
MgO 2.5 2.0<br />
Cl 0.03 0.073<br />
d<br />
SO3 0.2 0.3<br />
Loss of ignition 1.01 3.24<br />
a<br />
XRF data corrected for ignition loss.<br />
b<br />
Calculated from the chemical analysis.<br />
c<br />
Estimated based on the alkali content and on the alkali distribution given in Taylor (1987).<br />
d<br />
Present as solid solution in the major clinker phases<br />
2.1.7. Synthesis of synthetic Fe-cement<br />
In addition, the hydration products of Al-free synthetic cements were investigated. The<br />
clinker composition of the synthetic Fe-cement consisted of 78.5% C3S, 19.3% C2F,<br />
0.5% Na2SO4 and 1.7 % K2SO4. The alkalis were added to mimic real Portland cement.<br />
No Al-phases were present to allow the identification of Fe-containing hydrates.<br />
The synthetic cements were hydrated in the presence and the absence of calcite and<br />
gypsum with a liquid/solid ratio of 1. Different quantities of gypsum and calcite were<br />
added while the ratio of C3S to C2F was kept constant (Table 2). The phase assemblage<br />
was investigated after 3 days and 3 months. The results from the studies were compared<br />
to those from studies on the synthesized phases [10-14, 19] and the studies in OPC<br />
systems [21-23, 33-35].<br />
17
CHAPTER 2 MATERIALS AND METHODS<br />
Table 2 The compositions of the synthetic Fe-cement mixes with varying gypsum (CsH2) and<br />
calcite (Cc) content.<br />
Sample ID C3S C2F Na2SO4 K2SO4 CsH2 Cc<br />
g/100g g/100g g/100g g/100g g/100g g/100g<br />
Gyp-0% 78.5 19.3 0.5 1.7 0.0<br />
Gyp-6% 73.7 18.1 0.5 1.7 6.0<br />
Gyp-26% 57.6 14.2 0.5 1.7 26.0<br />
Cc1 70.7 19.3 0.5 1.7 7.8<br />
Cc 2 66.3 18.1 0.5 1.7 6 7.4<br />
Cc 3 56.2 15.4 0.5 1.7 20 6.2<br />
C2F-pure 97.8 0.5 1.7<br />
C2F-Gyp 65.2 0.5 1.7 32.6<br />
C2F-Gyp-Cc 58.6 0.5 1.7 32.6 6.6<br />
C2F-Cc 88 0.5 1.7 9.8<br />
2.2. Analytical methods<br />
2.2.1. Powder X-ray diffraction<br />
X-ray powder diffraction (XRD) measurements were carried out using CuKα radiation on<br />
a PANalytical X’Pert Pro MPD diffractometer in a -2 configuration with an angular<br />
scan 5°-75° 2θ and an X’Celerator detector. To study the effect of relative humidity, a<br />
climatic chamber (Anton Paar) specially designed for the X- ray diffractometer in a -<br />
configuration was used. The sample was placed in a sample tray of the climatic chamber<br />
of the X-ray diffractometer where both temperature and relative humidity can be<br />
controlled. The diffractograms of the synthesized pure phases and identification of new<br />
phases in cement paste were verified using the PDF database of the International Centre<br />
for Diffraction Data (ICDD). CaF2 was mixed to the powder samples as internal standard<br />
to determine the unit cell parameters for some Fe-containing phases.<br />
18
CHAPTER 2 MATERIALS AND METHODS<br />
2.2.2. Synchrotron powder diffraction<br />
Synchrotron powder diffraction data were collected at the Swiss-Norwegian Beam Line<br />
(SNBL) at the European Synchrotron Radiation Facility (ESRF), Grenoble, France. The<br />
powder material was introduced into glass capillaries (0.5 mm diameter). Data collection<br />
was performed at 295 K at a wavelength of = 0.72085 Å using a MAR345 image plate<br />
detector with the highest resolution (3450 x 3450 pixels with a pixel size of 100 m). The<br />
calculated absorption coefficient mR (m = powder packing factor, = linear absorption<br />
coefficient, R = radius of the capillary) was estimated at 0.65. Three sample-to-detector<br />
distances were used (150, 250 and 350 mm) in order to combine the advantages of high<br />
resolution and extended 2 range. The detector parameters and the wavelength were<br />
calibrated with NIST LaB6. The exposure time was 60s with a rotation of the capillary by<br />
60°. The two-dimensional data were integrated with the Fit2D program which produced<br />
the correct intensity in relative scale [36]. This 2D detector was used in order to perfectly<br />
define the background, to observe very weak diffraction peaks, and to improve the<br />
accuracy of the integrated intensities by achieving a better powder average. Uncertainties<br />
of the integrated intensities were calculated at each 2-point applying Poisson statistics to<br />
the intensity data, considering the geometry of the detector. The instrument resolution<br />
function was determined from the LaB6 data.<br />
2.2.3. Thermogravimetric analysis<br />
Thermogravimetric analysis (TGA) was carried out to determine the weight loss and<br />
characterize the thermal behavior of the solids. The analysis was carried out in a N2<br />
atmosphere on about 8-12 mg of crushed material at a heating rate of 20°C/min over the<br />
temperature range from 30-980°C using a Metter Toledo TGA instrument.<br />
19
CHAPTER 2 MATERIALS AND METHODS<br />
2.2.4. Vibrational spectroscopy (Raman and Infrared spectroscopy)<br />
Micro-Raman spectra were recorded at room temperature in the back scattering<br />
geometry, using a Jobin-Yvon T64000 device. The Raman detector was a charge coupled<br />
device (CCD) multichannel detector cooled by liquid nitrogen to 140 K. The laser beam<br />
was focused onto the sample through an Olympus confocal microscope with x100<br />
magnification. The laser spot was about 1 μm². The spectral resolution obtained with an<br />
excitation source at 514.5 nm (argon ion laser line, spectra physics 2017) was ~ 1 cm -1 .<br />
The measured power at the sample level was kept low (< 5mW) in order to avoid any<br />
damage of the material. The Raman scattered light was collected with microscope<br />
objectives at 360° angle from the excitation and filtered with an holographic Notch filter<br />
before being dispersed by a single grating (1800 grooves per mm). Infrared spectroscopy<br />
(FTS 6000 Spectrometer using KBr pellets technique) was used to characterize the solid<br />
phases. The IR spectra were collected in transmission mode in the region 4000 cm -1 to<br />
600 cm -1 .<br />
2.2.5. Scanning electron microscopy (SEM)<br />
The samples were coated with carbon wire and examined using a Philips SEM FEG XL<br />
30 scanning electron microscopy (SEM). Secondary electron images (SE) were taken to<br />
analyze the hydrates morphology. Energy dispersive X-ray spectroscopy (EDX) was<br />
applied to determine the elemental composition of the hydrates.<br />
2.2.6. Liquid phase analysis<br />
A pH electrode (Knick pH-meter 766 with a Knick SE 100 pH/Pt 1000 electrode) was<br />
used to measure the pH in an aliquot of the undiluted solutions immediately after<br />
20
CHAPTER 2 MATERIALS AND METHODS<br />
filtration. The electrode was calibrated with KOH solutions of known concentrations<br />
prior to the measurements. Another aliquot of the filtered solution was diluted by a factor<br />
of 10 with HNO3 (6.5% supra pure) and analyzed for Ca, Al, Si and K by inductively-<br />
coupled plasma optical emission spectrometry (ICP/OES; Varian, VISTA Pro) and for Fe<br />
by inductively-coupled plasma mass spectrometry (ICP/MS; Finnigan MAT,<br />
ELEMENT2). The Cl concentrations were determined in diluted, non-acidified solutions<br />
using a Dionex ion chromatography system (ICS) 3000 and chloride standards from<br />
Fluka.<br />
2.2.7. Selective dissolution<br />
Selective dissolution allows major phases to be dissolved from the cement matrix, thus<br />
causing to an enrichment of minor phases in the residue. The minor phases can then be<br />
identified more clearly using standard methods [37]. A salicylic acid/methanol (SAM)<br />
extraction was used to dissolve alite, belite, portlandite, C-S-H, AFt and AFm phases<br />
leaving residues of ferrite, siliceous hydrogarnet and hydrotalcite. 5 g of hydrated cement<br />
were stirred in a flask containing 300 ml methanol and 20 g salicylic acid for 2 hours.<br />
The suspension was allowed to settle for about 15 minutes. The solid was then filtered by<br />
vacuum filtration using 0.45µm nylon filters, washed with methanol, dried at 90°C for 45<br />
minutes and then analyzed by XRD and TGA.<br />
21
CHAPTER 2 MATERIALS AND METHODS<br />
2.2.8. Synchrotron-based X-ray absorption spectroscopy (XAS)<br />
2.2.8.1. Data collection and reduction<br />
Synchrotron-based XANES and EXAFS spectra were used to determine the Fe-<br />
containing phases in the complex cement matrix. The spectra were collected at the Fe K-<br />
edge (7112 eV) at beamline BM26A (Dubble) at the European Synchrotron Radiation<br />
Facility (ESRF) Grenoble, France, and beamline X10DA (SuperXAS) at the Swiss Light<br />
Source (SLS). Both beamlines are equipped with a Si (111) crystal monochromator. The<br />
monochromator angle was calibrated by assigning the energy of 7112 eV to the first<br />
inflection point of the K-adsorption edge of Fe metal foil. The XANES and EXAFS<br />
measurements were carried out at room temperature in transmission (ionization<br />
chambers, Oxford Instruments) and in fluorescence mode (BM26A: 9 channel monolithic<br />
Ge-solid-state detector; X10DA: 13 element Ge-solid-state detector). A minimum of<br />
three scans were collected up to k ~ 13 Å −1 and averaged for each sample.<br />
EXAFS data reduction was performed with the IFEFFIT (ATHENA) software package<br />
following standard procedures [38, 39]. Background subtraction and normalization were<br />
carried out by fitting a first-degree polynomial to the pre-edge and a third-degree<br />
polynomial to the post-edge range of the spectra. The energy was converted to<br />
photoelectron wave vector units (Å -1 ) by assigning the ionization energy of the Fe K-edge<br />
(7112 eV), E0, to the first inflection point of the absorption edge or half height of the<br />
edge step, respectively. The radial structural function (RSF) was obtained by Fourier<br />
transforming k 3 -weighted χ(k) functions between 2.0 and 11.5 Å −1 using a Kaiser-Bessel<br />
window function with a smoothing parameter of 4. A multi shell approach was employed<br />
for data fitting. Theoretical single scattering paths were calculated with FEFF8 using the<br />
Al-analogues structure as model compounds. The amplitude reduction factor (S0 2 ) was set<br />
22
CHAPTER 2 MATERIALS AND METHODS<br />
at 0.75. For the hydrated cement spectra, pre-edge background subtraction and<br />
normalization were performed. The spectrum of at least one reference compound was<br />
used at each campaign to evaluate energy calibration at the beam lines and when needed<br />
to adjust the data on the same energy scale.<br />
2.2.8.2. Data analysis and fitting<br />
Normalized XANES spectra and the k 3 -weighted EXAFS spectra in the k-range between<br />
2.0 and 11.5 Å −1 were used for data analysis and fitting. Analysis of XANES and EXAFS<br />
spectra from the cement pastes was based on the assumption that relevant species of the<br />
absorber atom contributed to the overall signal. The latter analysis was based on principal<br />
component analysis (PCA) and target transformation (TT) according to procedures<br />
described in detail elsewhere and using the Labview software package of beamline 10.3.2<br />
[27, 30, 40, 41]. Principal component analysis was used to determine whether a set of<br />
spectra could be represented as linear combination of a smaller number of independent<br />
component spectra. The indicator value of Malinowsky (IND) is commonly used as<br />
criterion to determine the minimum number of independent components sufficient to<br />
reconstruct the set of experimental spectra [42]. Calculation of the IND factor was<br />
performed for the XANES range (30 eV below the absorption edge to 150 eV above the<br />
absorption edge) and the EXAFS range (3.0 Å −1 ≤ k ≤ 10.0 Å −1 ). Both approaches led to<br />
similar results. The use of TT allowed testing which spectra of the Fe-containing cement<br />
minerals were necessary to reconstruct the set of spectra.<br />
In this study PCA/TT was applied to gain information on the number and type of Fe<br />
species (Fe-containing minerals) in the cement matrix. Based on this information a least-<br />
square linear combination (LC) fitting as implemented in the IFEFFIT software package<br />
23
CHAPTER 2 MATERIALS AND METHODS<br />
(ATHENA) was applied to determine the contribution of the XANES or EXAFS spectra<br />
of the individual reference compounds, respectively, to the experimental XANES or<br />
EXAFS spectra of the hydrated cement paste (HCP) samples. Thus, all HCP spectra can<br />
be represented as a sum of the spectra of Fe reference compounds with coefficients<br />
(weights) between 0 and 1. For example, a reference spectrum with a coefficient ~1<br />
indicates the contribution of a single component to the HCP spectra. This further implies<br />
that the coordination environments of Fe in the reference compound and that in the HCP<br />
samples are identical.<br />
2.2.9. Calorimetry<br />
A conduction calorimeter (Thermometric TAM Air) was used to determine the rate of<br />
hydration heat during the first 72 hours. 2.00 g synthetic Fe-cements were weighed into a<br />
flask and the corresponding amount of water was added (2.00 ml). The flask was tightly<br />
closed and placed into the calorimeter. Internal mixing was done by a small stirrer for<br />
1 min.<br />
2.3. Thermodynamic modeling<br />
Thermodynamic modeling was carried out using the geochemical code GEMS [43].<br />
GEMS is a broad-purpose geochemical modeling code, which computes equilibrium<br />
phase assemblage and speciation in a complex chemical system from its total bulk<br />
elemental composition. Chemical interactions involving solids, solid solutions, gas<br />
mixture and aqueous electrolyte are considered simultaneously. The default database of<br />
24
CHAPTER 2 MATERIALS AND METHODS<br />
the GEMS code was used, which is based on the PSI chemical thermodynamic database<br />
[44] merged with the slop98.dat database for temperature and pressure corrections [45].<br />
2.3.1. Estimation of heat capacity of Fe-containing phases<br />
The heat capacity, Cp°, of a solid can be expressed as a function of temperature using the<br />
parameters (a0, a1, a2 and a3) according to:<br />
Cp o = a0 + a1T + a2T -2 + a3T -0.5<br />
In this study the heat capacities Cp° for Fe-containing phases were calculated based on<br />
the Cp° of the structurally similar Al-analogues [46] using reference reactions as shown<br />
in Table 3. If such reference reactions involve only solids and no “free” water, the change<br />
in heat capacity and the entropy is approximately zero [47, 48].<br />
Table 3 Reference reactions used to estimate unknown heat capacities of cement minerals.<br />
Phases Reference reaction<br />
3CaOFe2O3CaCO312H2O → 3CaOAl2O3CaSO412H2O - Al2O3 - CaSO4 + Fe2O3 +CaCO3<br />
3CaOFe 2O 3Ca(CO 3) 0.510H 2O → 3CaOAl 2O 3CaSO 412H 2O - CaSO 42H 2O - Al 2O 3 + Fe 2O 3 + 0.5CaCO 3 + 0.5CaO<br />
3CaOFe2O3CaSO412H2O → 3CaOAl2O3CaSO412H2O - Al2O3 + Fe2O3<br />
3CaOFe2O3CaCl210H2O → 3CaOAl2O3CaSO412H2O - CaSO4 . 2H2O - Al2O3 + Fe2O3 + CaCl2<br />
3CaOFe2O3Ca(OH)212H2O → 3CaOAl2O3CaSO412H2O - CaSO4 - Al2O3 + Fe2O3 + Ca(OH)2<br />
3CaOFe 2O 36H 2O → 3CaOAl 2O 36H 2O - Al 2O 3 + Fe 2O 3<br />
3CaOFe2O30.95SiO24.1H2O →3CaOAl2O36H2O - Al2O3 +0.95SiO2 + 1.9CaO -1.9Ca(OH)2+ Fe2O3<br />
3CaO.Fe2O31.52 SiO2.2.96H2O →3CaOAl2O36H2O - Al2O3 +1.52SiO2 + 3.04CaO -3.04Ca(OH)2+ Fe2O3<br />
3CaOAl2O30.41 SiO25.18H2O →3CaOAl2O36H2O +0.41SiO2 + 0.82CaO + 0.82Ca(OH)2<br />
3CaOAl 2O 30.84 SiO 24.32H 2O →3CaOAl 2O 36H 2O +0.84SiO 2 + 1.68CaO + 1.68Ca(OH) 2<br />
2.3.2. Determination of solubility products<br />
The measured composition of the liquid phase was used to calculate solubility products<br />
for the different solids. The activity coefficients of the dissolved species were calculated<br />
25
CHAPTER 2 MATERIALS AND METHODS<br />
from the measured concentration. The activity coefficients of aqueous species yi were<br />
computed with the expanded extended Debye-Hückel equation in Truesdell-Jones form<br />
with individual parameters ai (dependent on ion size) and common third parameter by:<br />
2<br />
Ay<br />
zi<br />
log i <br />
1<br />
B a<br />
I<br />
by<br />
I<br />
I<br />
y i<br />
where zi denotes the charge of species i, I the effective molal ionic strength, by is a semi-<br />
empirical parameter (0.064 was used to calculate the solubility of Fe-<br />
monocarbonate/hemicarbonate and 0.123 for KOH electrolytes for the other Fe-<br />
containing phases at 25 °C), and Ay and By are P, T-dependent coefficients. This activity<br />
correction is thought to be applicable up to 1-2 M ionic strength [43]. The aqueous ion<br />
activities and speciation were calculated using the GEMS database relevant to the<br />
particular calculations. The solubility products were calculated from the activities<br />
obtained according to the reactions given in Table 4. From the calculated total solubility<br />
products, the Gibbs free energy of the reaction,<br />
according to:<br />
<br />
0<br />
r,<br />
T G RT<br />
ln K S 0,<br />
T<br />
at a temperature T was computed<br />
0<br />
r,<br />
T G<br />
where R = 8.31451J/(mol K) is the universal gas constant and T is the temperature in<br />
Kelvin.<br />
The temperature dependence of the solubility product of Fe-containing phases was<br />
computed based on the solubility measured at 20, 50 and 80 °C with the help of GEMS,<br />
using the built-in three-term temperature extrapolation function and the relationships<br />
shown in the equations below [49]. The three-term temperature extrapolation assumes<br />
26
CHAPTER 2 MATERIALS AND METHODS<br />
0<br />
that the heat capacity of the reaction, rC p , is constant in the considered temperature<br />
range.<br />
A2<br />
A0<br />
A lnT<br />
;<br />
T<br />
log KT 3<br />
0.<br />
4343<br />
R<br />
0<br />
0<br />
SCp 1lnT <br />
A0 r T0<br />
r T0<br />
0.<br />
4343<br />
<br />
R<br />
0<br />
0<br />
H Cp T <br />
A2 r T0<br />
r T0<br />
0.<br />
4343<br />
A <br />
R<br />
<br />
<br />
0<br />
3 r T0<br />
Cp<br />
<br />
<br />
<br />
T<br />
ln<br />
0 0<br />
0<br />
rST<br />
rST<br />
Cp<br />
0 r T0<br />
T0<br />
0<br />
0<br />
0<br />
rH<br />
T rH<br />
T Cp ( 0 r T0<br />
0<br />
G H T<br />
r<br />
0<br />
T<br />
r<br />
0<br />
T<br />
r<br />
S<br />
0<br />
T<br />
T T<br />
)<br />
0<br />
0<br />
where T0 is the reference temperature (298.15 K), S0 the entropy, H 0 the enthalpy and G 0<br />
the Gibbs free energy. A more detailed description of the temperature corrections used in<br />
GEMS is given elsewhere [50] and in the online documentation of GEMS. The value of<br />
0<br />
the heat capacity of the reaction, rC p , has little influence on the calculated log K values<br />
in the temperature range 0-100 °C. Generally, the difference between the 3-term<br />
extrapolation and the more complete description using 7 terms is usually negligible in the<br />
temperature range from 0 to 100 °C [51].<br />
The entropy S° was adjusted to obtain the best fit between the measured solubility data at<br />
different temperatures and the calculated solubility products. As only solubility products<br />
at two or three different temperatures were available, only the entropy was fitted, while<br />
27
CHAPTER 2 MATERIALS AND METHODS<br />
the heat capacities Cp° for Fe-containing phases was calculated based on a reference<br />
reaction in Table 3. In addition, as discussed above, the value of the heat capacity has<br />
only little influence on the calculated solubility products in the temperature range 0-100<br />
°C, which makes it insensitive to the fitting procedure. Table 4 and Table 5 summarize<br />
the thermodynamic data used and obtained in this study.<br />
28
CHAPTER 2 MATERIALS AND METHODS<br />
Table 4 Dissolution reaction used for thermodynamic calculation.<br />
Phases Reactions log KS0 ref<br />
Al-katoite Ca3Al2 (OH)12 → 3Ca 2+ +2Al(OH)4 − + 4OH − -20.56 d<br />
Fe-katoite Ca3Fe2 (OH)12 → 3Ca 2+ +2Fe(OH)4 − + 4OH − -25.56 d<br />
Si-poor Al-siliceous hydrogarnet Ca3Al2(SiO4)0.41(OH)10.36→ 3Ca 2+ +2AlO2 − + 0.41HSiO3 2− + 3.59OH − + 3.18H2O -25.47 d<br />
Si-rich Al-siliceous hydrogarnet Ca3Al2(SiO4)0.84(OH)8.64 → 3Ca 2+ +2AlO2 − + 0.84HSiO3 2− + 3.16OH − + 2.32H2O -26.70 d<br />
Si poor Fe-siliceous hydrogarnet Ca3Fe2(SiO4)0.95(OH)8.2 → 3Ca 2+ +2FeO2 − + 0.95HSiO3 2− + 3.05OH − + 2.1H2O -32.75 d<br />
Si rich Fe-siliceous hydrogarnet Ca3Fe2(SiO4)1.52(OH)5.92 → 3Ca 2+ +2FeO2 − + 1.52HSiO3 2− + 2.48OH − + 0.96H2O -34.68 d<br />
Al-ettringite Ca6Al2(SO4)3(OH)12·26H2O → 6Ca 2+ +2Al(OH)4 − + 3SO4 2− +4OH − +26H2O -44.90 a, c<br />
Fe-ettringite Ca6Fe2(SO4)3(OH)12·26H2O → 6Ca 2+ +2Fe(OH)4 − + 3SO4 2− +4OH − +26H2O -44.00 a, b<br />
Al- hydroxy AFm Ca4Al2(OH)12·7H2O → 4Ca 2+ +2Al(OH)4 − + 6OH − +6H2O -25.40. a<br />
Fe- hydroxy AFm Ca4Fe2(OH)12·7H2O → 4Ca 2+ +2Fe(OH)4 − + 6OH − +6H2O -30.64 d<br />
Al-monosulfate Ca4Al2(SO4)(OH)12·6H2O → 4Ca 2+ +2Al(OH)4 − + SO4 2− +4OH − +6H2O -29.26 a, c<br />
Fe-monosulfate Ca4Fe2(SO4)(OH)12·6H2O → 4Ca 2+ +2Fe(OH)4 − + SO4 2− +4OH − +6H2O -31.57 d<br />
Al-monocarbonate Ca4Al2(CO3)(OH)12·5H2O → 4Ca 2+ +2Al(OH)4 − + CO3 2− +4OH − + 5H2O -31.47 a, c<br />
Fe-monocarbonate Ca4Fe2(CO3)(OH)12·6H2O → 4Ca 2+ +2Fe(OH)4 − + CO3 2− +4OH − + 6H2O -34.59 d<br />
Al-hemicarbonate Ca4Al2(CO3)0.5(OH)12·6H2O → 4Ca 2+ +2Al(OH)4 − + 0.5CO3 2− +5OH − + 5.5H2O -29.13 a, c<br />
Fe-hemicarbonate Ca4Fe2(CO3)0.5(OH)12·4H2O → 4Ca 2+ +2Fe(OH)4 − + 0.5CO3 2− +5OH − + 3.5H2O -30.83 d<br />
Al-Friedel’s salt Ca4Al2(Cl2)(OH)12·4H2O → 4Ca 2+ +2Al(OH)4 − + 2Cl − +4OH − + 4H2O -27.69 f<br />
Fe-Friedel’s salt Ca4Fe2(Cl2)(OH)12·4H2O → 4Ca 2+ +2Fe(OH)4 − + 2Cl − +4OH − + 4H2O -28.62 d<br />
Fe(OH)3 (am.) Fe(OH)3 + OH - → Fe(OH)4 - -2.60 e<br />
Fe(OH)3 (microcr.) Fe(OH)3+ OH - → Fe(OH)4 - -4.10 d<br />
Al(OH)3 (am.) Al(OH)3+ OH - → Al(OH)4 - 0.24 a<br />
Gibbsite Al(OH)3+ OH - → Al(OH)4 - -1.24 e<br />
Gypsum CaSO4 2H2O → Ca 2+ + SO4 2- + 2H2O -4.58 e<br />
Portlandite Ca(OH)2 → Ca 2+ + 2OH - -5.2 d<br />
Calcite CaCO3 →Ca 2+ + HCO3 − 1.85 e<br />
(a ) Lothenbach et al [3], (b) Möschner et al [15], (c) Matschei. et al [52], (d) this study<br />
(e) GEMS/PSI TDB [45, 53]. (f) Balonis et al [54]<br />
29
CHAPTER 2 MATERIALS AND METHODS<br />
Table 5 Thermodynamic data at standard conditions (298 K, 1 atm) used for the calculation of the<br />
liquid phase compositions and for computation of thermodynamic parameters for the<br />
synthesized solids.<br />
fG° fH° S 0 C 0 p 1 a0 a1 a2 a3 V 0 Ref.<br />
Phase [kJ/mol] [kJ/mol] [J/K/mol] [J/mol/K] [J/(mol.K)] [J/(mol.K 2 )] [J K/mol] [J/(mol.K 0.5 )] [cm3/mol]<br />
Al-katoite -5008.5 -5535 432 459 292 0.5610 150 d<br />
Fe-katoite -4118.6 -4724 165 485 275 0.0627 0 155 d<br />
Si-poor Al-siliceous hydrogarnet -5193.5 -5717 342 441 198 0.5967 -9.98E+05 1312 151 d<br />
Si-rich Al-siliceous hydrogarnet -5365.2 -5867 310 422 100 0.6342 -2.05E+06 2688 142 d<br />
Si-poor Fe-siliceous hydrogarnet -4523.5 -4854 855 612 582 0.6094 2.02E+06 -3040 156 d<br />
Si-rich Fe-siliceous hydrogarnet -4752.8 -5044 847 688 766 0.5988 2.29E+06 -4864 161 d<br />
Al-ettringite -15205.9 -17535 1900 2174 1939 0.7890 0 0 707 a<br />
Fe-ettringite -14282 -16600 1937 2200 1922 0.8550 2.02E+06 0 717 a, b<br />
Al-hydroxy AFm -7326.6 -8300 708 930 711 1.0470 0 -1600 274 b<br />
Fe-hydroxy AFm -6438 -7431 640 956 694 1.1134 2.02E+06 -1600 286 d<br />
Al-monosulfate -7778.5 -8750 821 942 594 1.1680 0 0 309 a, c<br />
Fe-monosulfate -6873.2 -7663 1430 968 577 1.2340 2.02E+06 0 321 d<br />
Al-monocarbonate -7337.5 -8250 657 881 618 0.9820 -2.59E+06 0 262 a, c<br />
Fe-monocarbonate -6674 -7485 1230 950 612 1.1600 -5.73E+05 0 292 d<br />
Al-hemicarbonate -7336 -8270 713 906 664 1.0140 -1.30E+06 -800 285 a, c<br />
Fe-hemicarbonate -5952.9 -6581 1270 841 308 1.2014 -9.08E+05 3200 273 d<br />
Al-Friedel’s salt -6814.6 -7625 731 829 498 0.8900 -2.03E+06 1503 272 f<br />
Fe-Friedel’s salt -5900.1 -6525 1286 855 481 0.9611 -16130 1503 208 d<br />
Al(OH)3 (am.) -1143 -1281 70 93 36 0.1910 0 0 32 a<br />
Gibbsite -1151 -1289 70 93 36 0.1910 0 0 32 e<br />
Fe(OH)3 (am.) -700 -879 88 43 28 0.0520 0 0 34 e<br />
Fe(OH)3 (microcr.) -709 -841 88 43 28 0.0520 0 0 34 d<br />
Gypsum -1798 -2023 194 186 91 0.3180 0 0 75 e<br />
Portlandite -897 -985 83 88 187 -0.0220 0 -1600 33 e<br />
Calcite -1129 -1207 93 82 105 0.0220 -2.59E+05 0 37 e<br />
CaO -604 -635 40 43 49 0.0040 -6.53E+05 0 17 e<br />
Al2O3 -1568 -1662 51 79 115 0.0180 -3.51E+06 0 26 e<br />
Fe2O3 -8214 -8214 88 105 98 0.0780 -1.49E+06 0 30 e<br />
References: a ) Lothenbach et al. [3], b) Möschner et al. [15], (c) Matschei et al. [52], d) this study, e) Thoenen et al. and Hummel et<br />
al. [44, 45], f) Balonis et al. [54]<br />
1 Cp o = a0 + a1T + a2T -2 + a3T -0.5 , Si-poor and Si-rich Al-siliceous hydrogarnet do not form at room temperature<br />
30
CHAPTER 2 MATERIALS AND METHODS<br />
2.3.3. Thermodynamics of solid solutions<br />
Solid solutions are frequently encountered in cementitious systems [7, 16, 54-56].<br />
According to the definition given in Bruno et al. [57], a solid solution is a homogeneous<br />
crystalline structure in which one or more types of atoms or molecules are partly<br />
substituted without changing the structure, although the lattice parameters may vary. If<br />
the size and crystal lattice between host and substituting ion are similar, the formation of<br />
an ideal solid solution is probable. The larger the difference, the stronger is the tendency<br />
to non-ideality [57, 58] and thus the tendency for the presence of miscibility gaps.<br />
Thermodynamically, an ideal solid solution forms if the enthalpy of mixing is zero. Any<br />
other solid solution is called non-ideal. The presence of ideal or non-ideal solid solutions<br />
can stabilize the formation of these solids and may result in a significant lowering of<br />
dissolved ion concentrations. Ideal solid solutions are always more stable than the<br />
mechanical mixture of the end-members and thus stabilize the formation of the solid<br />
solution with respect to other solids.<br />
A very short summary of the thermodynamics of solid solution is given here, based on<br />
the comprehensive books of Bruno et al. [57] and Anderson and Crerar [47]. A pure<br />
phase has only one fixed, constant stoichiometry, i.e. it consists of only one mineral e.g.<br />
portlandite Ca(OH)2; its activity is equal to one. In contrast, a solid solution has a<br />
variable bulk composition and can be described by two (or more) end-members which are<br />
present in varying concentrations in the solid solution. Each end-member, however, has a<br />
fixed elemental stoichiometry. Generally one distinguishes between ideal and non-ideal<br />
solid solutions.<br />
The molar Gibbs free energy of a solid solution between different end-members can be<br />
calculated according to:<br />
31
CHAPTER 2 MATERIALS AND METHODS<br />
0<br />
X i<br />
f Gi<br />
RT<br />
X i ln X i RT<br />
G<br />
G<br />
G<br />
G<br />
<br />
X ln<br />
ss<br />
mm<br />
is<br />
ex<br />
i i<br />
i<br />
The first term of the above equation, Gmm, is related to mechanical mixing of the end-<br />
members and is calculated using the mole fraction Xi = ni/ni (ni is the mole amount of<br />
the end member i; Xi = 1) and fGi 0 - the standard molar Gibbs energy of formation of<br />
end-member i. The second term is the Gibbs free energy related to the ideal solid solution<br />
Gis with activity coefficients equal to 1. The last term is the excess free-energy of<br />
mixing, Gex, due to non-ideality. The excess Gibbs energy of mixing is only needed to<br />
compute thermodynamic properties of non-ideal solid solutions and is calculated as<br />
i<br />
RT ln . In the case of an ideal solid solution, all activity coefficients, I, equal to 1<br />
X i<br />
i<br />
and thus the excess Gibbs free energy of mixing is zero. An ideal solid solution is always<br />
more stable than the mechanical mixture of the end-members as the Gibbs free energy of<br />
the solid solution is lower than the Gibbs free energy of mechanical mixing (the second<br />
term of the above equation is negative (Xi
CHAPTER 2 MATERIALS AND METHODS<br />
The activity coefficients of the non-ideal binary solid solution are calculated as:<br />
lnγi = X 2 2 [0 –1 (3 X1 – X2)]<br />
lnγ2 = X 2 1[0 –1 (3 X2 – X1)]<br />
The software MBSSAS [59] was used to derive the Guggenheim parameters a0 and a1<br />
based on experimentally-observed compositional boundaries of the miscibility gap in<br />
the investigated binary solid solution series. A detailed description of MBSSAS is<br />
given elsewhere [59].<br />
Lippmann developed an algorithm to describe the phase diagram of a binary solid<br />
solution and its relation to the composition of the aqueous phase. A total solubility<br />
product (ΣΠ) was introduced. If the system is in equilibrium, the total solubility product<br />
of a binary solid solution (B1-xCxA) is the sum of the partial solubility products of each<br />
end member. The total solubility product of a binary solid solution (B1-xCxA) can be<br />
calculated from the sum of the partial solubility product of each end members (see the<br />
equations below).<br />
ΣΠSolidus = KBA.XBA.γBA + KCA.XCA.γCA<br />
KBA.XBA.γBA = [B + ][A - ]<br />
KCA.XCA.γCA = [C + ][A - ]<br />
where KBA and KCA are the solubility products of the end members BA and CA; XBA and<br />
XCA are mole fractions of BA and CA in the solid; γBA and γCA are the activity<br />
coefficients as expressed first by the Guggenheim expansion series and then modified by<br />
Redlich and Kister [60]. The above equations are used to derive the solidus curve of the<br />
Lippmann phase diagram as a function of the solid phase. The solutus curve in the<br />
33
CHAPTER 2 MATERIALS AND METHODS<br />
Lippmann phase diagram is described below as a function of the mole fraction of the<br />
liquid phase in the solid solution series.<br />
ΣΠsolutus= 1/( XB,liq/KB.γB+ XC,liq/KC.γC)<br />
The mole fraction of the liquid phase XB,liq and XC,liq are calculated as:<br />
XB,liq = [B + ]/[B + ] +[C + ] = KBA.XBA.γBA/ ΣΠSd<br />
XC,liq = [C + ]/[B + ] +[C + ] = KCA.XCA.γCA/ ΣΠSd<br />
The total solubility products of the solidus and solutus curve of the Lippmann phase<br />
diagram allow the properties of binary solid solution or miscibility gaps to be determined.<br />
The use of solid solution for cement minerals is also explained in details in the paper of<br />
Möschner et al. [16, 61, 62] and in the thesis of Matschei et al. [63].<br />
2.3.4. Thermodynamic modeling of cement hydration<br />
Cement hydration was modeled based on the measured composition of the cements used<br />
in this study (Table 1). GEMS together with a set of equations that describe the<br />
dissolution as a function time was used to predict the solid phase formed during hydration<br />
process [4, 6, 64]. The calculations were carried out using the cement database<br />
Cemdata2007 [3, 7, 15]. The thermodynamic properties of Fe-containing hydrates were<br />
updated using the data derived in this thesis and Al-containing siliceous hydrogarnets<br />
were updated using the data derived in this thesis (see Table 5). As the Al-containing<br />
siliceous hydrogarnets did not form at room temperature, but only hydrothermally, their<br />
formation was suppressed in the calculations of cement hydration. A more detailed<br />
procedure of modeling of the hydration of cement is reported e.g. in [3, 6, 65].<br />
34
CHAPTER 3 SYNTHETIC FE-CONTAINING HYDRATES<br />
3. SYNTHETIC FE-CONTAINING HYDRATES<br />
3.1. Iron containing carbonate AFm phases 1<br />
3.1.1. Introduction<br />
The main hydration products of Portland cements include C-S-H (calcium silicate<br />
hydrate), portlandite, ettringite and AFm (Al2O3-Fe2O3-mono) phases. AFm phases are<br />
formed from C3A (3CaOAl2O3) and C2(A;F) (Ca2(AlxFe1-x)O5) phases in the presence of<br />
carbonates, sulfates, chlorides and hydroxide during the hydration of Portland cement.<br />
The general formula is Ca2(Al,Fe)(OH)6XnH2O, where X denotes a single charged or<br />
half of a double charged anion which occupies the interlayer sites. Among possible<br />
anions are OH - , SO4 2- , CO3 2- and Cl - . AFm phases have a layered structure composed of<br />
two layers, a positively charged main layer [Ca2(Al,Fe) (OH)6] + and a negatively charged<br />
[XnH2O] - interlayer. The main layer consists of sheets of Ca(OH)6 octahedral ions, as in<br />
portlandite, in which every third Ca 2+ is substituted by Al 3+ and/or Fe 3+ .<br />
Cements are sensitive to carbonation which can lead to the formation of hemicarbonate<br />
3CaO(AlxFe1-x)2O3(CaCO3)0.5(Ca(OH)2)0.5nH2O and/or monocarbonate 3CaO(AlxFe1-<br />
x)2O3(CaCO3)mH2O, x=0 to 1. Al-monocarbonate (Al-Mc) has a triclinic<br />
pseudohexagonal symmetry [66]. The solubility products of Al-monocarbonate and<br />
hemicarbonate have been determined experimentally in the range of 5 to 85 °C [7]. The<br />
stability of these phases has an impact on the bulk chemistry of cements as the formation<br />
of hemi- and/or monocarbonate indirectly stabilizes ettringite. This results in a higher<br />
volume of hydrated phases which can contribute to the improvement in mechanical<br />
properties of cements [65, 67]. It has been shown that Al-hemicarbonate (Al-Hc) and<br />
1 This chapter has been published in Cement and Concrete Research, 41 (2011).<br />
35
CHAPTER 3 SYNTHETIC FE-CONTAINING HYDRATES<br />
hydroxy-AFm are unstable with respect to Al-monocarbonate in the presence of calcite<br />
[2, 65].<br />
OPC contains around 3-7 % of Fe2O3. During hydration, Fe-containing AFm and/or Fe-<br />
AFt phases may form. The extent to which Fe is present in AFm and AFt-phases will<br />
influence strongly the amount of AFt and AFm phases present and thus the volume of the<br />
hydrates and the properties of the hydrated cement. Understanding the characteristic of<br />
the hydrates in complex cement matrices is important since the material properties of<br />
cement-based materials are related to the chemical environment and the thermodynamic<br />
properties of the hydrated phases.<br />
Until recently only rough estimates of the solubility products of Fe-containing<br />
monocarbonate and hemicarbonate have been available [3], where the solubility has been<br />
estimated based on the solubility of the Al-containing phases. The first experimental data<br />
on the solubility of Fe-monocarbonate were estimated from Fe-ettringite experiments<br />
where contamination with CO2 led to the formation of Fe-Mc [15].<br />
The formation of solid solutions can play an important role in stabilizing these solids.<br />
Solid solutions between anions in the interlayer structure of Al-containing AFm phases<br />
are common [52, 68, 69]. The existence of a solid solution between the Al- and Fe-<br />
ettringite has been reported [16]. It is unclear, however, to what extent Fe and Al in the<br />
main layer of AFm phases form solid solutions.<br />
In this section Fe-containing monocarbonate and hemicarbonate and the solid solution<br />
series with their aluminum analogues were synthesized to study their structure and<br />
solubility. Different techniques were used to characterize the synthesized solids.<br />
Synchrotron X-ray powder diffraction and Raman spectroscopy were used to determine<br />
the crystal structure of the Fe-monocarbonate. The solubility products of Fe-Mc and Fe-<br />
36
CHAPTER 3 SYNTHETIC FE-CONTAINING HYDRATES<br />
Hc were determined experimentally and compared with their Al analogues. The solubility<br />
products were used together with thermodynamic data for the other cement minerals [3]<br />
to model the hydrate assemblages of hydrated Portland cement in the presence of CaCO3<br />
and CaSO4.<br />
3.1.2. Fe-hemicarbonate<br />
The formation of Fe-Hc was studied at different equilibration times in samples containing<br />
less calcite than the samples used to prepare Fe-Mc. The XRD pattern shows the<br />
formation of an AFm phase, labeled Fe-Hc in Fig. 5 with a peak around 7.48 Å. It is<br />
known from Al-containing AFm phases that generally Al-Hc is formed first and converts<br />
to Al-Mc with time if calcite is present [2, 65]. As the solutions contain only calcium,<br />
iron, hydroxide and carbonate, it was tentatively concluded that the observed phase<br />
corresponds to Fe-hemicarbonate. After 180 days and longer, the formation of Fe-Mc was<br />
observed. In addition, significant quantities of calcite and portlandite were observed at all<br />
times. A reddish color indicated the presence of X-ray amorphous iron hydroxide.<br />
37
Intensity (arb. untits)<br />
CHAPTER 3 SYNTHETIC FE-CONTAINING HYDRATES<br />
Fe-Mc<br />
Fe-Hc<br />
C 2F<br />
10 11 12 13 14<br />
2θCuKα<br />
1 year<br />
180 days<br />
28 days<br />
7 days<br />
Fig. 5 Time-dependent XRD pattern of Fe-Hc (and Fe-Mc) synthesized at 20 °C; C2F:<br />
differentiated relative weight Weight loss in %<br />
100<br />
-0.1<br />
-0.2<br />
-0.3<br />
2CaOFe2O3, Fe-Mc: Fe-monocarbonate, Fe-Hc: Fe-hemicarbonate.<br />
90<br />
80<br />
70<br />
60<br />
Fe-Hc/Fe-Mc<br />
CH<br />
200 400 600 800<br />
Temperature °C<br />
C<br />
7 days<br />
180 days<br />
1 year<br />
Fig. 6 TGA and DTG curves of Fe-Hc formation at 20 °C for different equilibration times. CH:<br />
Portlandite, C: carbonates.<br />
Ecker et al. [70] also observed a peak at 7.49 Å when the sample was dried at 35%<br />
relative humidity, which they attributed to the formation of a triclinic Fe-Mc. They also<br />
found a peak at around 8.05 Å that was attributed to Fe-Hc. However, the assignments<br />
were done by interpolation of the data from the study of the 3CaO.Al2O3.CaCO3.11H2O -<br />
38
CHAPTER 3 SYNTHETIC FE-CONTAINING HYDRATES<br />
3CaO.Fe2O3.CaCO3.12H2O systems and they could not synthesize the phase without the<br />
presence of Al.<br />
In the system studied here, i.e free of Al, the peak at 7.48 Å shows no change with<br />
variation from 90 to 20% relative humidity in the XRD in situ climate chamber and no<br />
peak at 8.05 Å has been observed. The difference with previous results [70] may be<br />
explained by the absence of Al in the preparation.<br />
The large difference in the layer thickness of Fe-Hc (d = 7.48 Å) compared to Al-<br />
hemicarbonate (3CaO.Al2O3.(CaCO3)0.5.(CaO)0.5.12H2O) (d = 8.24 Å) indicates the<br />
presence of less water (and/or carbonate) in Fe-Hc than in Al-Hc. In the CaO-Al2O3-<br />
CaCO3-H2O system, the Al-Hc appears first and then disappears with time to form Al-Mc<br />
[2, 65]. Depending on the drying condition, the Al-Hc layer thickness may vary from 6.6<br />
Å (3CaO.Al2O3.(CaCO3)0.5.(CaO)0.5.6.5H2O) to 8.2Å<br />
(3CaO.Al2O3.(CaCO3)0.5.(CaO)0.5.12H2O) [71]. Based on the comparison with the Al<br />
system and on the TGA data after 180 days (Fig. 6) an interlayer water content of 3 to 4<br />
H2O molecules could be roughly estimated for the Fe-Hc phase investigated. Thus we<br />
may suggest that the peak at 7.48 Å can be attributed to Fe-Hc with an amount of water<br />
close to 10: 3CaO.Fe2O3.(CaCO3)0.5.(CaO)0.5.10H2O. However, the instability of this<br />
phase and its conversion to Fe-Mc did not permit structural investigation and the<br />
carbonate and water content could not be precisely determined. The formation of C4FH13<br />
would also have been possible, but again the measured interlayer thickness does not fit<br />
either the 7.94 Å reported for C4AH13 or the 7.35 Å reported for C4AH11 [71]. In addition,<br />
the amount of calcite clearly reduced after 180 days.<br />
Fig. 6 shows the TGA curve caused by the loss of weight from Fe-Hc at different<br />
39
CHAPTER 3 SYNTHETIC FE-CONTAINING HYDRATES<br />
equilibration times. After 180 days equilibration the main loss of weight was between<br />
110 and 180 °C, caused by the loss of 3-4 interlayer water molecules from Fe-Hc.<br />
However, after 1 year equilibration, the loss of weight in the same temperature range was<br />
due to loss of water from both Fe-Hc and Fe-Mc.<br />
3.1.3. Fe-monocarbonate<br />
3.1.3.1. Kinetics of formation<br />
Fig. 7 shows the XRD patterns of Fe-Mc at 20 °C as a function of equilibration time. The<br />
reaction of pure ferrite was slow and its counter was significantly lowered solely after<br />
120 days. Both Fe-Mc and Fe-Hc were present after 120 days. However, after 3 years,<br />
only Fe-Mc was observed with some traces of calcite and portlandite. The latter sample<br />
was further used for the structural determination (solution and refinement) of Fe-Mc<br />
reported below. In the XRD patterns a shoulder at around 11.39° 2θ was observed, in<br />
which the intensity decreased with drying. The synthesized solids had a slightly reddish<br />
color, suggesting the presence of small amounts of Fe-hydroxide not detectable by XRD.<br />
Intensity [arb . units]<br />
Fe-Mc<br />
*<br />
Fe-Hc<br />
C 2F<br />
3 years<br />
1 year<br />
120 days<br />
28 days<br />
7 days<br />
10 11 12 13 14<br />
2CuK 2CuK<br />
Fig. 7 Time-dependent XRD pattern of Fe-Mc formed at 20 °C. * unidentified<br />
40
CHAPTER 3 SYNTHETIC FE-CONTAINING HYDRATES<br />
C4FH13 (4CaOFe2O313H2O) was not observed in any of the experiments. The presence<br />
of calcite destabilized the C4FH13 phase, which led to the formation of carbonate<br />
containing Fe-AFm as previously reported [12, 15]. This phenomenon was also observed<br />
for the Al analogues [52, 72].<br />
The thermogravimetric curve of Fe-Mc (Fig. 8) shows several weight loss between 80°<br />
and 800°C. The first mass losses below 240 °C indicates the loss of the 6 waters<br />
molecules from the interlayer of Fe-Mc as previously observed for Al-Mc [73]. The<br />
weight loss up to 500 °C is due the removal of the remaining 6 waters molecules from the<br />
main layer and decomposition of traces of portlandite. The weight loss at about 700 °C is<br />
due to the loss of CO2 from Fe-Mc and from calcite. The peak areas of calcite and<br />
portlandite were found to decrease with hydration time while the Fe-Mc peaks increased.<br />
This finding further substantiates that the formation of synthetic Fe-Mc was completed<br />
only after long hydration times.<br />
weight loss in %<br />
differentiated relative weight<br />
100<br />
90<br />
80<br />
70<br />
60<br />
-0.1<br />
-0.2<br />
-0.3<br />
Fe-Mc<br />
Fe-Mc<br />
CH<br />
200 400 600 800<br />
Temperature (°C)<br />
C<br />
7days<br />
120 days<br />
3 years<br />
Fig. 8. TGA and DTG curves of Fe-Mc formation at 20 °C for different equilibration times. CH:<br />
Portlandite, C: carbonates.<br />
41
CHAPTER 3 SYNTHETIC FE-CONTAINING HYDRATES<br />
3.1.3.2. Effect of temperature<br />
X-ray diffraction and the TGA measurements revealed that the formation of Fe-Hc and<br />
Fe-Mc was faster at 50 °C (Table 11). First indications of the formation of Fe-Mc were<br />
observed after 7 days of equilibration. The TGA and XRD data further revealed that after<br />
28 days and longer the intensities of portlandite and calcite increased while the peaks of<br />
Fe-Mc decreased, thus suggesting instability of Fe-Mc with regard to calcite, portlandite<br />
and Fe-oxide/hydroxide at higher temperature and longer equilibration time. At 50 °C<br />
and 80 °C the diffraction pattern also indicates the presence of hematite (Fe2O3) (Fig. 9).<br />
At 80 °C, neither Fe-Hc nor Fe-Mc was observed. Hematite, calcite and portlandite were<br />
the only phases identified. The color of the solid formed was dark red, confirming the<br />
presence of Fe-oxide/hydroxide [15]. The findings show that Fe-Mc is unstable at 80 °C<br />
and decomposes to Fe2O3, calcite and portlandite.<br />
Intensity (arb. units)<br />
Fe-Mc<br />
Fe-Hc<br />
CH<br />
Fe-Mc<br />
Fe 2O 3<br />
Fe-Hc<br />
CH<br />
10 20<br />
2CuK 2CuK<br />
30<br />
C<br />
Fe 2 O 3<br />
CH<br />
80 °C<br />
50 °C<br />
20 °C<br />
Fig. 9 Comparison of XRD pattern of Fe-Mc equilibrated for one year at 20, 50 and 80 °C. CH:<br />
portlandite, C: carbonate, Fe2O3: hematite.<br />
42
CHAPTER 3 SYNTHETIC FE-CONTAINING HYDRATES<br />
3.1.3.3. Structure of Fe-Mc<br />
The virtually single phase (absence of Fe-Hc phase) Fe-Mc sample obtained after 3 years<br />
reaction time was subject to crystallographic structure determination using synchrotron<br />
powder XRD. High quality diffraction data allowed the structure of Fe-Mc to be solved<br />
and refined. The sample was composed of 89 wt. % (weight percent) of the studied Fe-<br />
Mc phase with some impurities of calcite (11 wt. %). The crystal data and multi-pattern<br />
refinement (using data from two samples to detector distances) parameters are<br />
summarized in Table 6 while a Rietveld plot (corresponding to data from the sample to<br />
detector distance of 150 mm) is shown in Fig. 10.<br />
Table 6 Multi pattern refinement (from two sample-to-detector distances: 1/ 150 mm, and 2/ 350<br />
mm) and crystal data of Fe-Mc.<br />
Compound Iron monocarbonate<br />
Formula 3CaO·Fe2O3·CaCO3·12.18(4)H2O<br />
Structural formula [Ca2Fe(OH)6] + [½CO3·3.08(2)H2O] -<br />
Calculated formula weight (g.mol -1 ) 646.91<br />
T(K) 293 K<br />
System Rhombohedral<br />
Space group c<br />
R3<br />
a (Å) 5.9196 (1)<br />
c (Å) 47.8796 (10)<br />
V (Å 3 ) 1453.01 (4)<br />
Z / Dx (g cm -3 ) 6 / 2.22<br />
Wavelength (Å)1 0.720852<br />
Angular range 2 (°) 1, 2 3.14- 49.16, 2.50- 26.35<br />
Nobs 1, 2 1283, 1111<br />
Excluded regions (°) 5.40-5.61 and 9.03-9.71<br />
Nref 1, 2 288, 52<br />
Rp 1, 2 (%) 3.27, 3.89<br />
Rwp 1, 2 (%) 4.40, 5.37<br />
RBragg 1, 2(%) 4.38, 3.43<br />
RF 1, 2 (%) 4.73, 3.31<br />
N of profile parameters 20<br />
N intensity dependent parameters 15<br />
Fe-Mc was found to crystallise in the rhombohedral R3 c space group, i.e. the highest<br />
symmetry observed for AFm phases, which further corresponds to the symmetry of the<br />
high temperature (HT)-polymorph of Friedel’s salt [74, 75]. The structure is composed of<br />
43
CHAPTER 3 SYNTHETIC FE-CONTAINING HYDRATES<br />
a positively charged main layer [Ca2Fe(OH)6] + and a negatively charged interlayer<br />
[½CO3·3.08(2)H2O] - . The main layer contains of trivalent Fe 3+ cations in hydroxide<br />
octahedral coordination (i.e. substituting Al 3+ cations usually encountered in AFm<br />
phases) and bivalent Ca 2+ cations, which are seven-fold coordinated (6 hydroxyls + 1<br />
water molecule from interlayer). The structure of Fe-Mc can be described by 7 non-H<br />
atomic positions: one atomic position for iron, for calcium, for hydroxyl ions, for water<br />
molecule bonded to Ca 2+ (labeled Ow1), for water molecule weakly bonded in the center<br />
of the interlayer (labeled Ow2 with a refined partial occupancy of 0.36), for carbon atom<br />
from carbonate group (with a fixed partial occupancy of ½ in agreement with the<br />
electroneutrality of the compound) and for oxygen atoms from carbonate (labeled Oc).<br />
Fig. 10 Rietveld plot from powder pattern recorded with a sample-to-detector distance of 150 mm<br />
(red crosses are experimental data, black line is calculated pattern, blue line is the<br />
difference pattern, green sticks are Bragg peaks positions for Fe-Mc and calcite).<br />
The interlayer can be described in terms of a statistical distribution between one<br />
carbonate group and two water molecules. The refined composition is very close to<br />
44
CHAPTER 3 SYNTHETIC FE-CONTAINING HYDRATES<br />
3CaO·Fe2O3·CaCO3·12H2O, which is the composition determined by TGA. Atomic<br />
coordinates of the 7 crystallographic sites are indicated in Table 7, whereas interatomic<br />
distances are given in Table 8.<br />
Table 7 Fractional coordinate of non hydrogen atoms and isotropic displacement.<br />
Atom site X y z Ueq x 10 3 (A 2 ) occ<br />
Fe 6b 0 0 0 9.6 (8) 1.000<br />
Ca 12c 1/3 2/3 0.01134 (4) 8.3 (8) 1.000<br />
OH 36f 0.3863 (6) 0.4006 (5) 0.1447 (1) 1.7 (1) 1.000<br />
Ow1 12c 1/3 2/3 0.0635 (1) 36 (2) 1.000<br />
C 6a 0 0 1/4 65 (5) 0.5(-)<br />
Oc 18e 0 -0.2153(9) 1/4 = Ueq (C) 0.5(-)<br />
Ow2 18e 0 = y (Oc) 1/4 = Ueq (C) 0.368(8)<br />
Table 8 Selected interatomic distances (Å) in Fe-Mc.<br />
Atom atom Distances (Å)<br />
Fe 6 x OH 2.043(5)<br />
Ca 3 x OH 2.385 (8)<br />
3 x OH 2.472 (8)<br />
Ow1 2.50 (1)<br />
C 3 x Oc 1.275 (1)<br />
Ow1 ½ (3 x Oc) 2.58 (2)<br />
½ (2 x Ow2) 2.58 (2)<br />
(Oc,Ow2) 2 x Ow1 2.58 (2)<br />
2 x OH 3.273 (1)<br />
2 x OH 3.50 (1)<br />
Ow2 Ow2 “2.208 (1)”<br />
The accuracy of the refined structural model is reflected by the refined values for the<br />
interatomic distances in the main layer and the interlayer. The only unrealistic Ow2-Ow2<br />
distance of 2.208 Å is attributed to partial occupancies in this region of the structure: one<br />
carbonate anion is statistically distributed with two water molecules in the location at the<br />
center of interlayer.<br />
An equivalent situation (statistical distribution between one carbonate group and three<br />
water molecules) was described earlier in the case of the disordered 4 11 AcH C D <br />
structure [76]. The structure of Fe-Mc is presented in Fig. 11, showing a general<br />
45
CHAPTER 3 SYNTHETIC FE-CONTAINING HYDRATES<br />
representation (Fig. 11a) and details of the network of hydrogen bonding assuming the<br />
cohesion between main and interlayer (Fig. 11b).<br />
a.<br />
b.<br />
Fig. 11a. Projection of the Fe-Mc structure along b axis (the interlayer part of the structure is<br />
ordered for clarity; i.e. the statistical distribution between one carbonate and two water<br />
molecule has been alternatively ordered). b. 3D cohesion in Fe-Mc structure<br />
(representation of the main hydrogen bonds).<br />
46
CHAPTER 3 SYNTHETIC FE-CONTAINING HYDRATES<br />
EXAFS spectroscopy was carried out to obtain information on the local arrangement of<br />
Fe in Fe-Mc. Synchrotron-based X-ray absorption spectroscopy is a local probing<br />
technique, which provides information on the coordination environment of the X-ray<br />
absorbing atom within a distance of up to ~ 5 Å. Experimental and theoretical Fourier<br />
transforms (modulus) obtained from the spectrum are shown in Fig. 12 while the<br />
structural parameters are summarized in Table 9. The central atom Fe has six neighboring<br />
O atoms at a distance of 2.02 Å and six neighboring Ca atoms at 3.47 Å. The former<br />
finding confirms that Fe is octahedrally coordinated in Fe-Mc. Furthermore, the Fe-O and<br />
Fe-Ca distances agree with the refined XRD data (2.04 and 3.46 Å). The absence of any<br />
Fe-Fe backscattering contributions, which would be at 3.01 Å [15, 77], suggesting that, if<br />
at all, Fe-hydroxide was present in the 3 years old sample below the detection limit of the<br />
method (~ 5 wt%).<br />
Fourier tansform magnitude<br />
K 3 <br />
2 4 6 8 10<br />
k Å-1 0 2 4<br />
R +R( Å )<br />
(<br />
)<br />
Experimental<br />
Modeled<br />
Fig. 12. Fe K-edge EXAFS data of Fe-Mc: Experimental (solid line) and theoretical (dots)<br />
Fourier transform (modulus) obtained from k 3 -weighted, normalized, background<br />
subtracted spectrum (inset).<br />
47
CHAPTER 3 SYNTHETIC FE-CONTAINING HYDRATES<br />
Table 9 EXAFS structural parameters of Fe-Mc equilibrated for three years.<br />
Atomic pair N R(Å) R(Å) from XRD σ 2 (Å 2 ) ΔE0 (eV) R-factor<br />
Fe-O 6.0 a 2.02 2.04 0.006 1.18 0.06<br />
Fe-Ca 6.0 a 3.47 3.46 0.008 1.18<br />
N: Coordination number of the neighboring atom (uncertainty ± 20%); a fixed parameter<br />
R: Distance to the neighboring atom (uncertainty ± 0.02Å)<br />
σ: Debye-Waller factor<br />
ΔE0: inner potential correction<br />
R-factor: deviation between experimental data and fit<br />
Raman spectra from Fe-Mc confirmed the refined structure of Fe-Mc, namely the<br />
interlayer description (Fig. 13). The symmetric stretching band of carbonate [CO3]<br />
groups was observed at 1085 cm -1 (Fig. 13a). In a recent study the 1085 cm -1 value for<br />
the carbonate 1 mode was attributed to carbonate weakly bonded at the centre of<br />
interlayer [78]. This mode of vibration is clearly shifted from 1068 cm -1 as observed in<br />
the case of carbonate bonded to the main layer of, for example, Al-Mc. The broad and<br />
unresolved band of vibration observed in the frequency range 2800 cm -1 – 4000 cm -1<br />
characterizes a disordered interlayer region (Fig. 13b). The hydrogen bond network is not<br />
well defined neither in space due to statistic disorder nor in time due to dynamical<br />
disorder (liberation of carbonate group around the trigonal axis and/or movement of<br />
weakly bonded Ow2 water molecules). The latter observations have previously been<br />
reported for AFm phases [79, 80].<br />
48
a).<br />
b).<br />
CHAPTER 3 SYNTHETIC FE-CONTAINING HYDRATES<br />
Fig. 13 a) Raman spectra on Fe-Mc in the frequencies range 200 cm -1 – 1800 cm -1 b) Raman<br />
spectra on Fe-Mc in the frequencies range 2800 cm -1 – 4000 cm -1 .<br />
ESEM micrographs of the synthesized solids showed a platy crystal with hexagonal<br />
symmetry (Fig. 14). This indicates a preferred orientation of the crystals might formed as<br />
previously observed for Al-containing AFm phases [71, 81]<br />
49
CHAPTER 3 SYNTHETIC FE-CONTAINING HYDRATES<br />
Fig. 14 SEM micrographs of Fe-Mc.<br />
3.1.3.4. Comparison of pure Fe- and Al-Mc<br />
The Fe-Mc and analogous Al-Mc compounds exhibit different symmetries. The Fe-Mc<br />
structure is represented by the highly symmetric R3 c space group whereas the Al-Mc<br />
structure is described by the triclinic symmetry: one ordered structure described in the P1<br />
space group [66] and one disordered structure in the P 1 space group [76]. The two<br />
monocarbonate analogues have different layer spacings i.e about 7.98 Å for Fe-Mc and<br />
about 7.57 Å for Al-Mc. This difference is attributed to the location of carbonate anions.<br />
CO3 2- anions are bonded to the main layer in Al-Mc as one of the three oxygen atoms of<br />
the carbonate group occupies the seventh coordination position of a seven fold<br />
coordinated Ca 2+ cation from the main layer. In the case of Fe-Mc, however, carbonate<br />
anions are located in the center of the interlayer, weakly bonded via hydrogen bonds in a<br />
position parallel with the main layer (Fig. 11). Such pronounced differences in symmetry<br />
and carbonate locations are expected to be incompatible with the existence of a complete<br />
solid solution series expressed by Ca4[(AlxFe1-x)2(OH)12]CO3(6-x)H2O. The unit cell<br />
50
CHAPTER 3 SYNTHETIC FE-CONTAINING HYDRATES<br />
parameter a of Fe-Mc is at 5.92 Å somewhat larger than for Al-Mc (a = 5.78 Å) due to<br />
the larger ion radius of iron (0.64 Å) compared to aluminum (0.54 Å) [82].<br />
The TGA/DTG results obtained from Al-Mc and Fe-Mc in Fig. 15 allow the following<br />
steps to be distinguished:<br />
Ca4[(AlxFe1-x)2(OH)12]CO35-6H2O → Ca4[(AlxFe1-x)2(OH)12]CO3 + 5-6H2O (interlayer<br />
water removal)<br />
Ca4[(AlxFe2-x)(OH)12]CO3 → Ca4[(AlxFe1-x)2O6]CO3 + 6H2O (dehydroxylation)<br />
Ca4[(AlxFe2-x)O6]CO3 → Ca4[(AlxFe1-x)2O7] + CO2 (decarbonation)<br />
differentiated relative weight Weight loss in %<br />
100<br />
90<br />
80<br />
70<br />
60<br />
-0.1<br />
-0.2<br />
-0.3<br />
Al-Mc<br />
Fe-Mc<br />
inter layer water removal<br />
Al-Mc<br />
Al-Mc<br />
Fe-Mc<br />
dehydroxilation<br />
CH<br />
200 400 600 800<br />
Temperature °C<br />
C<br />
decarbonation<br />
Fe-Mc<br />
Al-Mc<br />
Fig. 15 Thermal analysis (DTG and TGA) of Ca3(AlxFe1-x)2O3.CaCO3.nH2O.<br />
From the TGA analysis the amount of the interlayer water of Fe-Mc was calculated. The<br />
number of interlayer water molecules per unit cell was found to be approximately 5.8<br />
resulting in total water content of 11.8. On heating Ca3[Fe2(OH)6]2CaCO36H2O, all the<br />
molecules of water molecules from the interlayer were released around 240 °C which<br />
agrees with the findings of Ecker et al. [12] and with the amount of interlayer water<br />
51
CHAPTER 3 SYNTHETIC FE-CONTAINING HYDRATES<br />
determined by XRD. The weight loss up to 500 °C indicates the dehydroxylation of the<br />
water molecules associated with the main layer and traces of portlandite. Finally, the<br />
weight loss at around 700 °C represents decarbonation of calcite and Fe-Mc. The<br />
interlayer water of Ca3[Al2(OH)6]2.CaCO3.5H2O was removed at somewhat lower<br />
temperatures than in the case of Fe-Mc, i.e. in the range between 80 and 270 °C in several<br />
steps. The number of interlayer water molecule of Al-Mc was found to be around 5.2.<br />
The IR results of Fe-Mc and Al-Mc are summarized in Fig. 16 and Table 10. The IR<br />
spectrum of Fe-Mc are correlated with the Al-analogues spectra to assign the type of<br />
bonds at different absorption bands and compared with the study from Ecker et al. [12].<br />
The IR bands of Al-Mc have been assigned based on the study of Fischer et al. [71] and<br />
Trezza et al. [83]. The IR frequencies at 670 cm -1 , 817 cm -1 and 952 cm -1 are due to the<br />
vibrations of the AlO6 bond in the main layer. The strong IR frequencies at 1360 cm -1 and<br />
1415 cm -1 are bands attributed to the asymmetric stretching vibration of ٧3-CO3 2- while<br />
the sharp peak at 880 cm -1 is related to the asymmetric starching vibration of ٧2-CO3 2- .<br />
Fig. 16 IR spectra of Al-Mc and Fe-Mc.<br />
52
CHAPTER 3 SYNTHETIC FE-CONTAINING HYDRATES<br />
The absorption band in the range between 3000 cm -1 and 3600 cm -1 is due to OH<br />
stretching vibrations resulting from the interlayer water. In the case of Fe-Mc the weak<br />
bands at 661 cm -1 and 960 cm -1 are attributed to FeO6 vibrations. Like the Al-analogues,<br />
٧2-CO3 2- vibrations in Fe-Mc spectrum are found at about at 710 cm -1 and 875 cm -1<br />
respectively. The sharp band at 1382 cm -1 is related to the vibration of ٧3-CO3 2- . The<br />
broad band between 2700 cm -1 and 3320 cm -1 is due to the vibration of OH bonds in the<br />
interlayer water of Fe-Mc. The bands at frequencies higher than 3600 cm -1 can be related<br />
to the vibrations of OH in the main layer [Ca2.Al/Fe(OH)12] + . The peaks between 3000<br />
cm -1 and 3600 cm -1 are sharper for Al-Mc than Fe-Mc indicating more highly coordinated<br />
interlayer water in Al-Mc.<br />
Table 10 IR vibrations of Ca4[(AlxFe1-x)2(OH)12] . CO3 . nH2O.<br />
Al-Mc Fe-Mc<br />
Wavenumbers (cm -1 ) Vibrations Wavenumbers (cm -1 ) Vibrations<br />
670 AlO6 661 FeO6<br />
720 4-CO3 2- 710 4-CO3 2-<br />
817 AlO6<br />
880 2-CO3 2- 875 2-CO3 2-<br />
952 AlO6 960 FeO6<br />
1360 3-CO3 2- 1382 3-CO3 2-<br />
1415 3-CO3 2-<br />
1651 2-H2O<br />
3007 1-H2O<br />
3369 1-H2O 2700-3320 1-H2O<br />
3518 OH - 3505 OH -<br />
3616 OH -a<br />
3668 OH -a 3653 OH -a<br />
a<br />
associated to the main layer<br />
3.1.4. Mixed CaO.(AlxFe1-x)2O3.CaCO3.nH2O systems<br />
Variations of the Al/Fe ratio in the 3CaOAl2O3CaCO311H2O -<br />
3CaOFe2O3CaCO312H2O system resulted in the formation of two separate stable<br />
53
CHAPTER 3 SYNTHETIC FE-CONTAINING HYDRATES<br />
phases (no systematic peak shifts) while no intermediate phase formed (Fig. 17). The<br />
intensity of the small intermediate peak at 11.39° 2θ was found to depend on the water<br />
content as it decreased upon drying. To index the reflections and to determine the layer<br />
thickness and the unit cell parameter a, a Le Bail fitting was performed. The results are<br />
shown in Fig. 18 and Fig. 19, respectively. No significant variation of both parameters<br />
with varying Al mole fraction was observed compared to end member values. These<br />
results clearly confirm the absence of a solid solution between Al-Mc and Fe-Mc, in<br />
contrast to the findings reported elsewhere [70]. Thus, comparison of the XRD pattern<br />
further corroborate that 3CaOAl2O3CaCO311H2O and 3CaOFe2O3CaCO312H2O have<br />
different structural symmetries, carbonate location and different amounts of water<br />
molecules in the interlayer.<br />
Intensity Intensity [arb. [arb. units]<br />
Fe-Mc<br />
*<br />
Al-Mc<br />
1.0<br />
0.7<br />
0.5<br />
10 11 12 2CuK 2CuK<br />
13 0.3<br />
0.0<br />
14<br />
Al/(Al+Fe) ratio<br />
Fig. 17 XRD pattern of the Al/Fe-Mc after 3 years hydration time at 20 °C * peak due to<br />
additional water in Mc.<br />
54
o<br />
layer thickness (A)<br />
8.0<br />
7.8<br />
7.6<br />
CHAPTER 3 SYNTHETIC FE-CONTAINING HYDRATES<br />
Fe Mc (this study)<br />
Fe Mc (Ecker, 1997)<br />
Al Mc O(Renaudin, 1999)<br />
Al Mc D(Renaudin, 1999)<br />
Al/Fe Mc (this study)<br />
7.4<br />
0.0 0.2 0.4 0.6 0.8 1.0<br />
C FcH 4 12<br />
Al/(Al+Fe) ratio<br />
C AcH 4 11<br />
Fig. 18 Layer thickness for Al-Mc and Fe-Mc after refinement by Le Bail fitting and Rietveld<br />
unit cell parameter a (A)<br />
°<br />
analysis. C4FcH12: Fe-Mc, C4AcH11: Al-Mc.<br />
5.95<br />
5.90<br />
5.85<br />
5.80<br />
Fe Mc (this study)<br />
Fe Mc (Ecker, 1997)<br />
Al Mc (Renaudin, 1999)<br />
Al/Fe Mc (this study)<br />
5.75<br />
0.0 0.5 1.0<br />
C FcH 4 12<br />
Al/(Al+Fe) ratio<br />
C AcH 4 11<br />
Fig. 19 Values of a-parameters for Al-Mc and Fe-Mc.<br />
3.1.5. Solubility<br />
The composition of the solutions in equilibrium with pure Al-Mc, Fe-Mc, Fe-Hc and<br />
mixtures were determined at different equilibration times and at 20 °C and 5°C (Table 11<br />
and Table 12). The very low Fe concentrations detected in solution indicated the presence<br />
55
CHAPTER 3 SYNTHETIC FE-CONTAINING HYDRATES<br />
of an additional phase, presumably Fe-hydroxide. Note that the presence of Fe-<br />
oxide/hydroxide is consistent with the slightly red coloring of the samples.<br />
3.1.5.1. Determination of solubility products at 20 °C and 50 °C<br />
The measured concentrations of calcium, hydroxide, aluminum and iron were used to<br />
calculate the solubility products using GEMS:<br />
KS0 Al-monocarbonate = {Ca 2+ } 4. {Al(OH)4 - } 2 . {CO3 2- } . {OH - } 4 . {H2O} 5<br />
KS0,Fe-monocarbonate = {Ca 2+ } 4 . {Fe(OH)4 - } 2 {CO3 2- } . {OH - } 4. {H2O} 6<br />
KS0,Fe-hemicarbonate = {Ca 2+ } 4 . {Fe(OH)4 - } 2. {CO3 2- } 0.5 {OH - } 4. {H2O} 4<br />
where {} denotes the activity.<br />
As dissolved carbonate, CO3 2- , could not be determined precisely, the concentration of<br />
CO3 2- was calculated based on the assumption that all solutions were in equilibrium with<br />
calcite. The calculated solubility products are listed in Table 11 and Table 12.<br />
The total solubility products at 20 °C were determined to be log KS0 Al-Mc = -31.55, log<br />
KS0 Fe-Mc = -34.51 ± 0.50 and log KS0 Fe-Hc = -30.55 ± 0.67. The value determined for Al-<br />
Mc at 20 °C is nearly identical to the value of -31.47 reported by Matschei et al. [52] at<br />
25 °C. Möschner et al. [15] reported a tentative solubility product of -35.9 for Fe-Mc at<br />
20 °C, which is one log unit lower than the value determined in this study.<br />
At 50 °C a solubility product of log KS0 = - 35.27 ± 0.17 was determined for Fe-Mc and a<br />
log KS0 = -32.58 ± 0.61 for Fe-Hc. Thus, the solubility products at 50 °C are lower than<br />
those determined at 20 °C. Even though Fe-Mc was stabilized at 50 °C, the phase became<br />
unstable with time with respect to Fe-hydroxide, calcite and portlandite. At 80 °C both<br />
Fe-Mc and Fe-Hc were found to be unstable with respect to calcite and hematite (Fe2O3).<br />
56
CHAPTER 3 SYNTHETIC FE-CONTAINING HYDRATES<br />
Table 11 Measured ion concentrations and calculated solubility products at different equilibration times.<br />
Equilibration<br />
time in days Temperature Ca[mmol/l] Al[mmol/l] Fe[mmol/l] K[mmol/l] pH 1 logKs0 logKs0<br />
Fe-Hc<br />
Solid phases present Fe-Mc Fe-Hc<br />
7 20 5.18
CHAPTER 3 SYNTHETIC FE-CONTAINING HYDRATES<br />
Table 12 Compositions of Al/Fe-monocarbonate after synthesis at 20 °C equilibrated for 3 years at supersaturated and undersaturated condition.<br />
Mole fraction of Al in Al [mmol/l] Ca [mmol/l] Fe [mmol/l] K [mmol/l] pH<br />
the solids<br />
1 Solids present logKs0 logKs0,<br />
Supersaturation<br />
Al-Mc Fe-Mc<br />
1 2.08 0.12
CHAPTER 3 SYNTHETIC FE-CONTAINING HYDRATES<br />
Additionally, the solutions equilibrated at 50 °C and 80 °C were thermodynamically<br />
oversaturated with respect to Fe-hydroxide and hematite. The kinetics of formation of<br />
hematite, however, was very slow, so that the solid did not form at 20 °C or 50 °C within<br />
the experimental period.<br />
For both Al-Mc and Al-Hc, an increase in the solubility with increasing temperature was<br />
observed [52], while in contrast, for both Fe-Hc and Fe-Mc a slight decrease was<br />
observed suggesting a slight stabilization of Fe-Hc and Fe-Mc (Fig. 20).<br />
3.1.5.2. Estimation of the solubility product under standard conditions<br />
The solubility products at standard conditions were calculated with the help of GEMS-<br />
PSI using temperature extrapolation from the solubility products calculated at 20 °C and<br />
50 °C as previously demonstrated by Matschei et al. [7]. The calculated solubility<br />
products at 20 °C and 50 °C (Table 11 and Table 12) were used to develop the<br />
temperature-dependent ‘log K’ function which allowed the solubility products to be<br />
calculated at different temperatures (Fig. 20) as described in section 2.3. The entropy was<br />
adjusted until good agreement between measured and calculated solubility was reached.<br />
The thermodynamic properties of the solids at 25 °C are listed in Table 13.<br />
59
Calc.solubility product log K sp<br />
-29<br />
-30<br />
-31<br />
-32<br />
-33<br />
-34<br />
-35<br />
-36<br />
CHAPTER 3 SYNTHETIC FE-CONTAINING HYDRATES<br />
Fe-Mc<br />
Fe-Hc<br />
-37<br />
5.0 25.0 45.0<br />
Temperature (°C)<br />
65.0 85.0<br />
Fig. 20. Calculated solubility products of Fe-Mc and Fe-Hc from the solubility experiments.<br />
Squares: experimental solubility product of Fe-Hc, Triangles: experimental solubility<br />
product of Fe-Mc.<br />
The solubility products of Fe-Mc (-34.59) and Fe-Hc (-30.83) are about 2-3 log units<br />
lower than those of Al-Mc (-31.47) and Al-Hc (-29.12), respectively. Note that a similar<br />
difference in the solubility products between Al- and Fe-monosulfate was found (see next<br />
section), while the solubility product of Fe-ettringite (-44.0) was found to be slightly<br />
higher than that of Al-ettringite (-44.9). This indicates that the Fe-AFm phases are<br />
potentially stable under conditions where Al-AFm can be formed while the formation of<br />
Fe-ettringite is less probable under conditions where Al-ettringite is stable.<br />
60
Phase log KSo<br />
CHAPTER 3 SYNTHETIC FE-CONTAINING HYDRATES<br />
Table 13 Thermodynamic parameters of carbonate containing AFm phases at standard conditions<br />
(25°C, 1 atm).<br />
fG°<br />
[kJ/mol]<br />
fH°<br />
[kJ/mol]<br />
S 0<br />
[J/K/mol]<br />
C 0 p<br />
[J/mol/K]<br />
a0<br />
[J/(mol.K)]<br />
a1<br />
[J/(mol.K 2 )]<br />
a2<br />
[JK/mol]<br />
a3<br />
[J/(mol.K 0.5 )]<br />
V 0<br />
[cm 3 /mol] Ref.<br />
C4FcH12 -34.59±0.5 -6674.0 -7485 1230 950 612 1.160 -5.73e+05 0 292 a<br />
C4Fc0.5H10 -30.83±0.5 -5952.9 -6581 1270 841 308 1.200 -9.08e+05 3200 273 a<br />
C4AcH11 -31.47±0.5 -7337.5 -8250 657 881 618 0.982 -2.59e+06 0 262 b, c<br />
C4Ac0.5H12 -29.13±0.5 -7336.0 -8270 713 906 664 1.014 -1.30e+06 -800 285 b, c<br />
(a) This study, (b) Lothenbach et al. [3], (c) Matschei et al. [52].<br />
3.1.5.3. Modeling of mixed CaO(AlxFe1-x)2O3CaCO3nH2O systems<br />
Table 12 shows the composition of the liquid phase with varying Al mole fraction. The<br />
concentrations of all species (Ca, Al, Fe, K) between 0.1 and 0.9 mole fraction of Al in<br />
the 3CaO(AlxFe1-x)2O3.CaCO3.nH2O system were found to be similar within the<br />
uncertainty range, indicating the presence of two separate solid phases (Table 12). Fig. 21<br />
shows that the calculated and measured concentrations are comparable on the assumption<br />
that two separate phases are present. This supports the findings from XRD, which<br />
showed no solid solution between the Al- and Fe-Mc end members. Note that the<br />
presence of a solid solution would be indicated by gradual changes in the elemental<br />
concentrations (see dotted line in Fig. 21).<br />
61
log c(Ca, Al, Fe, K, OH) in mmol/L<br />
3<br />
1<br />
-1<br />
-3<br />
CHAPTER 3 SYNTHETIC FE-CONTAINING HYDRATES<br />
-5<br />
0 0.2 0.4 0.6 0.8 1<br />
C4FcH11 Al/(Al+Fe) ratio<br />
C4AcH12 Fig. 21 Measured (symbols) and calculated (lines) concentrations in the liquid phases of the<br />
Ca<br />
Al<br />
Fe<br />
K<br />
OH-<br />
synthesized monocarbonate at different Al/Al+Fe ratios.<br />
3.1.6. Modeling of C3A-C2F-CaCO3-CaSO4-H2O system in cement hydration<br />
Thermodynamic modeling was used to calculate the changes of the hydrate assemblage in<br />
the system C3A-C2F-CaCO3-CaSO4-H2O (SO3/(Al,Fe)2O3 = 1) in the absence and<br />
presence of CaCO3 using the thermodynamic data given in Table 5 with the aim of<br />
assessing differences in the properties of Fe-and Al-analogues and the effect of calcite. In<br />
the model calculations a fixed SO3/(Al,Fe)2O3 ratio of 1 was used while the calcite<br />
content (CO2/(Al,Fe)2O3 ratio) varied. A constant amount of solids (Al2O3 + Fe2O3 +<br />
CaSO4 + CaO + CaCO3) was maintained.<br />
62
volume [cm 3 ]<br />
700<br />
600<br />
500<br />
400<br />
300<br />
CHAPTER 3 SYNTHETIC FE-CONTAINING HYDRATES<br />
200<br />
Al-Ms<br />
100<br />
0<br />
Fe-Ms<br />
Al-Hc<br />
Fe-Hc<br />
Fe-Mc<br />
0.0 0.2 0.4 0.6 0.8 1.0 1.2<br />
CO 2 /(Al,Fe) 2 O 3<br />
Al-Ett<br />
portlandite<br />
calcite<br />
Fig. 22 Changes in the total volume of phases of a hydrated model mixture consisting of Al2O3,<br />
Fe2O3 and a fixed SO3/(Al,Fe)2O3 ratio of 1 as a function of the calcite content<br />
(CO2/(Al,Fe)2O3 ratio) at 20 °C at constant amount of solids: (Al2O3 + Fe2O3 + CaSO4 +<br />
CaO + CaCO3).<br />
In the absence of calcite, Al- and Fe-monosulfate were calculated to be stable in presence<br />
of small amounts of portlandite (Fig. 22). Upon sequential addition of calcite, first Fe-Hc<br />
and Al-ettringite are expected to form at the expense of Al- and Fe-Ms. Appearance of<br />
Al-Hc, Fe-Mc and finally Al-Mc occurs with increasing supply of carbonate. The<br />
influence of calcite on the composition of the phase assemblage of a hydrated model<br />
Portland cement is similar to that on a pure Al-system [67]. In the presence of calcite,<br />
monosulfate (Al-Ms and Fe-Ms) is expected to be unstable, and ettringite (Al-Ett) and<br />
monocarbonate (Fe-Mc and Al-Mc) form instead, which leads to a higher degree of space<br />
filling (Fig. 22). In contrast to a pure Al-system, however, Fe-ettringite is not expected to<br />
be stable in a mixed system, which results in Fe-Hc and Fe-Mc. Note that at higher<br />
CaSO4 contents (SO3/(Al,Fe)2O3 > 2), Fe-ettringite can be stable in a Portland cement<br />
Al-Mc<br />
63
CHAPTER 3 SYNTHETIC FE-CONTAINING HYDRATES<br />
system. During the first hours of the hydration of Portland cements, an excess of CaSO4<br />
is present, which allows both Al- and Fe-ettringite to be formed. With progressing<br />
hydration, however, the CaSO4/(Al,Fe)2O3 is reduced, which results in a situation where<br />
only Al-ettringite will be stable and both Al- and Fe-monocarbonate (or monosulfate in<br />
the absence of calcite) can be formed. The predicted presence of Fe-containing ettringite<br />
during the early hydration is consistent with the observations of Neubauer et al. [84]. The<br />
authors observed a peak shift of ettringite to a larger d-value during the first hours of<br />
OPC hydration, which could indicate the presence of Fe- (or of CO3) in the ettringite<br />
structure. After a few hours, however, d-values decreased, thus suggesting the<br />
transformation to Al-ettringite.<br />
Note that the presence of silicates was not included in the current assessment because<br />
data on the stability of Fe-containing Si-hydrogarnets (C3FSH4) and Fe-strätlingite<br />
(C2FSH8) were not yet available. There are indications, however, that the formation of<br />
Fe-containing Si-hydrogarnets is kinetically possible at ambient temperatures.<br />
3.1.7. Conclusions<br />
A crystalline Fe-Mc was synthesized by mixing appropriate amounts of C2F, CaCO3 and<br />
CaO at 20, 50 and 80 °C. At ambient temperature, the kinetics of the reaction was slow;<br />
C2F transformation was completed only after one year and longer. After 3 months of<br />
equilibration, Fe-Hc was detected; after 1 year and longer Fe-Hc transformed to Fe-Mc.<br />
At 50 °C the kinetics were found to be faster. The presence of Fe-Hc and some Fe-Mc<br />
was already observed after 7 days. The amount of Fe-Mc increased while Fe-Hc<br />
disappeared over time. At 80 °C Fe-Mc was unstable with respect to Fe-<br />
hydroxide/hematite, portlandite and calcite.<br />
64
CHAPTER 3 SYNTHETIC FE-CONTAINING HYDRATES<br />
The structure of Fe-Mc was solved and refined using synchrotron powder diffraction<br />
data. Fe-Mc was described in the rhombohedral R3 c symmetry. It belongs to the AFm<br />
family with a positively charged main layer and a negatively charged interlayer. The<br />
structure of Fe-Mc was found to diverge from its Al analogous Al-Mc compound. The<br />
main difference consists in the carbonate location. Carbonate is bonded to the main layer<br />
in Al-Mc while it is weakly bonded in the interlayer of Fe-Mc.<br />
EXAFS spectroscopy data supported the formation of stable Fe-Mc in which iron is<br />
octahedrally surrounded by six oxygen and calcium atoms. The Fe-Ca backscattering<br />
contributions revealed that Fe is associated with the Fe-Mc structure while the absence of<br />
Fe-Fe backscattering contributions in the synthesized material confirmed the absence of<br />
significant amounts of amorphous Fe-hydroxide [77]. The coordination environment of<br />
Fe in Fe-Mc corresponds to that of Al in the Al-analogue [77].<br />
TGA and IR measurements revealed characteristics of the interlayer water molecules of<br />
Fe-Mc and Al-Mc. The weight loss of the interlayer water molecules observed by TGA<br />
was found to occur in the temperature range around 200 °C for Fe-Mc and from 80 to 270<br />
°C for Al-Mc. The IR spectra of Fe-Mc further showed vibrations of bonds that are on<br />
same range of frequency with those of Al-Mc but with different shape of the peaks<br />
composed of the spectra of Al-Mc.<br />
In the mixed Ca4[(AlxFe1-x)2(OH)12].CO3.nH2O system XRD data and measurements of<br />
the elemental composition in solution were not consistent with the formation of a solid<br />
solution between Al- and Fe-Mc, presumably due to the structural differences between<br />
Al- and Fe-Mc. Al-Mc has triclinic structure and a layer thickness of 7.57 Å, while Fe-<br />
Mc has a rhombohedral structure and a layer thickness of 7.98 Å.<br />
65
CHAPTER 3 SYNTHETIC FE-CONTAINING HYDRATES<br />
The solubility products were determined experimentally at 20 °C for Fe-Mc (logKS0,20 °C<br />
= -34.51), for Fe-Hc (-30.55) and for Al-Mc (-31.55). At 50 °C, the logKS0,50 °C for Fe-Mc<br />
was -35.27 and for Fe-Hc -32.58. At standard conditions (25 °C, 1 atm) a logKS0 of -<br />
34.59 for Fe-Mc and of -30.83 for Fe-Hc was determined. Thus, the experimentally<br />
derived solubility products of Fe-Mc and Fe-Hc were approximately 3 log units lower<br />
than those reported for Al-Mc and Al-Hc.<br />
Thermodynamic modeling further indicates that in a system containing C3A-C2F-CaSO4-<br />
CaO-H2O (absence of calcite), Al-Ms and Fe-Ms are expected to dominate the phase<br />
assemblage. In the presence of CaCO3, however, Al-ettringite, Al-Mc and Fe-Mc are<br />
expected to be stable, while Fe-ettringite will not be present. Only at higher<br />
SO3/(Al,Fe)2O3 ratios (>2), Fe-ettringite was predicted to be stable. High SO3/(Al,Fe)2O3<br />
ratios are achieved during the first hours of OPC hydration when only small amounts of<br />
the aluminate and ferrite clinkers have reacted. Hence, Fe-ettringite could potentially<br />
form in this stage of the hydration process. In the later stages, however, when a lower<br />
SO3/(Al,Fe)2O3 ratio is achieved, Fe-Mc (or Fe-Ms in the absence of calcite) are expected<br />
to be stable, together with Al-ettringite and Al-Mc (or Al-Ms).<br />
In summary, no experimental data have been available to date which allowed the<br />
formation of Fe-containing phases might exist in hydrated cements. The data obtained in<br />
this study offer a possibility to predict the fate of iron oxides in Portland cement. Based<br />
on the available data, iron oxide can be expected to be present in hydrated cements rather<br />
as AFm phases than as ettringite.<br />
66
CHAPTER 3 SYNTHETIC FE-CONTAINING HYDRATES<br />
3.2. Fe-containing monosulfate<br />
3.2.1. Introduction<br />
The formation of monosulfate (Ca4(Al,Fe)2(OH)12SO46H2O) in cement paste has been<br />
extensively studied [32, 52, 85, 86]. Mainly the formation Al-monosulfate<br />
(Ca4Al(OH)12SO46H2O) from C3A and gypsum or Al-ettringite was reported. Al-<br />
monosulfate can also be formed from the reaction of C2(A,F). Moreover, the presence of<br />
iron might lead to the formation of Fe-monosulfate (Ca4Fe(OH)12SO46H2O) or mixed<br />
Al/Fe-monosulfate might formed. The formation of Fe-monosulfate in the absence of<br />
cements has been reported [12, 15].<br />
Experimental thermodynamic data are available for Al-monosulfate [7, 61]. Only a rough<br />
estimation of the thermodynamic data has been reported for Fe-monosulfate from Fe-<br />
ettringite experiments where the formation of Fe-monosulfate was observed at high pH<br />
values [15]. Further, the crystal structure of Fe-monosulfate is poorly understood.<br />
In this section Fe-containing monosulfate and mixed monosulfate containing both Al and<br />
Fe were synthesized and characterized. Their crystal structure and their solubility were<br />
determined.<br />
3.2.2. Kinetics of formation<br />
Fe-monosulfate (C4FsH12) is stable at high pH values [15]. In this study, C4FsH12 was<br />
synthesized in 0.4 M KOH and studied after different equilibration times. An attempt to<br />
synthesis Fe-monosulfate in 0.1 M KOH (using stoichiometric amounts of C2F, CsH2 and<br />
C) resulted in Fe-ettringite formation only after an equilibration time up to 1100 days.<br />
Fig. 23 shows the XRD patterns of the phase synthesized at 20 °C as a function of<br />
equilibration time. The reaction of pure ferrite was slow and the formation of C4FsH12<br />
67
CHAPTER 3 SYNTHETIC FE-CONTAINING HYDRATES<br />
was observed after 120 days by a peak at 2θ = 9.96° giving rise to basal spacing d = 8.88<br />
Å. Portlandite co-precipitated with the target phase at all equilibration times, gypsum was<br />
present up to 28 days. The formation of X-ray-amorphous Fe-oxide/hydroxides was<br />
easily recognized from the reddish color of the samples. As stoichiometric amounts of<br />
iron, calcium and sulfate had been mixed, the precipitation of portlandite and Fe-<br />
oxide/hydroxide seems to have been kinetically faster than the formation of Fe-<br />
monosulfate. No gypsum or any other sulfate bearing phase was observed in any of the<br />
sample older than 120 days due to the high dissolved sulfate concentration present in the<br />
solutions (see section 3.2.7).<br />
Intensity [arb. units]<br />
C 4FsH 12<br />
C 2F<br />
CH<br />
10 20 30<br />
2CuK<br />
C 4FsH 12<br />
C 4FsH 12<br />
Fig. 23 XRD pattern of C4FsH12 formed at 20 °C after different equilibration times.<br />
C 2F<br />
CH<br />
680 days<br />
360 days<br />
120 days<br />
28 days<br />
7 days<br />
The TGA-DTG curves indicate the removal of the interlayer water in several steps (see<br />
Fig. 24). The trend is similar as for Al-monosulfate. The weight loss up to 300 °C is due<br />
68
CHAPTER 3 SYNTHETIC FE-CONTAINING HYDRATES<br />
to the loss of water molecule from the interlayer and the main layer of C4FsH12. A weight<br />
loss due to the presence of portlandite (CH) was observed at around 450 °C. The TGA-<br />
DTG curves also show the existence of traces of calcite in the sample after 7 days<br />
equilibration time, probably due to CO2 contamination during drying and the presence of<br />
unreacted gypsum during the first 28 days.<br />
differentiated relative weight weight loss in %<br />
100<br />
90<br />
80<br />
70<br />
60<br />
-0.1<br />
-0.2<br />
-0.3<br />
C 4 FsH 12<br />
CsH 2<br />
CH<br />
Carbonate<br />
200 400 600 800<br />
Temperature (°C)<br />
7 days<br />
28 days<br />
120 days<br />
340 days<br />
680 days<br />
Fig. 24 TGA and DTG curves of C4FsH12 formation at 20°C after different equilibration times.<br />
3.2.3. Effects of temperature<br />
Fe-monosulfate (C4FsH12) formation at 50 °C and 80 °C is much faster than at 20 °C. At<br />
50 °C, the Fe-monosulfate remained stable up to 360 days. At 80 °C, Fe-monosulfate<br />
decomposed to portlandite and Fe-hydroxide and finally to hematite after 28 days and<br />
longer. Fig. 25 shows the XRD pattern of the samples equilibrated for 360 days at<br />
different temperatures, revealing the instability of C4FsH12 with respect to portlandite and<br />
69
CHAPTER 3 SYNTHETIC FE-CONTAINING HYDRATES<br />
hematite at 80 °C. For the sample prepared at 50 °C, besides to C4FsH12 a small quantity<br />
of C4FsH10 was observed.<br />
Intensity [arb. units]<br />
C 4 FsH 12<br />
C 4 FsH 10<br />
CH<br />
C 4 FsH 12<br />
C 4 FsH 12<br />
CH<br />
10 20 30<br />
2CuK<br />
C 2 F<br />
Fe 2 O 3<br />
Fig. 25 XRD pattern of C4FsH12 equilibrated for 360 days at 20, 50 and 80 °C.<br />
3.2.4. Structure of C4FsH12<br />
CH<br />
80 °C<br />
50 °C<br />
20 °C<br />
The laboratory XRD patterns showed that well crystallized Fe-monosulfate (Fig. 23 and<br />
Fig. 25) had formed both at 20 °C and 50 °C. The solids synthesized at 20 °C<br />
(equilibrated for 680 days) and 50 °C (equilibrated for 360 days) were used for<br />
crystallographic investigation on the structure of Fe-monosulfate using synchrotron X-ray<br />
powder diffraction. The structure of Fe-monosulfate was described by multipattern<br />
Rietveld refinement as shown in Fig. 26. The refined data show the formation of multiple<br />
phases for both samples synthesized at 20 °C and 50 °C. The major phase at both<br />
temperatures was portlandite, while the amount of amorphous Fe-hydroxide could not be<br />
70
CHAPTER 3 SYNTHETIC FE-CONTAINING HYDRATES<br />
quantified. The solid synthesized at 20 °C is composed of two types of AFm phases (38<br />
wt.% and 6 wt.%) and Ca(OH)2 (53 wt.%). The solid at 50 °C is composed of the same<br />
two types of AFm phases (37 wt.% and 4 wt.%) and Ca(OH)2 (45 wt.%). Details of the<br />
quantitative analyses extracted from Rietveld refinement are given in Table 14.<br />
Table 14 Quantitative phases analyses from Rietveld refinement.<br />
Compound Fe-Ms-20°C (wt. %) Fe-Ms-50°C (wt. %)<br />
Fe-Ms 38 37<br />
AFm N°2 6 4<br />
Ca(OH)2 53 45<br />
Fe2O3 3 8<br />
CaCO3 – vaterite - 4<br />
CaCO3 – calcite - 2<br />
The main Fe-monosulfate peaks indicates an interlayer distance of 8.87 (1) Å<br />
corresponding to C4FsH12. The structural parameters of C4FsH12 were refined, using the<br />
C4AsH12 structure [87] as a model. The refined parameters of Fe-monosulfate reveal that<br />
the phase crystallizes in the rhombohedral R3 c symmetry with a = 5.8874 (3) Å and c =<br />
26.598 (3) Å at 20 °C and a = 5.8832 (2) Å and c = 26.6181 (1) Å at 50 °C. The structure<br />
is composed of a positively charged main layer [Ca2Fe(OH)6] + and a negatively charged<br />
interlayer [ 1 /2SO4 . 3H2O] - . The atomic coordinates of the eight crystallographic sites are<br />
given in Table 15.<br />
Table 15 Refined structural parameters of Fe-monosulfate (standard deviation in parentheses).<br />
Atom Wyckoff X Y Z Biso (Å 3 ) Occupancy<br />
Ca 6c 2/3 1/3 0.0220 (3) 0.7 (2) 1<br />
Fe 3ª 0 0 0 = Biso (Ca) 1<br />
O1 (OH) 18f 0.283 (4) -0.041 (4) 0.0337 (7) = Biso (Ca) 1<br />
O2 (H2O) 6c 2/3 1/3 0.1156 (9) 1.5 (4) 1<br />
S 3b 0 0 ½ = Biso (O2) 1/2 (-)<br />
O3 (SO4) 18f 0.245 (5) 0.090 (9) 0.474 (1) = Biso (O2) 0.25 (-)<br />
O3’ (H2O) 18f = x (O3) = y (O3) = z (O3) = Biso (O2) 0.20 (2)<br />
O4 (SO4) 6c 0 0 0.555 (1) = Biso (O2) 1/4 (-)<br />
71
CHAPTER 3 SYNTHETIC FE-CONTAINING HYDRATES<br />
Fig. 26. Rietveld plot for Fe-monosulfate samples (synthesized at 20 °C: top, and at 50 °C:<br />
bottom) with = 1.5418Å.<br />
72
CHAPTER 3 SYNTHETIC FE-CONTAINING HYDRATES<br />
The presence of a second AFm phase was indicated by an intensive diffraction peak at 2θ<br />
= 10.7° (Fig. 27). This could indicate the presence of a second Fe-monosulfate compound<br />
with less water. The second Fe-monosulfate has an interlayer distance of 8.36(1) Å which<br />
could correspond to C4FsH10. The decrease in the interlayer distance from C4FsH12 (8.87<br />
Å) to C4FsH10 (8.36 Å) is comparable to the difference in interlayer distance reported for<br />
C4AsH12 (8.94 Å) [88] and C4AsH10 (8.42 Å) [89]. The interlayer distance of the second<br />
AFm (C4FsH10) phase is between the value for C4FsH12 and the value of C4FcH12 (7.98<br />
Å).<br />
Fig. 27 Details of the Rietveld plot from the sample Fe-Ms-50 °C.<br />
The structure of Fe-monosulfate is isotypic to Al-monosulfate. It has the same symmetry<br />
and same atomic positions with two kinds of disorder in the interlayer region: statistical<br />
distribution between one sulfate group with 2.3 water molecules and orientation disorder<br />
of sulfate groups (up or down). The refined composition is<br />
73
CHAPTER 3 SYNTHETIC FE-CONTAINING HYDRATES<br />
[Ca2Fe(OH)6]·[(SO4)0.5·3.2(1)H2O]; i.e. C4AsH12.4(2). The crystallographic structure<br />
representations are identical to those previously determined for Al-monosulfate [87]. The<br />
interatomic distances determined for the refined Fe-monosulfate structure are listed in<br />
Table 16.<br />
Table 16 Refined interatomic distances in Fe-monosulfate (standard deviation is given in<br />
parentheses).<br />
Bond type Atoms Distances (Å)<br />
Ca-OH Ca-O1 3 x 2.25 (2)<br />
3 x 2.40 (2)<br />
Ca-H2O Ca-O2 2.49 (3)<br />
Fe-OH Fe-O1 6 x 2.01 (2)<br />
S-O S-O3 3 x 1.44 (4)<br />
S-O4 1.48 (3)<br />
SO4-OH O3-O1 2.95 (5)<br />
O4-O1 2.80 (3)<br />
SO4-H2O O2-O3 3 x 2.87 (5)<br />
3.2.5. Comparison of C4AsH12 with C4FsH12<br />
Both Al-monosulfate and Fe-monosulfate crystallize in the rhombohedral R3 c<br />
symmetry. This structural similarity could enable a substitution of Al by Fe in the main<br />
layer structure. Fe 3+ (0.64 Å) has a slightly larger ion radius than Al 3+ (0.54 Å) which<br />
resulted in a larger unit cell parameter (a = 5.88 Å) for Fe-monosulfate than for Al-<br />
monosulfate (a = 5.76 Å).<br />
Raman spectroscopy was applied to study the vibrational frequency of the molecules in<br />
the structure of Fe-monosulfate. The results were compared with Al-monosulfate [79].<br />
Raman spectroscopy measurements were carried out for the solids synthesized at 20 °C<br />
and 50 °C (Fig. 28 and Fig. 29).<br />
74
CHAPTER 3 SYNTHETIC FE-CONTAINING HYDRATES<br />
Fig. 28 Spectral range 100 cm -1 – 1500 cm -1 of Raman spectra from sample Fe-Ms-20 °C<br />
(comparison with Al-monosulfate spectra [79]).<br />
The small peak at 1085 cm -1 was assigned to carbonate which was present due to carbon<br />
dioxide contamination. Sulfate vibrations are less intense in the Fe-monosulfate<br />
compound compared to Al-monosulfate compound. The vibration mode of sulfate was<br />
shifted from the more intense 1 mode: 992 cm -1 for Fe-Ms compared with 982 cm -1 for<br />
Al-monosulfate (or 981 cm -1 on Kuzel’s salt) [79, 90]. The 1 position of Fe-monosulfate<br />
synthesized at 20 °C corresponds to that of Al-monosulfate treated at 117 °C (i.e. 993 cm -<br />
1 ) [79]. The band position of Fe(OH)6 appeared at 508 cm -1 , which is significantly lower<br />
than for Al(OH)6 (532 cm -1 ). The shifts of the bands could indicate a possible substitution<br />
of Al by Fe as was previously observed between Al- and Fe- ettringite [79].<br />
The hydrogen bond network (Fig. 29) is highly modified in Fe-monosulfate compared to<br />
that in Al-monosulfate.<br />
75
Intensity<br />
4500<br />
4000<br />
3500<br />
3000<br />
2500<br />
2000<br />
1500<br />
1000<br />
500<br />
0<br />
CHAPTER 3 SYNTHETIC FE-CONTAINING HYDRATES<br />
2800 3000 3200 3400 3600 3800 4000<br />
Raman shift (cm -1 )<br />
Fe-Ms 50°C<br />
Al-Ms<br />
Fig. 29 Spectral range 2800 cm -1 – 4000 cm -1 of Raman spectra from sample Fe-Ms-50 °C<br />
(comparison with Al-monosulfate spectra [79]).<br />
The weight loss of monosulfate observed by TGA/DTG analysis (Fig. 30) was assigned<br />
as follows:<br />
Ca4[(Al, Fe)2(OH)12]SO4 6H2O → Ca4[(Al, Fe)2(OH)12]SO4 + 6H2O: interlayer water<br />
removal<br />
Ca4[(Al, Fe)(OH)12]SO4 → Ca4[(Al, Fe )2O6]SO4 + 6H2O : dehydroxylation<br />
The loss of water is controlled by the interlayer structure and occurs in several steps for<br />
both Al- and Fe-monosulfate. The 6 molecules of the interlayer water of Al-monosulfate<br />
escaped in the temperature range up to 260 °C comparable to other observations [61, 73].<br />
The remaining water molecule bond in main layer escaped above 260 °C. The water loss<br />
observed for Fe-monosulfate had less well defined steps due to the water loss of Fe(OH)3<br />
in this temperature range [16]. Water loss up to 260 °C was 4.5 in the case of Fe-<br />
monosulfate taking account the presence of other solids.<br />
76
CHAPTER 3 SYNTHETIC FE-CONTAINING HYDRATES<br />
Fig. 30 Thermal analysis (TGA and DTG) of Al and Fe-monosulfate after 680 days.<br />
3.2.6. Solid solution between Al and Fe-monosulfate (C4(A,F)sH12)<br />
The similarity in the ionic radii of Al 3+ and Fe 3+ and the structure of Al- and Fe-<br />
monosulfate could allow Al-Fe substitutions in the structure and the formation of a solid<br />
solution. Solid solution formation can stabilize the solids by decreasing their solubility.<br />
Möschner et al. [16] observed the formation of a solid solution between Al- and Fe-<br />
ettringite with a miscibility gap. In contrast, no solid solution was found between Al- and<br />
Fe-monocarbonate due to the different symmetries of Al-monocarbonate (triclinic) and<br />
Fe-monocarbonate (rhombohedral) [19].<br />
In this study, mixed 3CaO(AlxFe1-x)2O3(CaSO4)12H2O were synthesized at room<br />
temperature by varying the Al/(Al + Fe) ratio from 0 to 1. Fig. 31 shows the XRD pattern<br />
of the 3CaO(AlxFe1-x)2O3(CaSO4)12H2O series.<br />
77
CHAPTER 3 SYNTHETIC FE-CONTAINING HYDRATES<br />
A peak shift from 0.0 to 0.45 Al/(Al + Fe) ratio was clearly observed caused by the<br />
substitution of Al 3+ by Fe 3+ in the main layer structure of monosulfate for the 104 peak at<br />
2θ = 22°. A peak splitting was observed between 0.45 and 0.95 Al/(Al + Fe) ratio. This<br />
indicated a mixture of two monosulfate instead of one solid solution containing Al and<br />
Fe. This suggested a miscibility gap in the solid solution series exists in the range 0.45<br />
CHAPTER 3 SYNTHETIC FE-CONTAINING HYDRATES<br />
found to vary at 0.0 < Al/(Al+Fe) < 0.45. Two distinct unit cell parameters in the samples<br />
at 0.45
CHAPTER 3 SYNTHETIC FE-CONTAINING HYDRATES<br />
3.2.7. Solubility of Al/Fe-monosulfate<br />
The composition of the solutions in equilibrium with Fe-monosulfate was determined<br />
after different equilibration times and at different temperature (Table 17). The very low<br />
Fe-concentration indicated the presence of Fe-hydroxide as also visible from the red color<br />
of the sample.<br />
3.2.7.1. Determination of solubility products at 20, 50 and 80 °C<br />
The measured concentrations of calcium, iron, sulfur and hydroxides were used to<br />
calculate the solubility products using GEMS. The solubility products are given by:<br />
Ks0,Fe-monosulfate = {Ca 2+ } 4 . {FeO2 - } 2 {SO4 2- } . {OH - } 4. {H2O} 10<br />
Ks0,Fe-hydroxide = {FeO2 - } 2 {OH - } -1. {H2O} 1<br />
Ks0,portlandite = {Ca 2+ } {OH - } 2<br />
where {} denotes the activity.<br />
The calculated solubility products at different equilibration times and temperature are<br />
listed in Table 17. The ion activity product of portlandite calculated at 20 °C is<br />
comparable with the theoretical solubility product of -5.2 at 25 °C [45] indicating the<br />
presence of portlandite in agreement with the XRD and TGA data and the validity of the<br />
measured calcium concentrations and pH values. The calculated ion activity product of<br />
Fe-hydroxide in the kinetic experiments suggested the presence of Fe-hydroxide. This is<br />
consistent with the red color observed in all Fe-containing samples.<br />
80
CHAPTER 3 SYNTHETIC FE-CONTAINING HYDRATES<br />
Table 17 Measured ion concentrations and calculated solubility products at different equilibration times.<br />
Equlibration<br />
time<br />
Temperature Ca Fe K S +pH log Ks0 log Ks0 log Ks0 Solid phases<br />
[days] [°C] [mmol/l] [mmol/l] [mmol/l] [mmol/l] C4FsH12 Fe(OH)3 CH present<br />
7 20 2.94 0.00057 357 64.0 13.05 -31.63 -5.67 -4.93 CH, C2F, Fe(OH)3<br />
28 20 2.84 0.00047 373 64.2 13.18 -31.80 -5.78 -4.90 CH, C2F, Fe(OH)3<br />
120 20 1.97 0.00195 346 50.8 13.39 -31.21 -5.16 -5.05 C4FsH12, CH, C2F, Fe(OH)3<br />
360 20 3.22 0.00107 349 38.6 13.40 -30.82 -5.47 -4.74 C4FsH12, CH, C2F, Fe(OH)3<br />
680 20 2.04 0.00079 366 47.0 13.44 -31.86 -5.60 -4.96 C4FsH12, CH, C2F, Fe(OH)3<br />
Average -31.30±0.30 -5.53±0.01 -4.92±0.10<br />
7 50 1.57 0.00122 356 57.4 13.08 -33.04 -5.39 -5.40 C4FsH12, CH, C2F, Fe(OH)3<br />
28 50 1.35 0.00097 372 50.5 13.21 -33.40 -5.50 -5.39 C4FsH12, CH, C2F, Fe(OH)3<br />
120 50 1.12 0.00281 341 38.6 13.40 -33.02 -5.11 -5.48 C4FsH12, CH, C2F, Fe(OH)3<br />
360 50 2.87 0.00143 361 49.5 13.37 -33.02 -5.95 -5.08 C4FsH12, CH, Fe(OH)3<br />
Average -33.12±0.30 -5.49±0.01 -5.34±0.10<br />
7 80 0.8 0.00351 354 60.6 13.06 -34.92 -5.10 -6.02 C4FsH12, CH, Fe(OH)3<br />
28 80 1.07 0.00278 368 66.4 13.13 -5.36 -5.89 CH, Fe2O3<br />
120 80 1.17 0.00283 358 67.2 13.30 -5.41 -5.88 CH, Fe2O3<br />
360 80 3.44 0.00161 326 69.3 13.20 -6.26 -5.50 CH, Fe2O3<br />
Average -34.92±0.30 -5.53±0.01 -5.82±0.10 CH, Fe2O3<br />
Detection limits [mmol/l]: Al = 0.001 Ca = 0.0004, Fe = 0.0000006, K = 0.0024, S=0.0014, Si=0,0002 measurement uncertainty ±10% , + pH measured at 20 °C, Due to the strong dependence of the H +<br />
activity on temperature, a pH value of 13.2 at 20 °C corresponds to12.3 at 50 and to11.6 at 80 °C. The solubility product for portlandite are -5.15(20 °C), -5.51(50 °C) and -5.95(80 °C) and for Fehydroxide<br />
-4.77 (20 °C), -3.81(50 °C) and -3.00(80 °C) [44, 45]<br />
81
CHAPTER 3 SYNTHETIC FE-CONTAINING HYDRATES<br />
The solutions equilibrated up to 680 days were saturated with respect to Fe-hydroxide.<br />
The mean solubility product of Fe-monosulfate between 120 and 680 days was used at 20<br />
°C. The value of -31.30 is approximately 2 log units higher than the value of -33.06<br />
recalculated from the concentrations measured between pH 13.2 and 13.4 in the Fe-<br />
ettringite experiments by Möschner et al. [15] from under- and oversaturation. Note that<br />
Möschner et al. [15] had calculated somewhat lower solubility products (-32.8 to -34.2)<br />
using a different by of 0.064 (for NaCl electrolyte) instead of the 0.123 (for KOH<br />
electrolyte) used here for the activity corrections in the Truesdell-Jones form as given in<br />
section 2.3.3. The solubility product at 50 °C and 80 °C were determined to be -33.12 and<br />
-34.92, respectively. At 80 °C Fe-monosulfate was unstable with respect to portlandite<br />
and hematite within 28 days. The solubility of Fe-monosulfate decreases at higher<br />
temperature (Fig. 34), indicating that Fe-monosulfate is more stable at higher<br />
temperature. Nevertheless, also the stability of Fe-hydroxide, portlandite and hematite<br />
and also their kinetic of formation is changing.<br />
3.2.7.2. Determination of solubility products under standard condition<br />
The solubility product at standard conditions was calculated with the help of GEMS-PSI<br />
using the three term temperature extrapolation from the solubility products obtained at<br />
20, 50 and 80 °C. The procedures to calculate temperature-dependent log K value was<br />
described in chapter 2.3. The heat capacity of Fe-monosulfate was estimated from the<br />
heat capacity of Al-monosulfate (Cp =942 J/(mol K)) measured Ederova and Satava [46]<br />
using the reference reaction given in Table 3. The measured solubility products at 20, 50<br />
and 80 °C were used to fit the entropy of reaction, as previously described elsewhere [7,<br />
51, 62]. The heat capacity, enthalpy and entropy obtained are compiled in Table 18. The<br />
82
CHAPTER 3 SYNTHETIC FE-CONTAINING HYDRATES<br />
calculated values as a function of temperature as shown in Fig. 34 are also used to derive<br />
the solubility product of Fe-monosulfate at 25 °C. The value is -31.57, roughly 2 log unit<br />
lower than the solubility product of Al-monosulfate [52]. This shows that Fe-monosulfate<br />
is more stable than Al-monosulfate, similar to the observations made for Fe- and Al-<br />
monocarbonate [19]. While the heat capacity, Cp of Fe-monosulfate (968 J/K.mol) is<br />
identical to the heat capacity reported in Möschner et al. [15], the entropy fitted to the<br />
measured data (1430 J/(K . mol), (Table 18) is considerably higher than the entropy of 858<br />
J/(K . mol) estimated by Möschner et al. [15] based on the reference reaction given in<br />
Table 3 and the value of 833.3 J/(K . mol) estimated by Blanc et al. [91] using a similar<br />
reference reaction. The calculated thermodynamic parameters are compiled in Table 18.<br />
Table 18 Thermodynamic parameters of Fe-monosulfate at standard conditions (25°C, 1 atm).<br />
Phases log Ks0<br />
ΔfG°<br />
[kJ/mol]<br />
Δf H°<br />
[kJ/mol]<br />
S 0<br />
[J/mol/K]<br />
C 0 p<br />
[J/mol/K]<br />
a0<br />
[J/(mol.K)]<br />
a1<br />
[J/(mol.K 2 )]<br />
a2<br />
[J K/mol]<br />
a3<br />
[J/(mol.K 0.5 )]<br />
V 0<br />
[cm 3 /mol] Ref.<br />
C4AsH12 -29.26 -7778.5 -8750.0 821 942 594 1.168 0 0 309 [7]<br />
C4FsH12 -31.57 -6873.2 -7662.6 1430 968 577 1.234 2.E+06 0 321 t.s<br />
t.s: this study<br />
83
log Ks0<br />
-30<br />
-31<br />
-32<br />
-33<br />
-34<br />
-35<br />
-36<br />
-37<br />
CHAPTER 3 SYNTHETIC FE-CONTAINING HYDRATES<br />
this study<br />
Möschner et al 2008<br />
0 20 40 60 80 100<br />
Temperature °C<br />
Fig. 34 Calculated solubility products of Fe-monosulfate from the solubility experiments.<br />
symbols: experimental data.<br />
3.2.7.3. Determination of solubility product of the solid solution and<br />
modeling of the liquid phase<br />
The compositions of the liquid phases in equilibrium with monosulfate at varying Al/(Al<br />
+Fe) ratios were determined (Table 19). In the presence of pure Fe-monosulfate, at<br />
relatively high sulfate concentrations, intermediate calcium concentrations and very low<br />
iron concentrations were measured. Iron concentrations were limited by the presence of<br />
iron hydroxide, calcium by the solubility of portlandite. In the presence of aluminum, the<br />
sulfate concentrations decreased gradually from 47 mmol/l to 1.8 mmol/l, resulting in a<br />
corresponding increase in hydroxide concentrations and a decrease in the calcium<br />
84
CHAPTER 3 SYNTHETIC FE-CONTAINING HYDRATES<br />
concentrations from 2 to 1 mmol/l. For the Fe-free Al-monosulfate, a lower calcium<br />
concentration, sulfate and aluminum concentrations were measured. Generally the<br />
aluminum concentrations were 100 to 1’000 times larger than the iron concentrations<br />
which were limited by the precipitation of Fe(OH)3. In the aluminum free sample<br />
(XAl/(Al+Fe) = 0.0), 0.63mmol/l of Al was detected. This indicates that the samples were<br />
contaminated by Al. Additional investigations indicated that aluminum contamination<br />
had occurred during dilution of the samples with HNO3; thus all measurements were<br />
corrected by 0.63 mmol/l Al “blank” value (see Table 19). However, even after this<br />
correction the calculated solubility products of Al-monosulfate and Al-ettringite were<br />
approximately 1 log unit higher than expected (see Table 20).<br />
Table 19 Compositions of Al/Fe-monosulfate after synthesis at 20°C equilibrated for 680 days in<br />
supersaturated condition.<br />
Al/Fe+Al Al Al* Ca Fe K S OH +pH Solid phases<br />
Ratio [mmol/l] [mmol/l] [mmol/l] [mmol/l] [mmol/l] [mmol/l] [mmol/l] present<br />
0 0.63
CHAPTER 3 SYNTHETIC FE-CONTAINING HYDRATES<br />
GEMS is set up for one ion substituting another ion in one crystallographic site per end<br />
member. To fulfill this condition the stoichiometry of both end members, the logKs0<br />
values and the G° as given in Table 18 were downscaled by a factor 2:<br />
KAl-Ms . XAl-Ms . γAl-Ms = 2×({Ca 2+ } 2 {AlO2 - } 1 {SO4 2- } 0.5 {OH - } 2. {H2O} 5 )<br />
KFe-Ms . XFe-Ms . γFe-Ms = 2×({Ca 2+ } 2 {FeO2 - } 1 {SO4 2- } 0.5 {OH - } 2 {H2O} 5 )<br />
ΣΠ= 2×(0.5KAl-Ms.XAl-Ms.γAl-Ms + 0.5KFe-Ms.XFe-Ms.γFe-Ms) = 2×({Ca 2+ } 2 [{AlO2 - }+{FeO2 - }]<br />
{SO4 2- } 0.5 {OH} 2 {H2O} 5 )<br />
KAl-Ms and KFe-Ms are the solubility products of the end members of Al-monosulfate and<br />
Fe-monosulfate; XAl-Ms and XFe-Ms mole fractions of Al-Ms and Fe-Ms in the solid; γAl-Ms<br />
and γAl-Ms the activity coefficients. The activity coefficients are calculated according to:<br />
ln.γAl-Ms= X 2 Fe-Ms[a0 –a1(3 XAl-Ms – XFe-Ms)]<br />
ln.γFe-Ms= X 2 Al-Ms[a0 –a1(3 XFe-Ms – XAl-Ms)]<br />
The software MBSSAS [59] was used to derive the Guggenheim parameters a0 = 1.26<br />
and a1 = 1.57 based on the experimentally-observed miscibility gap between 0.45 <<br />
Al/(Al + Fe) < 0.95 in the monosulfate binary solid solution series. A detailed<br />
description of MBSSAS is given elsewhere [59].<br />
86
CHAPTER 3 SYNTHETIC FE-CONTAINING HYDRATES<br />
Table 20 Solubility products of all the solids formed during the synthesis of Al/Fe-monosulfate<br />
solid solution series at 20 °C equilibrated for 680 days under supersaturated condition.<br />
Al/(Al+Fe) logKs0 logKs0 logΣΠ logKs0 logKs0 logKs0<br />
Ratio C4AsH12 C4FsH12 C4(A,F)sH12 Fe(OH)3 CH C6As3H32<br />
0.0 n.d -31.86 -31.86 -5.60 -4.96<br />
0.1 n.d -33.95 n.d -6.34 -4.98<br />
0.2 n.d -34.72 n.d -6.27 -4.99<br />
0.3 -28.83 -34.91 -28.83 -6.28 -4.97 -43.74<br />
0.4 -28.69 -33.92 -28.69 -5.82 -4.95 -43.62<br />
0.5 -28.41 -33.79 -28.41 -5.80 -4.92 -43.35<br />
0.6 -28.84 -33.10 -28.83 -5.32 -4.97 -43.95<br />
0.7 -28.46 -32.59 -28.45 -5.14 -4.94 -43.47<br />
0.8 -28.38 -34.75 -28.38 -6.27 -4.92 -43.32<br />
0.9 -28.59 -35.08 -28.59 -6.31 -4.99 -43.61<br />
1.0 -28.43 -28.43 -43.46<br />
Average -5.91 -4.96<br />
Theoretical Values* -29.40 -31.3 -4.77 -5.15 -44.7<br />
* The theoretical solubility products at 20 °C were calculated using GEMS and the implemented standard database [3, 7, 44, 45].<br />
For Fe-monosulfate the values derived in this study from Table 17 were given. n.d: not determined<br />
A Lippmann diagram (for details see section 2.3.3) was drawn to describe the solid<br />
solution formation between Al and Fe-monosulfate. In the Lippmann diagram two<br />
different superimposed x-axis are used. The total solubility products are plotted as a<br />
function of Xsolid, the solid Al/(Al + Fe) ratio (solidus) and as a function of Xliquid, the<br />
Al/(Al + Fe) ratios in the solution (solutus). The solidus-solutus phase diagram helps to<br />
display all possible equilibrium states of the solid solution series during Al-Fe<br />
substitution in the main layer structure of monosulfate. The measured solubility products<br />
of Fe-monosulfate logKs0 = -31.86 and Al-monosulfate logKs0 = -28.43 as given in<br />
(Table 20) were used to model the solidus and solutus solubility curve. The solubility<br />
product of Al-monosulfate obtained in this study at 20 °C was -28.43, which is within the<br />
range of reported literature values -27.7 [92] to -29.8 [93]. This value is approximately<br />
one log unit higher than the value (-29.26) obtained by Matschei et al. [7] for 25 °C.<br />
87
CHAPTER 3 SYNTHETIC FE-CONTAINING HYDRATES<br />
The presence of a continuous solid solution with a miscibility gap between Al- and Fe-<br />
monosulfate has been observed by XRD (Fig. 32 and Fig. 33). In the Lippmann diagram<br />
both an ideal (dashed lines) and a solid solution with miscibility gap (solid line) were<br />
plotted (Fig. 35). In the case of ideality the parameters a0 and a1 are equal to zero and the<br />
activity coefficients of the end members equal to one (γAl-Ms = γFe-Ms=1). For the non-ideal<br />
solid solution the dimensionless parameters a0 = 1.26 and a1 = 1.57 were used as<br />
described above.<br />
If an ideal solid solution is assumed, the modeled total solubility products of the solidus<br />
underestimate the total experimentally determined solubility products as shown in Fig.<br />
35. The non-ideal solid solution with a miscibility gap at 0.45 < Al/(Al + Fe) ratio < 0.95<br />
(solid lines) shows somewhat better agreement with the experimental values.<br />
88
CHAPTER 3 SYNTHETIC FE-CONTAINING HYDRATES<br />
Fig. 35 Lippmann diagram illustrating the total solubility products of Al/Fe-monosulfate solid<br />
solution series: total experimentally determined solubility product (symbols), modeled<br />
total solubility products assuming ideal solid solution (dashed lines), modeled total<br />
solubility products assuming a non-ideal solid solution with a miscibility gap (a0= 1.26<br />
and a1= 1.57) (solid lines) and solubility products assuming no solid solution (dotted<br />
lines). X-axis: Al/(Al + Fe) ratios in the solid and Al/(Al + Fe) ratios in the liquid.<br />
The liquid phase composition in the presence of (CaO)3(AlxFe1-x)2O6CaSO412H2O<br />
(x=0.0, 0.1,….,0.9, 1.0) was calculated with the derived thermodynamic parameters as<br />
compiled in Table 20 using GEMS. As discussed above, the solubility products were<br />
89
CHAPTER 3 SYNTHETIC FE-CONTAINING HYDRATES<br />
normalized so that the number of exchangeable sites equaled to 1: CaO1.5(AlxFe1-<br />
x)O3 1 /2CaSO46H2O.<br />
The modeling was done assuming the non-ideal solid solution model with the miscibility<br />
gap using a0 = 1.26 and a1 = 1.57 for Al and Fe-monosulfate as shown in Fig. 35. The co-<br />
precipitation of portlandite, Fe-hydroxide and Al-ettringite was calculated in agreement<br />
with the experimental observations in the solid phase (see Table 19). Fig. 36 shows the<br />
calculated and measured compositions of the liquid phase. Both the calculated and the<br />
measured data show a reasonable agreement.<br />
Fig. 36 Measured (points) and calculated (lines) concentrations in the liquid phases of the<br />
synthesized monosulfate with different Al/(Al+Fe) mole ratio, assuming a continuous<br />
solid solution with a miscibility gap.<br />
90
CHAPTER 3 SYNTHETIC FE-CONTAINING HYDRATES<br />
3.2.8. Conclusions<br />
The formation of Fe-monosulfate was slow as also noted for the other Fe-containing<br />
phases. Portlandite and Fe-oxide/hydroxide co-precipitated with Fe-monosulfate at all<br />
equilibration times. At 80 °C Fe-monosulfate was unstable with respect to portlandite and<br />
Fe-oxide/hydroxide after a few days.<br />
Fe-monosulfate crystalizes in rhombohedral R3 c symmetry. The structure of Fe-<br />
monosulfate is similar to that of Al-monosulfate so that substitution of Al by Fe in the<br />
main layer structures seems possible. In the dried samples generally two Fe-monosulfates<br />
with different water content were observed. The main phase found was C4FsH12 with an<br />
interlayer distance of 8.87 Å and in addition the interlayer distance at 8.36 Å tentatively<br />
assigned to C4FsH10. Raman data showed shifting of the band positions that could<br />
indicate a possible solid solution formation. Similarly, also the XRD data showed a<br />
systematic shift of XRD peaks with different Al/(Al +Fe) ratios that confirmed the<br />
formation of a solid solution between the Al- and Fe-monosulfate with miscibility gap<br />
between 0.45 < Al/(Al + Fe) < 0.95.<br />
The solubility products of Fe-monosulfate were determined to be -31.30, -33.12 and -<br />
34.92 at 20, 50 and 80 °C respectively. The solubility product at standard condition was<br />
calculated to be -31.57 which is 2 log units lower than the one of Al-monosulfate (-<br />
29.26).<br />
In conclusion, the solubility products as well as the solution compositions changed as a<br />
function of the Al/(Al+Fe) ratios which indicated a solid solution formation between Al<br />
and Fe-monosulfate. Stability of the solid increased as Fe substituted Al in monosulfate.<br />
In the presence of iron, portlandite and iron hydroxide were always present in addition to<br />
monosulfate.<br />
91
CHAPTER 3 SYNTHETIC FE-CONTAINING HYDRATES<br />
3.3. Fe-Friedel’s salt (3CaO . Fe2O3 . CaCl2 . 10H2O)<br />
3.3.1. Introductions<br />
A number of investigations have been carried out on the chloride binding capacity of<br />
cement forming Al-bearing Friedel’s salt [54, 68, 74, 75, 78, 94-96]. Moreover, chlorides<br />
can react with ferrite and form Fe-bearing Friedel’s salts. The formation of Fe-Friedel’s<br />
salt was observed in cement free systems [88, 95-97].<br />
The aim of this study was to determine the thermodynamic properties Fe-Friedel’s salt.<br />
Moreover, the formation of this phase was investigated and characterized under different<br />
condition.<br />
3.3.2. Kinetics of formation<br />
In this study Fe-Friedel’s salt (3CaO.Fe2O3.CaCl2.10H2O) was synthesized using 3<br />
different methods (see section 2.1.3). Fig. 37 shows the XRD patterns of the solid<br />
synthesized from FeCl3.6H2O and CaO in 0. 1M KOH. The sharp peaks of the Fe-<br />
Friedel’s salt indicate the presence of a well crystalline solid. Fe-Friedel’s salt started to<br />
form after 7 days of equilibration and the peak position is at 2θ = 11.37° (basal spacing d<br />
= 7.76 Å) (see Fig. 37).<br />
92
Intensity [arb. units]<br />
Fe-Fr<br />
CHAPTER 3 SYNTHETIC FE-CONTAINING HYDRATES<br />
Fe-Fr<br />
Fe-Fr Fe-Fr<br />
10 15 20<br />
2CuK<br />
25 30<br />
Cc<br />
3 years<br />
270 days<br />
180 days<br />
28 days<br />
7 days<br />
Fig. 37 XRD pattern of 3CaO . Fe2O3 . CaCl2 . 10H2O (Fe-Fr) synthesized at 20 °C and sampled after<br />
different equilibration times from FeCl3.6H2O and CaO in 0.1 M KOH.<br />
Another synthesis of Fe-Friedel’s salt was carried out using C2F, CaO and CaCl2.2H2O to<br />
obtain a different hydroxide concentration and understand the possible uptake of<br />
additional hydroxide in Fe-Friedel’s salt. Fe-Friedel’s salt started to form from C2F after<br />
7 days equilibration time. Portlandite and Fe-hydroxide co-precipitated with Fe-Friedel’s<br />
as observed previously for other Fe-AFm phases [19]. Traces of portlandite, Fe-<br />
hydroxide and possibly carbonate containing AFm phases were detected after three years<br />
of equilibration times. Fig. 38 showed that the XRD patterns of Fe-Friedel’s salt<br />
synthesized at different pH values (pH=11.94, 12.39 and 12.84) were very similar. At<br />
higher pH values, however, a slight peak shift of the 003 peaks towards higher 2θ values<br />
was observed, which could indicate the uptake of additional hydroxide in the interlayer<br />
of Fe-Friedel’s salt and thus a shift towards the position of C4FHx (2θ = 11.65°). Note<br />
that extensive solid solution formation has been observed between the Al-Friedel’s salt<br />
93
CHAPTER 3 SYNTHETIC FE-CONTAINING HYDRATES<br />
and C4AH13 [54]. The XRD data indicate that Fe-Friedel’s salt is thermodynamically<br />
stable within the pH range of 11.9 to 12.9. Possibly, also carbonate could replace chloride<br />
in the interlayer as has been observed between Al-monocarbonate and Al-Friedel’s salt<br />
[54, 78].<br />
Fig. 38 Comparison of the XRD patterns of Fe-Friedel’s salts equilibrated for three years at<br />
different pH values: synthesized a). FeCl3.6H2O and CaO in 0.1M KOH (pH = 11.94), b).<br />
C2F, CaCl2.2H2O and CaO in distilled water (pH = 12.39) and c). C2F, CaCl2.2H2O, and<br />
CaO in 0.1 M KOH (pH = 12.84), CH-portlandite.<br />
In addition, the TGA-DTG analysis indicated fast formation of Fe-Friedel’s salt. The<br />
weight loss from the interlayer structure occurred in two steps as observed for other AFm<br />
phases [19]. The 4 water molecules from the interlayer are lost at around 140 °C and the<br />
water of the main layer above 200 °C. The peak at 575 °C corresponds to the loss of CO2<br />
94
CHAPTER 3 SYNTHETIC FE-CONTAINING HYDRATES<br />
present due to CO2 contamination. The peak of carbonate decreased over time. The<br />
varying carbonate content indicates that carbonation occurred mainly during sample<br />
drying of the solids (Fig. 39). A substitution of Cl - by CO3 2- in C3FCaCl2H10 - C4FcH12<br />
system could be possible as reported for the Al containing Friedel’s salt [54].<br />
weight loss in %<br />
differentiated relative weight<br />
100<br />
90<br />
80<br />
70<br />
60<br />
-0.1<br />
-0.2<br />
-0.3<br />
Fe-Fr<br />
Fe-Fr<br />
carbonate<br />
200 400 600 800<br />
Temperature (°C)<br />
Fe-Fr-7days<br />
Fe-Fr-28days<br />
Fe-Fr-180days<br />
Fe-Fr-270days<br />
Fe-Fr-3years<br />
Fig. 39 TGA-DTG curves of Fe-Friedel’s salt synthesized at 20 °C and sampled after different<br />
equilibration times from FeCl3.6H2O and CaO in 0.1M KOH.<br />
3.3.3. Structure of Fe-Friedel’s salt<br />
The solid synthesized by mixing appropriate amounts of C2F, CaCl2.2H2O and CaO in<br />
0.1 M KOH equilibrated for 500 days (pH = 12.39) was used for the crystallographic<br />
investigation of Fe-Friedel’s salt. Laboratory XRD and TGA results of this solid are<br />
shown in the appendix.<br />
Multipattern Rietveld refinement was performed as shown in Fig. 40. The sample<br />
consisted mainly of 3CaO.Fe2O3.CaCl2.10H2O (90 wt.%), some portlandite (3 wt.%) and<br />
calcite (7 wt.%).<br />
95
CHAPTER 3 SYNTHETIC FE-CONTAINING HYDRATES<br />
Fig. 40 Rietveld plot for Fe-Friedel’s salt recorded at = 0.697751 Å and at a sample-to-detector<br />
distance of 150 mm.<br />
The refined structural model was found to be identical to that of the data published by<br />
Rousselot et al. [96]. Fe-Friedel’s salt crystallized in rhombohedral structure with R3 c<br />
symmetry. The unit cell parameters were: a = 5.8567 (2) Å and c = 23.314 (1) Å (V =<br />
692.57 (5) Å 3 ). The Fe-Friedel’s salt is composed of a positively charged main layer<br />
[Ca2Fe(OH)6] + with a possible substitution of Fe 3+ by Al 3+ and negatively charged<br />
interlayer [Cl 2H2O] - with a possible substitution of Cl - by 1/2CO3 2- or OH - .<br />
Table 21 showed the refined structural parameters of Fe-Friedel’s salt. The structure<br />
corresponds to the high temperature phase of Al-Friedel’s salt (the rhombohedral HT-<br />
structure is observed above 35 °C for pure Friedel’s salt; i.e. calcium aluminate without<br />
carbonate contamination) [74, 75]. The large Biso values of the interlayer species<br />
(chloride and water molecules) can be explain either by dynamical disorder within the<br />
96
CHAPTER 3 SYNTHETIC FE-CONTAINING HYDRATES<br />
interlayer region or by carbonate contamination with CO3 2- , which substituted chloride in<br />
the 3b site.<br />
Table 21 Refined structural parameters of 3CaO.Fe2O3.CaCl2.10H2O (standard deviation is given<br />
in parentheses).<br />
Atom Wyckoff x y z Biso (Å 3 ) Occupancy<br />
Ca 6c 2/3 1/3 0.0255 (2) 1.2 (1) 1<br />
Fe 3a 0 0 0 1.2 (1) 1<br />
O (OH) 18f 0.270 (1) -0.053 (1) 0.0445 (3) 0.9 (2) 1<br />
Cl 3b 0 0 1/2 7.0 (4) 1<br />
O (H2O) 6c 2/3 1/3 0.1355 (5) 4.0 (4) 1<br />
3.3.4. Comparison of Al-Friedel’s salt and Fe-Friedel’s<br />
The structure of 3CaO.Al2O3.CaCl2.10H2O has been investigated by different researches<br />
[54, 75, 78, 94, 96]. The layered structure consists of a `brucite-like` main layer<br />
[Ca2(Al(OH)6] + separated by an interlayer [Cl H2O] - . The low temperature polymorph is<br />
monoclinic α-Friedel’s salt and at higher temperature (>35 °C) as rhombohedral β-<br />
Friedel’s salt [75, 98]. In this study, the structure of Fe-Friedel’s salt was found<br />
crystallize in rhombohedral symmetry. Structural transition could be possible in Fe-<br />
Friedel’s salt at lower temperatures. The rhombohedral structure of Al and Fe-Friedel’s<br />
salt indicates a possible substitution of aluminum by iron in the main layer and chloride<br />
by carbonate or hydroxide in the interlayer.<br />
Fig. 41 compares the thermal analysis of Al-Friedel’s salt and Fe-Friedel’s salt. Al-<br />
Friedel’s salt lost water from its structure in three steps. At a temperature up to 180 °C,<br />
the 4 interlayer water molecules were removed. The main layer water was removed in<br />
two steps at higher temperatures where each time 3 water molecules were lost around the<br />
two peaks at 265 and 380 °C. In the case of Fe-Friedel’s salt the water loss occurred in<br />
two distinct steps only. The 4 interlayer water molecules are at around 140 °C. For the<br />
main layer water, only one peak at around 260 °C was observed. However, water loss<br />
97
CHAPTER 3 SYNTHETIC FE-CONTAINING HYDRATES<br />
continued up to 400 °C. The theoretical total water loss of 3CaO . Al2O3 . CaCl2 . 10H2O<br />
corresponds with 32 wt.% well with the water loss observed in Fig. 41, while the water<br />
loss of 3CaO.Fe2O3.CaCl2.10H2O is due to the dilution by the presence of carbonate<br />
somewhat lower than the theoretical 29 wt.%. The decarbonation observed in the Fe-<br />
Friedels salt sample could be due to the presence of calcite or carbonate containing AFm<br />
phases.<br />
Fig. 41 Thermal analysis (TGA and DTG) of Al and Fe-Friedel’s salt synthesized from<br />
FeCl3.6H2O and CaO in 0.1 M KOH and equilibrated for 270 days.<br />
Raman spectrum was collected for Fe-Friedel’s salt as shown in Fig. 42. The carbonate<br />
contamination of the Fe-Friedel’s salt is clearly visible by the CO3 2- vibration at 1088 cm -<br />
1<br />
. Spectrum relative to hydrogen bonds network is observed in the spectral range from<br />
98
CHAPTER 3 SYNTHETIC FE-CONTAINING HYDRATES<br />
3000 cm -1 to 4000 cm -1 with sharp signals. In contrast, the O–H bands of vibrations in the<br />
structure of Al-Friedel’s salt are characterized by a broad signal [78].<br />
Fig. 42 Raman spectra recorded for Fe-Friedel’s salt crystal.<br />
3.3.5. Solid solution between Al and Fe-Friedel’s salt (3CaO(AlxFe1-<br />
x)2CaCl2.10H2O<br />
Kuzel et al. [88] observed only limited solid solution formation between Al- and Fe-<br />
Friedel’s salt at a temperature below 100 °C. In contrast, Goetz-Neunhoeffer et al. [97]<br />
and Rapin et al. [99] observed the existence of a continuous solid solution in Al/Fe-<br />
Friedel’s salt at room temperature (see Fig. 43). In this study, only a few samples with<br />
different Al/(Al + Fe) ratios were investigated. The samples were prepared from CaO and<br />
AlCl3.6H2O or FeCl3.6H2O in 0.1 M KOH. The results of this mixed Al/Fe-Friedel’s salt<br />
did not agree well with previously reported findings as shown in Fig. 43. Carbonation and<br />
the small number of samples made the results inconclusive. However, based on the study<br />
of Goetz-Neunhoeffer et al. [97] and Rapin et al. [99] a solid solution formation seems<br />
probable.<br />
99
unit cell parameter a (Å)<br />
6.0<br />
5.9<br />
5.8<br />
5.7<br />
CHAPTER 3 SYNTHETIC FE-CONTAINING HYDRATES<br />
0.0 0.2 0.4 0.6 0.8 1.0<br />
Al/(Al+Fe) ratio<br />
Goetz-Neunhoeffer 1996<br />
Rapin 2001<br />
Kuzel 1968<br />
Rousselot 2003<br />
this study<br />
Fig. 43 Values of a-parameters for the Al/Fe-Friedel’ salt solid solution determined in this study<br />
compared to the findings by Kuzel et al. [88], Goetz Neunhoeffer et al. [100], Rapin et al.<br />
[99] and Rousselot et al. [96].<br />
3.3.6. Solubility<br />
The concentrations of the solutions were measured after different equilibration times for<br />
pure Fe-Friedel’s salt (Table 22 and Table 23) and for mixed Al/Fe-Friedel’s salts (Table<br />
25). The measured ion concentrations were used for the calculation of the solubility<br />
products of Friedel’s salt.<br />
3.3.6.1. Solubility of Fe-Friedel’s salt<br />
The Fe-Friedel’s salt prepared from FeCl3.6H2O and CaO in 0.1 M KOH did not contain<br />
portlandite as also indicated by the low portlandite ion activity product (-6), thus<br />
indicating effectively undersaturation. The concentrations of calcium, chloride and iron in<br />
the aqueous phase were relatively high compared to the other samples; while the<br />
100
CHAPTER 3 SYNTHETIC FE-CONTAINING HYDRATES<br />
hydroxide concentrations were lower (pH 11.6 to 11.9). In contrast, Fe-Friedel’s salt<br />
prepared from C2F, CaCl2.2H2O and CaO co-precipitated with portlandite and Fe-<br />
hydroxide at pH values from 12.4 to 12.8. The aqueous phase had lower concentrations<br />
of calcium and chloride. The calculated ion activity products for Fe(OH)3 were (10 -4 to<br />
10 -3 ) unexpectedly high, which indicates that either the presence of chloride ions could<br />
result in a kinetic hindrance for Fe(OH)3 formation or alternatively mixed complexes<br />
between Fe 3+ , OH - and Cl - occur. Note that the latter complexes are not accounted for in<br />
the thermodynamic database (the known iron chloride complexes are rather weak and<br />
give no significant contribution at high pH values: FeCl 2+ , log K = 1.48, FeCl2 + , log K =<br />
2.13, and FeCl3 0 , log K = 1.13 in GEMS-PSI TDB. A literature search gave no evidence<br />
for the existence of FeCl4 - or mixed hydroxide-chloride-iron(III) complexes).<br />
The solubility product of the solid was calculated according to:<br />
Ks0, Fe-Friedel’s salt = {Ca 2+ } 4 . {FeO2 - } 2 {Cl - } 2 {OH - } 4. {H2O} 8<br />
The Ks0 values were calculated based on the measured concentrations of Ca, Fe, Cl and K<br />
and the activity coefficients obtained with GEMS. The pH values were adapted by<br />
varying the concentrations of KOH to the measured pH values. The solubility products of<br />
Fe-Friedel’s salt prepared at different pH values are presented in Table 22 and Table 23.<br />
101
CHAPTER 3 SYNTHETIC FE-CONTAINING HYDRATES<br />
Table 22 Measured ion concentrations and calculated solubility products at 20 °C and sampled<br />
after different equilibration times synthesized from FeCl3.6H2O and CaO in 0.1M K<br />
OH.<br />
Age Ca K Fe Cl #pH +pH log Ks0 log Ks0 log Ks0<br />
(days) [mmol/l] [mmol/l]l [mmol/l] [mmol/l] Fe-Fr Fe(OH)3 CH<br />
7 162 93 0.0027 422 11.62 11.61 -28.40 -3.14 -6.55<br />
28 161 98 0.0020 419 11.40 11.42 -29.45 -3.08 -6.94<br />
180 146 87 0.0023 427 11.61 11.53 -29.04 -3.13 -6.76<br />
270 144 88 0.0028 399 11.69 11.70 -28.23 -3.22 -6.41<br />
1100 149 88 0.0059 410 11.94 11.88 -26.83 -3.07 -6.06<br />
Average -28.39±0.50 -3.13±0.20 -6.55±0.30<br />
Detection limits [mmol/l]: Al = 0.001 Ca = 0.0004, Fe = 0.0000006, K = 0.0024, S=0.0014, Si=0.0002, Cl=0.003 , measurement<br />
uncertainty ±10%, #pH measured at 20°C, + calculated pH by GEMS.<br />
Table 23 Measured ion concentrations and calculated solubility products at 20 and 50°C and<br />
sampled after different equilibration times synthesized from C2F, CaCl2.2H2O and CaO<br />
in distilled water and in 0.1 M KOH.<br />
Age Temp. Ca K Fe Cl #pH +pH log Ks0 log Ks0 log Ks0<br />
(days) [°C] [mmol/l] [mmol/l] [mmol/l] [mmol/l] Fe-Fr Fe(OH)3 CH<br />
180 20 35.0
CHAPTER 3 SYNTHETIC FE-CONTAINING HYDRATES<br />
available to describe this possible solid solution series and thus for further calculations<br />
only the solubility product of -28.39 determined in the pH range from 11.4 to 11.8 was<br />
used. The solubility product at 50 °C was -29.89 (Table 23). The above values were used<br />
to obtain the temperature-dependent ‘log K’ function, which allowed the solubility<br />
products to be calculated at different temperatures as described in chapter 2.3. The<br />
temperature dependent solubility product of Fe-Friedel’s salt was computed as shown in<br />
Fig. 45. The heat capacity of Fe-Friedel’s salt (855 J/(mol.K)) was estimated similar as<br />
that for the Al-Friedel’s salt (829 J/(mol.K)). The entropy was adjusted until good<br />
agreement between measured and calculated solubility product was reached. The<br />
solubility product at standard conditions was also calculated with the help of GEMS-PSI<br />
using temperature extrapolation from the solubility products calculated at 20 °C and 50<br />
°C. The thermodynamic properties of the solids at 25 °C are listed in Table 24.<br />
logKs0<br />
‐25<br />
‐27<br />
‐29<br />
‐31<br />
‐33<br />
11.5 12<br />
pH<br />
12.5 13<br />
Fig. 44 Experimental determined solubility products of Fe-Friedel’s salt as a function of pH.<br />
103
log Ks0<br />
‐27<br />
‐28<br />
‐29<br />
‐30<br />
‐31<br />
‐32<br />
‐33<br />
‐34<br />
CHAPTER 3 SYNTHETIC FE-CONTAINING HYDRATES<br />
calculated<br />
Fe‐Fr, this study<br />
Al‐Fr, Balonis et al 2010<br />
Al‐Fr, Abate et al 1995<br />
Al‐Fr, Bothe et al 2004<br />
Al‐Fr, Birnin‐Yauri et al 1998<br />
Al‐Fr, this study<br />
Al‐Fr, Hobbs et al 2001<br />
0 20 40 60 80 100<br />
Temperature °C<br />
Fig. 45 Calculated solubility products of Fe-Friedel’s salt from the solubility experiments<br />
compared with the solubility product Al-Friedel’s salt calculated from measured<br />
concentrations reported in literature [54, 94, 101-103].<br />
Table 24 Thermodynamic parameters of Friedel’s salt at standard conditions (25 °C, 1 atm).<br />
Phases log KS0<br />
∆fG°<br />
[kJ/mol]<br />
ΔfH°<br />
[kJ/mol]<br />
S<br />
t.s: this study, Al-Fr: composition is C3ACl1.95H10.05<br />
0<br />
[J/(mol/K)]<br />
C 0 p<br />
[J/(mol/K)]<br />
a0<br />
[J/(mol.K)]<br />
a1<br />
[J/(mol.K 2 )]<br />
a2<br />
[JK /(mol)]<br />
a3<br />
[J/(mol.K 0.5 )]<br />
V 0<br />
[cm 3 /mol] Ref.<br />
Fe-Fr -28.62 -5900.1 -6525 1286 855 481 0.9611 -16130 1503 208 t.s<br />
Al-Fr -27.69 -6814.6 -7625 731 829 498 0.89 -2.03e+6 1503 272 [54]<br />
104
CHAPTER 3 SYNTHETIC FE-CONTAINING HYDRATES<br />
3.3.6.2. Determination of the solubility products of the solid solution and<br />
modeling of the liquid phase<br />
The total solubility products of the solid solution and the solubility products of Al and<br />
Fe-Friedel’s salt were calculated based on the solution compositions for Al/Fe-Friedel’s<br />
salt as presented in Table 25. The concentrations of calcium and chloride were lower for<br />
the Fe-containing end members and increased when Fe was substituted by Al. At the<br />
same time, the pH values decreased.<br />
Table 25 Compositions of Al/Fe-Friedel’s salt synthesized at 20°C and equilibrated for 270 days<br />
under supersaturated condition.<br />
Al/(Al+Fe) Al Ca K Fe Cl #pH +pH log Ks0 log Ks0 logΣΠ log Ks0 log Ks0<br />
Ratio [mmol/l] [mmol/l] [mmol/l] [mmol/l] [mmol/l] Fe-Fr Al-Fr Al/Fe-Fr Fe(OH)3 CH<br />
0
CHAPTER 3 SYNTHETIC FE-CONTAINING HYDRATES<br />
Fig. 46 Measured (points) and calculated (lines) concentrations in the liquid phases of the<br />
synthesized Friedel’s salt at different Al/(Al+ Fe) ratio, assuming ideal solid solution.<br />
3.3.7. Conclusions<br />
The formation of Fe-Friedel’s salt was faster than the other AFm phases. For the<br />
aluminum based 3CaO.Al2O3.CaCl2.10H2O it was observed that, in the presence of<br />
carbonate and sulfate, the carbonate and sulfate containing AFm phases are more stable,<br />
if equimolar dissolved chloride, carbonate or sulfate concentrations are present [54]. At<br />
high chloride concentrations, however, all AFm phases convert to Friedel’s salt. Based on<br />
the comparison of the solubility product of 3CaO.Fe2O3.CaCl2.10H2O (-28.44) with Fe-<br />
monosulfate (-31.57) and Fe-monocarbonate (-34.59), a similar behavior can be expected<br />
for the Fe-system. As the solubility products of other Fe-containing AFm phases are 2 to<br />
3 log units lower than those of Al-AFm phases, this indicates a relatively low stability of<br />
106
CHAPTER 3 SYNTHETIC FE-CONTAINING HYDRATES<br />
Fe-Friedel’s salt in the presence of Al. Thermodynamic properties of Fe-Friedel’s salt<br />
have not been reported previously.<br />
The formation of solid solution in Friedel’salt is possible both in the main layer (Al and<br />
Fe substitution) and in the interlayer (chloride-hydroxy or carbonate substitution). For the<br />
Al-system, solid solution between carbonate and chloride AFm and the formation of an<br />
intermediate solid (Kuzel’s salt) is known. The extent of carbonate, hydroxy or sulfate<br />
substitution in the Fe-based Friedel’s salt is unclear and will need further investigations.<br />
Fe-Friedel’s salt was found to crystalize in a rhombohedral structure, such as also Fe-<br />
monocarbonate and Fe-monosulfate.<br />
107
CHAPTER 3 SYNTHETIC FE-CONTAINING HYDRATES<br />
3.4. Fe-strätlingite<br />
Different methods were used to synthesis Fe-strätlingite (C2FSH8). Appropriate amounts<br />
of Fe(OH)3, Na2SiO3 . 5H2O and CaO and alternatively of 2FeCl3.6H2O, Na2SiO3.5H2O,<br />
and 2Ca(NO3)2.4H2O were mixed in 0.1 M KOH and equilibrated for up to 200 days at<br />
20, 50 or 80 °C. The synthesis was not successful using either method. No C2FSH8 was<br />
observed but the formation of portlandite, C-S-H and iron hydroxide occurred, indicating<br />
the chemical instability of C2FSH8 with respect to these phases.<br />
108
CHAPTER 3 SYNTHETIC FE-CONTAINING HYDRATES<br />
3.5. Hydrogarnets<br />
3.5.1. Introduction<br />
In Portland cement hydrated at ambient temperatures only minor quantities of<br />
hydrogarnet have been observed [1, 4, 22, 65]. The formation of significant quantities of<br />
siliceous-hydrogarnet was reported for cements hydrated at higher temperatures [3, 37,<br />
104, 105] or in the presence of excess Fe(OH)3 [21, 104]. In general, the formation of<br />
aluminum-iron intermixed siliceous hydrogarnet (Ca3(AlxFe1-x)2(SiO4)3-y(OH)4y) was<br />
reported [22, 23, 35, 106]. At 200 °C and higher, their composition is strongly influenced<br />
by the curing temperature as additional amount of silica are built in the structure at higher<br />
temperatures [107]. In contrast to Portland cement systems, C3AH6 is a major hydrate<br />
formed during the hydration of calcium aluminate cements [108].<br />
Garnet minerals have a cubic structure with the general formula X3Y2(SiO4)3. The X site<br />
is usually occupied by divalent cations (Ca 2+ , Mg 2+ , Fe 2+ ) and the Y site by trivalent<br />
cations (Al 3+ , Fe 3+ , Cr 3+ ) in an octahedral/tetrahedral framework with [SiO4] 4− occupying<br />
the tetrahedral positions. The anhydrous end-members of the Ca3(Al,Fe)2(SiO4)3 series<br />
are grossular (Ca3Al2(SiO4)3) and andradite (Ca3Fe2(SiO4)3). Hydrogarnet<br />
(Ca3(Al,Fe)2(SiO4)3-y(OH)4y); y=0-3) includes a group of minerals where the [SiO4] 4−<br />
tetrahedral are partially or completely replaced by OH - . The Al-containing hydrogarnet<br />
includes hydrogrossular (Ca3Al2(SiO4)3-y(OH)4y); y=0-3) with the endmember katoite<br />
(Ca3Al2(OH)12 or C3AH6 in cement notation). The Fe-containing hydrogarnet is<br />
designated as hydroandradite (Ca3Fe2(SiO4)3-y(OH)4y; y=0-3) and Fe-katoite<br />
(Ca3Fe2(OH)12) or C3FH6. The nomenclature of minerals of the hydrogarnet group<br />
Ca3(AlxFe1-x)2(SiO4)3-y(OH)4y as recommended by Passaglia et al. [109] is given in Fig.<br />
47.<br />
109
C 3FH 6<br />
y=3<br />
Hydroandradite<br />
(x=0)<br />
C 3FS 3-yH 2y<br />
y=0<br />
Andradite x=0<br />
C3FS3 CHAPTER 3 SYNTHETIC FE-CONTAINING HYDRATES<br />
Grandites<br />
(y=0)<br />
C 3A xF 1-xS 3<br />
Katoite<br />
3≥y>1.5)<br />
C 3AS 3-yH 2y<br />
Hibschite<br />
1.5≥y>0)<br />
C 3AS 3-yH 2y<br />
Fig. 47 Nomenclature of minerals of the hydrogarnet group.<br />
Katoite<br />
C 3AH 6<br />
Hydrogrossular<br />
(x=1)<br />
C 3AS 3-yH 2y<br />
x=1 Grossular<br />
C 3AS 3<br />
The replacement of the [SiO4] 4− tetrahedral by 4OH - can result in a range of intermediate<br />
compositions. The extent of the solid solution formation depends strongly on the<br />
temperature. For Al-containing hydrogrossulars synthesized between 200 and 350 °C, the<br />
formation of a continuous solid solution from y=0 (C3AS3) to y=2.2 (C3AS0.8H4.4) was<br />
observed [107]. For samples synthesized at 95 °C, however, a miscibility gap from<br />
C3AS0.76H4.48 to C3AS0.42H5.52 was reported [110]. While the solubility of C3AH6 is well<br />
known [7, 91, 111-116], only a few studies determined solubility data for solids with<br />
composition from C3AS1.5H3 to C3AS0.42H5.52 [7, 91, 112, 117]. For the C3FH6-C3FS3<br />
solid solutions only estimated thermodynamic data exist [3, 118] and no information on<br />
the extent of the solid solution or possible miscibility gaps is available. C3FH6 is reported<br />
to be metastable and to decompose at ambient temperature [119]. It is also unclear to<br />
what extent Fe substitutes for Al in hydrogarnet.<br />
110
CHAPTER 3 SYNTHETIC FE-CONTAINING HYDRATES<br />
In present study different hydrogarnet compositions (Ca3(Al,Fe)2(SiO4)3-y(OH)4y); y ≤ 1)<br />
containing various amounts of aluminum, iron, OH - and SiO4 4- have been investigated.<br />
The solids were characterized by X-ray powered diffraction, thermogravimetric analysis<br />
and scanning electron microscopy. Synchrotron diffraction was used to study the<br />
structure of Fe siliceous hydrogarnet. The solubility products of the different<br />
hydrogarnets was calculated based on the measured concentrations.<br />
3.5.2. Al-Katoite, C3AH6<br />
Several studies have been carried out to date to determine the stability of CaO-Al2O3-<br />
H2O at different temperatures [7, 111-116]. C3AH6 is thermodynamically stable in the<br />
CaO-Al2O3-H2O system over the temperature range from 5 to 250 °C [7, 115, 116]. In<br />
many cases OH-AFm (C4AHx) precipitated in the initial stage, which generally converted<br />
to C3AH6 with time. Note that C4AHx is metastable with respect to C3AH6 at 20 °C and<br />
above. Solubility data for C4AHx have been determined from 1 to 90 °C [7, 113-116]. In<br />
the present study the formation of C3AH6 at 20, 50 and 80 °C was determined in 0.1 M<br />
KOH solutions (pH values ~ 13 at 20 °C).<br />
The XRD pattern shows that C3AH6 together with a small amount of C4AHx was already<br />
observed after 1 week (Fig. 48). The strong reflection assigned to C3AH6 at 2θ = 17.27°<br />
corresponds to a basal spacing d = 5.13 Å. Minor peaks with basal spacing d = 7.69 Å (2θ<br />
= 11.49°) were observed, which could be assigned to C4AHx. After three years of<br />
equilibration, a weak reflection was found with basal spacing d = 8.11 Å (2θ = 10.90°)<br />
indicating the presence of C4Ac0.5H12 due to CO2 contamination of the sample with time.<br />
At 50 and 80 °C, C3AH6 formed rapidly. The C4AHx present initially at 50 °C was<br />
replaced by hemi/mono-carbonate due to CO2 contamination at later ages (see Table 26).<br />
111
CHAPTER 3 SYNTHETIC FE-CONTAINING HYDRATES<br />
Fig. 49 shows the TGA-DTG curve of C3AH6 where the main loss of water occurred at<br />
around 300 °C. The water loss up to 350 °C equal to approximately 5H2O. The total<br />
water loss up to 600 °C (28 wt.%) is consistent with the presence of 6 waters in C3AH6.<br />
A minor weight loss at around 126 °C indicates the presence of traces of AFm phases<br />
(C4AHx and hemicarbonate) in the sample after three years of equilibration.<br />
Fig. 48 Time-dependent XRD pattern of C3AH6 synthesized at 20 °C, * C4AcH11.<br />
112
CHAPTER 3 SYNTHETIC FE-CONTAINING HYDRATES<br />
Fig. 49 Thermal analysis (TGA and DTG) of C3AH6 and C3FH6 synthesized at 20 °C and sampled<br />
after different equilibration times.<br />
113
CHAPTER 3 SYNTHETIC FE-CONTAINING HYDRATES<br />
Table 26 Measured ion concentrations at different equilibration times in 0.1 M KOH<br />
Age Temp. Ca Al Fe K +pH logKs0 logKs0 logKs0 logKs0 Solid phases present<br />
(days) [°C] [mmol/l] [mmol/l] [mmol/l] [mmol/l]<br />
C3AH6/<br />
C3FH6<br />
C4AH13/<br />
C4FH13 CH FH3<br />
C3AH6<br />
7 20 2.1 1.3 < D.L. 98 13.0 -20.14 -25.57 C3AH6, C4AHx<br />
28 20 1.8 1.4 < D.L. 103 13.0 -20.28 -25.78 C3AH6, C4AHx 1100 20 0.8 3.4 < D.L. 89 13.1 -20.64 -26.54 C3AH6, C4AHx<br />
Average -20.35±0.20 -25.96±0.25<br />
7 50 2.0 2.0 < D.L. 105 13.0 -20.45 -26.11 C3AH6, C4AHx, C4AcH11<br />
28 50 1.8 1.6 < D.L. 101 13.0 -20.83 -26.60 C3AH6, C4AHx, C4AcH11<br />
Average -20.64±0.20 -26.36±0.25<br />
7 80 2.2 2.4 < D.L. 113 13.0 -20.99 C3AH6, C4AcH11<br />
28 80 2 2.7 < D.L. 106 13.0 -21.02 C3AH6, C4AcH11<br />
Average -21.01±0.20<br />
C3FH6<br />
7 20 5.5 < 0.1 0.0124 95 13.0 -4.97 -3.98 C4FHx,C2F, CH<br />
28 20 4.7 < 0.1 0.0004 86 13.1 -26.06 -31.12 -5.05 -5.46 C4FHx,C2F, CH<br />
365 20 5.6 < 0.1 0.0003 96 13.0 -26.07 -31.05 -4.71 -5.62 C3FH6, C4FHx, CH<br />
1100 20 5.1 < 0.1 0.0004 92 13.0 -25.95 -4.96 -5.59 C3FH6,CH, C4FcH12<br />
Average >-26.03±0.20 -31.08±0.25 -4.92±0.04 -5.16±0.05<br />
7 50 4.8 < 0.1 0.0099 98 13.0 -23.89 -29.15 C3FH6, C4FHx, CH, C2F<br />
28 50 4.7 < 0.1 0.0002 88 13.1 CH, Fe2O2<br />
365 50 2.1 < 0.1 0.0004 101 13.0 CH, Fe2O3<br />
Average >-23.89±0.20 -27.1±0.25<br />
7 80 4.4 < 0.1 0.0043 91 13.0 -5.57 -4.42 CH, Fe2O3 28 80 1.8 < 0.1 0.0009 101 13.1 -5.97 -5.08 CH, Fe2O3 365 80 1.8 < 0.1 0.0005 96 13.0 -5.97 -5.34 CH, Fe2O3<br />
Average -5.84±0.20 -4.95±0.20<br />
Detection limits (mmol/l): Al = 0.001 Ca = 0.0004, Fe = 0.0000006, K = 0.0024, S=0.0014, Si=0.0002 measurement uncertainty ±10% , + pH measured at 20 °C. Due to the strong dependence of the H +<br />
activity on temperature, a pH of 13.0 at 20 °C corresponds to 12.1 at 50 °C and to 11.5 at 80 °C.<br />
114
CHAPTER 3 SYNTHETIC FE-CONTAINING HYDRATES<br />
Based on the measured compositions of the liquid phase (as given in Table 26), the<br />
solubility products at 20, 50 and 80 °C were calculated according to:<br />
KS0 (C3AH6) = {Ca 2+ } 3 . {AlO2 - } 2 . {OH - } 4 . {H2O} 4<br />
The values estimated for different equilibration times are given in Table 26 and shown in<br />
Fig. 50. The calculated solubility products are comparable with previously published data<br />
within the experimental error [7, 111, 112, 115]. The temperature dependent solubility<br />
product of C3AH6 was determined based on the solubility measured at 20, 50 and 80 °C<br />
in this study and from solubilities reported in the literature. The entropy was visually<br />
fitted until a good agreement between measured and calculated data was achieved (Fig.<br />
50).<br />
logKs0<br />
-20<br />
-20.5<br />
-21<br />
-21.5<br />
-22<br />
-22.5<br />
-23<br />
-23.5<br />
-24<br />
0 20 40 60 80 100 120<br />
Temperature (°C)<br />
Matschei et al 2007<br />
Atkins et al 1991<br />
Bennet et al 1992<br />
Peppler et al 1954<br />
this study<br />
Lothenbach et al 2011<br />
Roberts et al 1969<br />
Calculated<br />
Carlson et al. 1968<br />
Wells et al. 1943<br />
Fig. 50 Solubility products of C3AH6 calculated from the solubility experiments carried<br />
out in this study and from different published data [7, 111, 112, 114-116].<br />
115
CHAPTER 3 SYNTHETIC FE-CONTAINING HYDRATES<br />
The data of Carlson et al. [114] and Wells at el. [116] obtained at 1 and 21 °C were not<br />
considered as they deviate strongly from the other published data.<br />
The co-precipitation of C4AH13 with the target phase in all equilibration experiment<br />
enabled us to estimate the ion activity products of the OH-AFm based on the following<br />
equation:<br />
KS0 (C4AH13) = {Ca 2+ } 4 . {AlO2 - } 2 . {OH - } 6 . {H2O} 10<br />
The calculated data are given in Table 26. The ion activity products were determined to<br />
be -26.02 and -26.45 at 20 °C and 50 °C, respectively. These values are slightly lower<br />
than the value of -25.53 (20 °C) and -25.06 (50 °C) derived elsewhere [3]. The solubility<br />
at 50 °C is difficult to measure as the C4AH13 transformed relatively fast to C3AH6 or<br />
monocarbonate and thus the system possibly was undersaturated at the time of sampling.<br />
The standard molar thermodynamic properties of C3AH6 determined in this study are<br />
summarized in Table 27.<br />
Table 27 Thermodynamic parameters at standard conditions determined in this study (25°C, 1<br />
atm).<br />
Phases log KS0<br />
fG°<br />
[kJ/mol]<br />
fH°<br />
[kJ/mol]<br />
S 0<br />
[J/mol/K]<br />
C 0 p<br />
[J/mol/K]<br />
a0<br />
[J/(mol.K)]<br />
a1<br />
[J(/mol.K 2 )]<br />
a2<br />
[JK /mol]<br />
a3<br />
[J/(mol.K 0.5 )]<br />
C3AH6 -20.56 -5008.8 -5535 432 459 292 0.5610 150<br />
116<br />
V 0<br />
[cm 3 /mol]<br />
C4FH13 -30.64 -6438.0 -7431 640 956 694 1.1134 2.02E+06 -1600 286<br />
C3FS0.95H4.1 -32.75 -4523.5 -4854 855 612 582 0.6094 2.19E+06 -3040 156<br />
C3FS1.52H2.96 -34.68 -4752.8 -5044 847 688 766 0.5988 2.29E+06 -4864 161<br />
C3AS0.41H5.18 -25.47 -5193.5 -5717 342 441 198 0.5967 -9.98E+05 1312 151<br />
C3AS0.84H4.32 -26.70 -5365.2 -5867 310 421 100 0.6342 -2.05E+06 2688 142
CHAPTER 3 SYNTHETIC FE-CONTAINING HYDRATES<br />
3.5.3. Fe-katoite, C3FH6<br />
C3FH6 was attempted to synthesize at 20, 50 and 80 °C by mixing C2F and CaO in 0.1 M<br />
KOH. Trace amounts of metastable C3FH6 were observed in the samples equilibrated up<br />
to 1 year at 20 °C (2θ = 19.71, Fig. 51). However, C3FH6 disappeared and decomposed to<br />
portlandite and iron hydroxide with time. At longer equilibration time C4FcH12 was<br />
formed due to CO2 contamination, which destabilized the CaO-Fe2O3-H2O system. This<br />
shows the metastability of C3FH6 with respect to Fe-hydroxide and portlandite and in the<br />
presence of CO2 to hemi/monocarbonate. This metastability of C3FH6 agrees with the<br />
findings of Ecker et al. [12] and Rogers et al. [119]. The CaO-Fe2O3-H2O system is very<br />
sensitive to carbonation at room temperature. The sample synthesized hydrothermally at<br />
110° C contained portlandite and Fe-oxide/hydroxides and traces of C3FH6. Another<br />
weak reflection was observed corresponding to a basal spacing d = 7.58 Å (2θ=11.65°)<br />
which persisted at longer age. It does fit neither to C4Fc0.5H10 nor to C4FcH12. The peak<br />
was tentatively assigned to C4FHx with an unknown number of water molecules. All the<br />
samples showed a reddish color of the solids indicating the formation of XRD amorphous<br />
Fe-oxide/hydroxide in the CaO-Fe2O3-H2O system. The TGA-DTG curve also revealed<br />
the formation of traces of metastable C3FH6 (see Fig. 49).<br />
117
CHAPTER 3 SYNTHETIC FE-CONTAINING HYDRATES<br />
Fig. 51 Time-dependent XRD pattern of C3FH6 synthesized at 20 °C and the sample<br />
synthesized at 110 °C and equilibrated for 5 days.<br />
At 50 °C small amount of C3FH6 and C4FHx were observed in the solid equilibrated for 7<br />
days. Portlandite and iron hydroxide were the main phases observed at all equilibration<br />
times. At longer age, hematite (Fe2O3) started to crystallize as clearly observed by XRD.<br />
At 80 °C portlandite and hematite were the main constituents in the solid (see Table 26).<br />
This indicates the decomposition of iron hydroxide to hematite at higher temperature.<br />
Carbonation was not encountered at higher temperatures.<br />
The ion activity product of the metastable C3FH6 was estimated according to:<br />
Ks0 (C3FH6) = {Ca 2+ } 3 {FeO2 - } 2 {OH - } 4 {H2O} 4<br />
Synthesis of the solid shows that OH-AFm persisted up to one year. Assuming C4FHx is<br />
stable in the absence of carbonate, the solubility products were estimated as follows:<br />
Ks0 (C4FH13) = {Ca 2+ } 4 {FeO2 - } 2 {OH - } 6 {H2O} 10<br />
118
CHAPTER 3 SYNTHETIC FE-CONTAINING HYDRATES<br />
The values are listed in Table 26. The calculated ion activity product of C3FH6 represents<br />
a lower limit and will be higher in reality. The presence of both, the C3FH6 and the<br />
C4FH13, makes it impossible to determine the solubility product of the metastable C3FH6.<br />
As C4FH13 converted to monocarbonate with time, this solubility product should be<br />
considered as a rough estimate. The solubility product of C4FH13 is approximately 5 log<br />
units lower than that of C4AH13, (see Table 26). The solubility product of C3FH13 at<br />
standard conditions was calculated based on the solubility measured at 20 °C and 50 °C<br />
(see Table 27)<br />
3.5.4. Solid solution between aluminum and iron katoite, C3(A,F)H6<br />
The C3AH6 and C3FH6 have similar cubic structures with the unit cell parameter a =<br />
12.58 and 12.72 Å, respectively. It is very likely that similarity of the crystal structure<br />
could lead to a solid solution between those two compounds. Flint et al. [120] indicated<br />
that a solid solution between C3AH6 and C3FH6 exists only in the presence of silica.<br />
Roger et al. [119] pointed out that in the presence of iron, C3(A,F)H6, is unstable and<br />
converts to form portlandite, Fe-hydroxide, hematite and C3AH6.<br />
119
CHAPTER 3 SYNTHETIC FE-CONTAINING HYDRATES<br />
Fig. 52 XRD pattern of mixed Al and Fe hydrogarnets after 3 years equilibration.<br />
As shown above in Fig. 51, C3FH6 is unstable and the same was observed for mixed<br />
C3(A,F)H6 systems. In agreement with previous observations [119, 120], no substitution<br />
between Al 3+ by Fe 3+ in C3(A,F)H6 samples occurred in the absence of silica. In the<br />
absence of iron, C3AH6, hemicarbonate and OH-AFm were the dominant phases. The<br />
presence of iron led to the formation of portlandite, Fe-hydroxide, C3AH6, C4FHx and Al<br />
and Fe carbonate containing AFm phases (due to CO2 contamination) (see Fig. 52 ). No<br />
peak shift was observed for C3AH6, indicating the absence of a solid solution between<br />
C3AH6 and C3FH6.<br />
The solubility products of all the phases in the solid were calculated and listed in Table<br />
28. The Fe-containing solutions are also saturated with respect to portlandite and Fe-<br />
hydroxide. The calculated ion activity products of portlandite and Fe-hydroxide also<br />
served as an independent quality check of the concentration measurements. The<br />
calculated solubility products for Al-katoite and the OH-AFm remained constant<br />
independent of the mixing proportions. This indicates no solid solution formation, thus<br />
120
CHAPTER 3 SYNTHETIC FE-CONTAINING HYDRATES<br />
confirming the XRD results. The calculated average solubility products from these mixed<br />
systems are comparable with the values determined in the systems which contained only<br />
Al or Fe (see Table 26).<br />
Table 28 Measured concentration of mixed C3AH6-C3FH6 systems equilibrated for three years<br />
at oversaturation.<br />
Al/(Al+Fe) Al Ca K Fe pH log Ksp log Ks0 log Ks0 log Ks0 log Ks0 log Ks0<br />
ratio [mmol/l] [mmol/l] [mmol/l] [mmol/l] C3FH6 C4FH13 C3AH6 C4AH13 CH FH3 1 3.37 0.8 89.0 13.1 -20.64 -26.54<br />
0.9 0.12 5.4 88.9 0.0003 13.0 -26.11 -31.10 -20.91 -25.90 -4.98 -5.59<br />
0.8 0.15 4.9 90.0 0.0005 13.0 -25.82 -30.86 -20.87 -25.91 -5.03 -5.37<br />
0.7 0.06 5.1 90.5 0.0004 13.0 -25.95 -30.97 -21.60 -26.61 -5.01 -5.47<br />
0.6 0.11 5.5 91.3 0.0004 13.0 -25.86 -30.84 -20.98 -25.97 -4.97 -5.47<br />
0.5 0.13 5.1 90.7 0.0055 13.0 n.d n.d -20.94 -25.96 -5.00 n.d<br />
0.4 0.15 5.1 88.3 0.0005 13.0 -25.77 -30.79 -20.82 -25.84 -5.01 -5.37<br />
0.3 0.15 4.8 90.1 0.0013 13.0 -25.01 -30.06 -20.89 -25.94 -5.04 -4.95<br />
0.2 0.16 5.1 89.7 0.0011 13.0 -25.08 -30.11 -20.76 -25.78 -5.01 -5.03<br />
0.1 0.15 5.1 90.3 0.0003 13.0 -26.20 -31.22 -20.81 -25.82 -5.01 -5.59<br />
0 0.02 5.1 91.7 0.0004 13.0 -25.95 -30.96 -5.01 -5.47<br />
Average -25.75±0.20 -30.77±0.25 -20.92±0.20 -26.03±0.25 -5.01±0.04 -5.35±0.05<br />
Detection limits (mmol/l): Al = 0.001 Ca = 0.0004, Fe = 0.0000006, K = 0.0024, S=0.0014, Si=0.0002 measurement uncertainty ±10%,<br />
+ pH measured at 20°C, n.d: not determined due to unexpected higher iron concentrations indicating contamination of the sample.<br />
Based on the derived solubility products as given in Table 28 the influence of varying<br />
Al/(Al+Fe) ratio on the stable hydrates in the CaO-Al2O3-Fe2O3–H2O system was<br />
calculated. A small amount of CO2 was added to conform to the CO2 contamination<br />
observed in the experiments. The formation of C3AH6, portlandite, Fe-hydroxide and<br />
carbonate containing AFm phase was calculated but no C3FH6 formation (see Fig. 53), in<br />
agreement with the XRD data.<br />
121
Mass of the solids in grams<br />
2.5<br />
2.0<br />
1.5<br />
1.0<br />
0.5<br />
CHAPTER 3 SYNTHETIC FE-CONTAINING HYDRATES<br />
Fe-hydroxide<br />
Portlandite<br />
C 4Ac 0.5H 12<br />
0.0<br />
0.0 0.2 0.4 0.6 0.8 1.0<br />
(Al/Al+Fe) ratio<br />
C 3 AH 6<br />
Fig. 53 Calculated solids in the CaO-Al2O3-Fe2O3-H2O system in 0.1 M KOH using the solubility<br />
products as given in Table 28.<br />
3.5.5. Aluminum siliceous hydrogarnet, C3ASH4<br />
The C3ASH4 system is more complex than the silicon free C3AH6 system. The presence<br />
of two different hydrogarnets can be expected, a silica-poor and a silica-rich with a<br />
miscibility gap in between. For hydrogarnets prepared at 95 °C, a miscibility gap between<br />
C3AS0.42H5.16 and C3AS0.76H4.48 was reported [110]. In this study the synthesis of C3ASH4<br />
(target composition) was carried out at both 20 °C and 110 °C. Fig. 54 shows the XRD<br />
pattern of the Al-containing siliceous hydrogarnet synthesized at 110 °C (equilibrated for<br />
5 days) and at 20 °C (equilibrated for 3 years). The peaks of the sample synthesized at<br />
110 °C are relatively broad. A minor splitting of the peaks was observed at d-spacing ~<br />
2.75 Å, indicating that the solid could be composed of two siliceous hydrogarnets with<br />
different compositions. The peaks of the solid synthesized at 20 °C indicated the presence<br />
122
CHAPTER 3 SYNTHETIC FE-CONTAINING HYDRATES<br />
of C3AH6 only even after a reaction time of 3 years. This shows that the synthesized solid<br />
contains no or very little silica.<br />
Fig. 54 The XRD pattern of Al containing Si-hydrogarnet synthesized at 20 °C and 110 °C. * Al-<br />
Si-hydrogarnet with two different compositions (see inlet); o C3AH6; - KNO3 present as<br />
impurity; +CaF2 added as an internal standard.<br />
The TGA-DTG curve shows a weight loss at 145 °C due to the co-precipitation of C-S-H<br />
(see Fig. 55). The water loss of Al-Si-hydrogarnet synthesized at 20 °C corresponds to<br />
that observed for C3AH6 (see Fig. 49) with a main peak at around 300 °C. This supports<br />
the XRD results and indicates that the Al-Si-hydrogarnet synthesized at 20 °C contains<br />
little or no silica. The main water loss of Al-Si-hydrogarnet synthesized at 110 °C<br />
occurred around 330 °C. The presence of C-S-H gel in the samples with the target<br />
composition C3ASH4 was persistent.<br />
123
CHAPTER 3 SYNTHETIC FE-CONTAINING HYDRATES<br />
Fig. 55 Thermal analysis (TGA and DTG) of Al-and Fe-Si hydrogarnet synthesized at 20 °C and<br />
110 °C. The circle region indicates the water loss of hydrogarnets with different<br />
compositions.<br />
The complete absence of silica containing hydrogarnet in the samples synthesized at 20<br />
°C even after 3 years aging indicates that the formation at room temperature is kinetically<br />
hindered and does not occur not even after prolonged hydration.<br />
Rietveld refinement was performed with the addition of CaF2 as an internal standard to<br />
determine the unit cell of the solid synthesized at 110 °C. The structure of silica poor (a ~<br />
12.38Å, ICSD N o 49772) and silica rich (a ~ 12.27Å, ICSD N o 172076) siliceous-<br />
hydrogarnet were used as starting values for the refinement. The resulting unit cell<br />
parameters were a ~ 12.47Å and a ~ 12.37Å for a silica poor and rich siliceous<br />
124
CHAPTER 3 SYNTHETIC FE-CONTAINING HYDRATES<br />
hydrogarnet respectively. The silica content of the two hydrogarnets was estimated by<br />
assuming a linear relationship of unit cell parameters between C3AH6 (a ~ 12.58Å PDF<br />
24217) and grossular C3AS3 (a ~ 11.85Å PDF 1741087) [7, 110] (see Fig. 56). The<br />
compositions of the synthesized siliceous-hydrogarnet were estimated to be C3AS0.41H5.18<br />
and C3AS0.84H4.32. In agreement with the published data a miscibility gap occurred [107,<br />
110, 112]. The miscibility gap observed in the present study ranged from C3AS0.41H5.18 to<br />
C3AS0.84H4.32. According to the reflection intensity, the silica poor hydrogarnet was<br />
dominant (see inlet in Fig. 54).<br />
Garnet silica content<br />
3<br />
2<br />
1<br />
C 3AS 3 PDF1741087<br />
C3AS2.3H1.4 PDF1842016<br />
C3AS2H2 Kyritsis(2009)<br />
C 3AS 2H 2 PDF1731654<br />
C 3AS 1.5H 3 Kyritsis(2009)<br />
C3ASH3.5 PDF451447<br />
C3ASH4 Kyritsis(2009)<br />
C3AS1.09H3.82 ICSD 172076<br />
C3AS0.84H4.32 (this study)<br />
Miscibility gap<br />
C 3AS 0.64H 4.72 ICSD 49772<br />
C 3AS 0.8H 4.4 (Matschei 2007)<br />
C 3AS 0.41H 5.18 (this study)<br />
0<br />
11.8 12 12.2<br />
Unit cell size [Å]<br />
12.4 12.6<br />
C 3AH 6PDF24217<br />
Fig. 56 Estimation of the silica content for synthesized Al-containing hydrogarnet; PDF: Powder<br />
Diffraction File. ICSD: Inorganic Crystal Structure Database. The composition of the<br />
synthesized solid solution series was estimated from the unit cell size as indicated by the<br />
line.<br />
The solubility products of the silica poor hydrogarnet and silica rich hydrogarnet were<br />
125
CHAPTER 3 SYNTHETIC FE-CONTAINING HYDRATES<br />
determined based on the chemical formula obtained from XRD analysis of the solids in<br />
the dissolution experiment (Table 28).<br />
The solubility products of both hydrogarnets were calculated using the following<br />
equations:<br />
KS0 (Ca3Al2(SiO4)0.41(OH)10.36) = {Ca 2+ } 3 {AlO2 - } 2 {HSiO3 - } 0.41 {OH - } 3.59 {H2O} 3.18<br />
KS0 (Ca3Al2(SiO4)0.41(OH)8.64) = {Ca 2+ } 3 {AlO2 - } 2 {HSiO3 - } 0.84 {OH - } 3.16 {H2O} 2.32<br />
Table 29 Measured ion concentrations in the solution of solids synthesized at 110°C and re<br />
dissolved and equilibrated for 4 months at 20 °C and 50 °C.<br />
Phases<br />
Temp.<br />
[°C]<br />
Al<br />
[mmol/l]<br />
Ca<br />
[mmol/l]<br />
Si<br />
[mmol/l]<br />
K<br />
[mmol/l]<br />
Si<br />
[mmol/l]<br />
+ pH log Ks0<br />
Ca3Al2 (SiO4)0.41(OH)10.36 20 2.99 0.66 0.51 151 0.51 13.12 -25.58±0.20<br />
Ca3Al2 (SiO4)0.84(OH)8.64 20 2.99 0.66 0.51 151 0.51 13.12 -26.83±0.20<br />
Ca3Al2 (SiO4)0.41(OH)10.36 50 4.63 0.07 0.67 163 0.67 13.04 -25.19±0.30<br />
Ca3Al2 (SiO4)0.84(OH)8.64 50 4.63 0.07 0.67 163 0.67 13.04 -26.38±0.30<br />
Detection limits [mmol/l]: Al = 0.001 Ca = 0.0004, Fe = 0.0000006, K = 0.0024, S=0.0014, Si=0.0002 measurement uncertainty ±10%,<br />
+<br />
pH measured at 20°C.<br />
The resulting solubility products are log Ks0 = -25.58 and -26.83 at 20 °C and log Ks0 = -<br />
25.19 and -26.38 at 50 °C for C3AS0.41H5.18 and C3AS0.84H4.32, respectively. The<br />
solubility products of Al containing siliceous hydrogarnets from different studies are<br />
plotted in Fig. 57. The solubility products calculated from the concentrations measured<br />
by Matschei et al. [7] for C3AS0.8H4.4, which had been equilibrated for 4 weeks at<br />
undersaturation, were log Ks0 = -30.46, -30.03, -29.34, -29.50 and -29.74 at 5, 25, 55, 70<br />
and 85 °C, respectively. From the concentrations and compositions determined by Bennet<br />
et al. [112] for C3AS0.41H5.18 and C3ASH4 equilibrated for 4 weeks at 25 °C at<br />
undersaturation log Ks0 of -29.59 (C3AS0.41H5.18) and -30.17 (C3ASH4) were calculated.<br />
These values are very similar to the values determined by Matschei et al. [7] as shown in<br />
126
CHAPTER 3 SYNTHETIC FE-CONTAINING HYDRATES<br />
Fig. 57. From the data of Atkins et al. [117] a significantly higher solubility product (log<br />
Ks0 = -27.20 and -28.09) was obtained for C3ASH4 indicating a lower stability. The<br />
samples from the study of Atkins et al. [117] had been equilibrated for 10 weeks and 6<br />
months at 25 °C under oversaturation. Jappy et al. [110] determined the solubility at 95<br />
°C under oversaturation for C3AS0.09H5.82, C3AS0.76H4.48 and C3AS1.14H3.72. The<br />
calculated solubility products (log Ks0 = -25.02, -27.19 and -29.96) decrease strongly<br />
with increasing silica content as shown in Fig. 57. Thus, the solubility products calculated<br />
from different studies are significantly dependent on the amount of silica, temperature<br />
and the experimental conditions (oversaturation or undersaturation) employed. The<br />
values determined in this study at undersaturation experiments (equilibration time 4<br />
months) are similar to the values of Atkins et al. [117] obtained at oversaturation and<br />
clearly higher than the values obtained at undersaturation experiments where the solids<br />
had been equilibrated for 4 weeks [7, 112] as shown in Fig. 57. This could be related to<br />
the longer equilibration time and the amount of silica present in the solids.<br />
127
logKs0<br />
-20<br />
-22<br />
-24<br />
-26<br />
-28<br />
-30<br />
-32<br />
Si 0.8<br />
CHAPTER 3 SYNTHETIC FE-CONTAINING HYDRATES<br />
Si 0.84<br />
Si 0.41<br />
Si 0.8<br />
Si 1.0<br />
Si 1.0<br />
Si 0.41<br />
Si 1.0<br />
C 3AH 6<br />
Si 0.41<br />
Si 0.84<br />
Si 0.8<br />
0 10 20 30 40 50 60 70 80 90 100<br />
Temperature [°C]<br />
C 3AS 0.41H 5.18<br />
C 3AS 0.84H 4.32<br />
Si 0.8<br />
Si 0.8<br />
Si 0.09<br />
Si 0.76<br />
Si 1.14<br />
Atkins 1992<br />
Jappy 1991<br />
Bennet 1992<br />
this study<br />
Matschei 2007<br />
Fig. 57 Comparison of published solubility products of Al-Si-hydrogarnet calculated in this study<br />
from the data reported in [7, 110, 112, 117], C3AH6 (dashed line), C3AS0.41H5.18 (solid<br />
line), C3AS0.84H4.32 (dotted line).<br />
The solubility products calculated from the solution composition determined at 20 °C and<br />
25 °C were also plotted as a function of the silica content. Note that the solubility product<br />
of C3AS3 (logKs0= -41.78 and -38.6) was calculated from fG° = -6278.50 kJ/mol (Robie<br />
et al [121]) and fG° = -6260.55 kJ/mol (Sverjensky et al. [122] ) using the following<br />
equilibration reaction:<br />
Ca3Al2Si3O12 + 2H2O ↔ 3Ca 2+ + 2AlO2 - + 3HSiO3 - + OH -<br />
The thermodynamic data of water and the dissolved species used in the above reaction<br />
were taken from the GEMS thermodynamic database [121-125]. Fig. 58 shows that the<br />
solubility product decreases strongly with increasing silica content. This confirms that the<br />
128
CHAPTER 3 SYNTHETIC FE-CONTAINING HYDRATES<br />
presence of silica stabilizes (hydrothermally prepared) hydrogarnets.<br />
The relatively low solubility product obtained for C3AS0.41H5.18 compared to C3AH6 and<br />
C3AS0.84H4.32 could indicate (i) that this sample was not yet equilibrated or (ii) a strong<br />
stabilization of C3AS0.41H5.18.<br />
Fig. 58 Solubility products as a function of Si content between C3AH6 and C3AS3 end members at<br />
25 °C.<br />
3.5.6. Iron siliceous hydrogarnet, C3FSH4<br />
The formation of Fe-containing siliceous hydrogarnet was reported [120, 126, 127].<br />
C3FH6 is stabilized by the presence of silica and Ca3Fe(SiO4)3-x(OH)4x is formed due to<br />
the substitution of (OH)4 4- by SiO4 4- . Fe siliceous hydrogarnet was synthesized from C2F<br />
and NaSiO3.5H2O at 20 °C and investigated at different equilibration times. Fig. 59<br />
129
CHAPTER 3 SYNTHETIC FE-CONTAINING HYDRATES<br />
shows the slow reaction of C2F resulting also in slow formation of Fe siliceous<br />
hydrogarnet at 20 °C. After 3 years of equilibration very poorly crystalline Fe siliceous<br />
hydrogarnet was observed. In contrast, the formation of Fe siliceous hydrogarnet was fast<br />
at 110 °C, producing a well crystalline phase. This material was used for structural<br />
studies and dissolution experiments to determine the thermodynamic properties of Fe-<br />
siliceous hydrogarnet.<br />
Fig. 59 Time-dependent XRD pattern of C3FSH4 synthesized at 20 °C from C2F, * the solid<br />
synthesized at 110 °C. R: rutile.<br />
The TGA-DTG curve shown in Fig. 55 illustrates the main water loss from the structure<br />
of Fe siliceous hydrogarnet at 275 °C. The curve also shows a weight loss at around 145<br />
°C and 610 °C due to the precipitation of C-S-H gel and traces of CaCO3, respectively.<br />
Evidently, it not possible to avoid co-precipitation of C-S-H in CaO-Al2O3-Fe2O3-SiO2<br />
systems.<br />
130
CHAPTER 3 SYNTHETIC FE-CONTAINING HYDRATES<br />
The sample prepared at 110 °C was used for the structural determination. Multipattern<br />
Rietveld refinement was performed (Fig. 60). Traces of impurity were identified as<br />
indicated by weak diffraction peaks observed at d = 3.77 Å and 3.47 Å (see Fig. 60,<br />
bottom for 2 = 10.6° and 11.5°). The sample is not single-phased, and two Fe siliceous<br />
hydrogarnet phases have been observed (Fig. 61). The measured sample is composed of<br />
Fe siliceous hydrogarnet phase N°1 (64 weight %), Fe siliceous hydrogarnet phase N°2<br />
(27 wt. %), calcite CaCO3 (8 wt. %) and C3FH6 (1 wt. %).<br />
The two Fe siliceous hydrogarnet phases correspond to the structure already described for<br />
hydroandradite, the Al-free iron-hydrogarnet compound [126]. The two Fe siliceous<br />
hydrogarnet phases with cubic symmetry have different lattice parameters (a = 12.5424<br />
(5) Å and 12.4297 (7) Å, respectively for Fe siliceous hydrogarnet N°1 and Fe siliceous<br />
hydrogarnet N°2) and different silica contents (refined composition are<br />
Ca3Fe2(SiO4)0.95(2)(OH)8.20(2) and Ca3Fe2(SiO4)1.52(4)(OH)5.92(4)). A miscibility gap seems<br />
to appear between these two hydroandradites. Table 30 compiles the refined parameters<br />
for both hydroandradite phases which crystallized in the cubic Ia3 d space group.<br />
131
CHAPTER 3 SYNTHETIC FE-CONTAINING HYDRATES<br />
Fig. 60 Rietveld plot for Fe-Si-Hydrogarnet sample with = 0.697751Å and a sample-to-detector<br />
distance of 150 mm (top) and 400 mm (bottom).<br />
132
CHAPTER 3 SYNTHETIC FE-CONTAINING HYDRATES<br />
Fig. 61 Zoom of the Rietveld plot from pattern recorded for a sample-to-detector distance of 400<br />
mm showing the two hydrogarnet phases (systematic shoulders, right side, for<br />
hydrogarnet diffraction peaks).<br />
Table 30 Refined structure parameters of Fe siliceous hydrogarnet (standards deviation are<br />
indicated in parentheses).<br />
Hydrogarnet N°1, a = 12.5424 (5) Å, Ca3Fe2(SiO4)0.95(2)(OH)8.20(2)<br />
Atom Wyckoff x Y z B iso (Å 3 ) Occupancy<br />
Ca 24 1/8 0 1/4 1.10 (5) 1<br />
Fe 16 0 0 0 = Biso (Ca) 1<br />
Si 24 3/8 0 1/4 = Biso (Ca) 0.316 (8)<br />
O 96 0.0336 (2) 0.0521 (2) 0.6492 (3) = Biso (Ca) 1<br />
Hydrogarnet N°2, a = 12.4297 (7) Å, Ca 3Fe 2(SiO 4) 1.52(4)(OH) 5.92(4)<br />
Atom Wyckoff x Y z B iso (Å 3 ) Occupancy<br />
Ca 24 1/8 0 1/4 = Biso (Ca) 1<br />
Fe 16 0 0 0 = Biso (Ca) 1<br />
Si 24 3/8 0 1/4 = Biso (Ca) 0.51 (1)<br />
O 96 0.0336 (2) 0.0521 (2) 0.6492 (3) = B iso (Ca) 1<br />
133
CHAPTER 3 SYNTHETIC FE-CONTAINING HYDRATES<br />
Using the compositions determined from XRD, the solubility products of both<br />
hydroandradite phases were calculated according to the following equations:<br />
KS0 (Ca3Fe2(SiO4)0.95(2)(OH)8.20(2)) = {Ca 2+ } 3 . {FeO2 - } 2 {HSiO3 - } 0.95 . {OH - } 3.05 . {H2O} 2.1<br />
KS0 (Ca3Fe2(SiO4)1.52(2)(OH)5.92(4)) = {Ca 2+ } 3 . {FeO2 - } 2 {HSiO3 - } 1.52 . {OH - } 2.48 . {H2O} 0.96<br />
The calculated values from the dissolution experiments are given in Table 31. The<br />
resulting solubility products are log Ks0= -32.34 and –34.50 at 20 °C and log Ks0 = -33.68<br />
and -35.76 at 50 °C for C3FS0.95H4.1 and C3FS1.52H2.26, respectively. The solubility<br />
products of Fe-Si-hydrogarnet synthesized at 20 °C and equilibrated under oversaturation<br />
are very similar (log Ks0 = -32.98 and –34.63 at 20 °C for C3FS0.95H4.1 and C3FS1.52H2.96).<br />
The values are 7 log units lower than those of the Al-containing siliceous hydrogarnet<br />
determined in this study. Hence, hydroandradites are significantly more stable than the Al<br />
containing hydrogrossulars.<br />
Table 31 Measured ion concentrations of solids synthesized at 110 °C (re dissolved and<br />
equilibrated for 4 months at 20 °C and 50 °C) and at 20 °C(equilibrated for 3 years<br />
under oversaturated condition).<br />
Phases<br />
Temp.<br />
[°C]<br />
Ca<br />
[mmol/l]<br />
K<br />
[mmol/l]<br />
Si<br />
[mmol/l]<br />
Fe<br />
[mmol/l]<br />
+ pH log Ks0<br />
Ca3Fe2 (SiO4)0.95(OH)8.2 20 0.10 118 0.05 0.0061 13.04 -32.34±0.20<br />
*Ca3Fe2 (SiO4) 0.95(OH) 8.2 20 0.20 85 0.26 0.0008 13.10 -32.98±0.20<br />
Ca3Fe2 (SiO4)1.52(OH)5.92 20 0.10 118 0.05 0.0061 13.04 -34.50±0.20<br />
*Ca3Fe2 (SiO4)1.52(OH)5.92 20 0.20 85 0.26 0.0008 13.10 -34.63±0.20<br />
Ca3Fe2 (SiO4)0.95(OH)8.2 50 0.06 125 0.06 0.0044 13.02 -33.68±0.20<br />
Ca3Fe2 (SiO4) 1.52(OH) 5.92 50 0.06 125 0.06 0.0044 13.02 -35.76±0.20<br />
Detection limits (mmol/l): Al = 0.001 Ca = 0.0004, Fe = 0.0000006, K = 0.0024, S=0.0014, Si=0.0002 measurement uncertainty ±10%,<br />
+<br />
pH measured at 20°C, *solubility of Fe-siliceous hydrogarnet equilibrated for 3 years under oversaturated condition.<br />
134
CHAPTER 3 SYNTHETIC FE-CONTAINING HYDRATES<br />
Fig. 62 Calculated solubility products of Fe-Si-hydrogarnets from the solubility experiments.<br />
(lines show calculated values, full symbols show the measured values from<br />
undersaturation and empty symbols from oversaturation).<br />
The temperature dependent solubility product of hydroandradite was computed based on<br />
the solubility measured at 20 °C and 50 °C. The entropy was fitted using measured<br />
solubility products as described before (Fig. 62) for both hydroandradite. The solubility<br />
products decreases with increasing temperature indicating a higher stability at higher<br />
temperature. The thermodynamic parameters at standard conditions are in Table 27.<br />
135
CHAPTER 3 SYNTHETIC FE-CONTAINING HYDRATES<br />
3.5.7. Solid solution between Ca3Fe2(OH)12 and Ca3Fe2O6(SiO2)3<br />
(hydroandradite, Ca3Fe2(SiO4)3-y(OH)4y)<br />
It is known that in the tetrahedral sites of the cubic hydrogarnet (OH)4 4- can be replaced<br />
by SiO4 4- . The existence of a solid solution between C3AH6 and C3AS3 with a miscibility<br />
gap between C3AS0.41H5.18 and C3AS0.84H4.32 has been demonstrated. Hydroandradite,<br />
Ca3Fe2(SiO4)3-y(OH)4y, was synthesized at 110 °C with varying y = 0, 1.5, 1.75, 2, 2.25,<br />
2. 75 and 3 to study the substitution of (OH)4 by SiO4. Fig. 63 shows the XRD pattern of<br />
the solid solution series of Ca3Fe2(SiO4)3-y(OH)4y. If no SiO2 was present, the iron<br />
hydrogarnet was metastable with respect to portlandite and Fe-oxide/hydroxide and only<br />
traces of C3FH6 were observed. However, silica substitution raised the stability,<br />
portlandite disappeared and a stable hydroandradite was formed (Fig. 63).<br />
Fig. 63 XRD pattern of the solid solution series of Ca3Fe2(SiO4)3-y(OH)4y, + CH. The dotted lines<br />
indicate the peak shifts. *Main reflections of the hydroandradite end members. Note that<br />
Xsi = y = 3<br />
136
CHAPTER 3 SYNTHETIC FE-CONTAINING HYDRATES<br />
At higher silica contents a peak shift from XSi 0.25 to 1.0 was observed, indicating a<br />
continuous change from approximately C3FS0.25H5.5 to C3FS0.95H4.1 and the presence of a<br />
solid solution could be possible. Between XSi = 1 and XSi = 1.5 a peak broadening was<br />
observed due to the presence of two hydrogarnets with different silicon contents<br />
(C3FS0.95H4.1 and C3FS1.52H2.26) as discussed above in connection with the synchrotron<br />
diffraction data. This finding indicates the presence of a miscibility gap between this<br />
range. At XSi = 1.5 and at XSi = 3, different peak positions were observed. Whether a<br />
continuous solid solution exists between these two solids or whether further miscibility<br />
gaps occur cannot be determined from the data presented here.<br />
The change in the solubility products with increasing silica content at 25 °C are shown in<br />
Fig. 64. The solubility product of C3FS3 (logKs0 = -53.51 and -53.31) was calculated from<br />
fG° = -5427.0 kJ/mol (Robie et al. [121]) and fG° = -5425.89 kJ/mol (Sverjensky et al.<br />
[122]) using the following equilibrium reaction.<br />
Ca3Fe2Si3O12 + 2H2O ↔ 3Ca 2+ + 2FeO2 - + 3HSiO3 - + OH -<br />
The thermodynamic data of water and the dissolved species used in the above reaction<br />
were taken from the GEMS thermodynamic database [121-125]. As shown in Fig. 64, the<br />
solubility product decreases with an increase of the silica content indicating that the<br />
presence of silica stabilizes the hydroandradite system.<br />
137
CHAPTER 3 SYNTHETIC FE-CONTAINING HYDRATES<br />
Fig. 64 Solubility products as a function of Si content in between C3FH6 and C3FS3 end members<br />
at 25 °C. The dotted line connects the solubility products of C3FH6 and C3FS3.<br />
3.5.8. Solid solution between aluminum and iron siliceous hydrogarnet,<br />
C3(A,F)SH4<br />
As discussed above, Al and Fe may substitute each other. Between C3AH6 and C3FH6 no<br />
solid solution formation was observed (see section 3.5.5). Frank-Kamenetskaya et al.<br />
[128] demonstrated the possible solid solution formation in the grossular-andradite series.<br />
In this study, a Ca3(AlxFe1-x)2(SiO4)(OH)8 solid solution series was synthesized at 110 °C<br />
by varying the Al/(Al + Fe) ratio from 0 to 1 (Fig. 65). XRD and TGA indicated that the<br />
solids contained impurities like C-S-H and calcite. The peaks were broad and a peak<br />
138
CHAPTER 3 SYNTHETIC FE-CONTAINING HYDRATES<br />
splitting was observed at d-spacing ~ 2.75 Å with a slight peak shift with increasing Fe<br />
content. This finding attributed to the formation of at least two hydrogarnets with<br />
different compositions. XRD investigation shows that Al-Si-hydrogarnet and the Fe-Si-<br />
hydrogarnet deviate from their target compositions during preparation. Two hydrogarnets<br />
with different silica contents were observed, confirming the existence of miscibility gaps<br />
in the (OH)4 4- -SiO4 4- series. However, due to similarity of their structures the formation of<br />
ideal solid solution between Al- and Fe-Si-hydrogarnet is tentatively proposed. A<br />
possible substitution of Si by OH in the tetrahedral site of the hydrogarnet could occur<br />
depending on the Fe content. In general, a simultaneous substitution in both the<br />
octahedral and the tetrahedral site of hydrogarnet could be possible.<br />
Fig. 65 XRD pattern of the solid solution series of Ca3(AlxFe1-x)2(SiO4)(OH)8 synthesized at 110<br />
°C.<br />
The solution compositions measured for Ca3(AlxFe1-x)2(SiO4)(OH)8 at 20 °C and 50 °C<br />
from the dissolution (undersaturation) experiment are presented in Table 32. The<br />
139
CHAPTER 3 SYNTHETIC FE-CONTAINING HYDRATES<br />
concentration of aluminum and silicon increases at both 20 °C and 50 °C, while the<br />
calcium concentration and pH only slightly change as a function of Al/(Al + Fe) ratio.<br />
Table 32 Measured ion concentration of Ca3(AlxFe1-x)2(SiO4)(OH)8 equilibrated for four months<br />
from dissolution (undersaturation) experiment.<br />
Al/(Al+Fe) Temprature Al Ca K Si Fe<br />
+<br />
pH log Ks0 log Ks0 log Ks0<br />
ratios [°C] [mmol/l] [mmol/l] [mmol/l] [mmol/l] [mmol/l] C3AS0.84H4.32 C3FS0.95H4.1 C3(A,F)S0.9H4.2<br />
0.0 20
CHAPTER 3 SYNTHETIC FE-CONTAINING HYDRATES<br />
The total solubility product (ΣΠ) can be calculated using the equation below. The<br />
standard solid solution modeling in GEMS is setup for one ion substituting another ion in<br />
one crystallographic site per end member. To fulfill this condition the logK values were<br />
downscaled by a factor 2<br />
ΣΠ= 2× ({Ca 2+ } 1.5 {AlO2 - + FeO2 - } 1 {HSiO3 - } 0.45 {OH - } 1.55 · {H2O} 1.1 )<br />
Where {} denotes the activity. On the basis of the measured ion concentrations and target<br />
compositions of the solid phases, total solubility products were calculated as given Table<br />
32. The total solubility products change as a function of Al/(Al + Fe) ratio. In the<br />
presence of Fe, Al-siliceous hydrogarnet has a lower solubility product at both 20 °C and<br />
50 °C.<br />
A Lippmann phase diagram was drawn for the Ca3(AlxFe1-x)2(SiO4)0.9(OH)8.4 series<br />
assuming an ideal solid solution. The solidus and solutus curve describe the equilibrium<br />
state of the solid solution series of Al/Fe-siliceous hydrogarnet. Based on the limited<br />
amount of experimental data an ideal solid solution between Al and Fe-Si-hydrogarnet<br />
was fitted between C3AS0.84H4.32 and C3FS0.95H4.1. The solubility products of the end<br />
members are given in Table 32.<br />
The Lippmann phase diagram of the solidus curve as a function of the solid composition<br />
and the solutus curve as a function of the liquid compositions of an ideal solid solution<br />
series of Al/Fe-siliceous hydrogarnet was plotted at 20 °C and 50 °C as shown in Fig. 66a<br />
and b.<br />
If an ideal solid solution is assumed, the modeled total solubility products of solidus<br />
agrees reasonably with the experimentally determined total solubility products. The<br />
results indicate possible formation of an ideal solid solution between Al and Fe-siliceous<br />
hydrogarnet at 20 °C and 50 °C. However, the data might also be explained by the<br />
141
CHAPTER 3 SYNTHETIC FE-CONTAINING HYDRATES<br />
complete absence of any solid solution as indicated by the dotted lines and the empty<br />
symbols in Fig. 66. Due to the formation of two miscibility gaps and the simultaneous<br />
presence of C3AS0.41H5.18, C3AS0.84H4.32, C3FS0.95H4.1, C3FS1.52H2.96 and C-S-H in varying<br />
amounts in the experiment, more detailed investigations are needed to derive a consistent<br />
thermodynamic model for this system.<br />
142
CHAPTER 3 SYNTHETIC FE-CONTAINING HYDRATES<br />
Fig. 66 Lippmann diagram illustrating the total solubility products of Al/Fe-siliceous hydrogarnet<br />
solid solution series Ca3(AlxFe1-x)2(SiO4)0.9(OH)8.4 at a) 20 °C b) 50 °C: .experimentally<br />
determined total solubility products (filled symbols), modeled total solubility products<br />
assuming ideal solid solution (dashed lines). In addition also the solubility product of<br />
C3AS0.84H4.32 and C3FS0.95H4.1 derived from the experimental data (empty symbols) and<br />
the solubility products assuming no solid solution (dotted lines) are given. X-axis: Al/(Al<br />
+ Fe) ratio in the solid or liquid phases, respectively.<br />
3.5.9. Conclusions<br />
C3AH6 is the stable phase in CaO-Al2O3-H2O system in the absence of other ions. The<br />
co-precipitation of C4AHx was consistent; this might be related to the high pH reaction<br />
during synthesis. In contrast, C3FH6 was found to be metastable. This suggests that in the<br />
143
CHAPTER 3 SYNTHETIC FE-CONTAINING HYDRATES<br />
absence of silica, portlandite and amorphous Fe-hydroxide and possibly iron containing<br />
carbonate phases will form. The formation of C4FHx was persistent in CaO-Fe2O3-H2O<br />
system at room temperature. No solid solution formation occurred between C3AH6 and<br />
C3FH6.<br />
The Al and Fe siliceous hydrogarnet was more complex due to the formation of two<br />
hydrogarnets with different silica contents. In addition, C-(A)-S-H co-precipitated during<br />
the preparation of Si-hydrogarnet. Al-containing siliceous hydrogarnet did not form at<br />
room temperature but only at 110 °C. A miscibility gap was observed between<br />
C3AS0.41H5.18 and C3AS0.84H4.32 for samples synthesized at 110 °C. Hydroandradite formed<br />
both at room temperature and at 110 °C. Again the formation of a solid solution was<br />
observed with a miscibility gap between C3FS0.95H4.1 and C3FS1.5H2.96.<br />
Possibly a simultaneous substitution of Al by Fe in the octahedral sites and Si by OH - in<br />
the tetrahedral sites occurred with a miscibility gaps for Ca3(AlxFe1-x)2(SiO4)3-y(OH)4y.<br />
The CaO-Al2O3-Fe2O3-SiO2-H2O is a complex system that exhibits multi ion substitution<br />
in the structure and more detailed investigations are needed.<br />
Implications for cementitious systems<br />
In pure CaO-Al2O3-H2O systems C3AH6 is the stable phase. The addition of sulfate<br />
destabilizes C3AH6 and leads to the formation of monosulfate or ettringite depending on<br />
the amount of sulfate added [7]. The presence of carbonate leads to the formation of<br />
monocarbonate [2, 67]. Similarly, the presence of silica could destabilize C3AH6 and<br />
cause the formation of the thermodynamically more stable Si-hydrogarnet. However, this<br />
process is kinetically hindered and observed only at higher temperature around 100 °C.<br />
In the presence of Fe2O3 the phase assemblage of CaO-(Al,Fe)2O3-H2O is distorted to<br />
144
CHAPTER 3 SYNTHETIC FE-CONTAINING HYDRATES<br />
CH, C3AH6 and Fe-hydroxide while C3FH6 is metastable. The presence of carbonate,<br />
sulfate or silica in a CaO-Fe2O3-H2O system leads to the formation of Fe-monocarbonate<br />
[19], Fe-monosulfate/Fe-ettringite or hydroandradite [15, 129, 130].<br />
In a CaO-Al2O3-SiO2-H2O system the presence of Fe2O3 leads to the formation of stable<br />
hydrogarnets with the composition Ca3(AlxFe1-x)2(SiO4)3-y(OH)4y. At room temperature<br />
Al/Fe containing siliceous hydrogarnet have been observed in hydrated cement pastes<br />
[22, 35, 65]. The kinetics of formation of mixed Al/Fe containing siliceous hydrogarnet is<br />
slow at room temperature. The presence of silica in OPC tends to stabilize a poorly<br />
crystalline mixed Al/Fe containing siliceous hydrogarnet. High temperature curing (≥ 95<br />
°C) accelerates the development of an intermixed hydrogarnet in CaO-Al2O3-Fe2O3-SiO2-<br />
H2O system. However, it was observed that Si-hydrogarnet formed as a main phase at<br />
higher temperature during cement reaction or in autoclaved concrete [23, 131]. In general<br />
an intermixed hydrogarnet Ca3(AlxFe1-x)2(SiO4)3-y(OH)4y could potentially form in<br />
cement pastes due to the stability of the phase. The chemistry of hydrogarnet can also be<br />
influenced by the presence of magnesium. This might be due to the possible substitution<br />
of Ca by Mg in the hydrogarnet structure [120].<br />
3.6. Summary<br />
In this thesis a number of new solubility data for Fe-containing hydrates and their<br />
structure have been determined. Most of the solubility data have been determined for the<br />
first time. The structure of Fe-monocarbonate, Fe-monosulfate and hydroandradite series<br />
have been determined. The results obtained in this chapter are summarized in Table 33.<br />
145
CHAPTER 3 SYNTHETIC FE-CONTAINING HYDRATES<br />
Table 33 Summary of the results obtained in chapter 3 and comparison with their Al-analogues.<br />
Phases Thermodynamic Crystal structure structure of Solid solution with Al-<br />
stability at 20 °C<br />
Al-analogue analogues<br />
Fe-hemicarbonate<br />
unstable in the presence n.d n.d. n.d<br />
(C4Fc0.5H10)<br />
of carbonate<br />
Fe-monocarbonate<br />
(C4FcH12)<br />
stable rhombohedral monoclinic none<br />
Fe-monosulfate<br />
stable rhombohedral rhombohedral solid solution with<br />
(C4FsH12)<br />
miscibility gap<br />
Fe-Friedel's salt<br />
stable rhombohedral < 35 °C: solid solution tentatively<br />
(C4FCl2H10)<br />
monoclinic<br />
> 35 °C<br />
rhombohedral<br />
Fe-strätlingite<br />
unstable with respect to n.d trigonal n.d<br />
(C2FSH8)<br />
Fe-hydroxide,<br />
portlandite and C-S-H<br />
Fe-OH-AFm<br />
unstable in the presence n.d n.d n.d<br />
(C4FH13)<br />
of carbonate<br />
Fe-katoite<br />
unstable with respect to n.d cubic no solid solution<br />
(C3FH6)<br />
Fe-hydroxide,<br />
portlandite and possibly<br />
Fe-hemi/monocarbonate<br />
in the presence of<br />
carbonate<br />
Fe-siliceous hydrogarnet<br />
(C3FS0.95H4.1/ C3FS1.52H2.96)<br />
stable cubic cubic ideal solid solution<br />
n.d: not determined, strätlingite [132]<br />
146
CHAPTER 4 FE-CONTAINING HYDRATES IN HYDRATED CEMENT<br />
4. FE-CONTAINING HYDRATES IN HYDRATED CEMENT<br />
4.1. Identification of Fe-containing hydrates in hydrated cement<br />
4.1.1. Introduction<br />
Whether and to what extent the Fe-containing phases and their solid solutions could form<br />
in OPC is poorly understood. Any approach to elucidate the fate of Fe in cementitious<br />
materials is complicated by the fact that identification of the Fe-containing hydrates in<br />
hydrated cement using standard techniques (XRD, TGA, SEM) is difficult as their signals<br />
significantly overlap with those of the corresponding Al-containing phases. Furthermore,<br />
also the formation of amorphous Fe-containing phases in hydrated cement is difficult to<br />
detect using standard techniques.<br />
Synchrotron-based X-ray absorption spectroscopy (XAS) can be used as a<br />
complementary technique as it is able to provide molecular-level information of<br />
cementitious systems [28-30]. Most frequently used XAS techniques are X-ray<br />
absorption near edge structure (XANES) and extended X-ray absorption fine structure<br />
(EXAFS) spectroscopy. The former technique is mainly used to study the oxidation state<br />
of the absorber atom and for fingerprinting on the basis of a comparison of reference<br />
spectra with unknown spectra of the absorber atom, while the latter technique enables us<br />
to determine the coordination sphere (i.e., type of neighboring atoms, bond length and<br />
coordination numbers) of the X-ray absorber atom of interest. Both techniques allow<br />
dilute samples to be examined (concentration of the X-ray absorber down to a few tens of<br />
ppm). Most importantly, XAS can be used to study amorphous solids, surface adsorbed<br />
complexes, or species in solution in addition to crystalline materials. Furthermore,<br />
advanced high resolution synchrotron-based X-ray micro-probe allows spatially resolved<br />
147
CHAPTER 4 FE-CONTAINING HYDRATES IN HYDRATED CEMENT<br />
information on the speciation of the X-ray absorber of interest in compact matrices, such<br />
as cementitious materials, to be obtained [28, 30].<br />
Synchrotron XAS has previously been used to determine the oxidation state and<br />
coordination environment of Fe in minerals and natural sediments [133, 134]. These<br />
studies showed that distinct features in the XANES spectra are useful for qualitatively<br />
distinguishing among major mineral classes. Detection of a particular mineral within a<br />
structural class was found to be more difficult and depend on the spectral uniqueness of<br />
these minerals. It was suggested that EXAFS may be more sensitive to the detection of<br />
particular components in a mixture at low Fe concentrations than the application of<br />
XANES. To the best of our knowledge there is only one study, which used XAS to<br />
determine the Fe speciation in cementitious systems [77]. The authors investigated the<br />
Fe-containing hydrates forming during the hydration of C2(A,F). The use of XAS for<br />
speciation studies on Fe in hydrated cement, however, is novel.<br />
In this study the hydration process of two different cements OPC and HS have been<br />
investigated with the aim of identifying the new Fe-containing phases formed. Different<br />
standard analytical techniques (XRD, TGA, SEM) were used to identify the main phases.<br />
The above techniques were complemented by selective dissolution using the salicylic<br />
acid/methanol (SAM) method to identify the minor Fe-containing phases. EXAFS was<br />
further applied to identify in situ the Fe-containing phases in the complex cement matrix.<br />
The study was completed by predicting the hydration assemblage using thermodynamic<br />
modeling and an updated database including new solubility data for the Fe-containing<br />
phases.<br />
148
CHAPTER 4 FE-CONTAINING HYDRATES IN HYDRATED CEMENT<br />
4.1.2. Characterization of hydrated cement using standard analytical<br />
techniques<br />
The hydration of two different cements, OPC and HS, was studied to determine the Fe<br />
speciation at various stages of the hydration process. Both cements contained roughly 5<br />
wt.% Al2O3 while their Fe2O3 content differed widely. The cement OPC had a Fe2O3<br />
content of 3 wt.%, while the HS contained about 7 wt.%. The progress of hydration and<br />
appearance/disappearance of the main cement phases can easily be followed using<br />
standard analytical techniques like XRD, TGA and SEM. During the hydration the peaks<br />
of the reactive clinkers phases C3S and C3A diminished fast, while C2(A,F) and C2S<br />
peaks persisted over longer periods of time (Fig. 67).<br />
Fig. 67 XRD patterns of OPC (+) and HS (*) cements hydrated at 20 °C.<br />
149
CHAPTER 4 FE-CONTAINING HYDRATES IN HYDRATED CEMENT<br />
Gypsum and anhydrite were consumed within the first day. The main hydrates formed<br />
during hydration were C-S-H and portlandite. In addition, the formation of AFt and AFm<br />
(monosulfate in the case of OPC and monocarbonate for the calcite containing HS) was<br />
observed. The formation of ettringite and AFm phases was observed within 1 day (Fig.<br />
67 and Fig. 68). The weight loss in the TGA-DTG curve between 100°C and 240 °C<br />
indicates the presence of ettringite, C-S-H and AFm phases (Fig. 68).<br />
weight loss in %<br />
differentiated relative weight<br />
100<br />
90<br />
80<br />
70<br />
-0.1<br />
-0.2<br />
gypsum<br />
Ettringite<br />
AFm phases<br />
C-S-H<br />
portlandite<br />
100 200 300 400 500 600 700 800<br />
Temperature (°C)<br />
carbonate<br />
Fig. 68 TGA-DTG curves of OPC (+) and HS (*) cements hydrated at 20 °C.<br />
unhyd+<br />
1 day+<br />
28 days+<br />
150 days+<br />
3 years+<br />
3 years*<br />
Temperature had a significant influence on the hydration process (Fig. 69 and Fig. 70).<br />
While C-S-H and portlandite were still the main phases formed in both OPC and HS after<br />
hydration for 1 year at 50 °C ettringite was not detected, but AFm phase was detected in<br />
both the OPC and HS at 2θ ~ 11.30° (Fig. 69). The AFm phase peak was in between the<br />
150
CHAPTER 4 FE-CONTAINING HYDRATES IN HYDRATED CEMENT<br />
peak of monosulfate and hemicarbonate. Ettringite and monocarbonate are expected to be<br />
thermodynamically less stable than monosulfate in cements at 50 °C [3, 32, 135].<br />
However, in addition to monosulfate, the presence of either ettringite or monocarbonate<br />
was reported at 50 °C, depending on the Al2O3/SO3 ratio of the cement and on the<br />
presence of calcite [3, 135]. Fig. 69 shows that AFm and calcite were present in the<br />
samples hydrated for 1 year at 50 °C. In addition, peaks at 2θ ~ 17.47°, 2θ ~ 20.21° and<br />
2θ ~ 29.90° were observed, which can be assigned to siliceous hydrogarnet. Moreover,<br />
the broad DTG curves between 120 and 270 °C in Fig. 70 is consistent with the presence<br />
of C-S-H, AFm and Si-hydrogarnet phases.<br />
Fig. 69 XRD patterns of OPC (+) and HS (*) cement hydrated for 1 year at 50 °C: The XRD peak<br />
at 2θ ~ 11.30 is between the monosulfate and monocarbonate peaks.<br />
151
weight loss in %<br />
differentiated relative weight<br />
CHAPTER 4 FE-CONTAINING HYDRATES IN HYDRATED CEMENT<br />
100<br />
90<br />
80<br />
70<br />
-0.1<br />
-0.2<br />
C-S-H<br />
AFm<br />
Si-Hg<br />
portlandite<br />
1 year (+)<br />
1 year (*)<br />
carbonate<br />
100 200 300 400 500 600 700 800<br />
Temperature (°C)<br />
Fig. 70 TGA-DTG curves of OPC (+) and HS (*) cement hydrated for 1 year at 50 °C<br />
However, minor phases and poorly crystalline phases are difficult to identify<br />
unambiguously by techniques like XRD, TGA and SEM, due to the overlap of peaks with<br />
the main phases. Therefore, selective dissolution using SAM (salicylic acid/methanol)<br />
was applied to dissolve the main phases with the aim of identifying clearly the minor<br />
phases formed in the course of the hydration process. The SAM extraction used in this<br />
study dissolves the silicate containing clinkers (C3S, C2S), C-S-H, portlandite, AFm and<br />
AFt phases. Fig. 71 and Fig. 72 show the XRD pattern and TGA-DTG curves of the<br />
residue of cement pastes hydrated between 28 days and 3 years at 20 °C after treatment<br />
with SAM. The presence of siliceous hydrogarnet at 2θ ~ 17.47° (corroborated by the<br />
additional peaks at 2θ ~ 20.21° and 2θ ~ 26.90°) is indicated in all SAM treated OPC<br />
samples irrespective of the hydration time. Note, however, that the intensity of siliceous<br />
hydrogarnet in the SAM treated HS cement paste is much less than in the OPC samples.<br />
152
CHAPTER 4 FE-CONTAINING HYDRATES IN HYDRATED CEMENT<br />
This suggests presence of poorly crystalline siliceous hydrogarnet in the HS samples.<br />
Presence of siliceous hydrogarnet is further supported by TGA-DTG, which shows the<br />
weight loss attributable to siliceous hydrogarnet at around 240 °C. The TGA-DTG curves<br />
also show the weight loss at 400 °C, which is assigned to the presence of hydrotalcite<br />
[136] in the hydrated cement samples (Fig. 72). SAM extraction was further done for the<br />
OPC and HS samples hydrated for 150 days at 50 °C. The residue contains ferrite and<br />
siliceous hydrogarnet (Fig. 73).<br />
Fig. 71 XRD patterns of OPC (+) and HS (*) hydrated at 20 °C after selective dissolution using<br />
SAM. Note that the samples suffered from carbonation during SAM extraction.<br />
153
weight loss in %<br />
differentiated relative weight<br />
CHAPTER 4 FE-CONTAINING HYDRATES IN HYDRATED CEMENT<br />
100<br />
90<br />
80<br />
70<br />
-0.1<br />
-0.2<br />
C-S-H<br />
Si-Hg<br />
hydrotalcite<br />
100 200 300 400 500 600 700 800<br />
Temperature (°C)<br />
28 days+<br />
150 days+<br />
3 years+<br />
3 years *<br />
carbonate<br />
Fig. 72 TGA-DTG curves of OPC (+) and HS (*) hydrated at 20 °C after selective dissolution<br />
with SAM.<br />
Fig. 73 XRD patterns of OPC (+) and HS (*) hydrated at 50 °C for 150 days after selective<br />
dissolution with SAM.<br />
154
CHAPTER 4 FE-CONTAINING HYDRATES IN HYDRATED CEMENT<br />
SEM/EDX studies were carried out to identify minor phases in the SAM treated OPC<br />
pastes and to determine the composition of siliceous hydrogarnet. Fig. 74a and b show<br />
the SEM images of SAM treated OPC samples hydrated for 2 years at 20 °C or 50 °C,<br />
respectively. Unreacted C2(A,F) (bright areas) was found to be covered partially by less<br />
dense siliceous hydrogarnet (light grey level). EDX was used to verify the presence of the<br />
latter phase. Fig. 75 shows the atomic ratios of (Al+Fe)/Ca against Si/Ca determined on<br />
the spots indicated in the SEM images. The composition of siliceous hydrogarnet was<br />
found to be Ca3Al0.9Fe1.0Si0.85O6 and Ca3Al1.1Fe0.95Si1.0O6.7 at 20 °C and 50 °C,<br />
respectively. The composition may vary due to the substitution of Al by Fe in<br />
hydrogarnet [129]. An important finding from this SEM/EDX study is that Fe tends to<br />
accumulate in the siliceous hydrogarnet together with Al, possibly indicating a solid<br />
solution. However, the presence of other Fe-containing phases (which might have<br />
dissolved during SAM extraction) in the hydrated cement cannot be excluded.<br />
155
a).<br />
b).<br />
CHAPTER 4 FE-CONTAINING HYDRATES IN HYDRATED CEMENT<br />
Fig. 74 SEM/EDX of hydrated OPC for 2 years at (a) 20 °C and (b) 50 °C after selective<br />
dissolution with SAM.<br />
156
(Al+Fe)/Ca<br />
(Al+Fe)/Ca<br />
0.8<br />
0.6<br />
0.4<br />
0.2<br />
b.<br />
a.<br />
0.8<br />
0.6<br />
0.4<br />
0.2<br />
0<br />
0<br />
CHAPTER 4 FE-CONTAINING HYDRATES IN HYDRATED CEMENT<br />
Ca 3Al 0.9Fe 1.0Si 0.85O 6<br />
0 0.2 0.4 0.6<br />
Si/Ca<br />
Ca 3Al 1.1Fe 0.95Si 1.0O 6.7<br />
0 0.2 0.4 0.6<br />
Si/Ca<br />
Fig. 75 Atomic ratio of hydrated OPC for 2 years at (a) 20 °C and (b) 50 °C after selective<br />
dissolution with SAM.<br />
157
CHAPTER 4 FE-CONTAINING HYDRATES IN HYDRATED CEMENT<br />
4.1.3. Spectroscopic investigation<br />
Experimental studies indicated that a number of Fe-containing phases like Fe(OH)3,<br />
C4FcH12, C4FsH12, C6Fs3H32, C3(A,F)SH4, C3FSH4 and Fe-hydrotalcite are stable at the<br />
high pH values of OPC pore solutions [15, 19, 129, 130, 137]. As shown above, it is<br />
difficult to identify the Fe-containing hydrates in cement pastes using common<br />
techniques like XRD, TGA and SEM due to overlap of the siginals from Fe- and Al-<br />
containing phases. Thus EXAFS, which allows element specific speciation studies, was<br />
used in addition with the aim of identifying the Fe-containing phases in the complex<br />
cement matrices. EXAFS spectra were also collected for synthetic Fe-bearing hydrates in<br />
order to use them as reference spectra for the analysis of the composed spectra obtained<br />
from hydrated OPC and HS.<br />
4.1.3.1. XANES and EXAFS spectra of Fe-containing reference<br />
compounds<br />
Fig. 76 and Fig. 77 show the Fe K-edge XANES and EXAFS spectra of Fe-containing<br />
hydrates used as reference compounds for identifying these phases in the cement paste.<br />
The XANES spectra show slight shifts in the energy of the white lines (absorption edges)<br />
of the reference compounds (Fig. 76). Furthermore, the peaks have different intensities.<br />
This is related to differences in structural symmetry and the kind of neighboring atoms in<br />
Fe-containing hydrates. The differences between the spectra of Fe-containing hydrates<br />
are more pronounced in the EXAFS region (Fig. 77). This difference is attributed to<br />
variations in the backscattering contribustions from the neighboring atoms. C2F and<br />
C4AF clinkers have the same spectral feature despite of small differences in the<br />
158
CHAPTER 4 FE-CONTAINING HYDRATES IN HYDRATED CEMENT<br />
intensities of the spectra, thus indicating similar symmetry. Similarly, no siginificant<br />
difference were observed between C3FSH4 and C3(A,F)SH4.<br />
In this study, Fe-containing phases were identifyed in hydrated cement based on EXAFS<br />
spectra due to the capability of the technique to identify poorly crystalline phases and<br />
those with low Fe concentrations. The EXAFS spectra of possible stable Fe-containing<br />
phases like the clinkers (C4AF and C2F), Fe(OH)3, C4FcH12, C6Fs3H32, C3(A,F)SH4,<br />
C3FSH4 and Fe-hydrotalcite were used as a reference compounds. Other possible Fe-<br />
containing phases like Al/Fe-solid solution AFm, AFt and hydrogarnet were not<br />
considered as the feature of the spectra are nearly identical with those of the pure Fe-<br />
containing AFm, AFt and hydrogarnet phases. Also C4FsH12 was not used as reference as<br />
the features are nearly identical with those of C4FcH12.<br />
Fig. 76 Fe K-edge XANES spectra of Fe-containing hydrates. The broken lines indicate the<br />
position of related spectral features.<br />
159
CHAPTER 4 FE-CONTAINING HYDRATES IN HYDRATED CEMENT<br />
Fig. 77 k 3 -weigthed experimental bulk-EXAFS spectra of Fe-containing phases used as reference<br />
compounds. The broken lines indicate the position of related spectral features.<br />
4.1.3.2. Identification of Fe-containing hydrates<br />
The EXAFS spectra of hydrated OPC and HS were collected at the Fe K-edge (7112 eV).<br />
Fig. 78 and Fig. 79 show the EXAFS spectra of hydrated OPC after different hydration<br />
times aged at 20 and 50 °C. The features of the spectra change as the hydration process<br />
progresses with time thus indicating the formation of different Fe-containing phase<br />
during hydration. The unhydrated cement spectra only contain the ferrite clinker<br />
(C2(A,F)). The spectra of OPC hydrated for 4 and 8 hours are similar which indicates that<br />
the same Fe-containing phases present in similar amounts contributed to the composed<br />
spectra. A small difference was observed between the unhydrated cement spectra and<br />
hydrated spectra (4 and 8 hours) at k ~ 6-7 Å. However, for OPC hydrated at 50° C, the<br />
difference is more significant at 16 hours hydration. Note that in all cases the spectral<br />
160
CHAPTER 4 FE-CONTAINING HYDRATES IN HYDRATED CEMENT<br />
features are nearly similar between 1 day and 1 year. The changes in the spectral features<br />
reveal the formation of new Fe-containing hydrates which contributed the composed<br />
spectra. This shows that the coordination environment of iron changes during the<br />
hydration process.<br />
k 3 (k)<br />
100<br />
80<br />
60<br />
40<br />
20<br />
0<br />
2 4 6 8 10<br />
k( Å -1<br />
)<br />
1 years<br />
150 days<br />
28 days<br />
1 day<br />
16 hrs<br />
8 hrs<br />
4 hrs<br />
Unhy<br />
Fig. 78 EXAFS spectra of hydrated OPC at 20 °C and at different ages (line: experimental data;<br />
dots: modeled data). The broken lines outline selected spectral features.<br />
161
k 3 (k)<br />
CHAPTER 4 FE-CONTAINING HYDRATES IN HYDRATED CEMENT<br />
100<br />
80<br />
60<br />
40<br />
20<br />
0<br />
2 4 6 8 10<br />
k( Å-1 )<br />
1 year<br />
150 days<br />
28 days<br />
1 day<br />
16 hrs<br />
8 hrs<br />
4 hrs<br />
Unhy<br />
Fig. 79 EXAFS spectra of hydrated OPC at 50 °C and at different ages (line: experimental data;<br />
dots: modeled data). The broken lines outline selected spectral features.<br />
The EXAFS spectra of hydrated HS cement at 20 °C and 50 °C are shown in Fig. 80 and<br />
Fig. 81. Pronounced changes are visible in the spectra between 16 hours and 1 day.<br />
Between 1 day and 1 year, however, the spectral features are very similar. This finding<br />
reveals major changes in the type and amount of Fe-containing phases during the first day<br />
of hydration while changes are less pronounced after 1 day hydration. The latter finding<br />
suggests that the same phases may be present between 1 day and 1 year hydration while<br />
the ratio of the phases may change with time.<br />
162
k 3 (k)<br />
CHAPTER 4 FE-CONTAINING HYDRATES IN HYDRATED CEMENT<br />
100<br />
80<br />
60<br />
40<br />
20<br />
0<br />
2 4 6 8 10<br />
k( Å -1<br />
)<br />
1 years<br />
150 days<br />
28 days<br />
1 day<br />
16 hrs<br />
4 hrs<br />
Unhy<br />
Fig. 80 EXAFS spectra of hydrated HS at 20 °C and at different ages (line: experimental data;<br />
k 3 (k)<br />
dots: modeled data). The broken lines outline selected spectral features.<br />
80<br />
60<br />
40<br />
20<br />
0<br />
2 4 6 8 10<br />
k( Å -1<br />
)<br />
1 year<br />
150 day<br />
16 hrs<br />
Fig. 81 EXAFS spectra of hydrated HS at 50 °C and at different ages (line: experimental data;<br />
4 hrs<br />
1 hrs<br />
Unhy<br />
dots: modeled data). The broken lines outline selected spectral features.<br />
163
CHAPTER 4 FE-CONTAINING HYDRATES IN HYDRATED CEMENT<br />
The Fe K-edge EXAFS spectra of the cement paste is considered to be composed of<br />
spectra of different Fe-containing phases. Linear combination (LC) fitting in combination<br />
with principal component analysis (PCA) and target transformation (TT) was carried out<br />
to identify the Fe-containing hydrates in the hardened cement pastes (see chapter 2.2.8).<br />
PCA was applied to determine the number of components contained in the Fe K-edge<br />
EXAFS spectra of the pastes. PCA predicted that three components are required to<br />
reproduce the Fe K-edge EXAFS spectra of the pastes. Two components were considered<br />
to be real while the third component was present at small amounts, suggesting that its<br />
contribution to the spectra was at noise level. TT was implemented to test which Fe-<br />
reference compound contributes to the complex hydrated cement spectra. The above<br />
listed references can have a potential to reconstruct the complex spectra as their SPOIL<br />
factor was < 5 [27].<br />
164
CHAPTER 4 FE-CONTAINING HYDRATES IN HYDRATED CEMENT<br />
Table 34 Relative weights of Fe-containing phases in hydrated OPC at 20 °C and 50 °C obtained<br />
from LC fitting.<br />
At 20 °C<br />
Age C2(A,F) Fe(OH)3 C3FSH4 C3(A,F)SH4 Fe-Ht C4FcH12 C6Fs3H32 R-factor<br />
Unhyd 1.00* - - - - - - 0.15<br />
4 hrs 0.63(3) 0.37(3) - - - - - 0.12<br />
8 hrs 0.70(4) 0.30(4) - - - - - 0.12<br />
16 hrs 0.36(3) 0.64(3) - - - - - 0.10<br />
1 day 0.45(2) - - 0.55(2) - - - 0.08<br />
28 days 0.42(2) - - 0.58(2) - - - 0.07<br />
150 days 0.40(1) - - 0.60(1) - - - 0.05<br />
1 year<br />
At 50 °C<br />
0.39(1) - - 0.61(1) - - - 0.04<br />
Age C2(A,F) Fe(OH)3 C3FSH4 C3(A,F)SH4 Fe-Ht C4FcH12 C6Fs3H32 R-factor<br />
Unhyd 1.00* - - - - - - 0.15<br />
4 hrs 0.63(3) 0.37(3) - - - - - 0.12<br />
8 hrs 0.40(3) 0.60(3) - - - - - 0.07<br />
16 hrs 0.48(1) - - 0.52(1) - - - 0.05<br />
1 day 0.44(1) - - 0.56(1) - - - 0.04<br />
28 days 0.43(1) - - 0.57(1) - - - 0.05<br />
150 days 0.41(2) - - 0.59(2) - - - 0.05<br />
1 year 0.42(2) - - 0.58(2) - - - 0.12<br />
R is an indicator for the goodness of the fit. *The fitting showed 0.78(5) C2(A,F) and 0.22(4) of C2F for unhydrated cement.<br />
-Indicates that the phase could be present but below the detection limit of the method (
CHAPTER 4 FE-CONTAINING HYDRATES IN HYDRATED CEMENT<br />
Table 35 Relative weights of Fe-containing phases in HS hydrated at 20 °C and 50 °C obtained<br />
from LC fitting.<br />
At 20 °C<br />
Age C2(A,F) Fe(OH)3 C3FSH4 C3(A,F)SH4 Fe-Htl C4FcH12 C6Fs3H32 R-factor<br />
Unhyd 1.00* - - - - - - 0.12<br />
4 hrs 0.78(3) 0.22(3) - - - - - 0.08<br />
16 hrs 0.56(3) 0.44(3) - - - - - 0.09<br />
1 day 0.62(2) - - 0.38(2) - - - 0.18<br />
28 days 0.57(2) - - 0.43(2) - - - 0.09<br />
150 days 0.56(2) - - 0.44(2) - - - 0.09<br />
1 year<br />
At 50 °C<br />
0.56(2) - - 0.44(2) - - - 0.07<br />
Age C4(A,F) Fe(OH)3 C3FSH4 C3(A,F)SH4 Fe-Ht C4FcH12 C6Fs3H32 R-factor<br />
Unhyd 1.00* 0.12<br />
1 hrs 0.70(4) 0.30(4) 0.14<br />
4 hrs 0.65(2) 0.35(2) 0.09<br />
16 hrs 0.64(2) 0.36(2) 0.18<br />
150 days 0.59(1) 0.41(1) 0.09<br />
1 year 0.58(2) 0.42(2) 0.07<br />
R is an indicator for the goodness of the fit. *The fitting showed 0.49(4) C2(A,F) and 0.51(4) of C2F for unhydrated cement.<br />
-Indicates that the phase could be present but below the detection limit of the method (
CHAPTER 4 FE-CONTAINING HYDRATES IN HYDRATED CEMENT<br />
hydration time as the rate of reaction increases with increasing temperature. At longer age<br />
Fe existed in C3(A,F)SH4. The trend was the same for hydrated HS cement showing that<br />
Fe tended to form Fe(OH)3 at early ages and siliceous hydrogarnet at later stages of<br />
hydration (Table 35).<br />
The fitting was also done by assuming three components to represent the unknown<br />
spectra. Consistent with the two component fitting, the results showed that at early age Fe<br />
tends to be associated with C2(A,F) and Fe(OH)3 and at longer age with C2(A,F) and<br />
siliceous hydrogarnet: C3(A,F)SH4 or C3FSH4. Traces of Fe(OH)3 or Fe-hydrotalcite was<br />
observed as a third components at longer hydration ages. The weight of Fe(OH)3 or Fe-<br />
hydrotalcite was less than 10% which is considered to be the uncertainty range of the<br />
method.<br />
Ferrite clinker (C2(A,F)) reacts rapidly in the early stage of hydration and persists at later<br />
age as demonstrated by XRD/Rietveld analysis [8, 9, 65]. In agreement with these<br />
findings EXAFS spectroscopy showed that the contribution of C2(A,F) spectra to the<br />
overall spectra decreased at early age and was almost constant after 1 day hydration.<br />
4.1.4. Thermodynamic modeling<br />
Based on the measured composition of the cement (Table 1), the phases formed during<br />
the OPC hydration were modeled using GEMS [6, 65]. For the modeling the solubility of<br />
Fe-containing hydrates as determined in this study [19, 129, 130] was combined with the<br />
thermodynamic database for cement hydrates Cemdata07 [3, 7, 15]. The formation of<br />
hydrogrossular was excluded as it does not form at ambient temperature. The modeling<br />
indicates the formation of C-S-H, portlandite and the Al-containing hydrates: Al-<br />
ettringite, Al-monosulfate, Al-hemicarbonate and Al-hydrotalcite (Fig. 82). Iron released<br />
167
CHAPTER 4 FE-CONTAINING HYDRATES IN HYDRATED CEMENT<br />
due to the hydration of the clinkers was calculated to be present during the first hours as<br />
Fe-ettringite and after the consumption of gypsum and anhydrite as C3F0.95SH4.1, which is<br />
calculated to be the only Fe-hydrate stable at longer hydration times. The long term<br />
prediction is consistent with the EXAFS results (Table 34). The experimentally observed<br />
formation of Fe(OH)3 (instead of the predicted Fe-ettringite) at early hydration time is<br />
probably related to the slow formation of Fe-ettringite. Fe(OH)3 formed as an<br />
intermediate phase in the early stage of hydration process was less stable than<br />
C3F0.95SH4.1 and therefore destabilized at later ages.<br />
Note that, in calculations, where the formation of aluminium containing siliceous<br />
hydrogarnet was not prevented, the formation of mixed Al- and Fe-containing siliceous<br />
hydrogarnet and Al-ettringite was calculated but no AFm phases, which does not agree<br />
with the experimental observation. Whether and to what extent Al can incorporated at<br />
room temperature in Fe-siliceous hydrogarnet is still unclear and should be the subject of<br />
future studies.<br />
cm 3 /100g<br />
90<br />
80<br />
70<br />
60<br />
50<br />
40<br />
30<br />
20<br />
10<br />
C (A,F) 2<br />
gypsum<br />
C A 3<br />
C S 2<br />
C 3 S<br />
pore solution<br />
Al-monocarbonate<br />
Al-ettringite<br />
Siliceous hydrogarnet<br />
Portlandite<br />
C-S-H<br />
0<br />
1E-3 0.01 0.1 1<br />
time [days]<br />
10 100 1000<br />
hydrotalcite<br />
Al-hemicarbonate<br />
Al-monosulfate<br />
Fig. 82 Volume changes of hydrated phases at different hydration ages during hydration of OPC<br />
at room temperature.<br />
168
CHAPTER 4 FE-CONTAINING HYDRATES IN HYDRATED CEMENT<br />
4.1.5. Conclusions<br />
The presence of siliceous hydrogarnet might occur in hydrated cement particularly at<br />
high temperature (Fig. 69) as early indicated from earlier studies [3, 23, 37]. A limited<br />
amount of siliceous hydrogarnet could have formed also at room temperature as the first<br />
XRD peak of siliceous hydrogarnet is located near the CH peak at 2θ ~ 17.47° which<br />
makes it difficult to identify this peak in the XRD pattern of hydrated cement (Fig. 67).<br />
Selective dissolution using SAM allows CH and other silicate phases to be dissolved<br />
which gives rise to clear XRD peaks of siliceous hydrogarnet as shown in Fig. 71. Its<br />
composition was determined to be Ca3Al0.9Fe1.0Si0.85O6 and Ca3Al1.1Fe0.95Si1.0O6 for the<br />
OPC hydrated at 20 and 50 °C. These siliceous hydrogarnets contain both Al and Fe<br />
which indicates substitution of Al by Fe in the structure of hydrogarnet. The finding<br />
agrees with the result of Taylor et al. [35] who suggested the formation of hydrogarnet in<br />
hydrated cement with a composition Ca3Al1.2Fe0.8 SiO1.2H8 using SEM microanalysis.<br />
EXAFS spectroscopy shows that in all cases Fe was associated with C2(A,F) and<br />
Fe(OH)3 gel at early age hydration. With time, however, Fe(OH)3 dissolved and<br />
precipitated as C3(A,F)SH4, which supported the findings by selective dissolution with<br />
SAM for hydrated OPC. In hydrated HS, however, no siliceous hydrogarnet could be<br />
detected by XRD possibly due its poor crystallinity, while EXAFS spectroscopy shows<br />
the presence of C3(A,F)SH4.<br />
The experimentally determined solubility products indicate that Fe-ettringite is less stable<br />
than Al-ettringite [16] and therefore this phase is hardly present in hydrated cement<br />
pastes, except at early ages in the presence of gypsum. The Fe-AFm phases are generally<br />
more stable than the Al-AFm phases [19, 130]. However, the very low Fe concentrations<br />
(
CHAPTER 4 FE-CONTAINING HYDRATES IN HYDRATED CEMENT<br />
phases and therefore Fe is preferentially bound in siliceous hydrogarnet. Fe(OH)3 formed<br />
as an intermediate phase in the early stage of the hydration process while it convertes to<br />
C3(A,F)SH4 with time. EXAFS spectroscopy indicates that small amounts of Fe could be<br />
bound in hydrotalcite or remaining Fe(OH)3 at longer hydration times. Thermodynamic<br />
modeling indicated that C3F0.95SH4.1 is the stable Fe-containing phase in hydrated OPC.<br />
In conclusion, EXAFS can be used to identify minor, amorphous or poorly crystalline<br />
phases in a complex cementitious system. Furthermore, identification of phases and<br />
thermodynamic modeling of the hydration process are important with a view to assessing<br />
of the durability of cementitious materials and assessments made in connection with the<br />
safe disposal of radioactive and hazardous wastes.<br />
170
CHAPTER 4 FE-CONTAINING HYDRATES IN HYDRATED CEMENT<br />
4.2. Synthetic Fe-cement<br />
4.2.1. Introduction<br />
As discussed in section 4.1, the identification of Fe-bearing hydrates in the complex<br />
matrix of hydrated cement is difficult with techniques like XRD, TGA and SEM/EDS as<br />
their signals overlap to a large extent with those of the Al-bearing phases present and also<br />
partially with those of other solids. In section 4.1, EXAFS was used as an alternative<br />
method to determine the fate of Fe-hydrates in Portland cements and mixed Al-Fe-<br />
siliceous hydrogarnet was identified as the main Fe-containing hydrate after more than 1<br />
day of hydration, while no Fe-containing ettringite of monocarbonate was observed. In<br />
contrast to the observation in the cement system, not only mixed Al-Fe-Si-hydrogarnet,<br />
but also Fe-ettringite, Fe-monocarbonate or Fe-monosulfate are easily synthesized in<br />
water or KOH solutions [11-17, 19].<br />
Thus, Al-free synthetic cements were prepared to investigate the hydration assemblage in<br />
the absence of Al in order to understand the chemistry of Portland cement without Al and<br />
the role of Fe in cement.<br />
The synthetic cements contained ferrite (C2F), alite, additional alkalis and varying<br />
amounts of gypsum and calcite to mimic the composition of Portland cement as close as<br />
possible. Isothermal conduction calorimeter, XRD and TGA were used to characterize<br />
the hydration of the synthetic cements. Thermodynamic modeling was also performed to<br />
predict the hydration assemblage of synthetic Fe-cement.<br />
171
Early reaction<br />
CHAPTER 4 FE-CONTAINING HYDRATES IN HYDRATED CEMENT<br />
4.2.2. Effects of gypsum on the of hydration of synthetic Fe-cement<br />
Fig. 83 shows that pure C2F cement (with alkali sulfates present) reacted fast. The main<br />
heat release was observed around 6 hours. Addition of gypsum to the C2F clinker<br />
retarded the reaction. The presence of gypsum seems to retard C2F such as it does C3A<br />
[138], possibly also due to blocking of the surface sites in the presence of high<br />
concentrations of dissolved sulfate. The calorimeter curve of synthetic Fe-cement<br />
hydrated with different amounts of gypsum (Gyp-0% - Gyp-26%) shows an acceleration<br />
of the main alite reaction in the presence of more gypsum. Sulfate is known to accelerate<br />
the alite reaction [139]. The peak of the ferrite reaction is not visible in the calorimetric<br />
data for the synthetic Fe-cement.<br />
heat flow / J/(g·h)<br />
35<br />
30<br />
25<br />
20<br />
15<br />
10<br />
5<br />
0<br />
0 8 16 24 32 40 48<br />
hydration time / h<br />
C2F-Pure<br />
C2F-Gyp<br />
Gyp-0%<br />
Gyp-6%<br />
Gyp-26%<br />
Fig. 83 Heat flow of the hydration of C2F and synthetic Fe-cement in the presence of different<br />
amounts of gypsum.<br />
Hydrates formed<br />
The XRD and TGA results of Fe-synthetic cement with different amounts of gypsum<br />
hydrated for 3 days are shown in Fig. 84. The hydration of pure ferrite resulted in iron<br />
172
CHAPTER 4 FE-CONTAINING HYDRATES IN HYDRATED CEMENT<br />
containing OH-AFm phases, Fe-hydroxide and some hemi- and monocarbonate due to<br />
contamination with CO2. In the presence of gypsum, pure ferrite produced traces of Fe-<br />
ettringite. The hydration of synthetic Fe-cement produced C-S-H and portlandite as main<br />
hydrates after 3 days.<br />
differentiated relative weight Weight loss in %<br />
Intensity [arb. units]<br />
100<br />
90<br />
80<br />
Fe-Ett<br />
-0.1<br />
-0.2<br />
-0.3<br />
CsH 2<br />
Fe-Mc*<br />
+<br />
C-S-H<br />
C 2 F<br />
CH<br />
CsH 2<br />
10 15 20 25 30<br />
AFm<br />
CsH 2<br />
2CuK<br />
CH<br />
*<br />
C 2 F<br />
*<br />
CsH 2<br />
C 2 F<br />
C 2 F-Pure<br />
C 2 F-Gyp<br />
Gyp-0%<br />
Gyp-6%<br />
Gyp-26%<br />
CsH 2<br />
100 200 300 400 500 600 700 800<br />
Temperature (°C)<br />
carbonate<br />
*<br />
C 2 F<br />
C 2 F-Pure<br />
C2F-Gyp<br />
Gyp-0%<br />
Gyp-6%<br />
Gyp-26%<br />
Fig. 84 XRD (above) and TGA-DTG (below) analysis of C2F and synthetic Fe-cement after 3<br />
days of hydration in the presence of different amounts of gypsum *Fe-OH-AFm<br />
+unidentified.<br />
173
CHAPTER 4 FE-CONTAINING HYDRATES IN HYDRATED CEMENT<br />
The phase assemblage of the hydrating synthetic Fe-cement changed with time as shown<br />
in Fig. 85 after 3 months. Again, Fe-containing OH-AFm phases were observed in the<br />
pure ferrite sample. Fe-containing monocarbonate was also clearly visible due to<br />
carbonation of the pure ferrite sample. The ferrite had reacted completely during this time<br />
and in addition to the AFm phases also significant amounts of amorphous Fe-hydroxide<br />
formed as it is visible in the water loss between 70 and 100 °C in TGA. In the presence of<br />
gypsum and ferrite more Fe-ettringite formed. However, even after 3 months, a<br />
significant part of ferrite had not reacted. The presence of gypsum seems to strongly<br />
retard the reaction of ferrite strongly. The hydration of synthetic Fe-cement without<br />
additional gypsum produced C-S-H and portlandite. The formation of Fe-siliceous<br />
hydrogarnet would be possible under these conditions; however no Fe-siliceous<br />
hydrogarnet was detected by XRD. This could be related to the formation of poorly<br />
crystalline Fe-siliceous hydrogarnet (see chapter 3.5.6). In the presence of gypsum, Fe-<br />
ettringite was produced as the main Fe-containing hydrate. The reaction of ferrite was not<br />
complete in any of the synthetic Fe-cements, neither in the absence nor the presence of<br />
gypsum.<br />
174
differentiated relative weight Weight loss in %<br />
Intensity [arb. units]<br />
100<br />
90<br />
80<br />
70<br />
-0.1<br />
-0.2<br />
-0.3<br />
CHAPTER 4 FE-CONTAINING HYDRATES IN HYDRATED CEMENT<br />
Fe-Ett<br />
Fe-Ett<br />
CsH 2<br />
Fe-Mc<br />
+<br />
*<br />
C 2 F<br />
*<br />
Fe-Ett<br />
CH<br />
Fe-Mc<br />
CsH 2<br />
C F 2<br />
C F 2 C F Fe-Ett CH<br />
2<br />
CsH 2<br />
10 15 20 25 30<br />
C-S-H<br />
AFm<br />
CsH 2<br />
2CuK<br />
*<br />
CsH 2<br />
CH<br />
CsH 2<br />
*<br />
carbonate<br />
C 2 F-Pure<br />
C 2 F-Gyp<br />
Gyp-0%<br />
Gyp-6%<br />
Gyp-26%<br />
100 200 300 400 500 600 700 800<br />
Temperature (°C)<br />
C 2 F-Pure<br />
C2F-Gyp<br />
Gyp-0%<br />
Gyp-6%<br />
Gyp-26%<br />
Fig. 85 XRD (above) and TGA-DTG (below) analysis of C2F and synthetic Fe-cement after 3<br />
months of hydration in the presence of different amounts of gypsum *Fe-AFm hydroxyl.<br />
175
CHAPTER 4 FE-CONTAINING HYDRATES IN HYDRATED CEMENT<br />
Thermodynamic calculations<br />
Thermodynamic modeling was performed to calculate the composition of hydrated<br />
synthetic Fe-cement in the presence of varying amounts of gypsum. The model predicted<br />
the formation of C-S-H, portlandite and Fe-siliceous hydrogarnet in the absence of<br />
gypsum (Fig. 86). It should be noted that in the presence of silica, no monosulfate but<br />
only ettringite formation was predicted if more sulfate is present in the system. Fe-<br />
siliceous hydrogarnet is calculated to be more stable than Fe-monosulfate under these<br />
conditions. As the amount of gypsum increased the formation of Fe-ettringite and finally<br />
the presence of unreacted gypsum was calculated. This is consistent with the XRD and<br />
TGA results (Fig. 85) though Fe-siliceous hydrogarnet was not observed. Fe-siliceous<br />
hydrogarnet was calculated to be unstable in the presence of gypsum and Fe-ettringite.<br />
cm 3 /100g<br />
80<br />
70<br />
60<br />
50<br />
40<br />
30<br />
20<br />
10<br />
Fe-Si-hydrogarnet<br />
portlandite<br />
Fe-ettringite<br />
C-S-H<br />
0<br />
0 10 20 30<br />
Gypsum %<br />
40 50 60<br />
Gypsum<br />
Fig. 86 Calculated phase diagram of thermodynamic stable hydrate assemblages of synthetic Fe-<br />
cement with different amounts of gypsum.<br />
176
Early reaction<br />
CHAPTER 4 FE-CONTAINING HYDRATES IN HYDRATED CEMENT<br />
4.2.3. Effects of calcite on the of hydration of synthetic Fe-cement<br />
The effects of the presence of both calcite and gypsum during the hydration of ferrite and<br />
of the synthetic Fe-cement were studied. In the presence of calcite, the rate of the ferrite<br />
reaction did not change significantly from the previous experiment. In the presence of<br />
gypsum, however, the reaction of the ferrite was strongly retarded while the reaction of<br />
alite was accelerated, as observed before for the calcite free samples (Fig. 87).<br />
Fig. 87 Conduction calorimeter curve of the hydration of synthetic Fe-cement with different<br />
amounts of gypsum and calcite.<br />
Hydrates formed<br />
The presence of calcite changed the phase assemblage for the pure ferrite but not for the<br />
synthetic cements (Fig. 88). The formation of Fe-monocarbonate was clearly visible<br />
during the hydration of pure ferrite in the presence of calcite. The presence of gypsum<br />
strongly retarded the ferrite reaction; only a small amount of Fe-ettringite was detected<br />
177
CHAPTER 4 FE-CONTAINING HYDRATES IN HYDRATED CEMENT<br />
together with unreacted gypsum and calcite, while no formation of Fe-monocarbonate<br />
was observed.<br />
The hydrates formed in the synthetic Fe-cement with calcite but without additional<br />
gypsum were C-S-H and portlandite and unreacted calcite, while no Fe-monocarbonate<br />
was identified. The reaction of ferrite was again strongly retarded in the presence of<br />
silica, as observed previously for the calcite free cements, while the reaction of alite was<br />
nearly complete after the 3 months of hydration. In the presence of gypsum and calcite,<br />
the formation of Fe-ettringite was clearly visible, although the ferrite reaction had been<br />
retarded.<br />
178
weight loss in %<br />
differentiated relative weight<br />
100<br />
90<br />
80<br />
70<br />
-0.1<br />
Fe-Ett<br />
C-S-H<br />
-0.2<br />
-0.3<br />
CHAPTER 4 FE-CONTAINING HYDRATES IN HYDRATED CEMENT<br />
AFm<br />
CsH 2<br />
CH<br />
100 200 300 400 500 600 700 800<br />
Temperature (°C)<br />
C2F + Cc7<br />
C2F + Cc + Gyp<br />
7.8% Cc + 0% Gyp<br />
7.4% Cc + 6% Gyp<br />
6.2% Cc + 20% Gyp<br />
Fig. 88 XRD (above) and TGA-DTG (below) analysis of synthetic Fe-cement after 3 months of<br />
hydration with different amounts of gypsum and calcite<br />
Thermodynamic calculations<br />
The thermodynamic calculations for the synthetic Fe-cements predicted the formation of<br />
Fe-siliceous hydrogarnet instead of monocarbonate (Fig. 89). In the presence of more<br />
calcium sulfate, again Fe-ettringite was calculated to be stabilized as calculated also for<br />
the calcite free synthetic Fe-cements as discussed above.<br />
Cc<br />
179
cm 3 /100g<br />
CHAPTER 4 FE-CONTAINING HYDRATES IN HYDRATED CEMENT<br />
70<br />
60<br />
50<br />
40<br />
30<br />
20<br />
10<br />
Fe-Si-hydrogarnet<br />
portlandite<br />
Fe-ettringite<br />
C-S-H<br />
calcite<br />
0<br />
0 10 20 30 40<br />
Gypsum %<br />
50 60<br />
Fig. 89 Calculated phase diagram of thermodynamic stable hydrate assemblages of Fe-synthetic<br />
cement with different amounts of gypsum and calcite.<br />
4.2.4. Conclusions<br />
The experimental study show that pure ferrite phase (C2F) reacted fast and formed Fe-<br />
containing OH-AFm phases. If the samples carbonate the formation of monocarbonate<br />
was observed. The presence of gypsum strongly retarded the ferrite reaction and led to<br />
the formation of Fe-ettringite.<br />
The hydration of synthetic Fe-cement resulted in the formation of C-S-H, portlandite and<br />
possibly Fe-siliceous hydrogarnet. In the presence of gypsum Fe-ettringite was also<br />
formed, both in the absence and presence of calcite. Thermodynamic modeling was in<br />
agreement with the experimental observations and predicted the formation of C-S-H,<br />
portlandite and Fe-siliceous hydrogarnet at lower gypsum content. Upon the addition of<br />
Gypsum<br />
gypsum stable Fe-ettringite was predicted, again in the absence and presence of calcite.<br />
180
CHAPTER 4 FE-CONTAINING HYDRATES IN HYDRATED CEMENT<br />
The observations made in these synthetic Fe-cements concerning on the fate of iron are<br />
comparable to the observations made in commercial Portland cements. In the OPC and<br />
HS cements investigated (see section 4.1) the main hydrates were C-S-H, portlandite, Al-<br />
AFm and AFt phases. The formation of Al/Fe-siliceous hydrogarnet was also observed<br />
but not Fe-containing ettringite. The presence of aluminium in the OPC and HS cements<br />
led to the formation of stable Al-ettringite and Al-containing AFm phases while all Fe<br />
released from the ferrite was present as Fe-siliceous hydrogarnet in the long term time.<br />
The experiments with the synthetic Fe-cements confirmed the validity of the<br />
thermodynamic calculations in the synthetic cements and confirmed that the presence of<br />
silica suppressed the formation of Fe-containing AFm phases.<br />
181
5. GENERAL CONCLUSION AND OUTLOOK<br />
5. GENERAL CONCLUSION AND OUTLOOK<br />
5.1. General conclusion<br />
Thermodynamic modeling of the hydration process allows the compositions of the<br />
hydration assemblages to be predicted under different conditions and to be extrapolated<br />
to long time scales. However, an important limitation of thermodynamic modeling was<br />
the lack of knowledge on the Fe speciation in hydrating cement, as Portland cements<br />
contain generally around 4-7 % iron oxide. No experimentally determined solubility<br />
products have been available for most Fe-containing hydrates. It was unclear to what<br />
extent Fe substitutes Al in AFm and hydrogarnet phases. In addition, there was little<br />
experimental evidence which Fe-containing phases form in hydrated Portland cements.<br />
This thesis aimed to fill these gaps by:<br />
i) determining the solubility of different Fe-containing hydrates, studying their<br />
crystal structure and solid solution formation with Al-containing hydrates.<br />
ii) investigating the speciation of iron(III) in hydrated cements.<br />
Fe-containing hydrates<br />
Possible Fe-containing hydrates (Fe-hemicarbonate, Fe-monocarbonate, Fe-monosulfate,<br />
Fe-Friedel’s salt, Fe-strätlingite, Fe-hydrogarnet and Fe-siliceous hydrogarnet) and their<br />
solid solution with their Al-analogues were synthesized at different temperatures. The Fe-<br />
containing AFm phases (Fe-monocarbonate, Fe-monosulfate and Fe-Friedel’s salt) are<br />
thermodynamically stable at 20 °C and 50 °C. At 80 °C, the Fe-containing AFm hydrates<br />
are unstable with respect to Fe-hydroxide/hematite and portlandite. Fe-hemicarbonate and<br />
Fe-AFm hydroxyl (C4FH13) are unstable in the presence of carbonate and converted to<br />
Fe-monocarbonate with time in all experiments. Fe-strätlingite could not be synthesised<br />
182
5. GENERAL CONCLUSION AND OUTLOOK<br />
at any conditions. Portlandite and Fe-hydroxide co-precipitated with the different AFm<br />
phases. Generally, the AFm phases form very slowly (over the course of a few years) at<br />
20 °C from C2F, while at 50 °C the formation is faster.<br />
The structure of the stable Fe-containing AFm hydrates (Fe-monocarbonate, Fe-<br />
monosulfate, Fe-Friedel’s salt) were determined and refined using synchrotron powder<br />
diffraction data. Fe-monocarbonate, Fe-monosulfate and Fe-Friedel’s salt show a<br />
rhombohedral R3 c symmetry.<br />
The solubility products obtained at standard conditions (25 °C, 1 atm) for the Fe-<br />
containing AFm phases are generally 2 to 3 log units lower than those of the Al-<br />
containing AFm phases, comparable to the difference between Fe(OH)3 and gibbsite.<br />
logKs0 (Fe) log Ks0 (Al)<br />
Monosulfate -31.57 -29.26<br />
Monocarbonate -34.59 -31.47<br />
Hemicarbonate -30.83 -29.13<br />
C4(A,F)H13 -30.64 -25.4<br />
Friedel’s salt -28.62 -27.69<br />
(Al,Fe)(OH)3 -4.1 -1.24<br />
Notable exceptions are Fe-Friedel’s salt and Fe-hemicarbonate which have relatively high<br />
solubility products compared to the Al-phases, indicating that Fe-Friedel’s salt and Fe-<br />
hemicarbonate are most probably not stable in hydrated cements.<br />
Also the formation of hydrogarnets (Al-katoite (C3AH6), Fe-katoite (C3FH6), Al-siliceous<br />
hydrogarnet and Fe-siliceous hydrogarnet) was studied. C3AH6 was the stable phase in<br />
the CaO-Al2O3-H2O system in the absence of other ions, in all cases co-precipitation of<br />
traces of C4AH13 was observed. In contrast, C3FH6 was found to be metastable while<br />
C4FH13, portlandite, amorphous Fe-hydroxide and carbonate containing AFm phases<br />
183
5. GENERAL CONCLUSION AND OUTLOOK<br />
formed. The investigation of Al- and Fe-siliceous hydrogarnet was complicated due to<br />
the formation of two hydrogarnets with different silica contents in both systems. In<br />
addition, C(-A)-S-H co-precipitated during the preparation of Al-containing siliceous-<br />
hydrogarnet. Al-containing siliceous hydrogarnet did not form at room temperatures but<br />
only at 110 °C. In contrast, stable but poorly crystalline Fe-siliceous hydrogarnet formed<br />
slowly at room temperature. At 110 °C the formation of two well crystalline Fe-siliceous<br />
hydrogarnet (C3FS0.95H4.1 and C3FS1.5H2.96) was observed both with the typical cubic<br />
crystal structure.<br />
The solubility products of Al and Fe-containing Si-hydrogarnets decreases strongly with<br />
increasing silica content indicating that a strong stabilisation. The solubility products<br />
obtained at standard conditions (25 °C, 1 atm) for the Fe-containing hydrogarnets were 5<br />
to 7 log units lower than those of the Al-containing hydrogarnets.<br />
log Ks0 (Fe) log Ks0 (Al)<br />
C3(A,F)H6 -25.56 -20.56<br />
C3AS0.41H5.18<br />
C3AS0.84H4.32<br />
C3FS0.95H4.1<br />
-32.75<br />
C3FS1.52H2.96 -34.68<br />
-25.47<br />
-26.70<br />
The relatively low solubility products of the Fe-containing siliceous hydrogarnets<br />
compared to the Al-phases, together with the observation that Fe-siliceous hydrogarnets<br />
form at room temperature, indicates that Fe-containing siliceous hydrogarnets could be<br />
stable in hydrated cements.<br />
184
Speciation of iron(III) in hydrated cements<br />
5. GENERAL CONCLUSION AND OUTLOOK<br />
Standard analytical techniques (XRD, TGA, SEM) shows C-S-H, CH, AFt and AFm<br />
phases formation during hydration. With selective dissolution using SAM the presence of<br />
Al- and Fe-containing siliceous hydrogarnet was confirmed in the hydrated cements.<br />
EXAFS spectroscopy further shows that during the first few hours of hydration Fe(OH)3<br />
formed. At later ages, Fe-containing siliceous hydrogarnet was identified as the main Fe-<br />
containing hydrate. Thermodynamic modeling of the hydration predicts that iron should<br />
be bound in siliceous hydrogarnet, possibly as a solid solution together with aluminum:<br />
Ca3(AlxFe1-x)2(SiO4)3-y(OH)4y. These modeling results are in agreement with the<br />
experimental observations.<br />
The investigations have been complemented with a study on the hydration of synthetic,<br />
aluminum free cements. In the presence of sulfate, Fe-ettringite was found to be stable<br />
besides C-S-H and CH. Possibly Fe-siliceous hydrogarnets were also present, but they<br />
could not be clearly identified standard analytical techniques. The same hydrate<br />
assemblage (Fe-ettringite, C-S-H and CH) was observed for the calcite free and calcite<br />
containing synthetic Fe-cements. The experimental findings are supported by the<br />
modeling results. In Portland cements, however, the formation of Fe-ettringite is not<br />
expected as the more stable Al-ettringite preferentially forms. The presence of aluminum<br />
in the investigated Portland cements leads to the formation of stable Al-ettringite and Al-<br />
containing AFm phases while all Fe is released during ferrite dissolution present as Fe-<br />
siliceous hydrogarnet in the long term.<br />
In general, the solubility products of Fe-containing hydrates determined in this study will<br />
help in the future to establish whether and to what extent Fe-containing hydrates are<br />
stable in blended cementitious systems, and allow further considerations on the durability<br />
185
5. GENERAL CONCLUSION AND OUTLOOK<br />
of cementitious materials and assessments related to the safe disposal of radioactive and<br />
hazardous wastes.<br />
A significant part of the aluminum in hydrated Portland cement might be incorporated in<br />
C-S-H. Recent experimental data indicates that up to 50% of aluminum present in a<br />
blended PC-slag system was incorporated in the C-A-S-H phase [140]. The incorporation<br />
in Portland cement is somewhat lower as the incorporation of aluminium in C-S-H<br />
decreases with increasing Ca/Si ratio of the C-S-H [141].<br />
This poses the question whether C-S-H might also incorporate significant amounts of<br />
iron. NMR results, however, indicate that the uptake of iron in C-S-H is much lower than<br />
the uptake of aluminum. The presence of Fe 3+ within the structure of the solids distorts<br />
the NMR signal and leads to strong dipolar coupling between the spin of the element<br />
investigated and the spins of the two unpaired electrons from Fe 3+ [142]. Montheilet et al.<br />
[143] calculated on the basis of the distortion of H-NMR measurements that 2.5×10 15 Fe<br />
were present per m 2 of C-S-H in a white cement, which corresponds to 1 Fe per 25’000<br />
Si 2 . In a grey cement, the H-NMR measurements indicate that 2-3 times more Fe are<br />
bound in the C-S-H [144], so that in a grey cement there might be 1 Fe per 10’000 Si,<br />
which corresponds to 0.1 mg Fe2O3 per 1 g SiO2 and thus is a negligible quantity.<br />
5.2. Outlook<br />
The research presented in this thesis also reveals that in different areas more detailed<br />
studies should be carried out to address the following topics:<br />
Solid solutions in the interlayer structure of Fe-Friedel’s salt and of mixed<br />
hydrogarnets (Ca3(AlxFe1-x)2(SiO4)3-y(OH)4y).<br />
2 Surface area of C-S-H: 125 m 2 /cm 3 , Molar volume of C-S-H :78 cm 3 /mol: 2.5×10 15 Fe/m 2 × 125 m 2 /cm 3<br />
×78 cm 3 /mol /(6×10 23 parts per mol) = 0.000041 Fe/Si = 1 Fe/25’000 Si<br />
186
5. GENERAL CONCLUSION AND OUTLOOK<br />
The conditions and kinetics of the formation of mixed hydrogarnets.<br />
The fate of iron under reducing conditions. Reducing conditions in cements may<br />
dominate in materials blended with blast furnace slags, upon the addition of<br />
chromate-reducing agents (often FeSO4 xH2O) or in the near field of a repository<br />
for radioactive waste where strongly reducing conditions are expected to prevail<br />
in the long term. Besides sulphur (and H2O and O2) Fe constitutes the most<br />
abundant redox couple (Fe(II)/Fe(III)) and thus plays a key role in controlling<br />
redox equilibria of cementitious systems. The effect of reducing conditions on the<br />
Fe speciation in cement is still poorly understood.<br />
The possible use of Mössbauer spectroscopy or other techniques complementary<br />
to the EXAFS technique.<br />
187
ABBREVATIONS<br />
Cement chemistry notations<br />
ABBREVIATIONS<br />
C= CaO A=Al2O3 S = SiO2 s = SO3<br />
c = CO2 F = Fe2O3 H = H2O<br />
Hydrated phases<br />
AFm Al2O3-Fe2O3-mono phase AFt Al2O3-Fe2O3-tri phase<br />
C-S-H Calcium silicate hydrate<br />
Portlandite=CH=P<br />
Gypsum=CsH2<br />
Al-hemicarbonate=Al-Hc=C4Ac0.5H10<br />
Al-monocarbonate=Al-Mc= C4AcH11<br />
Fe-hemicarbonate=Fe-Hc=C4Fc0.5H10<br />
Fe-monocarbonate=Fe-Mc= C4FcH12<br />
Al-monosulfate =Al-Ms= C4AsH12 Fe-monosulfate=Fe-Ms= C4FsH12<br />
Al-Friedel’s salt=Al-Fr Fe-Friedel’s salt=Fe-Fr<br />
Al-OH-AFm= C4AH13 Fe-OH-AFm= C4FH13<br />
Al-katoite= C3AH6 Fe-katoite= C3FH6<br />
Al-ettringite=Al-Ett= C4As3H32 Fe-ettringite=Fe-Ett= C4Fs3H32<br />
Al-siliceous hydrogarnet= Al-Si-Hg (C4ASH4) Fe-Siliceous hydrogarnet= Fe-Si-Hg =<br />
(C4FSH4)<br />
OPC Ordinary Portland cement<br />
HS High sulfate resistant cement<br />
188
Techniques<br />
XRD X-ray diffraction<br />
TGA Thermogravimetric analysis<br />
DTG Derivative thermogravimetric analysis<br />
SEM Scanning electron microscopy<br />
XAS X-ray absorption spectroscopy<br />
ABBREVIATIONS<br />
EXAFS Extended X-ray absorption fine structure<br />
IR Infrared spectroscopy<br />
ICP/OES Inductively-coupled plasma optical emission spectrometry<br />
ICP/MS Inductively-coupled plasma mass spectrometry<br />
GEMS Gibbs energy minimization selector<br />
MBSSAS Margules binary solid solution aqueous solution<br />
PDF Powder diffraction file<br />
Thermodynamic parameters<br />
CP 0 standard molar heat capacity of species at T, P(J K -1 mol -1 )<br />
∆rCP 0 T<br />
∆rCP 0 T0<br />
∆fG 0 T0<br />
∆rG 0 T<br />
∆Gex<br />
standard molar heat capacity change of reaction at T (J K -1 mol -1 )<br />
standard molar heat capacity change of reaction at T0 = 298 K(25°C)( J K -1 mol -1 )<br />
standard molar Gibbs energy (of formation from elements)at T0 =298 K<br />
(25°C)(KJ mol -1 )<br />
standard Gibbs energy change in a reaction (KJ mol -1 )<br />
excess molar Gibbs energy of mixing for the solid solution series (KJ mol -1 )<br />
∆fG 0 i standard molar Gibbs energy of formation of end member i of a solid solution series (KJ<br />
mol -1 )<br />
189
ABBREVIATIONS<br />
∆Gid molar Gibbs energy of mixing of an ideal solid solution (KJ mol -1 )<br />
∆GM molar Gibbs energy of mixing for end members i of the solid solution series (KJ mol -1 )<br />
∆Gss molar Gibbs energy of a solution between different end members i (KJ mol -1 )<br />
γi Activity coefficient of species i<br />
∆rH 0 T standard change of enthalpy of reaction at T (KJK -1 mol -1 )<br />
∆rH 0 T0 standard change of enthalpy of reaction at T0=298 K (25°C)(KJK -1 mol -1 )<br />
∆fH 0 T0 standard molar enthalpy at T0 = 298 K (25°C)(KJ K -1 mol -1 )<br />
I effective molal ionic strength of aqueous solution<br />
KT<br />
thermodynamic equilibrium constant of reaction at T<br />
П total solubility product in Lippmann phase diagrams<br />
R universal gas constant (8.31451 J K -1 mol -1 )<br />
∆rS 0 T standard entropy change in reaction at T (J K -1 mol-1)<br />
∆rS 0 T0 standard entropy change in reaction at T0 =298K (25°C) (JK -1 mol -1 )<br />
S 0 T0<br />
standard molar absolute entropy at T0 =289K (25°C) (JK -1 mol -1 )<br />
T temperature of interest (K)<br />
T0<br />
V 0<br />
reference temperature (298 K)<br />
standard molar volume (cm 3 mol -1 )<br />
Xaq,I aqueous activity fractions of the substitutable species i<br />
Xi<br />
mole fraction of end member i in solid solution<br />
logKs0 solubility product<br />
190
APPENDIX<br />
APPENDIX<br />
Appendix A: Additional fitted structural parameters<br />
Appendix A1. EXAFS fitted structural parameters for Fe-containing compounds and comparison<br />
with XRD data<br />
Phases Atomic pair N σ(Å) R(Å) R-Factor(%) R(Å) (XRD)<br />
C4AF Fe-O 3.9 0.009 1.95 2 1.94 [145]<br />
Fe-Ca 5.1 0.011 3.12 3.04/3.22<br />
Fe-Fe 5 0.007 3.6 3.48<br />
Fe-Al 4.8 0.004 3.59 3.66<br />
C2F Fe-O 3.0 + 0.006 1.9 6.2 1.96 [146]<br />
Fe-Ca 3.0 + 0.018 3.14 3.06/3.22<br />
Fe-Fe 2.0 + 0.005 3.65 3.72<br />
Fe-Fe 4.0 + 0.011 3.99 3.9<br />
Fe(OH)3 Fe-O 6.0 + 0.012 2 3.3 1.96 [147]<br />
Fe-Fe 4.0 + 0.012 3.04 3.01<br />
Fe-Fe 4.0 + 0.013 3.41 3.44<br />
C4FcH12 Fe-O 6.0+ 0.006 2.02 6 2.04<br />
Fe-Ca 6.0+ 0.008 3.47 3.46<br />
C4AcH12 Al-Ca 6.0 - 3.40*<br />
C6Fs3H32 Fe-O 5.4 0.004 2.03 2.5 1.92 [148] *<br />
Fe-Ca 5.1 0.01 3.52<br />
C6AsH32 Al-Ca 6.0 - - 3.44*<br />
Fe-Hydrotalcite Fe-O 5.7 0.003 2.03 1.5 2.06 [149]]<br />
Fe-Mg 6.0 # 0.005 3.13 3.11<br />
C3FSH4 Fe-O 6.0 + 0.009 2.01 3.7 2.02 [106] *<br />
Fe-Si 6.0 + 0.005 3.39<br />
Fe-Ca 6.0 + 0.007 3.46<br />
C3ASH4 Al-Si 6 3.43*<br />
Al-Ca 6 - - 3.43*<br />
N: Coordination number of the neighboring atom (Uncertainty ± 20%)<br />
R: Distance to the neighboring atom (Uncertainty ± 0.02 Å)<br />
σ: Debye-Waller factor<br />
*: values from Al-containing phases<br />
+: fixed parameters during fitting<br />
191
Intensity (arb. units)<br />
Appendix B: Additional figures<br />
Fe-Mc<br />
Fe-Hc<br />
P<br />
Fe-Mc<br />
Fe-Hc<br />
APPENDIX<br />
10 15 20<br />
2CuK<br />
25 30<br />
R<br />
P C<br />
1 years<br />
120 days<br />
28 days<br />
7 days<br />
Appendix B1 XRD pattern of Fe-Mc synthesized at 50°C, P:portlandite, C:calcite<br />
Weight loss in %<br />
differentiated relative weight<br />
100<br />
90<br />
80<br />
70<br />
60<br />
-0.1<br />
-0.2<br />
-0.3<br />
-0.4<br />
Fe-Mc<br />
Fe-Mc<br />
200 400<br />
Temperature °C<br />
600 800<br />
Appendix B2 Thermal analysis (TGA and DTG) of Fe-Mc at 50°C<br />
P<br />
C<br />
120 days<br />
1 year<br />
192
Intensity (arb. Units)<br />
P<br />
Fe 2O 3<br />
R<br />
C<br />
P<br />
20 30<br />
2 CuK<br />
APPENDIX<br />
P<br />
1 year<br />
120 days<br />
28 days<br />
Appendix B3 XRD pattern of Fe-Mc synthesized at 80°C<br />
Weight loss in %<br />
differentiated relative weight<br />
100<br />
90<br />
80<br />
70<br />
60<br />
-0.1<br />
-0.2<br />
-0.3<br />
-0.4<br />
P<br />
7 days<br />
1 year<br />
200 400 600 800<br />
Temperature °C<br />
C<br />
120 days<br />
Appendix B4 Thermal analysis (TGA and DTG) of Fe-Mc formation at 50°C<br />
193
Intensity [arb. units]<br />
Fe-MS<br />
C 2F<br />
P<br />
APPENDIX<br />
Fe-MS<br />
Fe-MS<br />
8 13 18 23 28 33<br />
2θCuKα<br />
Appendix B5 XRD pattern of Fe-Ms synthesized at 50°C<br />
Intensity [arb. units]<br />
Fe-Ms<br />
P<br />
Fe-Ms<br />
C 2F<br />
P<br />
Fe-MS<br />
8 13 18 23 28 33<br />
2θCuKα<br />
Fe 2O 3<br />
Appendix B6 XRD pattern of Fe-Ms synthesized at 80°C<br />
P<br />
P<br />
Fe 2O 3<br />
P<br />
C 2F<br />
360 days<br />
120 days<br />
28 days<br />
7 days<br />
360days<br />
120 days<br />
28 days<br />
7 days<br />
194
APPENDIX<br />
Appendix B7 XRD patterns of Fe-Friedel’s salt formed at 20°C and sampled after 500 days<br />
equilibration times synthesized from C2F, CaCl2.2H2O and CaO in 0.1 M KOH<br />
Appendix B8 TGA-DTG curves of Fe-Friedel’s salt formed at 20°C and sampled after 500 days<br />
equilibration times synthesized from C2F, CaCl2.2H2O, and CaO in 0.1 M KOH<br />
195
(Al+Fe)/Ca<br />
0.7<br />
0.6<br />
0.5<br />
0.4<br />
0.3<br />
0.2<br />
0.1<br />
0<br />
Hg<br />
AFm<br />
CH<br />
Si‐Hg<br />
C‐S‐H<br />
APPENDIX<br />
0 0.2 0.4 0.6 0.8 1<br />
Si/Ca<br />
Appendix B9 Atomic ratio of 50 years old hydrated cement before selective dissolution. The<br />
0.8<br />
0.6<br />
a<br />
0.4<br />
F<br />
e<br />
)/C<br />
l+<br />
(A<br />
0.2<br />
0<br />
cement is composed of 64.5%of C3S, 10%C2S, 12.1%C3A, 3.2%CaSO4, 0.4CaO,<br />
0.8MgO, 0.08%Na2O, 0.2K2O, 0.27%TiO2. Note that this old samples obtained<br />
from Taylor.<br />
Ca 3Al 0.8Fe 0.7Si 0.98O 5<br />
0 0.1 0.2 0.3 0.4 0.5 0.6<br />
Si/Ca<br />
Appendix B10 Atomic ratio of 50 years old hydrated cement after selective dissolution SAM<br />
196
REFERENCES<br />
REFRENCES<br />
[1] H.F.W. Taylor, Cement Chemistry, Thomas Telford Publishing, London (1997).<br />
[2] H.J. Kuzel, H. Pöllmann, Hydration of C3A in the presence of Ca(OH)2, CaSO4·2H2O<br />
and CaCO3, Cement and Concrete Research, 21 (1991) 885-895.<br />
[3] B. Lothenbach, T. Matschei, G. Möschner, F.P. Glasser, Thermodynamic modelling<br />
of the effect of temperature on the hydration and porosity of Portland cement, Cement<br />
and Concrete Research, 38 (2008) 1-18.<br />
[4] B. Lothenbach, E. Wieland, A thermodynamic approach to the hydration of sulphateresisting<br />
Portland cement, Waste Management, 26 (2006) 706-719.<br />
[5] D.P. Bentz, Influence of alkalis on porosity percolation in hydrating cement pastes,<br />
Cement and Concrete Composites, 28 (2006) 427-431.<br />
[6] B. Lothenbach, F. Winnefeld, Thermodynamic modelling of the hydration of Portland<br />
cement, Cement and Concrete Research, 36 (2006) 209-226.<br />
[7] T. Matschei, B. Lothenbach, F.P. Glasser, Thermodynamic properties of Portland<br />
cement hydrates in the system CaO-Al2O3-SiO2-CaSO4-CaCO3-H2O, Cement and<br />
Concrete Research, 37 (2007) 1379-1410.<br />
[8] K. Scrivener, P.L. Pratt, Cerma proc 35 (1984) 207.<br />
[9] K.L. Scrivener, T. Füllmann, E. Gallucci, G. Walenta, E. Bermejo, Quantitative study<br />
of Portland cement hydration by X-ray diffraction/Rietveld analysis and independent<br />
methods, Cement and Concrete Research, 34 (2004) 1541-1547.<br />
[10] L. Black, C. Breen, J. Yarwood, J. Phipps, G. Maitland, In situ Raman analysis of<br />
hydrating C3A and C4AF pastes in presence and absence of sulphate, Advances in<br />
Applied Ceramics, 105 (2006) 209-216.<br />
[11] M. Collepardi, S. Monosi, G. Moriconi, M. Corradi, Tetracalcium aluminoferrite<br />
hydration in the presence of lime and gypsum, Cement and Concrete Research, 9 (1979)<br />
431-437.<br />
[12] M. Ecker, Diadochiebeziehungen in Calciumaluminatferraten und deren<br />
Hydratationsprodukten, PhD thesis, Hallesches Jahrbuch für Geowissenschaften, Reihe<br />
B, Martin-Luther-Universität Halle-Wittenberg, (1998).<br />
[13] A. Emanuelson, S. Hansen, Distribution of iron among ferrite hydrates, Cement and<br />
Concrete Research, 27 (1997) 1167-1177.<br />
[14] N. Meller, C. Hall, A.C. Jupe, Colston, S.L., S.D.M. Jacques, P. Barnes, J. Phipps,<br />
The paste hydration of brownmillerite with and without gypsum: a time resolved<br />
synchrotron diffraction study at 30, 70, 100 and 150 °C, Journal of Materials Chemistry,<br />
14 (2004) 428-435.<br />
197
REFRENCES<br />
[15] G. Möschner, B. Lothenbach, J. Rose, A. Ulrich, R. Figi, R. Kretzschmar, Solubility<br />
of Fe-ettringite (Ca6[Fe(OH)6]2(SO4)3 · 26H2O), Geochimica et Cosmochimica Acta, 72<br />
(2008) 1-18.<br />
[16] G. Möschner, B. Lothenbach, A. Ulrich, R. Figi, R. Kretschmar, Solid solution<br />
between Al-ettringite and Fe-ettringite (Ca6[Al1-xFex(OH)6]2(SO4)3 . 26H2O), Cement and<br />
Concrete Research, 39 (2009) 482-489.<br />
[17] W. Schwarz, Novel cement matrices by accelerated hydration of the ferrite phase in<br />
Portland cement via chemical activation: kinetics and cementitious properties, Advn Cem<br />
Bas Mat, 2 (1995) 189-200.<br />
[18] P.W. Brown, Early hydration of tetracalcium aluminoferrite in gypsum and lime–<br />
gypsum solutions., Journal of the American Ceramic Society, 70 (1987) 493–496.<br />
[19] B.Z. <strong>Dilnesa</strong>, B. Lothenbach, G. Le Saout, G. Renaudin, A. Mesbah, Y. Filinchuk,<br />
A. Wichser, E. Wieland, Iron in carbonate containing AFm phases, Cement and Concrete<br />
Research, 41 (2011) 311-323.<br />
[20] M. Fukuhara, S. Goto, K. Asaga, M. Daimon, R. Kondo, Mechanisms and kinetics<br />
of C4AF hydration with gypsum, Cement and Concrete Research, 11 (1981) 407-414.<br />
[21] N.C. Collier, N.B. Milestone, J. Hill, I.H. Godfrey, The disposal of radioactive ferric<br />
floc, Waste Management, 26 (2006) 769-775.<br />
[22] R.S. Gollop, H.F.W. Taylor, Microstructural and microanalytical studies of sulfate<br />
attack. II. Sulfate-resisting Portland cement: Ferrite composition and hydration chemistry,<br />
Cement and Concrete Research, 24 (1994) 1347-1358.<br />
[23] M. Paul, F.P. Glasser, Impact of prolonged warm (85°C) moist cure on Portland<br />
cement paste, Cement and Concrete Research, 30 (2000) 1869-1877.<br />
[24] K.S. Harchand, Vishwamittar, K. Chandra, Infrared and Mössbauer study of two<br />
Indian cement, Cement and Concrete Research, 10 (1980) 243-252.<br />
[25] F. Jalilehvand, X-ray Absorption Spectroscopy. University of Calgary.<br />
(http://www.chem.ucalgary.ca/research/groups/faridehj/xas.pdf) Accessed June 1,2009.<br />
[26] M. Newville, Fundamentals of XAFS, Consortium for advanced radiation sources<br />
University of Chicago, IL, (2004).<br />
[27] A. Manceau;, M.A. Marcus;, N. Tamura;, Quantitative speciation of heavy metals in<br />
soils and sediments by synchrotron X-ray techniques, Reviews in Mineralogy and<br />
Geochemistry, 49 (2002) 341-428.<br />
[28] A.M. Scheidegger, M. Vespa, D. Grolimund, E. Wieland, M. Harfouche, I.<br />
Bonhoure, R. Dähn, The use of (micro)-X-ray absorption spectroscopy in cement<br />
research, Waste Management, 26 (2006) 699-705.<br />
198
REFRENCES<br />
[29] M. Vespa, R. Dähn, T.E. Gallucci, D. Grolimund, E. Wieland, A.M. Scheidegger,<br />
Microscale investigations of Ni uptake by cement using a combination of scanning<br />
electron microscopy and synchrotron-based techniques, Environmental Science and<br />
Technology, 40 (2006) 7702-7709.<br />
[30] E. Wieland, R. Dähn, M. Vespa, B. Lothenbach, Micro-spectroscopic investigation<br />
of Al and S speciation in hardened cement paste, Cement and Concrete Research, 40<br />
(2010) 885-891.<br />
[31] G. Möschner, A thermodynamic approach to cement hydration: the role of retarding<br />
admixtures and Fe-minerals during the hydration of cements, PhD thesis, ETH Zürich,<br />
(2007).<br />
[32] A.N. Christensen, T.R. Jensen, J.C. Hanson, Formation of ettringite,<br />
Ca6Al2(SO4)3(OH)12·26H2O, AFt, and monosulfate, Ca4Al2O6(SO4)·14H2O, AFm-14, in<br />
hydrothermal hydration of Portland cement and of calcium aluminum oxide—calcium<br />
sulfate dihydrate mixtures studied by in situ synchrotron X-ray powder diffraction,<br />
Journal of Solid State Chemistry, 177 (2004) 1944-1951.<br />
[33] E. Gallucci, P. Mathur, K. Scrivener, Microstructural development of early age<br />
hydration shells around cement grains, Cement and Concrete Research, 40 (2010) 4-13.<br />
[34] K.S. Harchand, R. Kumar, K. Chandra, Vishwamittar, Mössbauer and X-ray<br />
investigations of some portland cements, Cement and Concrete Research, 14 (1984) 170-<br />
176.<br />
[35] H.F.W. Taylor, D.E. Newbury, An electron microprobe study of a mature cement<br />
paste, Cement and Concrete Research, 14 (1984) 565-573.<br />
[36] A.P. Hammersley, S.O. Svensson, M. Hanfland, A.N. Fitch, D. Hausermann, Twodimensional<br />
detector software: From real detector to idealised image or two-theta scan,<br />
High Pressure Research: An International Journal, 14 (1996) 235 - 248.<br />
[37] G. Le Saout, E. Lécolier, A. Rivereau, H. Zanni, Chemical structure of cement aged<br />
at normal and elevated temperatures and pressures: Part I. Class G oilwell cement,<br />
Cement and Concrete Research, 36 (2006) 71-78.<br />
[38] M. Neville, IFEFFIT: interactive EXAFS analysis and FEFF fitting, J Synchrotron<br />
Radiat 8(2005) 322–324.<br />
[39] B. Ravel, M. Neville, ATHENA, ARTEMIS, HEPHAESTUS: data analysis for Xray<br />
absorption spectroscopy using IFEFFIT, Journal of Synchrotron Radiation, 12 (2005)<br />
537-541.<br />
[40] M.A. Marcus, A.A. MacDowell, R. Celestre, A. Manceau, T. Miller, H.A. Padmore,<br />
R.E. Sublett, Beamline 10.3.2 at ALS: A hard X-ray microprobe for environmental and<br />
materials sciences, Journal of Synchrotron Radiation, 11 (2004) 239-247.<br />
199
REFRENCES<br />
[41] T. Ressler, J. Wong, J. Roos, I.L. Smith, Quantitative speciation of mn-bearing<br />
particulates emitted from autos burning (methylcyclopentadienyl) manganese tricarbonyladded<br />
gasolines using XANES spectroscopy, Environmental Science and Technology, 34<br />
(2000) 950-958.<br />
[42] E.R. Malinowski, Determination of number of factors and expermental error in a<br />
data matrix, Anal chem, 49 (1977) 612-617.<br />
[43] D.A. Kulik, GEMS-PSI 23, PSI Villigen, Switzerland; available at<br />
http://les.web.psi.ch/Software/GEMS-PSI/index.html, (2009).<br />
[44] W. Hummel, U. Berner, E. Curti, F.J. Pearson, T. Thoenen, Nagra/PSI Chemical<br />
Thermodynamic Data Base 01/0, Universal Publishers/uPublishcom, Parkland, Florida,<br />
(2002).<br />
[45] T. Thoenen, D.A. Kulik, Nagra/PSI Chemical Thermodynamic Data Base 01/01 for<br />
the GEM-Selektor (V.2- PSI) Geochemical Modeling Code: Release 28-02-03. Internal<br />
Report TM-44-03-04, Available from: http://leswebpsich/software/GEMS-<br />
PSI/thermodata/indexhtml 2003.<br />
[46] J. Ederova, V. Satava, Heat capacities of C3AH6, C4ASH12 and C3AS3H32, ,<br />
Thermochim Acta, 31 (1979) 126-128.<br />
[47] G.M. Anderson, D.A. Crerar, Thermodynamics in Geochemistry: the Equilibrium<br />
Model, Oxford University Press, Oxford, 1993.<br />
[48] H.C. Helgeson, J.M. Delany, H.W. Nesbitt, D.K. Bird, Summary and critique of the<br />
thermodynamic properties of rock forming minerals, American Journal of Science,, 278-<br />
A (1978) 229.<br />
[49] D.A. Kulik, Thermodynamic properties of surface species at the mineral-water<br />
interface under hydrothermal conditions: a Gibbs energy minimization single-site 2pKA<br />
triple-layer model of rutile in NaCl electrolyte to 250°C, Geochimica et Cosmochimica<br />
Acta, 64 (2000) 3161-3179.<br />
[50] D.A. Kulik, Minimising uncertainty induced by temperature extrapolations of<br />
thermodynamic data: A pragmatic view on the integration of thermodynamic databases<br />
into geochemical computer codes. The use of thermodynamic databases in performance<br />
assessment. OECD, Paris, Barcelona, Spain., (2002).<br />
[51] D. Damidot, B. Lothenbach, D. Herfort, F.P. Glasser, Thermodynamics and cement<br />
science, Cement and Concrete Research, 41 (2011) 679-695.<br />
[52] T. Matschei, B. Lothenbach, F.P. Glasser, The AFm phase in Portland cement,<br />
Cement and Concrete Research, 37 (2007) 118-130.<br />
[53] D. Kulik, GEMS-PSI 2.1, in, available at http://les.web.psi.ch/Software/GEMS-PSI/,<br />
PSI-Villigen, Switzerland, 2006.<br />
200
REFRENCES<br />
[54] M. Balonis, B. Lothenbach, G. Le Saout, F.P. Glasser, Impact of chloride on the<br />
mineralogy of hydrated Portland cement systems, Cement and Concrete Research, 40<br />
(2010) 1009-1022.<br />
[55] D.A. Kulik, M. Kersten, Aqueous solubility diagrams for cementitious waste<br />
stabilization systems: II, End-member stoichiometries of ideal calcium silicates hydrate<br />
solid solutions, Journal of the American Ceramic Society, 84 (2001) 3017-3026.<br />
[56] D.E. Macphee, S.J. Barnett, Solution properties of solids in the ettringite-thaumasite<br />
solid solution series, Cement and Concrete Research, 34 (2004) 1591-1598.<br />
[57] J. Bruno, D. Bosbach, D. Kulik, A. Navrotsky, Chemical Thermodynamics Vol. 10.<br />
Chemical Thermodynamics of Solid Solutions of Interest in Nuclear Waste Management,<br />
North Holland Elsevier Science Publishers B.V., Amsterdam, The Netherlands, 2007.<br />
[58] E. Curti, Coprecipitation of radionuclides with calcite: estimation of partition<br />
coefficients based on a review of laboratory investigations and geochemical data, Applied<br />
Geochemistry, 14 (1999) 433-445.<br />
[59] P.D. Glynn, MBSSAS: A code for the computation of Margules parameters and<br />
equilibrium relations in binary solid-solution aqueous-solution systems, Computers and<br />
Geoscience, 17 (1991) 907-966.<br />
[60] O. Redlich, A.T. Kister, Algebraic representation of the thermodynamic properties<br />
and the classification of solutions, Ind Eng Chem, 40 (1948) 345-348.<br />
[61] S.M. Leisinger, B. Lothenbach, G. Le Saout, C.A. Johnson, Thermodynamic<br />
modeling of solid solutions between monosulfate and monochromate 3CaO • Al2O3 •<br />
Ca[(CrO4)x(SO4)1-x] • nH2O, Cement and Concrete Research in press, (2011).<br />
[62] S.M. Leisinger, B. Lothenbach, G.L. Saout, R. Kägi, B. Wehrli, C.A. Johnson, Solid<br />
Solutions between CrO4- and SO4-Ettringite Ca6(Al(OH)6)2[(CrO4)x(SO4)1-x]3*26 H2O,<br />
Environmental Science & Technology, 44 (2010) 8983-8988.<br />
[63] T. Matschei, Thermodynamics of Cement Hydration, University of Aberdeen,<br />
(2007).<br />
[64] L.J. Parrot, D.C. Killoh, PREDICTION OF CEMENT HYDRATION, in, 1984, pp.<br />
41-53.<br />
[65] B. Lothenbach, G. Le Saout, E. Gallucci, K. Scrivener, Influence of limestone on the<br />
hydration of Portland cements, Cement and Concrete Research, 38 (2008) 848-860.<br />
[66] M. François, G. Renaudin, O. Evrard, A cementitious compound with composition<br />
3CaO.Al2O3.CaCO3.11H2O, Acta Crystallographica Section C: Crystal Structure<br />
Communications, 54 (1998) 1214-1217.<br />
[67] T. Matschei, B. Lothenbach, F.P. Glasser, The role of calcium carbonate in cement<br />
hydration, Cement and Concrete Research, 37 (2007) 551-558.<br />
201
REFRENCES<br />
[68] F.P. Glasser, A. Kindness, S.A. Stronach, Stability and solubility relationships in<br />
AFm phases: Part I. Chloride, sulfate and hydroxide, Cement and Concrete Research, 29<br />
(1999) 861-866.<br />
[69] H. Poellmann, Solid solution in the system 3CaO·Al2O3·CaSO4·aq–<br />
3CaO·Al2O3·Ca(OH)2·aq, Neues Jahrbuch fur Mineralogie, Abhandlungen 161 (1989)<br />
27-41.<br />
[70] M. Ecker, H.J. Pöllmann, Synthesis and characterisation of CO3-containing Ca-Al-<br />
Fe-hydrates, International symposium of chemistry of cement, Göthborg, (1997) 2ii032.<br />
[71] R. Fischer, H.J. Kuzel, Reinvestigation of the system C4A.nH2O-C4A.CO2.nH2O,<br />
Cement and Concrete Research, 12 (1982) 517-526.<br />
[72] D. Damidot, S. Stronach, A. Kindness, M. Atkins, F.P. Glasser, Thermodynamic<br />
investigation of the CaO-Al2O3-CaCO3-H2O closed system at 25°C and the influence of<br />
Na2O, Cement and Concrete Research, 24 (1994) 563-572.<br />
[73] H. Pöllmann, Die Kristallchemie der Neubildungen bei Einwirkung von<br />
Schadstoffen auf hydrauliche Bindemittel, PhD thesis, Erlangen-Nürnberg, (1984).<br />
[74] J.P. Rapin, G. Renaudin, E. Elkaim, M. Francois, Structural transition of Friedel's<br />
salt 3CaO·Al2O3·CaCl2·10H2O studied by synchrotron powder diffraction, Cement and<br />
Concrete Research, 32 (2002) 513-519.<br />
[75] G. Renaudin, F. Kubel, J.P. Rivera, M. Francois, Structural phase transition and high<br />
temperature phase structure of Friedels salt, 3CaO · Al2O3 · CaCl2 · 10H2O, Cement and<br />
Concrete Research, 29 (1999) 1937-1942.<br />
[76] G. Renaudin, M. Francois, O. Evrard, Order and disorder in the lamellar hydrated<br />
tetracalcium monocarboaluminate compound, Cement and Concrete Research, 29 (1999)<br />
63-69.<br />
[77] J. Rose, A. Bénard, S. El Mrabet, A. Masion, I. Moulin, V. Briois, L. Olivi, J.Y.<br />
Bottero, Evolution of iron speciation during hydration of C4AF, Waste Management, 26<br />
(2006) 720-724.<br />
[78] A. Mesbah, C. Cau-dit-Coumes, F. Frizon, F. Leroux, J. Ravaux, G. Renaudin, A<br />
new investigation of the Cl − –CO3 2− substitution in AFm phases, Journal of the American<br />
Ceramic Society, 94 (2011) 1901-1910.<br />
[79] G. Renaudin, R. Segni, D. Mentel, J.-M. Nedelec, F. Leroux, C. Taviot-Gueho, A<br />
raman study of the sulfated cement hydrates: ettringite and monosulfoaluminate, Journal<br />
of Advanced Concrete Technology, 5 (2007) 299-312.<br />
[80] G. Renaudin, J.P. Rapin, B. Humbert, M. François, Thermal behaviour of the<br />
nitrated AFm phase Ca4Al2(OH)12(NO3)2 - 4H2O and structure determination of the<br />
intermediate hydrate Ca4Al2(OH)12(NO3)2 - 2H2O, Cement and Concrete Research, 30<br />
(2000) 307-314.<br />
202
REFRENCES<br />
[81] H.F.W. Taylor, Crystal structures of some double hydroxide minerals, Min Mag, 39<br />
(1973) 377-389.<br />
[82] A.F. Hollemann, E. Wiberg, Lehrbuch der anorganischen Chemie. de Gruyter,<br />
Berlin, (1985).<br />
[83] M.A. Trezza, A.E. Lavat, Analysis of the system 3CaO.Al2O3-CaSO4.2H2O-CaCO3-<br />
H2O by FT-IR spectroscopy, Cement and Concrete Research, 31 (2001) 869-872.<br />
[84] J. Neubauer, F. Götz-Neunhoeffer, D. Schmitt, M. Degenkolb, U. Holland, In-situ<br />
Untersuchung der frühen PZ-Hydratation., Internationale Baustofftagung (ibausi),<br />
Weimar, Germany, 16 (2006).<br />
[85] B.A. Clark, P.W. Brown, The formation of calcium sulfoaluminate hydrate<br />
compounds: Part II, Cement and Concrete Research, 30 (2000) 233-240.<br />
[86] J. Plank, D. Zhimin, H. Keller, F.v. Hössle, W. Seidl, Fundamental mechanisms for<br />
polycarboxylate intercalation into C3A hydrate phases and the role of sulfate present in<br />
cement, Cement and Concrete Research, 40 (2010) 45-57.<br />
[87] R. Allman, Refinement of the hydrid layer structure Ca2Al(OH)6.1/2SO4.3H2O,<br />
Neues Jahrbuch fur Mineralogie Monatshefte, 217 (1977) 136-144.<br />
[88] H.J. Kuzel, Ersatz von Al 3+ durch Cr 3+ und Fe 3+ in 3CaO.Al2O3.CaCl2.nH2O und<br />
3CaO.Al2O3.CaSO4.nH2O Zem-Kalk-Gips 21 (1968) 493.<br />
[89] W. Dosch, H. Zur Strassen, Untersuchungen in den Alkali enthaltenen Systemen,<br />
gebildet aus den Komponenten CaO, Al2O3, Fe2O3, SiO2, SO3, Na2O, K2O H2O,<br />
Dissertation University of Mainz: Mainz (GER), (1962).<br />
[90] A. Mesbah, M. François, C. Cau-dit-Coumes, F. Frizon, Y. Filinchuk, F. Leroux, J.<br />
Ravaux, G. Renaudin, Crystal structure of Kuzel's salt<br />
3CaO·Al2O3·1/2CaSO4·1/2CaCl2·11H2O determined by synchrotron powder diffraction,<br />
Cement and Concrete Research, 41 (2011) 504-509.<br />
[91] P. Blanc, X. Bourbon, A. Lassin, E.C. Gaucher, Chemical model for cement-based<br />
materials: Thermodynamic data assessment for phases other than C-S-H, Cement and<br />
Concrete Research, 40 (2010) 1360-1374.<br />
[92] F.E. Jones, The quaternary system CaO-Al2O3-CaSO4-H2O at 25 °C Journal of<br />
Physical Chemistry 48 (1944) 311-350.<br />
[93] F. Zhang, Z. Zhou, Z. Lou, Solubility product and stability of ettringite, Proceedings<br />
of the 7th Intern Congress on the Chemistry of Cement vol (II), (1980) 88-93.<br />
[94] U.A. Birnin-Yauri, F.P. Glasser, Friedel's salt, Ca2Al(OH)6(Cl,OH)·2HO: its solid<br />
solutions and their role in chloride binding, Cement and Concrete Research, 28 (1998)<br />
1713-1723.<br />
203
REFRENCES<br />
[95] J. Csizmadia, G. Balázs, F.D. Tamás, Chloride ion binding capacity of<br />
aluminoferrites, Cement and Concrete Research, 31 (2001) 577-588.<br />
[96] I. Rousselot, C. Taviot-Guého, F. Leroux, P. Léone, P. Palvadeau, J.-P. Besse,<br />
Insights on the Structural Chemistry of Hydrocalumite and Hydrotalcite-like Materials:<br />
Investigation of the Series Ca2M 3+ (OH)6Cl·2H2O (M 3+ : Al 3+ , Ga 3+ , Fe 3+ , and Sc 3+ ) by X-<br />
Ray Powder Diffraction, Journal of Solid State Chemistry, 167 (2002) 137-144.<br />
[97] F. Götz-Neunhoeffer, H. Poellmann, Synthesis and mineralogical characterization of<br />
calcium ferrate hydrates and their application as reservoir minerals in waste dumps,<br />
Applied Mineralogy in Research, Economy, Technology, Ecology and Culture, D<br />
Rammlmair et al (ed), 2 (2000) 551-555.<br />
[98] H.J. Kuzel, X-ray investigation of some complex calcium aluminate hydrates and<br />
related compounds, 5th International Symposium on the Chemistry of Cements, II-9<br />
Tokyo, (1968) 92-97.<br />
[99] J.-P. Rapin, Synthèse et étude cristallochimique de quelques aluminates et ferrites<br />
calciques hydratés de formule [Ca2M(OH)6] + , [X, nH2O] - avec X =Cl, Br, l, CI04, 1/2<br />
CO3 1/2 CrO4 et 1/2 SO4 et M =Al et Fe, PhD thesis, Nancy, (2001).<br />
[100] F. Götz-Neunhoeffer, Synthese und mineralogische Charakterisierung von<br />
Calciumferrathydraten-Speicherminerale für die Anwendung in Reststoffdeponien, PhD<br />
thesis, Erlangen, (1996).<br />
[101] C. Abate, B.E. Scheetz, Aqueous Phase Equilibria in the System CaO-Al2O3-<br />
CaCl2-H2O: The Significance and Stability of Friedel's Salt, Journal of the American<br />
Ceramic Society, 78 (1995) 939-944.<br />
[102] J.V. Bothe Jr, P.W. Brown, PhreeqC modeling of Friedel's salt equilibria at 23±1<br />
°C, Cement and Concrete Research, 34 (2004) 1057-1063.<br />
[103] M. Hobbs, Solubilities and ion exchange properties of solid solutions between the<br />
OH, Cl and CO3 end members of the monocalcium aluminate hydrates, PhD-Thesis,<br />
University of Waterloo, Canada, (2001).<br />
[104] N.C. Collier, N.B. Milestone, J. Hill, I.H. Godfrey, Immobilisation of Fe floc: Part<br />
2, encapsulation of floc in composite cement, Journal of Nuclear Materials, 393 (2009)<br />
92-101.<br />
[105] N. Neuville, E. Lécolier, G. Aouad, A. Rivereau, D. Damidot, Effect of curing<br />
conditions on oilwell cement paste behaviour during leaching: Experimental and<br />
modelling approaches, Comptes Rendus Chimie, 12 511-520.<br />
[106] O. Ferro, E. Galli, G. Papp, S. Quartieri, S. Szakall, G. Vezzalini, A new<br />
occurrence of katoite and re-examination of the hydrogrossular group, Eur J Mineral, 15<br />
(2003) 419-426.<br />
204
REFRENCES<br />
[107] K. Kyritsis, N. Meller, C. Hall, Chemistry and morphology of hydrogarnets formed<br />
in cement-based CASH hydroceramics cured at 200° to 350°C, Journal of the American<br />
Ceramic Society, 92 (2009) 1105-1111.<br />
[108] P. Barnes, J. Bensted, Structure and performance of cements, Spon press, London,<br />
(2002) 114-139.<br />
[109] E. Passaglia, R. Rinlnald, Katoite, a new member of the Ca3Al2(SiO4)3-<br />
Ca3Al2(OH)12 series and a new nomenclature for the hydrogrossular group of minerals,<br />
Bull Minéral, 107 (1984) 605-618.<br />
[110] T.G. Jappy, F.P. Glasser, Synthesis and stability of silica substituted hydrogarnet,<br />
Ca3Al2Si3-xO12-4x(OH)4x, Adv Cem Res, 4 (1991) 1-8.<br />
[111] M. Atkins, F.P. Glasser, A. Kindness, D.E. Macphee, Solubility data for cement<br />
hydrate phases (25 °C), DOE Report No: DoE/HMIP/RR/91/032,University of Aberdeen,<br />
(1991).<br />
[112] D.G. Bennett, D. Read, M. Atkins, F.P. Glasser, A thermodynamic model for<br />
blended cements. II: Cement hydrate phases; thermodynamic values and modelling<br />
studies, Journal of Nuclear Materials, 190 (1992) 315-325.<br />
[113] F.G. Butler, H.F.W. Taylor, The system CaO–Al2O3–H2O at 5 °C, Journal of the<br />
Chemical Society, (1958) 2103–2110.<br />
[114] E.T. Carlson, The system lime-Alumina-water at 1 °C, Journal of Research of the<br />
National Bureau of Standards, 16 (1958) 1-11.<br />
[115] R.B. Peppler, L.S. Wells, The system of lime, alumina, water from 50° to 250 ° C,<br />
J Res Natl Bur Stand, 52 (1954) 75-92.<br />
[116] L.S. Wells, W.F. Clarke, H.F. McMurdie, Study of the system CaO–Al2O3–H2O at<br />
temperatures of 21° and 90 °C, Journal of Research of the National Bureau of Standards,<br />
(1943) 367–407.<br />
[117] M. Atkins, D.G. Bennett, A.C. Dawes, F.P. Glasser, A. Kindness, D. Read, A<br />
thermodynamic model for blended cements, Cement and Concrete Research, 22 (1992)<br />
497-502.<br />
[118] V.J. Babushkin, G.M. Matveyev, O.P. Mchedlov-Petrossyan, Thermodynamics of<br />
Silicates. Springer-Verlag, Berlin, H, (1985).<br />
[119] D.E. Rogers, L.P. Aldridge, Hydrates of calcium ferrites and calcium<br />
aluminoferrites, Cement and Concrete Research, 7 (1977) 399-409.<br />
[120] E.P. Flint, H.F. McMurdie, L.S. Wells, Hydrothermal and X-Ray Studies of the<br />
Garnet-Hydrogarnet Series and Relationship of the Series to Hydration Products of<br />
Portland Cement, Jour Res Nat Bur Stand, 26 (1941) 13–33.<br />
205
REFRENCES<br />
[121] R.A. Robie, B.S Hemingway, Thermodynamic properties of minerals and related<br />
substances at 298.15 K and 1 bar (105 Pascals) pressures and at higher temperatures, US<br />
Geol Surv Bull, 2131 (1995) 461.<br />
[122] D. Sverjensky, E. Shock, H. Helgeson, Prediction of the thermodynamic properties<br />
of aqueous metal complexes to 1000 C and 5 kb, Geochimica et Cosmochimica Acta, 61<br />
(1997) 1359-1412.<br />
[123] J. Johnson, E. Oelkers, H. Helgeson, SUPCRT92: A software package for<br />
calculating the standard molal thermodynamic properties of minerals, gases, aqueous<br />
species, and reactions from 1 to 5000 bars and 0 to 1000 C, Computers & Geosciences,<br />
(1992) 899-947.<br />
[124] E. Shock, D. Sassani, M. Willis, D. Sverjensky, Inorganic species in geologic<br />
fluids: Correlations among standard molal thermodynamic properties of aqueous ions and<br />
hydroxide complexes, Geochimica et Cosmochimica Acta, 61 (1997) 907-950.<br />
[125] E.L. Shock, Database from E.L.Shock's GEOPIG web site<br />
http://epsc.wustl.edu/geopig (see references on Page 2) Imported into GEMS-PSI<br />
database on 10 Jan 2003 (KD44, BU44, TT44) Washington Univ St Louis MO, (1998).<br />
[126] C. Cohen-Addad, Etude du compose Ca3Fe2(SiO4)1.15(OH)7.4 par absorption<br />
infrarouge et diffraction des rayons X et des neutrons, Acta Crystallographica Section A,<br />
27 (1971) 68-70.<br />
[127] Jun Ito, Clifford Frondel, NEW SYNTHETIC HYDROGARNETS, THE<br />
AMERICAN MINERALOGIST,, 52 (1967).<br />
[128] O. Frank-Kamenetskaya, I. Rozhdestvenskaya, A. Shtukenberg, I. Bannova, Y.<br />
Skalkina, Dissymmetrization of crystal structures of grossular-andradite garnets Ca3(Al,<br />
Fe)2(SiO4)3, Structural Chemistry, 18 (2007) 493-503.<br />
[129] B.Z. <strong>Dilnesa</strong>, B. Lothenbach, G. Le Saout, G. Renaudin, A. Wichser, E. Wieland,<br />
Sytheisis and characterization of CaO-Al2O3-Fe2O3-SiO2-H2O, in preparation (2011a).<br />
[130] B.Z. <strong>Dilnesa</strong>, B. Lothenbach, G. Le Saout, G. Renaudin, A. Wichser, E. Wieland,<br />
Fe-containing AFm phases, in preparation, (2011b).<br />
[131] H. Michiaki, H. Yoshikazu, The reaction between aggregate and cement paste in<br />
autoclaved concrete, Bulletin of Engineering Geology and the Environment, 30 (1984)<br />
241-244.<br />
[132] R. Rinaldi, M. Sacerdoti, E. Passaglia, Strätlingite: crystal structure, chemistry, and<br />
a reexamination of its polytype vertumnite, European Journal of Mineralogy, 2 (1990)<br />
841-849<br />
[133] P.A. O'Day, N. Rivera, Jr., R. Root, S.A. Carroll, X-ray absorption spectroscopic<br />
study of Fe reference compounds for the analysis of natural sediments, American<br />
Mineralogist, 89 (2004) 572-585.<br />
206
REFRENCES<br />
[134] M. Wilke, F. Farges, P.-E. Petit, G.E. Brown, Jr., F. Martin, Oxidation state and<br />
coordination of Fe in minerals: An Fe K-XANES spectroscopic study, American<br />
Mineralogist, 86 (2001) 714-730.<br />
[135] B. Lothenbach, F. Winnefeld, C. Alder, E. Wieland, P. Lunk, Effect of temperature<br />
on the pore solution, microstructure and hydration products of Portland cement pastes,<br />
Cement and Concrete Research, 37 (2007) 483-491.<br />
[136] M.B. Haha, B. Lothenbach, G. Le Saout, F. Winnefeld, Influence of slag chemistry<br />
on the hydration of alkali-activated blast-furnace slag — Part II: Effect of Al2O3, Cement<br />
and Concrete Research.<br />
[137] K. Rozov, U. Berner, C. Taviot-Gueho, F. Leroux, G. Renaudin, D. Kulik, L.W.<br />
Diamond, Synthesis and characterization of the LDH hydrotalcite-pyroaurite solidsolution<br />
series, Cement and Concrete Research, 40 (2010) 1248-1254.<br />
[138] H. Minard, S. Garrault, L. Regnaud, A. Nonat, Mechanisms and parameters<br />
controlling the tricalcium aluminate reactivity in the presence of gypsum, Cement and<br />
Concrete Research, 37 (2007) 1418-1426.<br />
[139] S. Gunay, S. Garrault, A. Nonat, P. Termkhajornkit, Influnce of calcium sulphate<br />
on hydration and mechanical strength of tricalcium silicate, International congress on the<br />
chemistry of cement (ICCC), (2011).<br />
[140] V. Fernandez, A. Errien, G. Le Saout, K. Scrivener, Availability of Al2O3 in<br />
Blended Cements, Proc Final Conference Marie Curie Research Training Network,<br />
Villars-sur-Ollon, Switzerland, (September 2009) 1-3.<br />
[141] I.G. Richardson, G.W. Groves, The incorporation of minor and trace elements into<br />
calcium silicate hydrate (C-S-H) gel in hardened cement pastes, Cement and Concrete<br />
Research, 23 (1993) 131-138.<br />
[142] J. Skibsted, H.J. Jakobsen, C. Hall, Quantitative Aspects of 27Al MAS NMR of<br />
Calcium Aluminoferrites, Advanced Cement Based Materials, 7 (1998) 57-59.<br />
[143] L. Monteilhet, J.P. Korb, J. Mitchell, P.J. McDonald, Observation of exchange of<br />
micropore water in cement pastes by two-dimensional T_{2}-T_{2} nuclear magnetic<br />
resonance relaxometry, Physical Review E, 74 (2006) 061404.<br />
[144] P. Macdonald, personal communication, (2011).<br />
[145] F. Bertaut, P. Blum, A. Sagnières, La structure du ferrite dicalcique et de la<br />
brownmillerite, C R Hebd Seances Acad Sci, 244 (1957) 2944–2946.<br />
[146] A.L. Shaula, Y.V. Pivak, J.C. Waerenborgh, P. Gaczynski, A.A. Yaremchenko,<br />
V.V. Kharton, Solid Sate ionics, n°33-34 (2006) 2923-2930.<br />
207
REFRENCES<br />
[147] A. Szytuła, A. Burewicz, Ž. Dimitrijević, S. Kraśnicki, H. Rżany, J. Todorović, A.<br />
Wanic, W. Wolski, Neutron Diffraction Studies of α-FeOOH, physica status solidi (b), 26<br />
(1968) 429-434.<br />
[148] A. Moore, H.F.W. Taylor, Crystal Structure of Ettringite, Nature, 218 (1968) 1048-<br />
1049.<br />
[149] A. Olowe, Advances in X Ray Analysis, 39 (1998).<br />
208
CURRCULUM VITAE<br />
Curriculum Vitae<br />
Name : <strong>Belay</strong> <strong>Zeleke</strong> <strong>Dilnesa</strong><br />
Date of Birth : 23 January 1983<br />
Nationality : Ethiopian<br />
Marital status : Married<br />
Language : Amharic (mother tongue), English (Fluent),<br />
German (medium), Spanish (understand)<br />
Academic Qualification<br />
Doctoral study PhD study in Material science<br />
École polytechnique fédérale de Lausanne EPFL, Switzerland<br />
(Jun. 2008-Dec. 2011)<br />
Post Graduate study<br />
Master study in Chemical and Process Engineering<br />
Rovira I Virgili University, Spain<br />
(Oct. 12, 2006 – Jul., 2007)<br />
Undergraduate study Bachelor Degree in Chemistry<br />
Alemaya University, Ethiopia<br />
(Sep. 2000-Jul. 2004)<br />
Professional experience<br />
February 2008 – Current, Laboratory Concrete / Construction Chemistry <strong>Empa</strong><br />
(Swiss Federal Laboratories for Materials Science and Technology)<br />
PhD student and working on Hydration of cement and thermodynamic<br />
modeling<br />
October 2007 – January, 2008, Rovira I Virigili University, Department de<br />
Química Analítica i Quimica Orgànica, Spain<br />
Synthesis of epoxy resins for the application of thermosetting polymers<br />
August 2004 – August, 2006 Assistant Lecturer in Arba Minch University,<br />
Ethiopia in the Department of Applied Chemistry<br />
Computer skills<br />
Microsoft office, Origin<br />
Fortran program<br />
Hobbies<br />
Running<br />
Football
Publications<br />
CURRCULUM VITAE<br />
B.Z. <strong>Dilnesa</strong>, B. Lothenbach, G. Le Saout, G. Renaudin, A. Mesbah, Y. Filinchuk, A.<br />
Wichser and E. Wieland, Iron in carbonate containing AFm phases. Cement and Concrete<br />
Research, 2011. 41(3): p. 311-323.<br />
B.Z. <strong>Dilnesa</strong>, B. Lothenbach, A. Wichser and E. Wieland, Synthesis and characterization<br />
of CaO-Al2O3-Fe2O3-SiO2 system.. (in preparation)<br />
B.Z. <strong>Dilnesa</strong>, B. Lothenbach, G. Le Saout, G. Renaudin, A. Mesbah,, A. Wichser and E.<br />
Wieland, Stablity of monosulfate in the presence of iron.. (in preparation)<br />
B.Z. <strong>Dilnesa</strong>, B. Lothenbach, G. Le Saout, G. Renaudin, A. Mesbah,, A. Wichser and E.<br />
Wieland, Stablity of Fe-Friedel’s salt (in preparation)<br />
<strong>Dilnesa</strong>, B.Z., B. Lothenbach, E. Wieland, R. Dähn, and K.L. Scrivener. Identification of<br />
iron in hydrated cement. (in preparation)<br />
<strong>Dilnesa</strong>, B.Z., B. Lothenbach, E. Wieland, and K.L. Scrivener. Synthetic Fe-cement. (in<br />
preparation)<br />
Conference Proceedings<br />
<strong>Dilnesa</strong>, B.Z., B. Lothenbach, E. Wieland, R. Dähn, A.I. Wichser and K.L. Scrivener<br />
(2010) Preliminary investigation on the fate of iron during cement hydration, Proceedings<br />
of CONMOD 2010,Symposium on Concrete Modelling, Lausanne, Switzerland, 22 – 25<br />
June.<br />
<strong>Dilnesa</strong> B.Z., Lothenbach B., Le Saout G., Wieland E., Scrivener K.L.(2011) Fe-<br />
Containing Hydrates in Cementitious System. ICCC 13th Madrid, 3-8 July<br />
Wieland E., Dähn R., <strong>Dilnesa</strong> B.Z., Lothenbach B. (2011) Synchrotron-based micro<br />
spectroscopic investigations on Al, S, and Fe speciation in cementitious materials. ICCC<br />
13th Madrid, 3-8 July