May - Library
May - Library May - Library
acute failures; repair costs for these failures are frequently more expensive. Not only are direct costs higher (repairs may re q u i re more labour hours, specialist services or the costly expediting of spares), but the opportunity cost of lost production per failure is higher. With this in mind, we are now ready to answer the question as to which f a i l u res should be prioritizing in order to best improve business performance. 5. Downtime Priorities and the Business Cycle The discussion so far has assumed that the electrical failure s causing unplanned downtime of the shovel fleet are (i) evident to the operators and (ii) do not cause significant safety or enviro n m e n t a l h a z a rd. Hidden and potentially hazardous failure modes should be a d d ressed and can be identified by applying Reliability-Centre d Maintenance (RCM) decision logic such as that developed by Moubray (1997). Assuming that the hidden and hazardous failure modes have a l ready been filtered from the shovel electrical downtime data, maintenance priorities will be determined solely on the basis of the economic consequences of failures and their associated repair costs. The economic consequence of a failure includes the opportunity cost of lost production, the extension of fixed costs such as operator salaries which must be paid irrespective of equipment downtime, the cost of maintaining an increased number of spares as a result of the failure and the cost of maintaining redundant equipment capacity in order to mitigate the effects of lost production. In some industries, the economic consequences of plant or equipment downtime for critical equipment far outweigh repair and maintenance costs. For example, the mining industry is subject to highly cyclical commodity prices. With copper prices currently at fiveyear highs, the opportunity cost of lost production will significantly exceed the direct cost of repair and maintenance. In such c i rcumstances, it is desirable to prioritize production, hence equipment availability and reliability, over repair costs. H o w e v e r, when copper prices fall, the cost of production becomes m o re significant. Thus in commodity price troughs, controlling and reducing maintenance and repair costs will be as important as maintaining equipment availability and reliability. F i g u res 9 and 10 illustrate these two scenarios. Figure 9 c o rresponds to a scenario where the opportunity cost of lost production far exceeds shovel repair and maintenance costs. Figure 10 corresponds to the scenario of a commodity price squeeze causing production cost concern. For ease of construction, the availability limit has been defined as the line of constant downtime equal to the product of the two t h reshold limits calculated in equations (5) and (6). Note that the availability limit effectively separates the acute and chronic quadrants into two areas: acute A and B and chronic A and B respectively. The expression for the availability limit is: ni X MTTRi = D where 0 < ni < Limitn (9) Q ni = Limitn where ni > Limitn in the case of Figure 9 and: MTTRi = LimitMTTR ni X MTTRi = D Q where 0 < ni < Limitn where ni > Limitn (10) in the case of Figure 10. The resulting graphs have been christened “jack-knife” diagrams because of the inverted V shape of the limits. Because the analysis of unplanned shovel downtime due to electrical failures was undertaken during a time of very low copper prices, the jack-knife limits shown in Figure 10 were used to establish downtime priorities (see Table 2). It is valid to question the decision not to include all of the events affecting shovel reliability in the prioritized list. In effect, this means adding those events classified as “Chronic type B” to priority list. Code Description Quantity Duration % Time Av. Time ACUTE & CHRONIC FAILURES 1 Electrical inspections 30 1015 13.0 33.8 10 Overload relay 23 685 8.8 29.8 Sub total 21.8 63.3 ACUTE FAILURES 2 Damaged feeder cable 15 785 10.1 52.3 7 Auxiliary motors 13 600 7.7 46.2 12 Earth Faults 7 575 7.4 82.1 8 Main motors 12 555 7.1 46.3 15 Air compressor 8 355 4.6 44.4 17 Over current faults 6 220 2.8 36.7 16 Operator controls 5 155 2.0 31.0 Sub Total 41.7 339 CHRONIC FAILURES - TYPE A 11 Motor over temperature 36 745 9.6 20.7 3 Change of substation or shovel move 27 690 8.8 25.6 Sub total 18.4 46.3 CHRONIC FAILURES - TYPE B Downtime Priorities, Jack-knife Diagrams, Business Cycle { } 5 Power cuts to substations 21 395 5.1 18.8 9 Shovel lights 26 240 3.1 9.2 Sub total 8.2 28 Table 2: Electrical maintenance problems prioritised according to Jack-Knife Principles. { } 20
21 Downtime Priorities, Jack-Knife Diagrams, Business Cycle Figure 8. Combined Reliability, Availability and Maintainability Limits Figure 9: Jack-knife diagram for commodity price cycle peaks Figure 10: Jack-knife diagram for commodity price cycle troughs Experience with analysing larger sets of downtime data has shown that the priority list simply grows too large. To this extent, it is desirable to focus on only those chronic failures that have highest availability impact. 6. Root Cause Analysis and Remedial Action Once a prioritised list of failure codes has been identified, hypotheses can be made about the possible cause (or causes) of each p roblem. Experienced maintenance and operating personnel are indispensable to this process, since familiarity with the machine, the operating environment and with maintenance and operating practices is required. The root causes of equipment downtime are associated with the following broad categories; equipment design, purchase, storage, installation or start-up, operation or maintenance (Moore, 2002). Each of these categories can be further subdivided; for example, ro o t causes associated with maintenance include: planning and scheduling problems; re s o u rce availability problems (labour, tools, documentation, shop space); inadequate inspection or PM practices; and poor work quality. C h ronic repairs are often associated with design pro b l e m s (material quality defects or design inadequacies), inappro p r i a t e operator practices or poor quality control in upstream processes. Tw o good examples of chronic repairs are provided by the data: Figure 11: Trends in unplanned failures for BE 495-B Cable Shovel Motor over- t e m p e r a t u re alarms (failure code 11) can result from poor blast fragmentation, shovel abuse or high ambient temperatures. In the former two cases, corrective action should be directed at mine operations. Outages to the shovel lighting system (failure code 9) typically result from wiring damage due to structural vibration or poor filament re l i a b i l i t y. Redesign of the wiring harness may be one way of tackling this problem. Following the identification of the factors contributing to the root causes to each failure code, a set of corrective actions should be f o rmulated to eliminate or mitigate the factors causing unplanned downtime. Some maintenance actions may necessitate investment on the part of the mine. An estimation of the expected reduction in downtime allows the Maintenance Department to undertake a cost/benefit evaluation of implementing the maintenance action plan. If the cost savings are projected over say, a 3-year period, an NPV can be calculated for the maintenance project. The advantage of this a p p roach is that it permits executive management to evaluate maintenance projects alongside competing project altern a t i v e s . Maintenance need no longer be perceived as a costly overhead, but as a strategic tool to maximise asset utilisation. 7. Trend Plots A further benefit of logarithmic scatterplots is that they provide a useful means of visualising trends in maintenance performance. For example, Figure 11 shows the evolution of four failure codes from a BE 495-B cable shovel working at an open pit copper mine in Chile. Unplanned failures were analysed for a period of three years, 1997 to 1999 inclusive. The threshold limits used in the graph were calculated relative to the total unplanned failure data set for the three year period.
- Page 4: The Entek product family - complete
- Page 8 and 9: May Editorial The annual survey of
- Page 10 and 11: Financials Products Production Stor
- Page 12 and 13: RCMeasy... Workshop and Software $1
- Page 14 and 15: those basic needs or standards are
- Page 16 and 17: Hugh Blackwood 6 of Alcoa’s Mt Ho
- Page 18 and 19: T h i rd l y, Pareto analysis of eq
- Page 20 and 21: THE COMPLETE INFRARED CM/PM PACKAGE
- Page 24 and 25: It can be seen that significant imp
- Page 26 and 27: congestion, accidents, injuries or
- Page 28 and 29: with the detailed life cycle costin
- Page 30 and 31: oot causes to be identified and rel
- Page 32 and 33: New Generation Of Reliability Tools
- Page 34 and 35: New Generation Of Reliability Tools
- Page 36 and 37: For example, one of the most celebr
- Page 38 and 39: MERIT draws data from the Marine’
- Page 40 and 41: d i s c re p a n c y. The short par
- Page 42 and 43: p roblems, and getting their ideas
- Page 44 and 45: M E X M A I N T E N A N C E M A N A
- Page 46 and 47: system performance and efficiency.
- Page 48 and 49: CMMS DETAILS - Functionality C H A
- Page 50 and 51: Fax: (905) 844-0347 Email: mcudmore
- Page 52 and 53: Typical cost of the CMMS software S
- Page 54 and 55: Available as a stand-alone system.
- Page 56 and 57: Ivara EAM Company: Ivara Corporatio
- Page 58 and 59: Small site: $3,000 Medium Site: $40
- Page 60 and 61: MicroMain’s CMMS and modules are
- Page 62 and 63: Available as a stand-alone system.
- Page 64 and 65: Towards An Intelligent Holonic Main
- Page 66 and 67: 1200 1000 800 600 400 200 Breakdown
- Page 68 and 69: Figure 8a: Membership function of F
- Page 70 and 71: Decision Making Grid (DMG) Decision
21<br />
Downtime Priorities, Jack-Knife Diagrams, Business Cycle<br />
Figure 8. Combined Reliability, Availability and<br />
Maintainability Limits<br />
Figure 9: Jack-knife diagram for commodity price cycle peaks<br />
Figure 10: Jack-knife diagram for commodity price cycle troughs<br />
Experience with analysing larger sets of downtime data has shown<br />
that the priority list simply grows too large. To this extent, it is<br />
desirable to focus on only those chronic failures that have highest<br />
availability impact.<br />
6. Root Cause Analysis and Remedial<br />
Action<br />
Once a prioritised list of failure codes has been identified,<br />
hypotheses can be made about the possible cause (or causes) of each<br />
p roblem. Experienced maintenance and operating personnel are<br />
indispensable to this process, since familiarity with the machine, the<br />
operating environment and with maintenance and operating practices<br />
is required.<br />
The root causes of equipment downtime are associated with the<br />
following broad categories; equipment design, purchase, storage,<br />
installation or start-up, operation or maintenance (Moore, 2002). Each<br />
of these categories can be further subdivided; for example, ro o t<br />
causes associated with maintenance include: planning and<br />
scheduling problems; re s o u rce availability problems (labour, tools,<br />
documentation, shop space); inadequate inspection or PM practices;<br />
and poor work quality.<br />
C h ronic repairs are often associated with design pro b l e m s<br />
(material quality defects or design inadequacies), inappro p r i a t e<br />
operator practices or poor quality control in upstream processes. Tw o<br />
good examples of chronic repairs are provided by the data:<br />
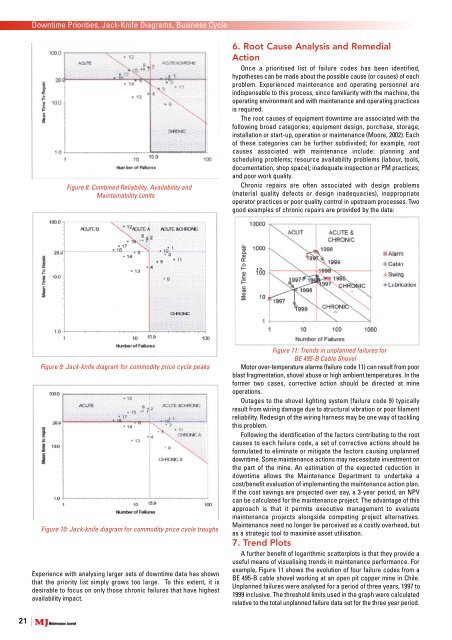
Figure 11: Trends in unplanned failures for<br />
BE 495-B Cable Shovel<br />
Motor over- t e m p e r a t u re alarms (failure code 11) can result from poor<br />
blast fragmentation, shovel abuse or high ambient temperatures. In the<br />
former two cases, corrective action should be directed at mine<br />
operations.<br />
Outages to the shovel lighting system (failure code 9) typically<br />
result from wiring damage due to structural vibration or poor filament<br />
re l i a b i l i t y. Redesign of the wiring harness may be one way of tackling<br />
this problem.<br />
Following the identification of the factors contributing to the root<br />
causes to each failure code, a set of corrective actions should be<br />
f o rmulated to eliminate or mitigate the factors causing unplanned<br />
downtime. Some maintenance actions may necessitate investment on<br />
the part of the mine. An estimation of the expected reduction in<br />
downtime allows the Maintenance Department to undertake a<br />
cost/benefit evaluation of implementing the maintenance action plan.<br />
If the cost savings are projected over say, a 3-year period, an NPV<br />
can be calculated for the maintenance project. The advantage of this<br />
a p p roach is that it permits executive management to evaluate<br />
maintenance projects alongside competing project altern a t i v e s .<br />
Maintenance need no longer be perceived as a costly overhead, but<br />
as a strategic tool to maximise asset utilisation.<br />
7. Trend Plots<br />
A further benefit of logarithmic scatterplots is that they provide a<br />
useful means of visualising trends in maintenance performance. For<br />
example, Figure 11 shows the evolution of four failure codes from a<br />
BE 495-B cable shovel working at an open pit copper mine in Chile.<br />
Unplanned failures were analysed for a period of three years, 1997 to<br />
1999 inclusive. The threshold limits used in the graph were calculated<br />
relative to the total unplanned failure data set for the three year period.


