Development of a Depth-Integrated Sample Arm to Reduce Solids ...
Development of a Depth-Integrated Sample Arm to Reduce Solids ...
Development of a Depth-Integrated Sample Arm to Reduce Solids ...

Create successful ePaper yourself
Turn your PDF publications into a flip-book with our unique Google optimized e-Paper software.
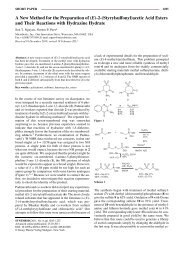
Lower M iddle Upper<br />
Selbig and Bannerman<br />
Figure 4-Percent organic content <strong>of</strong> water quality samples collected using the DISA at the lower, middle, and upper<br />
intake locations.<br />
does support a distinction between sampler types. This is best<br />
illustrated by plotting the cumulative. frequency distribution <strong>of</strong><br />
estimated, average specific densities for both the DISA sample<br />
intake locations and the fixed-point sampler (Figure 5). Figure 5<br />
shows that the frequency distributions for the lower, middle, and<br />
upper sample-intake locations for the DISA sampler were similar<br />
<strong>to</strong> 'each another. The fixed-point saimpler had a frequency<br />
distribution favoring particles with a higher specific density.<br />
Approximately 75% <strong>of</strong> all particles in the fixed-point sampler and<br />
nearly all particles collected by the DISA sampler had average<br />
specific densities less than that <strong>of</strong> sand (2.65 g/cm 3 ).<br />
Further evidence <strong>of</strong> homogeneous distribution <strong>of</strong> organic<br />
material throughout the water column is illustrated in Figure 6.<br />
As the depth <strong>of</strong> water in the s<strong>to</strong>rm sewer decreases, the percentage<br />
<strong>of</strong> organic material tends <strong>to</strong> increase. The rate <strong>of</strong> increase is<br />
similar for all three sub-sample locations spaced vertically<br />
throughout the water column. A considerable amount <strong>of</strong><br />
Table 3-Comparison <strong>of</strong> average specific density<br />
estimated for samples collected from the DISA and<br />
fixed-point samplers.<br />
DISA sample Intake<br />
location<br />
Statistic Lower Middle Upper Fixed-point<br />
Number <strong>of</strong> observations 38 38 20 84<br />
Median 1.3 1.1 • 1.3 1.6<br />
Mean 1.4 1.2 .1.3 1.9<br />
Standard deviation 0.8 0.7 0.5 1.0<br />
Variation coefficient 0.6 0.6 0.4 0.6<br />
April 2011<br />
S50<br />
0<br />
04<br />
0.<br />
60<br />
a 30<br />
4<br />
U<br />
. 20<br />
0<br />
o<br />
0<br />
oV<br />
0<br />
A-<br />
4-<br />
variability exists in percent organic content when the depth <strong>of</strong><br />
water in the s<strong>to</strong>rm sewer is less than approximately 0.2 m (0.5 ft).<br />
One explanation might be the inherent variability in organic<br />
detritus accompanied by the timing <strong>of</strong> each sample. A greater<br />
amount <strong>of</strong> organic material could become entrained in run<strong>of</strong>f early<br />
in the rising limb <strong>of</strong> the hydrograph but may dissipate or dilute as<br />
the volume <strong>of</strong> water increases. A similar inverse relationship is<br />
apparent between the percent organic content and concentrations<br />
<strong>of</strong> suspended sediment. As the percentage <strong>of</strong> organic material<br />
decreases with increasing water depth, the percentage <strong>of</strong> inorganic<br />
sediment would increase. Similar conclusions were made by<br />
Lenhart and Lehman (2006) when analyzing concentrations <strong>of</strong><br />
TSS and TVSS in s<strong>to</strong>rmwater samples collected from several<br />
cities throughout the United States. It is this inorganic fraction that<br />
tends <strong>to</strong> have higher specific gravities and is more prone <strong>to</strong><br />
stratification in the water column. Subsequently, concentrations <strong>of</strong><br />
inorganic solids may show greater variability when using a fixedpoint<br />
sampler. i<br />
Differences in Particle Size Distribution. The range <strong>of</strong><br />
particle sizes in urban run<strong>of</strong>f can vary considerably. Bent et al.<br />
(2000) reviewed studies from several countries around the world<br />
that related sediment in run<strong>of</strong>f from a variety <strong>of</strong> urban areas. The<br />
median particle size (d50) <strong>of</strong> sediments collected in these studies<br />
ranged from 0.0 13 <strong>to</strong> 1.00 mm. Other studies differ on the particle<br />
size that au<strong>to</strong>samplers are able <strong>to</strong> capture effectively (range from<br />
250-<strong>to</strong> 2000 ptm), regardless <strong>of</strong> their location in the water column<br />
(Clark et al., 2008; Pedrick and Tellessen, .2008). Despite<br />
disagreement in particle size collection efficiency, these studies<br />
tend <strong>to</strong> agree that the location <strong>of</strong> the sample intake has no<br />
significance if the water column is well-mixed. However, Clark et<br />
al. (2008) concluded that the location <strong>of</strong> a sampler intake would<br />
353