Development of a Depth-Integrated Sample Arm to Reduce Solids ...
Development of a Depth-Integrated Sample Arm to Reduce Solids ...
Development of a Depth-Integrated Sample Arm to Reduce Solids ...

Create successful ePaper yourself
Turn your PDF publications into a flip-book with our unique Google optimized e-Paper software.
<strong>Development</strong> <strong>of</strong> a <strong>Depth</strong>-<strong>Integrated</strong> <strong>Sample</strong><br />
<strong>Arm</strong> <strong>to</strong> <strong>Reduce</strong> <strong>Solids</strong> Stratification Bias in<br />
S<strong>to</strong>rmwater Sampling<br />
ABSTRACT: A new depth-integrated sample arm (DISA) was developed<br />
<strong>to</strong> improve the representation <strong>of</strong> solids in s<strong>to</strong>rmwater, both organic<br />
and inorganic, by collecting a water quality sample from multiple points in<br />
the water column. Data from this study demonstrate the idea <strong>of</strong> vertical<br />
stratification <strong>of</strong> solids in s<strong>to</strong>rm sewer run<strong>of</strong>f. Concentrations <strong>of</strong> suspended<br />
sediment in run<strong>of</strong>f were statistically greater using a fixed rather than multipoint<br />
collection system. Median suspended sediment concentrations<br />
measured at the fixed location (near the pipe invert) were approximately<br />
double those collected using the DISA. In general, concentrations and size<br />
distributions <strong>of</strong> suspended sediment decreased with increasing vertical<br />
distance from the s<strong>to</strong>rm sewer invert. Coarser particles tended <strong>to</strong> dominate<br />
the distribution <strong>of</strong> solids near the s<strong>to</strong>rm sewer invert as discharge<br />
increased. In contrast <strong>to</strong> concentration and particle size, organic material,<br />
<strong>to</strong> some extent, was distributed homogenously throughout the water<br />
column, likely the result <strong>of</strong> its low specific density, which allows' for<br />
thorough mixing in less turbulent water. Water Environ. Res., 83, 347<br />
(2011).<br />
KEYWORDS: suspended solids, suspended sediment, s<strong>to</strong>rmwater,<br />
run<strong>of</strong>f, au<strong>to</strong>sampler, organic, specific density.<br />
doi: 10.2175/106143010X 12851009156006<br />
Introduction<br />
Collection <strong>of</strong> representative s<strong>to</strong>rmwater quality samples in urban<br />
run<strong>of</strong>f can be difficult, as a result <strong>of</strong> the large sources <strong>of</strong> variability<br />
that are both temporal and spatial, such as the flashy nature <strong>of</strong> urban<br />
run<strong>of</strong>f events or sediment s<strong>to</strong>red in s<strong>to</strong>rm sewer systems between<br />
events (Horowitz, 1995; Selbig and Bannerman, 2007). The use <strong>of</strong><br />
au<strong>to</strong>mated water quality samplers has vastly improved the way<br />
water resources pr<strong>of</strong>essionals collect samples in these environments,<br />
but an increasing body <strong>of</strong> evidence suggests that some <strong>of</strong> the<br />
concentration data collected from urban conveyances, both in the<br />
past and presently, may be biased (Fowler et al., 2009; Smith,<br />
2002). One source <strong>of</strong> potential bias is the stratification <strong>of</strong> solids by<br />
particle size in a flowing water column. Previous studies have<br />
suggested that sediment accumulated in pipes may be mobilized as<br />
bed load or suspended load, depending on the concentration and<br />
size distribution <strong>of</strong> the sediment and energy <strong>of</strong> flow (Bent et al.,<br />
2000, DeGroot et al., 2009; Edwards and Glysson, 1999). The<br />
U.S. Geological Survey, Wisconsin Water Science Center, Middle<strong>to</strong>n,<br />
Wisconsin.<br />
2 Wisconsin Department <strong>of</strong> Natural Resouices, Madison, Wisconsin.<br />
*U.S. Geological Survey, Wisconsin Water Science Center, 8505<br />
Research Way,' Middle<strong>to</strong>n, WI 53562; e-mail: wrselbig@usgs.gov.<br />
William R. Selbigl*, Roger T. Bannerman 2<br />
location <strong>of</strong> the sampler intake can be critical, depending on the<br />
degree <strong>of</strong> stratification in the s<strong>to</strong>rm sewer pipe.<br />
Typically, the intake orifice <strong>of</strong> an au<strong>to</strong>sampler is located near the<br />
pipe invert <strong>to</strong> capture low-flow conditions. The recommended intake<br />
orifice diameter for au<strong>to</strong>mated samplers is approximately 0.95-cm<br />
(0.38-in.) (ISCO, 2008). Therefore, in large-diameter pipes, the<br />
s<strong>to</strong>rmwater quality sample collected' by the au<strong>to</strong>sampler represents<br />
only the bot<strong>to</strong>m 0.95 cm (0.38 in.) <strong>of</strong> the pipe. During higher flows,<br />
the majority <strong>of</strong> the water column is not sampled. If the water column<br />
is mixed fully, creating a homogenous distribution <strong>of</strong> sediment, this<br />
sampling scheme may be adequate; however, Smith (2002) has<br />
shown that the concentration and. distribution <strong>of</strong> sediment in a<br />
circular pipe with a diameter as small as 0.3 m (1 ft) can be<br />
concentrated near the bot<strong>to</strong>m <strong>of</strong> the pipe over a range <strong>of</strong> flow<br />
conditions. Similarly, in a controlled labora<strong>to</strong>ry setting, DeGroot et<br />
al. (2009) reported that sediment concentrations collected by an<br />
au<strong>to</strong>sampler fixed near the bot<strong>to</strong>m <strong>of</strong> a 46-cm (1 8-in.)-diameter pipe<br />
were much greater than known concentrations <strong>of</strong> particle sizes<br />
ranging from silts and clays (
Selbig and Bannerman<br />
1.25 x 0.375 Inch elliptical<br />
Stainless steel shaft \<br />
Mounting bracket/<br />
Polycarbonate end cap<br />
with 0.25 Inch I.D. Intake orifices<br />
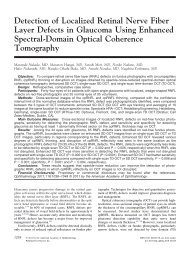
Figure 1-Schematic drawing <strong>of</strong> the DISA.<br />
et al. (2005) suggested designing a new au<strong>to</strong>sampler system that<br />
uses a float system <strong>to</strong> place the intake at the midpoint <strong>of</strong> a flow<br />
path. DeGroot et al. (2009) designed an intake manifold that<br />
adjusts itself <strong>to</strong> the depth <strong>of</strong> flow in the pipe by use <strong>of</strong> a fin.<br />
Although this device showed promising results for accurately<br />
collecting sand-sized particles in a small-diameter pipe, an<br />
alternate mechanism would be necessary for pipes larger than<br />
61 cm (24 in.) in diameter (DeGroot et al., 2009). These ideas<br />
mark the genesis <strong>of</strong> new technologies <strong>to</strong> improve the way a<br />
s<strong>to</strong>rmwater quality sample is acquired by use <strong>of</strong> au<strong>to</strong>samplers.<br />
This study discusses the development <strong>of</strong> a new pro<strong>to</strong>type depthintegrated<br />
sample ann (DISA) designed <strong>to</strong> integrate with existing<br />
au<strong>to</strong>sampler configurations for collection <strong>of</strong> s<strong>to</strong>rmwater quality<br />
samples <strong>of</strong> urban run<strong>of</strong>f in a s<strong>to</strong>rm sewer. Use <strong>of</strong> the DISA<br />
facilitates collection <strong>of</strong> s<strong>to</strong>rmwater quality samples from a single<br />
or multiple point(s) in the water column. Integrating samples from<br />
the entire water column, rather than from a single, fixed point, can<br />
result in a more accurate representation <strong>of</strong> s<strong>to</strong>rmwater-borne<br />
solids. In this study, the DISA and a fixed-point sampling method<br />
were used <strong>to</strong> collect samples <strong>of</strong> urban run<strong>of</strong>f. Results from the two<br />
methods are compared on the basis <strong>of</strong> concentrations <strong>of</strong> suspended<br />
sediment, organic content, and PSDs using field-collected samples<br />
<strong>of</strong> urban run<strong>of</strong>f. Deficiencies <strong>of</strong> the DISA and suggested<br />
modifications <strong>to</strong> improve the device also are discussed.<br />
348<br />
Ram pis<strong>to</strong>n<br />
Rear mounting hole<br />
12v wMre<br />
'F -12 VDC Mo<strong>to</strong>rized: ram<br />
Aluminum support frame<br />
Materials and Methods<br />
The general field <strong>of</strong> application <strong>of</strong> the DISA described herein is<br />
intended <strong>to</strong> be in closed conveyances, such as s<strong>to</strong>rm sewers, that<br />
are used <strong>to</strong> route s<strong>to</strong>rmwater run<strong>of</strong>f in an urban environment.<br />
However, the DISA also may be used in any water quality<br />
sampling environment where the distribution <strong>of</strong> sediment in flow<br />
can be shown <strong>to</strong> be heterogeneous and not easily corrected using<br />
established manual sampling techniques, such as equal-width or<br />
equal-depth increment sampling.<br />
Use <strong>of</strong> the <strong>Depth</strong>-<strong>Integrated</strong> <strong>Sample</strong> <strong>Arm</strong> <strong>to</strong> Collect a Water<br />
Quality <strong>Sample</strong>. The DISA has a support frame, a mo<strong>to</strong>rized<br />
pis<strong>to</strong>n (also referred <strong>to</strong> as a linear actua<strong>to</strong>r), a rotary<br />
potentiometer, and a sample arm assembly (Figure 1). As the<br />
pis<strong>to</strong>n extends or retracts, it pivots the sample arm assembly<br />
around the potentiometer axle. The rotation <strong>of</strong> the DISA, and thus<br />
the position <strong>of</strong> the intake orifice, is controlled by an external data<br />
logger or other programmable logic control (PLC) device that<br />
activates a relay <strong>to</strong> energize the pis<strong>to</strong>n. The PLC may be<br />
programmed <strong>to</strong> set the intake orifice <strong>to</strong> a percentage <strong>of</strong> the water<br />
depth. The depth <strong>of</strong> water is measured by an acoustic-velocity<br />
sensor or similar device. For example, if the target sample position<br />
is set <strong>to</strong> be 50% <strong>of</strong> a water depth <strong>of</strong> approximately 0.2 m (0.5 ft),<br />
then the PLC will activate the mo<strong>to</strong>rized ram until the<br />
potentiometer reads the voltage representing 0.08 m (0.25 ft).<br />
Water Environment Research, Volume 83, Number 4
Thus, the mo<strong>to</strong>rized ram rotates the sample arm assembly <strong>to</strong> any<br />
vertical depth within the s<strong>to</strong>rm sewer. Once the PLC determines<br />
that the potentiometer has reached the target voltage, it triggers<br />
the au<strong>to</strong>sampler <strong>to</strong> operate with normal purge/withdraw cycles <strong>to</strong><br />
collect a s<strong>to</strong>rmwater quality sample and deposit it in one or more<br />
s<strong>to</strong>rage containers. Once the sample has been acquired, the DISA<br />
either moves <strong>to</strong> a new position for collection <strong>of</strong> another sample or<br />
fully retracts <strong>to</strong> the horizontal position, whi6h removes the DISA<br />
from the flow path with any debris that may have accumulated on<br />
the sample arm assembly while acquiring a sample.<br />
Method <strong>to</strong> Compare the <strong>Depth</strong>-<strong>Integrated</strong> <strong>Sample</strong> <strong>Arm</strong> with<br />
a Fixed-Point Au<strong>to</strong>sampler Configuration. This study involved<br />
collection and chaiacterization <strong>of</strong> data derived from<br />
s<strong>to</strong>rmwater quality samples collected in two urban drainage areas<br />
located in Madison, Wisconsin. The first was a 2.4-ha (6-ac)<br />
commercial parking area adjacent <strong>to</strong> a shopping center complex;<br />
the second was a 21-ha (53-ac) single-family residential area..<br />
Run<strong>of</strong>f was collected in multiple s<strong>to</strong>rm sewer inlets at each site<br />
and then was conveyed through a single, circular, concrete pipe<br />
with diameters <strong>of</strong> approximately 91 and 107 cm (36 and 42 in.) at<br />
the parking lot and residential drainage areas, respectively.<br />
Each moni<strong>to</strong>ring station was equipped with two au<strong>to</strong>mated<br />
water quality samplers and instruments <strong>to</strong> measure water level and<br />
velocity. Measurement, control, and s<strong>to</strong>rage <strong>of</strong> data were<br />
performed by electronic data loggers. <strong>Sample</strong> collection was<br />
activated by a rise in water level in the pipe during'a s<strong>to</strong>rm. Once<br />
the water level threshold was exceeded, typically a depth <strong>of</strong><br />
approximately 0.06 m (0.2 ft) from the pipe floor, each au<strong>to</strong>mated<br />
water quality sampler collected a discrete water sample in<strong>to</strong> I-L<br />
plastic containers. This process was repeated for every approximately<br />
0.03-m (0.1-ft) increase and approximately 0.06-m (0.2-ft)<br />
,decrease in water level over the duration <strong>of</strong> the s<strong>to</strong>rm hydrograph<br />
until the water in the pipe receded below the water level threshold.<br />
Each au<strong>to</strong>sampler was located side-by-side in an aluminum<br />
shelter directly over the s<strong>to</strong>rm sewer. ISCO 3700 pump heads with<br />
a 24-bottle configuration were used <strong>to</strong> provide consistent intake<br />
velocities. Pump heads were programmed with similar purge/<br />
withdraw cycles <strong>to</strong> flush the sample tubing before sample<br />
collection. One au<strong>to</strong>sampler collected a water quality sample<br />
from a fixed point located approximately 2.5 cm (1 in.) <strong>of</strong>f the<br />
pipe invert (herein called the fixed-point sampler), and the other<br />
collected a sample from multiple points using the DISA. Upon<br />
sample initiation, each sampler would collect a series <strong>of</strong> three<br />
successive sub-samples separated 'by 1-minute increments.<br />
Because the fixed-point sampler's intake nozzle was secured <strong>to</strong><br />
the pipe floor, each sub-sample was taken from the same location.<br />
The DISA was programmed <strong>to</strong> collect each sub-sample from<br />
different vertical locations in the water column. The first subsample<br />
was collected approximately 2.5 cm (I in.) from the.pipe<br />
invert <strong>to</strong> coincide with the intake location <strong>of</strong> the fixed-point<br />
sampler. The DISA then would relocate the intake nozzle <strong>to</strong> a<br />
vertical point approximating 30 and 60% <strong>of</strong> the water level for the<br />
second and third sub-samples, respectively. In doing so, subsamples<br />
were collected from the lower, middle, and upper onethird<br />
<strong>of</strong> the full water column. For example, if the water level was<br />
0.3 m.(1.0 ft), the first, second, and third sub-samples (herein<br />
called the lower, middle, and upper sub-samples) would be<br />
collected at a depth <strong>of</strong> 0.02, 0.09, and 0.2 m (0.08, 0.3, and 0.6 ft)<br />
"from the pipe invert, respectively. Although the vertical spacing <strong>of</strong><br />
each sub-sample remained consistent for this study, the location <strong>of</strong><br />
April 2011<br />
Selbig and Bannerman<br />
the nozzle intake can be programmed <strong>to</strong> accommodate any<br />
vertical position in the pipe, from completely vertical <strong>to</strong><br />
completely horizontal.<br />
Upon run<strong>of</strong>f cessation, water quality samples were retrieved<br />
and transported <strong>to</strong> the U.S Geological Survey Middle<strong>to</strong>n Field<br />
Office in Middle<strong>to</strong>n, Wisconsin. Each discrete sample was split<br />
equally in<strong>to</strong> two labora<strong>to</strong>ry-prepared containers by passing the 1 L<br />
sample through a cone splitter. Approximately 180 mL also was<br />
transferred from the cone splitter in<strong>to</strong> a separa<strong>to</strong>ry funnel for<br />
determination <strong>of</strong> PSD. Except for the separa<strong>to</strong>ry funnel, processed<br />
samples were chilled on ice and delivered <strong>to</strong> the Wisconsin State<br />
Labora<strong>to</strong>ry <strong>of</strong> Hygiene (Madison, Wisconsin) for analysis <strong>of</strong> <strong>to</strong>tal<br />
suspended solids (TSS), <strong>to</strong>tal volatile suspended solids (TVSS),<br />
and suspended sediment.<br />
Particle Size Distribution Measurement. The PSD.<strong>of</strong> run<strong>of</strong>f<br />
samples was measured using a Laser In-Situ Scattering and<br />
Transmissometry (LISST) particle size analyzer (Sequoia Scientific,<br />
Bellevue, Washing<strong>to</strong>n). The LISST-Portable uses laser<br />
diffraction <strong>to</strong> measure PSD as particle volume concentration<br />
(microliters per liter) in 32 logarithmically spaced bins ranging in<br />
size from approximately 2 <strong>to</strong> 350 gtm. Additional details are<br />
described in Agrawal and Pottsmith (2000). Contents <strong>of</strong> the<br />
separa<strong>to</strong>ry funnel were transferred in<strong>to</strong> the holding chamber <strong>of</strong> the<br />
LISST-Portable. Use <strong>of</strong> a separa<strong>to</strong>ry funnel allowed for complete<br />
transfer <strong>of</strong> the sample without the potential <strong>to</strong> bias coarse particle<br />
concentration by pouring or pipetting.<br />
The upper particle size fraction reported by the LISST-Portable<br />
was approximately 350 gim. Although the particle size fraction in<br />
the majority <strong>of</strong> samples collected as part <strong>of</strong> this study was below<br />
this reporting limit, ,some samples contained particles exceeding<br />
that size (
Selbig and Bannerman<br />
Table 1-Summary <strong>of</strong> solids concentrations at the parking lot and residential study areas for samples collected using<br />
the fixed-point and DISA samplers.<br />
TSS (mg/L) VSS (mgIL) Suspended sediment (mg1L)<br />
Statistic Fixed-point DISA Fixed-point DISA Fixed-point DISA<br />
Parking lot<br />
Number <strong>of</strong> observations 117 118 117 118 116 117<br />
Minimum 3
(a)<br />
C<br />
(b)<br />
100,000<br />
10,000<br />
o 1,000<br />
* LOWER • LOWERLine <strong>of</strong> equal concentration -<br />
' MIDDLE<br />
x UPPER<br />
IX<br />
I. 10 0<br />
.K41<br />
a<br />
10,000<br />
100"<br />
j 100<br />
X KA<br />
,<br />
Selbig and Bannerman<br />
1 10 100 1,000 10,000 100,000<br />
Suspended Sediment Concentration (fixed-point sampler), In mg[L<br />
* LOWER<strong>of</strong> equal concentration<br />
£ MIDDLE<br />
* UPPER<br />
1 10 100 1,000 10,000<br />
Suspended Sediment Concentration (fixed-point sampler), In mg/L<br />
Figure 2-Paired concentrations <strong>of</strong> suspended sediment at the fixed-point and lower, middle, and upper DISA sample<br />
locations in the (ay parking lot and (b) residential study sites.<br />
April 2011 351<br />
AL
Selbig and Bannerman<br />
E<br />
a<br />
ES<br />
p1,500-<br />
0<br />
U<br />
E<br />
51,000-<br />
m 500.<br />
0 "H'I<br />
1 H'I<br />
1 2 3 4 5 6 7 8 9 10 11 12 13 14 15 16 17 18 19 20<br />
Event Number<br />
Figure 3-SSCs at the lower, middle, and upper DISA intake locations in the residential study area. Only samples that<br />
were collected successfully from all three intake locations are shown.<br />
On average, differences in flow between successive sub-samples<br />
were less than 2%.<br />
Differences in Organic Content. The amount <strong>of</strong> organic<br />
material in a water sample can be expressed as the ratio <strong>of</strong> TVSS<br />
<strong>to</strong> TSS. Previous studies have demonstrated TSS as an inferior<br />
metric <strong>to</strong> measure solids in s<strong>to</strong>rmwater when compared with<br />
suspended sediment (Clark and Siu, 2008; deRidder et al., 2002;<br />
Gray et al., 2000; Kayhanian et al., 2008; Roesner et al., 2007;<br />
Selbig et al., 2007). The degree <strong>of</strong> error is correlated positively<br />
with concentration or particle size, or both (Selbig et al., 2007).<br />
Given the bias <strong>of</strong> TSS as a method <strong>to</strong> quantify solids in<br />
s<strong>to</strong>rmwater, the organic content <strong>of</strong> water samples collected as part<br />
<strong>of</strong> this study was expressed as a percentage <strong>of</strong> SSC. This<br />
definition <strong>of</strong> percent organic content is based on the assumption<br />
that equal amounts <strong>of</strong> organic material were transferred from the<br />
cone splitter in<strong>to</strong> the labora<strong>to</strong>ry containers used for determination<br />
<strong>of</strong> TVSS and suspended sediment, and none <strong>of</strong> the organic<br />
material was excluded from the labora<strong>to</strong>ry analysis.<br />
The distribution <strong>of</strong> organic material, <strong>to</strong> some extent, was<br />
uniform throughout the water column. This is likely the result <strong>of</strong><br />
the low specific density typically associated with organic detritus<br />
when compared with sand. Kayhanian et al. (2008) reported specific<br />
gravities <strong>of</strong> organic detritus ranging from 1.6 <strong>to</strong> 1.8 g/cm 3 -<br />
much lower than that <strong>of</strong> sand (2.65 g/cm 3 ). Cristina et al. (2002)<br />
reported the specific gravity <strong>of</strong> highly organic solids as 1.1 g/cm 3 .<br />
Based on S<strong>to</strong>kes Law (1851), organic solids can remain in suspension<br />
much longer than sand because <strong>of</strong> their lower specific<br />
density and therefore may achieve a more homogenous distribution<br />
throughout the water column, despite relatively low turbulence, as<br />
<strong>of</strong>ten is the case in s<strong>to</strong>rm sewers.<br />
Figure 4 shows the range <strong>of</strong> organic content as a percentage <strong>of</strong><br />
suspended sediment in the residential study area for the lower,<br />
352<br />
middle, and upper intake locations <strong>of</strong> the DISA. The residential<br />
study area was used <strong>to</strong> describe the characteristics <strong>of</strong> organic<br />
material in urban run<strong>of</strong>f because <strong>of</strong> its extensive tree canopy and<br />
other organic detritus that is transported easily during a s<strong>to</strong>rm<br />
event. The range <strong>of</strong> organic content generally is less than 50% for<br />
all vertical points in the water column. Median and mean<br />
percentages <strong>of</strong> organic material in samples collected from the<br />
middle intake location appear <strong>to</strong> be slightly greater than the lower<br />
or upper locations, but are not statistically significant (Kruskall-<br />
Wallis test, p = 0.05). Furthermore, although there is no statistical<br />
difference in the percentage <strong>of</strong> organic material at the lower,<br />
middle, or upper intake locations collected by the DISA, each<br />
vertical location has an organic content that is statistically greater<br />
than paired samples collected by the fixed-point sampler<br />
(Wilcoxon signed-rank test, p = 0.05). This suggests that use <strong>of</strong><br />
a fixed-point sampler might result in overestimation <strong>of</strong> the<br />
inorganic fraction and underestimation <strong>of</strong> the organic fraction in<br />
urban run<strong>of</strong>f.<br />
Particles collected by the fixed-point sampler in the residential<br />
study area had larger median and mean specific densities than<br />
those collected by the DISA for all vertical intake locations<br />
(Table 3). The densities shown in Table 3 may differ from the<br />
actual values, as a result <strong>of</strong> compounding errors in analytical<br />
procedures. Concentrations <strong>of</strong> suspended sediment include all<br />
particles, regardless <strong>of</strong> size, but the volumetric concentrations<br />
determined by the LISST were restricted <strong>to</strong> the largest aperture <strong>of</strong><br />
the instrument-approximately 350 gIm. Large, organic detritus,<br />
such as grass clippings, would be included in the concentration <strong>of</strong><br />
suspended sediment, but not in the volumetric concentration. This<br />
limitation is best visualized in Figure 5, where approximately<br />
30% <strong>of</strong> specific densities are less than 1.0 (the density <strong>of</strong> water).<br />
However, a comparison between the ranges <strong>of</strong> estimated densities<br />
Water Environment Research, Volume 83, Number 4
Lower M iddle Upper<br />
Selbig and Bannerman<br />
Figure 4-Percent organic content <strong>of</strong> water quality samples collected using the DISA at the lower, middle, and upper<br />
intake locations.<br />
does support a distinction between sampler types. This is best<br />
illustrated by plotting the cumulative. frequency distribution <strong>of</strong><br />
estimated, average specific densities for both the DISA sample<br />
intake locations and the fixed-point sampler (Figure 5). Figure 5<br />
shows that the frequency distributions for the lower, middle, and<br />
upper sample-intake locations for the DISA sampler were similar<br />
<strong>to</strong> 'each another. The fixed-point saimpler had a frequency<br />
distribution favoring particles with a higher specific density.<br />
Approximately 75% <strong>of</strong> all particles in the fixed-point sampler and<br />
nearly all particles collected by the DISA sampler had average<br />
specific densities less than that <strong>of</strong> sand (2.65 g/cm 3 ).<br />
Further evidence <strong>of</strong> homogeneous distribution <strong>of</strong> organic<br />
material throughout the water column is illustrated in Figure 6.<br />
As the depth <strong>of</strong> water in the s<strong>to</strong>rm sewer decreases, the percentage<br />
<strong>of</strong> organic material tends <strong>to</strong> increase. The rate <strong>of</strong> increase is<br />
similar for all three sub-sample locations spaced vertically<br />
throughout the water column. A considerable amount <strong>of</strong><br />
Table 3-Comparison <strong>of</strong> average specific density<br />
estimated for samples collected from the DISA and<br />
fixed-point samplers.<br />
DISA sample Intake<br />
location<br />
Statistic Lower Middle Upper Fixed-point<br />
Number <strong>of</strong> observations 38 38 20 84<br />
Median 1.3 1.1 • 1.3 1.6<br />
Mean 1.4 1.2 .1.3 1.9<br />
Standard deviation 0.8 0.7 0.5 1.0<br />
Variation coefficient 0.6 0.6 0.4 0.6<br />
April 2011<br />
S50<br />
0<br />
04<br />
0.<br />
60<br />
a 30<br />
4<br />
U<br />
. 20<br />
0<br />
o<br />
0<br />
oV<br />
0<br />
A-<br />
4-<br />
variability exists in percent organic content when the depth <strong>of</strong><br />
water in the s<strong>to</strong>rm sewer is less than approximately 0.2 m (0.5 ft).<br />
One explanation might be the inherent variability in organic<br />
detritus accompanied by the timing <strong>of</strong> each sample. A greater<br />
amount <strong>of</strong> organic material could become entrained in run<strong>of</strong>f early<br />
in the rising limb <strong>of</strong> the hydrograph but may dissipate or dilute as<br />
the volume <strong>of</strong> water increases. A similar inverse relationship is<br />
apparent between the percent organic content and concentrations<br />
<strong>of</strong> suspended sediment. As the percentage <strong>of</strong> organic material<br />
decreases with increasing water depth, the percentage <strong>of</strong> inorganic<br />
sediment would increase. Similar conclusions were made by<br />
Lenhart and Lehman (2006) when analyzing concentrations <strong>of</strong><br />
TSS and TVSS in s<strong>to</strong>rmwater samples collected from several<br />
cities throughout the United States. It is this inorganic fraction that<br />
tends <strong>to</strong> have higher specific gravities and is more prone <strong>to</strong><br />
stratification in the water column. Subsequently, concentrations <strong>of</strong><br />
inorganic solids may show greater variability when using a fixedpoint<br />
sampler. i<br />
Differences in Particle Size Distribution. The range <strong>of</strong><br />
particle sizes in urban run<strong>of</strong>f can vary considerably. Bent et al.<br />
(2000) reviewed studies from several countries around the world<br />
that related sediment in run<strong>of</strong>f from a variety <strong>of</strong> urban areas. The<br />
median particle size (d50) <strong>of</strong> sediments collected in these studies<br />
ranged from 0.0 13 <strong>to</strong> 1.00 mm. Other studies differ on the particle<br />
size that au<strong>to</strong>samplers are able <strong>to</strong> capture effectively (range from<br />
250-<strong>to</strong> 2000 ptm), regardless <strong>of</strong> their location in the water column<br />
(Clark et al., 2008; Pedrick and Tellessen, .2008). Despite<br />
disagreement in particle size collection efficiency, these studies<br />
tend <strong>to</strong> agree that the location <strong>of</strong> the sample intake has no<br />
significance if the water column is well-mixed. However, Clark et<br />
al. (2008) concluded that the location <strong>of</strong> a sampler intake would<br />
353
Selbig and Bannerman<br />
E<br />
0.8--<br />
" 0.7<br />
Cr<br />
0.68-<br />
0.4 -'<br />
0.30.5<br />
0.-.-<br />
,0. .. ,[ .. _ ....... DGA- MIDDLE(38)<br />
,0.2- DIR o -,-, U (20)<br />
"Ca,- DISA - ALL (96)<br />
0.4<br />
C 03<br />
0 0.5 1 1.5 2 2.5 3 3.5 4<br />
Specific Density, in g/CM(<br />
Figure 5---Cumulative distribution <strong>of</strong> average specific density estimated in the fixed-point and lower, middle, and<br />
upper DISA samples [(n) = number <strong>of</strong> samples used in analysis].<br />
become important in poorly mixed flows. Therefore, proper Horowitz (1995) reported increasing concentrations <strong>of</strong> sediment<br />
characterization <strong>of</strong> the distribution <strong>of</strong> particles in urban run<strong>of</strong>f with increasing depth in fluvial systems. The data presented in<br />
requires the collection <strong>of</strong> water quality samples from multiple Figures 6 and 7 illustrate a similar trend in a s<strong>to</strong>rm sewer. The<br />
points, rather than from a single fixed point in the water column. increase in concentration is the result, in part, <strong>of</strong> an increase in<br />
2.5-<br />
2-<br />
1.5 -<br />
Ca<br />
_=9<br />
%U<br />
* a<br />
Xa<br />
o N<br />
0 .5-<br />
0<br />
•0 a<br />
•<br />
a<br />
* LOWER<br />
a MIDDLE<br />
U PPER<br />
O Co I p<br />
0.5 10 0% 6 20•0 .p<br />
0 and 0 0 0 0<br />
0% 10% 20% 30% 40% 50% 60% 70% 80%<br />
organic Content, In percent<br />
Figure 6-Relationship <strong>of</strong> the percent organic material in samples collected from the lower, middle, and upper DISA<br />
sample locations with the depth <strong>of</strong> water in the s<strong>to</strong>rm sewer at the residential study site.<br />
354<br />
Water Environment Research, Volume 83, Number 4
1£l] .... I IM,<br />
70<br />
ED<br />
50<br />
30<br />
3<strong>to</strong><br />
(a)<br />
a<br />
Z<br />
0<br />
U<br />
ru<br />
,i,<br />
UI,<br />
3<br />
(b)<br />
IA TIC - 88 n,gII.<br />
FKCIOPO<br />
Hit SO8C 91 rngfL<br />
-DIIA - LOWlER<br />
---o<br />
-DISA MIDOLE<br />
FV0E D-P 01NT<br />
F 0(ED-P O:NT<br />
50 '-100 150 20C 250 300 350 4<br />
PARTICLE SZEE, IN MICROMIETE RS<br />
M<br />
62<br />
70<br />
60<br />
so<br />
40<br />
30<br />
20<br />
10<br />
.0 50 010 150 200 250<br />
PARTICLE SORE, IN MICROMETERS<br />
Figure 7--(a) Distribution <strong>of</strong> particles in discrete sub-samples collected using the DISA sampler. (b) Each sequence <strong>of</strong><br />
sample points grouped on the rising limb and peak <strong>of</strong> the hydrograph represents the chronological progression <strong>of</strong><br />
the lower, middle, and upper intake locations (Note: the upper DISA sample in sub-sample 1 did not have enough<br />
water for particle size analysis).<br />
April 2011<br />
06/07109 23:31 06108/09 00:14 06/08/09 00:57 06/08/09 01:40<br />
.. -m<br />
DATEMTrME<br />
Selbig and Bannerman<br />
-<br />
A~, FO20>7110BBC - MOnOl.<br />
D:A .LOWE0F<br />
- 0-- 0A M ODLE1<br />
DSA. 00 UPPER<br />
FD(E F0-POWTI<br />
A.FI'DD-POINT<br />
* . 0FIXTPOW4<br />
300 350 401<br />
355
Selbig and Bannerman<br />
sand-sized material. In the absence <strong>of</strong> turbulent eddies, coarse<br />
particles with high specific density become stratified and tend <strong>to</strong><br />
be transported along the bot<strong>to</strong>m <strong>of</strong> the pipe floor. As the energy <strong>of</strong><br />
flow in the pipe increases, sediment concentration and particle<br />
size also increase. However, the distribution <strong>of</strong> coarse particles<br />
may remain stratified. Figures 7a and 7b show the distribution <strong>of</strong><br />
particles in water samples collected during the rising limb and<br />
peak <strong>of</strong> a s<strong>to</strong>rm hydrograph at the parking lot study area. Plots <strong>of</strong><br />
the lower, middle, and upper sub-samples are shown with<br />
corresponding fixed-point samples <strong>to</strong> highlight changing distributions<br />
with water depth. Mean concentrations <strong>of</strong> suspended<br />
sediment for the DISA and fixed-point samplers also are shown <strong>to</strong><br />
provide a correlation and comparison <strong>of</strong> sediment concentration<br />
and particle size with discharge (energy). At the onset <strong>of</strong> flow in<br />
the pipe, when discharge is low, particles are relatively small in<br />
diameter (d50
tions in the fixed-point samples generally stayed the same.<br />
Incorrect assumptions <strong>of</strong> PSDs in urban s<strong>to</strong>rmwater could have<br />
detrimental consequences when sizing treatment devices, such as<br />
wet detention ponds.<br />
Relationships between sediment concentration, organic content,<br />
and PSD in s<strong>to</strong>rmwater quality samples collected in the fixedpoint<br />
and DISA were consistent across a range <strong>of</strong> hydraulic<br />
conditions. These relationships were duplicated at two geograph-<br />
• ical locations with different land7use characteristics, giving<br />
confidence in the transferability <strong>of</strong> the results <strong>of</strong> this study <strong>to</strong><br />
other urban run<strong>of</strong>f conveyance systems. Because all samples<br />
evaluated as part <strong>of</strong> this study were collected in a field setting, it<br />
was not possible <strong>to</strong> compare the results collected from each<br />
sampler with a known quantity. Additional research in a<br />
controlled labora<strong>to</strong>ry environment could provide the information<br />
necessary <strong>to</strong> verify the ability <strong>of</strong> the DISA <strong>to</strong> collect a solids<br />
concentration representative <strong>of</strong> the entire water column.<br />
Credits<br />
The authors thank Becky Carvin <strong>of</strong> the U.S.. Geological Survey<br />
(Middle<strong>to</strong>n, Wisconsin) for her tireless efforts in the field. Any<br />
use <strong>of</strong> trade, product, or firm names is for descriptive purposes<br />
only and does not imply endorsement by the U.S. Government.<br />
Submitted for publication May 3, 2010; revised manuscript<br />
submitted September 7, 2010; accepted for publication September<br />
28, 2010.<br />
References.<br />
Agrawal, Y. C.; Pottsmith, H. C. (2000) Instruments for Particle-Size and<br />
Settling Velocity Observations in Sediment Transport. Mar. Geol.,<br />
168, 89-114.<br />
Bent, G. C.; Gray, J. R.; Smith, K. P.; Glysson; G. D. (2000) A Synopsis <strong>of</strong><br />
Technical Issues for Moni<strong>to</strong>ring Sediment in Highway and Urban<br />
Run<strong>of</strong>f. U.S. Geological Survey Open-File Report 00-497; U.S.<br />
Geological Survey: Res<strong>to</strong>n, Virginia, 51.<br />
Cristina, C.; Tramonte, J.; Sansalone, J. (2002) A Granulometry-Based<br />
Selection Methodology for Separation <strong>of</strong> Traffic-Generated Particles in<br />
Urban Highway Snowmelt Run<strong>of</strong>f. Water Air Soil Pollut., 136, 33-53.<br />
Clark, S. E.; Siu, C. Y. S.; Pitt, R.; Roenning, C. D.; Treese, D. P. (2008)<br />
Peristaltic Pump Au<strong>to</strong>samplers for <strong>Solids</strong> Measurement in S<strong>to</strong>rmwater<br />
Run<strong>of</strong>f. Water Environ. Res., 81, 192-200.<br />
Clark, S. E.; Siu, C. S. (2008) Measuring <strong>Solids</strong> Concentration in<br />
S<strong>to</strong>rmwater Run<strong>of</strong>f: Comparison <strong>of</strong> Analytical Methods. Environ. Sci.<br />
Technol., 42, 511-516.<br />
DeGroot, G. P.; Gulliver, J. S.; Mohseni, 0. (2009) Accurate Sampling <strong>of</strong><br />
Suspended <strong>Solids</strong>. Proceedings <strong>of</strong> the World Environmental and<br />
Water Resources Congress 2009, Kansas City, Missouri, May 17-21;<br />
American Society <strong>of</strong> Civil Engineers: Res<strong>to</strong>n, Virginia.<br />
deRidder, S..A.; Darcy, S. I.; Calvert, P. P.; Lenhart,-J. H. (2002) Influence <strong>of</strong><br />
Analytical Method, Data Summarization Method, and Particle-Size on<br />
Total Suspended <strong>Solids</strong> Removal Efficiency. Proceedings <strong>of</strong> the Ninth<br />
International Conference on Urban Drainage, Portland, Oregon, Sept.<br />
9-13; American Society <strong>of</strong> Civil Engineers: Res<strong>to</strong>n, Virginia.<br />
Selbig and Bannerman<br />
Edwards, T. K.; Glysson, G. D. (1999) Field Methods for Measurement <strong>of</strong><br />
Fluvial Sediment. Techniques <strong>of</strong> Water-Resources Investigations <strong>of</strong><br />
the U.S. Geological Survey, Book 3, Chapter C2; U.S. Geological<br />
Survey: Res<strong>to</strong>n, Virginia, 23.<br />
Fowler, G. D.; Roseen, R. M.; Ballestero, T. P.; Guo, Q.; Houle, J. (2009)<br />
.Sediment Moni<strong>to</strong>ring by Au<strong>to</strong>sampler in Comparison with Whole<br />
Volume Sampling for Parking Lot Run<strong>of</strong>f. Proceedings <strong>of</strong> the World<br />
Environmental and Water Resources Congress 2009, Kansas City,<br />
Missouri, May 17-21; American Society <strong>of</strong> Civil Engineers: Res<strong>to</strong>n,<br />
Virginia.<br />
Gray, J. R.; Glysson, G.' D.; Torcios, L. M.; Schwartz, G. (2000)<br />
Comparability <strong>of</strong> Suspended-Sediment Concentration and Total<br />
Suspended <strong>Solids</strong> Data. U.S. Geological Survey Water Resources<br />
Investigation Report 00-4191; U.S. Geological Survey: Res<strong>to</strong>n,<br />
Virginia.<br />
Horowitz, A. J. (1995) The Use <strong>of</strong> Suspended Sediment and Associated<br />
Trace Elements in Water Quality Studies, Special Publication No. 4;<br />
International Association <strong>of</strong> Hydrological Sciences: Wallingford,<br />
Oxfordshire, , United Kingdom, 58.<br />
ISCO (2008) 3700R/3740 Refrigerated <strong>Sample</strong>r Instruction Manual. http:/H<br />
www.isco.com/pcfiles/PartPDF3fUPOOOXKF.pdf (accessed December<br />
16, 2009).<br />
Kayhanian, M.; Young, T.; Stenstrom, M. (2005) Limitation <strong>of</strong><br />
Current <strong>Solids</strong> Measurements in S<strong>to</strong>rmwater Run<strong>of</strong>f. S<strong>to</strong>rmwater, 6<br />
(5), 40-58.<br />
Kayhanian, M.; Rasa, E.; Vichare, A.; Leatherbarrow, J. E. (2008) Utility<br />
<strong>of</strong> Suspended Solid Measurements for S<strong>to</strong>rm-Water Run<strong>of</strong>f Treatment.<br />
J. Environ. Eng., 134, 712-721.<br />
Lenhart, J. H.; Lehman, J. M. (2006) Measuring Total Volatile Suspended<br />
<strong>Solids</strong> in S<strong>to</strong>rmwater <strong>to</strong> Understand the Influence <strong>of</strong> Organic Matter<br />
on BMP Performance. Proceedings <strong>of</strong> the World Environmental and<br />
Water Resources Congress 2006, Chicago, Illinois, Oct. 19-21;<br />
American Society <strong>of</strong> Civil Engineers: Res<strong>to</strong>n, Virginia.<br />
Pedrick, J. H.; Tellessen, G. P. (2008) Do Au<strong>to</strong>matic <strong>Sample</strong>rs Suck?: The<br />
Effect <strong>of</strong> Au<strong>to</strong>matic <strong>Sample</strong>rs on <strong>Sample</strong>s Containing Coarse<br />
Sediment. Proceedings <strong>of</strong> S<strong>to</strong>rmcon, Orlando, Florida, Aug. 3-7;<br />
Forester Media Inc.: Santa Barbara, California.<br />
Roesner, L. A.; Pruden, A.; Kidner, E. M. (2007).Improved Pro<strong>to</strong>col for<br />
Classification and Analysis <strong>of</strong> S<strong>to</strong>rmwater-Borne <strong>Solids</strong>, 04-SW-4;<br />
Water Environment Research Foundation: Alexandria, Virginia, 124.<br />
Selbig, W. R.; Bannerman, R. T. (2007) Evaluation <strong>of</strong> Street Sweeping<br />
as a S<strong>to</strong>rmwater-Quality Management Tool in Three Residential<br />
Bdsins in Madison, Wisconsin. U.S. Geological Survey Scientific<br />
Investigations Report 2007-5156; U.S. Geological Survey: Res<strong>to</strong>n,<br />
Virginia, 120.<br />
Selbig, W. R.; Bannerman, R.; Bowman, G. (2007) Improving the<br />
Accuracy <strong>of</strong> Sediment-Associated Constituent Concentrations in<br />
Whole S<strong>to</strong>rm Water <strong>Sample</strong>s by Wet Sieving. J. Environ. Qual., 36<br />
(I), 226-232.<br />
Smith, K. P. (2002) Effectiveness <strong>of</strong> Three Best Management Practices for<br />
Highway-Run<strong>of</strong>f Quality Along the Southeast Expressway, Bos<strong>to</strong>n,<br />
Massachusetts. U.S. Geological Survey Water-Resources Investigations<br />
Report 02-4059, U.S. Geological Survey: Res<strong>to</strong>n, Virginia, 62.<br />
S<strong>to</strong>kes, G. G. (1851) On the Effect <strong>of</strong> Inertial Friction <strong>of</strong> Fluids on the<br />
Motion <strong>of</strong> Pendulums. Trans. Camb. Phil. Soc., 9, 8.<br />
April 2011 • 357
COPYRIGHT INFORMATION<br />
Author:<br />
Title: <strong>Development</strong> <strong>of</strong> a <strong>Depth</strong>-<strong>Integrated</strong> <strong>Sample</strong> <strong>Arm</strong> <strong>to</strong> <strong>Reduce</strong> <strong>Solids</strong><br />
Stratification Bias in S<strong>to</strong>rmwater Sampling<br />
Source: Water Environ Res 83 no4 Ap 2011 p. 347-57<br />
ISSN: 1061-4303<br />
DOI: 10.2175/106143010X12851009156006<br />
Publisher:<br />
Selbig, William R.; Bannerman, Roger T.<br />
Water Environment Federation<br />
601 Wythe Street, Alexandria, Va 22314-1994<br />
The magazine publisher is the copyright holder <strong>of</strong> this article and it is reproduced<br />
with permission. Further reproduction <strong>of</strong> this article in violation <strong>of</strong> the copyright is<br />
prohibited.<br />
This article may be used for research, teaching and private study purposes. Any substantial or systematic reproduction, re-distribution, re-selling, loan or sublicensing,<br />
systematic supply or distribution in any form <strong>to</strong> anyone is expressly forbidden. The publisher does not give any warranty express or implied or make<br />
any representation that the contents will be complete or accurate or up <strong>to</strong> date. The accuracy <strong>of</strong> any instructions, formulae and drug doses should be independently<br />
verified with primary sources. The publisher shall not be liable for any loss, actions, claims, proceedings, demand or costs or damages whatsoever or howsoever<br />
caused arising directly or indirectly in connection with or arising out <strong>of</strong> the use <strong>of</strong> this material.