transparencies - LHCb - CERN
transparencies - LHCb - CERN
transparencies - LHCb - CERN

Create successful ePaper yourself
Turn your PDF publications into a flip-book with our unique Google optimized e-Paper software.
arXiv:0902.3743v3 [hep-ph] 20 Mar 2009<br />
B Meson Decays<br />
Marina Artuso 1 , Elisabetta Barberio 2 and Sheldon Stone ∗1<br />
1 Department of Physics, Syracuse University, Syracuse, N. Y. 13244, USA<br />
2 School of Physics, University of Melbourne, Victoria 3010, Australia<br />
Email: Marina Artuso - artuso@physics.syr.edu; Elisabetta Barberio - barberio@unimelb.edu.au; Sheldon Stone ∗ -<br />
stone@physics.syr.edu;<br />
∗ Corresponding author<br />
Abstract<br />
We discuss the most important Physics thus far extracted from studies of B meson decays.<br />
Measurements of the four CP violating angles accessible in B decay are reviewed as well as direct<br />
CP violation. A detailed discussion of the measurements of the CKM elements Vcb and Vub from<br />
semileptonic decays is given, and the differences between resulting values using inclusive decays<br />
versus exclusive decays is discussed. Measurements of “rare” decays are also reviewed. We point<br />
out where CP violating and rare decays could lead to observations of physics beyond that of the<br />
Standard Model in future experiments. If such physics is found by directly observation of new<br />
particles, e.g. in LHC experiments, B decays can play a decisive role in interpreting the nature of<br />
these particles.<br />
PACS Codes: 13.25.Hw, 14.40.Nd, 14.65.Fy<br />
1
Contents<br />
1 Introduction 3<br />
1.1 How B’s Fit Into the Standard Model . . . . . . . . . . . . . . . . . . . . . . . . 4<br />
1.1.1 Dark Matter . . . . . . . . . . . . . . . . . . . . . . . . . . . . . . . . . . 6<br />
1.1.2 Baryogenesis . . . . . . . . . . . . . . . . . . . . . . . . . . . . . . . . . . 7<br />
1.1.3 The Hierarchy Problem . . . . . . . . . . . . . . . . . . . . . . . . . . . . 7<br />
1.2 B Decays as Probes for New Physics . . . . . . . . . . . . . . . . . . . . . . . . . 7<br />
2 Measurements of Mixing & CP Violation 8<br />
2.1 Neutral B Meson Mixing . . . . . . . . . . . . . . . . . . . . . . . . . . . . . . . 8<br />
2.2 CP Violation in the B System . . . . . . . . . . . . . . . . . . . . . . . . . . . . . 12<br />
2.2.1 Formalism of CP Violation in Neutral B Decays . . . . . . . . . . . . . . 13<br />
2.2.2 CP Violation for B Via the Interference of Mixing and Decay . . . . . . . 14<br />
2.2.3 Measurements of sin(2β) . . . . . . . . . . . . . . . . . . . . . . . . . . . . 16<br />
2.2.4 Measurements of α . . . . . . . . . . . . . . . . . . . . . . . . . . . . . . . 18<br />
2.2.5 The Angle γ . . . . . . . . . . . . . . . . . . . . . . . . . . . . . . . . . . 23<br />
2.2.6 The Angle χ . . . . . . . . . . . . . . . . . . . . . . . . . . . . . . . . . . 26<br />
2.2.7 Measurements of Direct CP Violation in B → Kπ Decays . . . . . . . . . 31<br />
2.3 Conclusions from CP Violation Measurements . . . . . . . . . . . . . . . . . . . . 32<br />
3 The CKM Parameter |Vcb| 32<br />
3.0.1 Beauty Quark Mass Definitions . . . . . . . . . . . . . . . . . . . . . . . . 33<br />
3.1 Determination Based on Exclusive Semileptonic B Decays . . . . . . . . . . . . . 35<br />
2
3.2 B → D ∗∗ ℓν Decays . . . . . . . . . . . . . . . . . . . . . . . . . . . . . . . . . . 39<br />
3.3 Determination Based on Inclusive Semileptonic B Decays . . . . . . . . . . . . . 40<br />
3.3.1 HQE Parameters . . . . . . . . . . . . . . . . . . . . . . . . . . . . . . . . 43<br />
3.4 Outlook . . . . . . . . . . . . . . . . . . . . . . . . . . . . . . . . . . . . . . . . . 46<br />
4 The CKM parameter |Vub| 46<br />
4.1 Determinations Based on Exclusive B Semileptonic Decays . . . . . . . . . . . . 47<br />
4.2 Determinations Based on Inclusive B Semileptonic Decays . . . . . . . . . . . . . 49<br />
5 Rare B Decays 54<br />
5.1 B → τν . . . . . . . . . . . . . . . . . . . . . . . . . . . . . . . . . . . . . . . . . 55<br />
5.2 Radiative B Decays . . . . . . . . . . . . . . . . . . . . . . . . . . . . . . . . . . 56<br />
5.3 B → ℓℓ . . . . . . . . . . . . . . . . . . . . . . . . . . . . . . . . . . . . . . . . . . 61<br />
5.4 B → Xsℓℓ . . . . . . . . . . . . . . . . . . . . . . . . . . . . . . . . . . . . . . . . 62<br />
6 Current Status of Overall CKM fits 64<br />
7 Conclusions 67<br />
1 Introduction<br />
The forces of nature generally reveal their properties by how they act on matter. On the most<br />
fundamental material scale that we are aware of matter is formed from fermions. These take<br />
two forms, leptonic matter and quark matter. The former do not have any strong interactions,<br />
that is they lack a property called “color charge”, which allow quarks to bind together either<br />
mesonically or baryonically. New and therefore as yet unknown forces could effect both leptons<br />
and quarks. Here, we concentrate on how such forces effect quarks, especially the b quark.<br />
Light matter consists mostly of u, d and s quarks. In 1963 Cabibbo showed that weak<br />
interactions of mesons and baryons containing s quarks were suppressed with respect to those<br />
3
without s quarks by an amount tan θC, where the “Cabibbo” angle θC must be determined<br />
experimentally [1]. The s was further shown to have an important and at that time a<br />
mystifying role, by the discovery of CP violation in K0 L decays in 1964 [2,3]. When the c quark<br />
was discovered in Nov. 1974 [4](though its existence was speculated earlier [5]), it became clear<br />
that θC was the mixing angle between two quark doublets, (c, s) and (u, d). However, it is<br />
not possible to generate a CP violating phase with only two quark doublets.<br />
This was recognized even before the discovery of the charm quark by Kobayashi and Maskawa,<br />
who postulated the existence of yet another quark doublet (b, t) [6], in work for which they<br />
were awarded the Nobel Prize in 2008. While the t quark is the heaviest, having a mass of 173<br />
GeV, they are difficult to produce and decay before they can form a hadron, thus excluding<br />
many otherwise possible studies. Much interesting work has been done with the s and c<br />
quarks, but in this article we discuss the physics of the b quark, which turns out to be the<br />
most interesting of the six quarks to study.<br />
1.1 How B’s Fit Into the Standard Model<br />
First we will discuss how particles formed with b-quarks fit into current paradigm of particle<br />
physics, the “Standard Model” (SM) [8]. The SM has at its basis the gauge group<br />
SU(3)xSU(2)xU(1). The first term corresponds to the strong interaction and SU(3) describes<br />
the octet of colored gluons which are the strong force carriers of quantum chromodynamics.<br />
SU(2)xU(1) describes the weak interaction and is the product of weak isospin and<br />
hypercharge. We speak of the fundamental objects being spin-1/2 quarks and leptons and the<br />
force carriers generally spin-1 objects. The spin-0 Higgs boson, yet to be discovered, is<br />
necessary for generating mass [9].<br />
Particles containing b quarks can be B 0 , B − , Bs, or Bc mesons, depending on whether the<br />
light anti-quark that it pairs with is ¯ d, ū, ¯s, or ¯c, or a baryon containing two other quarks.<br />
Mesons containing b and ¯ b quarks are also interesting especially for studies of quantum<br />
chromodynamics, but will not be discussed further in this article, as we will concentrate on<br />
weak decays and discuss strong interactions as an important and necessary complication that<br />
must be understood in many cases to extract information on fundamental b quark couplings.<br />
The quarks come in three repetitions called generations, as do the leptons. The first generation<br />
is d u, the second s c and the third b t. In the second and third generations the charge +2/3<br />
quark is heavier than the charge -1/3; the first generation has two very light quarks on the<br />
order of a few MeV with the d thought to be a bit heavier. 1 Decays usually proceed within<br />
1 Isospin invariance is related to the equality of u and d quark masses. The PDG [7] gives the u quark mass<br />
4
generations, so the c decays predominantly to the s quark via the quark level process<br />
c → W + s, though some decays do go to the first generation as c → W + d. The ratio of these<br />
amplitudes approximate the Cabibbo angle discussed earlier.<br />
The mixing matrix proposed by Kobayshi and Maskawa [6] parameterizes the mixing between<br />
the mass eigenstates and weak eigenstates as couplings between the charge +2/3 and -1/3<br />
quarks. We use here the Wolfenstein approximation [10] good to order λ4 :<br />
⎛<br />
⎞<br />
VCKM =<br />
=<br />
⎜<br />
⎝<br />
⎛<br />
⎜<br />
⎝<br />
Vud Vus Vub<br />
Vcd Vcs Vcb<br />
Vtd Vts Vtb<br />
⎟<br />
⎠ (1)<br />
1 − λ 2 /2 λ Aλ 3 (ρ − iη)<br />
−λ 1 − λ 2 /2 − λ 4 (1 + 4A 2 )/8 Aλ 2<br />
Aλ 3 (1 − ρ − iη) −Aλ 2 + Aλ 4 (1/2 − (ρ + iη)) 1 − A 2 λ 4 /2<br />
In the Standard Model A, λ, ρ and η are fundamental constants of nature like G, or αEM; η<br />
multiplies the imaginary i and is responsible for all Standard Model CP violation. We know<br />
λ=0.226, A ∼0.8 and we have constraints on ρ and η. Often the variables ρ and η are used<br />
where<br />
ρ + iη = (ρ + iη)(1 − λ 2 /2) = − VudV ∗ ub<br />
VcdV ∗ , (2)<br />
cb<br />
where the definition in terms of the CKM matrix elements is correct to all orders in λ [11].<br />
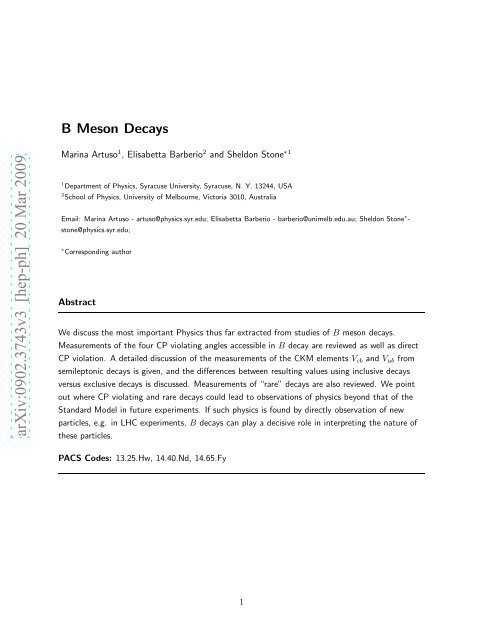
Applying unitarity constraints allows us to construct the six independent triangles shown in<br />
Figure 1. Another basis for the CKM matrix are four angles labeled as χ, χ ′ and any two of α,<br />
β and γ since α + β + γ = π [12]. (These angles are also shown in Figure 1.) CP violation<br />
measurements make use of these angles. 2<br />
B meson decays can occur through various processes. Some decay diagrams with intermediate<br />
charged vector bosons are shown in Figure 2. The simple spectator diagram shown Figure 2(a)<br />
has by far the largest rate. Semileptonic decays proceed through this diagram, and allow us to<br />
measure the CKM couplings Vcb and Vub by considering only the hadronic uncertainties due to<br />
the spectator quark. The color suppressed diagram Figure 2(b) exists only for hadronic decays.<br />
It can occur only when the colors of the quarks from the virtual W − decay match those of the<br />
initial B meson. Since this happens only 1/3 of the time in amplitude, the rate is down by<br />
almost an order of magnitude from the spectator decays. The annihilation Figure 2(c)<br />
describes the important decay B − → τ − ν and will be discussed in detail later. The W<br />
exchange Figure 2(d) diagram is small. The box diagram Figure 2(e) is the source of mixing in<br />
between 1.5-3.3 MeV and the d mass between 3.5-6.0 MeV, where the large range indicates the considerable<br />
uncertainties.<br />
2 The Belle collaboration defines φ2 ≡ α, φ1 ≡ β, and φ3 ≡ γ.<br />
5<br />
⎞<br />
⎟<br />
⎠ .
ds<br />
χ’<br />
sb<br />
χ<br />
V cd V cs *<br />
V udV us *<br />
V tsV tb *<br />
V csV cb *<br />
V usV ub *<br />
V tdV ts *<br />
uc<br />
V ubV cb *<br />
ct<br />
V cdV td *<br />
V udV cd *<br />
*<br />
V usV cs<br />
V cs V ts *<br />
VcbVtb *<br />
bd<br />
V ubV ud *<br />
tu<br />
VcbV * cd<br />
γ β<br />
α<br />
V ts V us *<br />
V tbV td *<br />
V tdV ud * V tbV ub *<br />
Figure 1: The 6 CKM triangles resulting from applying unitarity constraints to the indicated<br />
row and column. The CP violating angles are also shown.<br />
b<br />
W<br />
e, µ,<br />
ν<br />
-<br />
q<br />
u , c τ<br />
d s<br />
c or u<br />
b<br />
W<br />
q<br />
a) simple spectator<br />
-<br />
,<br />
q<br />
c or u<br />
u , c<br />
d s<br />
q<br />
b) hadronic: color suppressed<br />
b<br />
d<br />
W -<br />
d) W exchange<br />
c or u<br />
u<br />
b<br />
d<br />
W -<br />
u,c,t<br />
u,c,t<br />
W -<br />
e) box: mixing<br />
Figure 2: Some B decay diagrams.<br />
d<br />
b<br />
b W -<br />
u<br />
b<br />
c) annihilation<br />
W -<br />
t,c,u<br />
f) Penguin<br />
the B system. An analogous diagram exists also for the Bs meson. Finally the Penguin<br />
,<br />
-<br />
u, c<br />
ν,<br />
d, s<br />
s,d<br />
γ,g<br />
diagram Figure 2(f) is an example of one of several loop diagrams leading to “rare decays”<br />
that will be discussed in detail in a subsequent section.<br />
1.1.1 Dark Matter<br />
“Dark Matter” was first shown to exist by Zwicky studying rotation curves of galaxies [13].<br />
The motion could only be explained if there was massive cloud of matter that was not<br />
luminous. We still do not know what composes this dark matter, though hopes are it will be<br />
discovered at the LHC. An even more mysterious phenomena called “Dark Energy” may also<br />
have a connection to particle physics experiments [14], perhaps via “Extra Dimensions” [15].<br />
6
1.1.2 Baryogenesis<br />
When the Universe began with the Big Bang, there was an equal amount of matter and<br />
antimatter. Now we have mostly matter. How did it happen? Sakharov gave three necessary<br />
conditions: Baryon (B) number violation, departure from thermal equilibrium, and C and CP<br />
violation [16]. (The operation of Charge Conjugation (C) takes particle to anti-particle and<br />
Parity (P) takes a vector −→ r to − −→ r .)<br />
These criteria are all satisfied by the Standard Model. B is violated in Electroweak theory at<br />
high temperature, though baryon minus lepton number is conserved; in addition we need<br />
quantum tunneling, which is powerfully suppressed at the low temperatures that we now have.<br />
Non-thermal equilibrium is provided by the electroweak phase transition. C and CP are<br />
violated by weak interactions. However the violation is too small. The ratio of the number of<br />
baryons to the entropy in the observed part of the Universe needs to be ∼ 5 × 10 −11 , while the<br />
SM provides many orders of magnitude less. Therefore, there must be new physics [17].<br />
1.1.3 The Hierarchy Problem<br />
Our worry is why the Planck scale at ∼ 10 19 GeV is so much higher than the scale at which we<br />
expect to find the Higgs Boson, ∼100 GeV. As Lisa Randall said [18] “The gist of it is that the<br />
universe seems to have two entirely different mass scales, and we don’t understand why they<br />
are so different. There’s what’s called the Planck scale, which is associated with gravitational<br />
interactions. It’s a huge mass scale, but because gravitational forces are proportional to one<br />
over the mass squared, that means gravity is a very weak interaction. In units of GeV, which<br />
is how we measure masses, the Planck scale is 10 19 GeV. Then there’s the electroweak scale,<br />
which sets the masses for the W and Z bosons. These are particles that are similar to the<br />
photons of electromagnetism and which we have observed and studied well. They have a mass<br />
of about 100 GeV. So the hierarchy problem, in its simplest manifestation, is how can you have<br />
these particles be so light when the other scale is so big.” We expect the explanation lies in<br />
physics beyond the Standard Model [19].<br />
1.2 B Decays as Probes for New Physics<br />
When we make measurements on B decays we observe the contributions of SM processes as<br />
well as any other processes that may be due to physics beyond the SM or New Physics (NP).<br />
Other diagrams would appear adding to those in Figure 2 with new intermediate particles.<br />
Thus, when it is declared by those who say that there isn’t any evidence of NP in B decays, we<br />
7
have to be very careful that we have not absorbed such new evidence into what we declare to<br />
be SM physics. There are several approaches that can be followed.<br />
One approach is to simply predict the decay rate of a single process in the SM with known<br />
couplings and compare to the measurements. The classical case here is b → sγ and we will<br />
discuss this and other specific examples later. Another approach is make different<br />
measurements of the CKM parameters in different ways and see if they agree. This is normally<br />
done by measuring both angles and sides of the CKM triangle, but other quantities can also be<br />
used. This is the approach used by the CKM fitter [11] and UT fit groups [20]. In yet a third<br />
approach, the exact same quantity can be measured in several ways, even if cannot be<br />
predicted in the SM. An example here is measuring the CP violating angle β using<br />
B 0 → J/ψKS decays that proceed through the diagram in Figure 2(b), at least in the SM, and<br />
another process that uses the “Penguin” diagram in Figure 2(f), e.g. B 0 → φKS.<br />
The punch line is that if new, more massive particles exist in a mass range accessible to the<br />
LHC then they MUST contribute to rare and CP violating B decays! Even if measurements<br />
are precise enough only to limit the size of these effects, the properties of these new particles<br />
will be much better understood. This is the raison d’être for the further study of B decays.<br />
2 Measurements of Mixing & CP Violation<br />
2.1 Neutral B Meson Mixing<br />
Neutral B mesons can transform into their anti-particles before they decay. The diagrams for<br />
this process are shown in Figure 3 for the Bd. There is a similar diagram for the Bs. Although<br />
u, c and t quark exchanges are all shown, the t quark plays a dominant role mainly due to its<br />
mass, as the amplitude of this process is proportional to the mass of the exchanged fermion.<br />
b<br />
d<br />
d<br />
t,c,u t,c,u<br />
Wb<br />
b<br />
d<br />
t,c,u<br />
W<br />
t,c,u<br />
-<br />
Figure 3: The two diagrams for Bd mixing.<br />
Under the weak interactions the eigenstates of flavor degenerate in pure QCD can mix. Let the<br />
quantum mechanical basis vectors be {|1〉, |2〉} ≡ {|B 0 〉, |B 0 〉}. The Hamiltonian is then<br />
8<br />
d<br />
b
The Schrödinger equation is<br />
Diagonalizing we have<br />
H = M − i<br />
<br />
Γ =<br />
2<br />
i d<br />
<br />
| B0 (t)〉<br />
dt | B 0 (t)〉<br />
M M12<br />
M ∗ 12 M<br />
<br />
= H<br />
<br />
− i<br />
<br />
2<br />
| B 0 (t)〉<br />
| B 0 (t)〉<br />
Γ Γ12<br />
Γ ∗ 12 Γ<br />
<br />
<br />
. (3)<br />
∆m = mBH − mBL = 2 |M12| (5)<br />
∆Γ = ΓL − ΓH = 2 |Γ12| cos φ (6)<br />
where H refers to the heavier and L the lighter of the two weak eigenstates, and<br />
φ = arg (−M12/Γ12). We expect that ∆Γ is very small for B 0 mesons but should be significant<br />
for Bs mesons.<br />
Bd mixing was first discovered by the ARGUS experiment [21] (There was a previous<br />
measurement by UA1 indicating mixing for a mixture of B 0 d and B0 s [22]). At the time it was<br />
quite a surprise, since the top-quark mass, mt, was thought to be in the 30 GeV range. Since<br />
b-flavored hadrons are produced in pairs, it is possible to observe a mixed event by having both<br />
B’s decay semileptonically. Thus the number of events where both Bs decay into leptons of<br />
the same sign is indicative of mixing. We can define R as the ratio of events with same-sign<br />
leptons to the sum of same-sign plus opposite-sign dilepton events. This is related to the<br />
mixing probability. The OPAL data for R are shown in Figure 4 [23].<br />
Data from many experiments has been combined by “The Heavy Flavor Averaging Group,”<br />
(HFAG) to obtain an average value ∆md = (0.507 ± 0.004) × 10 12 ps −1 [24].<br />
The probability of mixing is related to the CKM matrix elements as [3,25]<br />
xd ≡ ∆m<br />
Γ = G2F 6π2BBdf2 ∗<br />
BmBτB|V tbVtd| 2 m 2 tF <br />
m2 t<br />
M 2 W<br />
(4)<br />
ηQCD, (7)<br />
where BB is a parameter related to the probability of the d and ¯ b quarks forming a hadron and<br />
must be estimated theoretically, F is a known function which increases approximately as m 2 t ,<br />
and ηQCD is a QCD correction, with value about 0.8. By far the largest uncertainty arises<br />
from the decay constant, fB.<br />
In principle fB can be measured. The decay rate of the annihilation process B − → ℓ − ν is<br />
proportional to the product of f 2 B |Vub| 2 . Of course there is a substantial uncertainty associated<br />
9
R<br />
1<br />
0.9<br />
0.8<br />
0.7<br />
0.6<br />
0.5<br />
0.4<br />
0.3<br />
0.2<br />
0.1<br />
OPAL<br />
0<br />
-2 0 2 4 6 8 10<br />
t (ps)<br />
Figure 4: The ratio, R, of same-sign to total dilepton events as a function of proper decay<br />
time, for selected B → D ∗+ Xℓ − ¯ν events. The jet charge in the opposite hemisphere is used to<br />
determine the sign correlation. The curve is the result of a fit to the mixing parameter.<br />
with |Vub|. The experimental evidence for B − → τ − ν is discussed in Section 5.1, and<br />
substantial uncertainty exists in the branching ratio measurement. Thus, we need to rely on<br />
theory for a value of fB.<br />
The ratio of Bs to Bd mixing frequency, however, provides a better situation in terms of<br />
reducing model dependent errors. Using Eq. 7 for Bd mixing and an analogous relation for Bs<br />
mixing and then dividing them results in<br />
The CKM terms are<br />
xd<br />
xs<br />
= BB<br />
BBs<br />
f2 B<br />
f2 mB τB<br />
mBs<br />
τBs Bs<br />
|V ∗<br />
tbVtd| 2<br />
|V ∗<br />
tb<br />
Vts| 2 . (8)<br />
|V ∗<br />
tb Vtd| 2 = Aλ 3 |(1 − ρ − iη)| 2 = Aλ 3 (ρ − 1) 2 + η 2 and (9)<br />
|V ∗<br />
tb Vts| 2 = Aλ 2 ,<br />
ignoring the higher order term in Vts. Solving the ratio of the two above equations for<br />
gives a circle centered at (1,0) in the ρ − η plane whose radius depends on xd/xs. The<br />
<br />
1 |Vtd|<br />
λ |Vts|<br />
theoretical errors are now due to the difference between having a light quark versus a strange<br />
quark in the B meson, called SU(3) splitting.<br />
For many years experiments at the Z 0 using e + e − colliders at both LEP and the SLC had set<br />
10
lower limits on B 0 s mixing [7]. In 2006 Bs mixing was measured by the CDF collaboration [26].<br />
The D0 collaboration had previously presented both a lower and an upper limit [27].<br />
We now discuss the CDF measurement. The probability, P(t) for a Bs to oscillate into a Bs is<br />
given as<br />
<br />
P(t) Bs → Bs = 1<br />
2 Γse −Γst [1 + cos (∆mst)] , (10)<br />
where t is the proper time.<br />
An amplitude A for each test frequency ω, is defined as [28]<br />
P(t) = 1<br />
2 Γse −Γst [1 + Acos (ωt)] . (11)<br />
For each frequency the expected result is either zero for no mixing, or one for mixing. No other<br />
value is physical, although measurement errors admit other values. Figure 5 shows the CDF<br />
results.<br />
Amplitude<br />
1<br />
0<br />
-1<br />
0 5 10 15 20 25 30<br />
Δm<br />
s<br />
[ps<br />
Figure 5: The measured amplitude values and uncertainties versus the BsBs oscillation frequency<br />
∆ms for a combination of semileptonic and hadronic decay modes from CDF.<br />
At ∆ms = 17.75 ps −1 , the observed amplitude A = 1.21 ± 0.20 (stat.) is consistent with unity,<br />
indicating that the data are compatible with BsBs oscillations with that frequency, while the<br />
amplitude is inconsistent with zero: A/σA = 6.05, where σA is the statistical uncertainty on A,<br />
the ratio has negligible systematic uncertainties. (This then is called a “6σ effect.) The<br />
measured value is<br />
∆ms = 17.77 ± 0.010 ± 0.07 ps −1 , (12)<br />
11<br />
-1<br />
]
where the first error is statistical and the second systematic.<br />
In order to translate the mixing measurements to constraints on the CKM parameters ρ and η,<br />
we need to use theoretical values for the ratios BB<br />
BBs<br />
and fB<br />
fBs<br />
in Eq. 8. It is interesting that in<br />
practice it is not possible to measure either of these numbers directly. It is usually assumed,<br />
however, that f B +, which could in principle be measured via the process B − → τ − ν is the<br />
same as fB. There is no way to measure fBs. The charm system, on the other hand, provides<br />
us with both D + → ℓ + ν and D + s → ℓ+ ν, and both rates have been measured. They also have<br />
been calculated in unquenched lattice quantum electrodynamics (QCD).<br />
The combined efforts of the HPQCD and UKQCD collaborations predict f D + = (207 ± 4)<br />
MeV [29], while the CLEO measurement is in astonishing agreement: (205.8±8.5±2.5)<br />
MeV [30]. Furthermore, the measurements of f D + s are not in such good agreement with the<br />
Follana et al. calculation of (241±3) MeV. The average of CLEO and Belle results as<br />
determined by Rosner and Stone is (273±10) MeV [31]. The discrepancy is at the 3 standard<br />
deviation level and not yet statistically significant, though it bears watching.<br />
Unfortunately, the group that has calculated f D + is not the same group that has determined<br />
f B +. The theoretical calculations used for the BB terms and the fB terms are summarized by<br />
Tantalo [32]. He suggests using values of fBs = (268 ± 17 ± 20) MeV,<br />
fBs/fB = 1.20 ± 0.02 ± 0.05, BBs = 0.84 ± 0.03 ± 0.055 and BB = 0.83 ± 0.01 ± 0.06. These<br />
numbers allow us to measure the length of one side of the CKM triangle using Eq. 8. Use of<br />
this measurement will be discussed in more detail in Section 6.<br />
2.2 CP Violation in the B System<br />
We have two quantum mechanical operators: Charge Conjugation, C, and Parity, P. When<br />
applied to a particle wavefunction C changes particle to antiparticle and vice-versa. Applying<br />
P to a wavefunction ψ(r) we have Pψ(r) = ψ(−r). The P operator can be thought of<br />
changing the natural coordinate system from right-handed to left-handed. If nature was blind<br />
to handedness, then P would be always conserved. By applying the P operator twice we end<br />
up with P 2 ψ(r) = ψ(r), so the eigenvalues of P are ±1. Therefore wave-functions, or particles<br />
represented by such wave-functions, have either intrinsic positive parity +1 (right-handed) or<br />
−1 (left-handed).<br />
Weak interactions, characterized by a combination of vector minus axial-vector currents, are<br />
known to be left-handed. Therefore, handedness matters and its well known that Parity is<br />
maximally violated in weak decays [3]. Since C changes left-handed particles to right-handed<br />
anti-particles, the product CP symmetry could have been preserved, but nature decided<br />
12
otherwise. Different particle transitions involve the different CP violating angles shown in<br />
Figure 1. Measuring these independently allows comparisons with measurements of the sides of<br />
the triangle and any differences in constraints in ρ and η can be due to the presence of new<br />
physics.<br />
Consider the case of a process B → f that goes via two amplitudes, A and B each of which has<br />
a strong part e. g. sA and a weak part wA. Then we have<br />
Γ(B → f) =<br />
<br />
|A|e i(sA+wA) i(sB+wB)<br />
+ |B|e 2 Γ(B → f) =<br />
<br />
|A|e i(sA−wA) i(sB−wB)<br />
+ |B|e 2 (13)<br />
(14)<br />
Γ(B → f) − Γ(B → f) = 2 |AB| sin(sA − sB)sin(wA − wB) . (15)<br />
Any two amplitudes will do, though its better that they be of approximately equal size. Thus<br />
charged B decays can exhibit CP violation as well as neutral B decays. In some cases, we will<br />
see that it is possible to guarantee that |sin(sA − sB)| is unity, so we can get information on<br />
the weak phases. In the case of neutral B decays, mixing serves as the second amplitude.<br />
2.2.1 Formalism of CP Violation in Neutral B Decays<br />
Consider the operations of Charge Conjugation, C, and Parity, P:<br />
C|B( −→ p )〉 = |B( −→ p )〉, C|B( −→ p )〉 = |B( −→ p )〉 (16)<br />
P |B( −→ p )〉 = −|B(− −→ p )〉, P |B( −→ p )〉 = −|B(− −→ p )〉 (17)<br />
CP |B( −→ p )〉 = −|B(− −→ p )〉, CP |B( −→ p )〉 = −|B(− −→ p )〉 . (18)<br />
For neutral mesons we can construct the CP eigenstates<br />
where<br />
|B 0 1<br />
1 〉 = √<br />
2<br />
<br />
|B 0 〉 − |B 0 〉<br />
|B 0 2〉 = 1 <br />
√ |B<br />
2<br />
0 〉 + |B 0 <br />
〉<br />
<br />
, (19)<br />
, (20)<br />
CP |B 0 1 〉 = |B0 1 〉 , (21)<br />
CP |B 0 2 〉 = −|B0 2 〉 . (22)<br />
Since B 0 and B 0 can mix, the mass eigenstates are a superposition of a|B 0 〉 + b|B 0 〉 which<br />
obey the Schrodinger equation<br />
i d<br />
<br />
dt<br />
a<br />
b<br />
<br />
= H<br />
<br />
a<br />
b<br />
<br />
=<br />
13<br />
<br />
M − i<br />
2 Γ<br />
<br />
a<br />
b<br />
<br />
. (23)
If CP is not conserved then the eigenvectors, the mass eigenstates |BL〉 and |BH〉, are not the<br />
CP eigenstates but are<br />
where<br />
|BL〉 = p|B 0 〉 + q|B 0 〉, |BH〉 = p|B 0 〉 − q|B 0 〉, (24)<br />
p = 1 1 + ǫB<br />
√ <br />
2 1 + |ǫB| 2, q = 1 1 − ǫB<br />
√ <br />
2 1 + |ǫB| 2.<br />
CP is violated if ǫB = 0, which occurs if |q/p| = 1.<br />
The time dependence of the mass eigenstates is<br />
(25)<br />
|BL(t)〉 = e −ΓLt/2 e imLt/2 |BL(0)〉 (26)<br />
|BH(t)〉 = e −ΓHt/2 e imHt/2 |BH(0)〉, (27)<br />
leading to the time evolution of the flavor eigenstates as<br />
|B 0 (t)〉 = e −(im+Γ<br />
<br />
2)t<br />
cos ∆mt<br />
2 |B0 (0)〉 + i q ∆mt<br />
sin<br />
p 2 |B0 |B<br />
<br />
(0)〉 (28)<br />
0 (t)〉 = e −(im+Γ<br />
<br />
2)t<br />
i p ∆mt<br />
sin<br />
q 2 |B0 (0)〉 + cos ∆mt<br />
2 |B0 <br />
(0)〉 , (29)<br />
where m = (mL + mH)/2, ∆m = mH − mL and Γ = ΓL ≈ ΓH, and t is the decay time in the<br />
B 0 rest frame, the so-called “proper time”. Note that the probability of a B 0 decay as a<br />
function of t is given by 〈B 0 (t)|B 0 (t)〉 ∗ , and is a pure exponential, e −Γt/2 , in the absence of CP<br />
violation.<br />
2.2.2 CP Violation for B Via the Interference of Mixing and Decay<br />
Here we choose a final state f which is accessible to both B 0 and B 0 decays [3]. The second<br />
amplitude necessary for interference is provided by mixing. Figure 6 shows the decay into f<br />
either directly or indirectly via mixing. It is necessary only that f be accessible directly from<br />
either state; however if f is a CP eigenstate the situation is far simpler. For CP eigenstates<br />
It is useful to define the amplitudes<br />
<br />
<br />
If<br />
A<br />
<br />
<br />
A<br />
CP |fCP 〉 = ±|fCP 〉. (30)<br />
A = 〈fCP |H|B 0 〉, A = 〈fCP |H|B 0 〉. (31)<br />
= 1, then we have “direct” CP violation in the decay amplitude, which we will discuss in<br />
detail later. Here CP can be violated by having<br />
λ = q A<br />
· = 1, (32)<br />
p A<br />
14
B o<br />
Figure 6: Two interfering ways for a B 0 to decay into a final state f.<br />
which requires only that λ acquire a non-zero phase, i.e. |λ| could be unity and CP violation<br />
can occur.<br />
Other useful variables, that are independent of any phase convention are<br />
<br />
φ12 = arg , and (33)<br />
Im Γ12<br />
M12<br />
= 1 − |q/p|4<br />
B o<br />
− M12<br />
Γ12<br />
≡ ASL(t).<br />
1 + |q/p| 4<br />
The first quantity can be related to CKM angles, while the second can be measured by the<br />
“semileptonic asymmetry,” or for that matter in any flavor specific decay [33]:<br />
ASL(t) = Γ[B0 (t) → ℓ−X] − Γ[B0 (t) → ℓ + X]<br />
Γ[B 0 (t) → ℓ−X] + Γ[B0 (t) → ℓ + ∆Γ<br />
=<br />
X] ∆M tan φ12 , (34)<br />
for either B 0 or for Bs mesons, separately.<br />
A comment on neutral B production at e + e − colliders is in order. At the Υ(4S) resonance<br />
there is coherent production of B 0 ¯ B 0 pairs. This puts the B’s in a C = −1 state. In hadron<br />
colliders, or at e + e − machines operating at the Z 0 , the B’s are produced incoherently. For the<br />
rest of this article we will assume incoherent production except where explicitly noted.<br />
The asymmetry, in the case of CP eigenstates, is defined as<br />
afCP = Γ B0 <br />
(t) → fCP − Γ B 0 <br />
(t) → fCP<br />
Γ (B0 , (35)<br />
(t) → fCP) + Γ<br />
which for |q/p| = 1 gives<br />
afCP =<br />
<br />
B 0 (t) → fCP<br />
1 − |λ| 2 cos (∆mt) − 2Imλsin(∆mt)<br />
1 + |λ| 2 . (36)<br />
For the cases where there is only one decay amplitude A, |λ| equals 1, and we have<br />
afCP<br />
f<br />
= −Imλsin(∆mt). (37)<br />
15
Only the factor −Imλ contains information about the level of CP violation, the sine term is<br />
determined by B mixing. In fact, the time integrated asymmetry is given by<br />
afCP<br />
x<br />
= −<br />
1 + x2Imλ = −0.48Imλ . (38)<br />
This is quite lucky for the study of Bd mesons, as the maximum size of the coefficient for any x<br />
is −0.5, close to the measured value of xd.<br />
Let us now find out how Imλ relates to the CKM parameters. Recall λ = q<br />
p<br />
is the part that comes from mixing:<br />
q<br />
p<br />
2<br />
Vtd)<br />
2 =<br />
|VtbVtd|<br />
= (V ∗<br />
tb<br />
2.2.3 Measurements of sin(2β)<br />
A · A . The first term<br />
(1 − ρ − iη) 2<br />
(1 − ρ + iη) (1 − ρ − iη) = e−2iβ and (39)<br />
Im q 2(1 − ρ)η<br />
= −<br />
p (1 − ρ) 2 = sin(2β). (40)<br />
+ η2 To evaluate the decay part we need to consider specific final states. For example, consider the<br />
final state J/ψKs. The decay diagram is shown in Figure 7. In this case we do not get a phase<br />
from the decay part because<br />
is real to order 1/λ 4 .<br />
A<br />
A<br />
= (VcbV ∗<br />
cs) 2<br />
|VcbVcs| 2<br />
In this case the final state is a state of negative CP, i.e. CP |J/ψKs〉 = −|J/ψKs〉. This<br />
introduces an additional minus sign in the result for Imλ. Before finishing discussion of this<br />
final state we need to consider in more detail the presence of the Ks in the final state. Since<br />
neutral kaons can mix, we pick up another mixing phase (similar diagrams as for B 0 , see<br />
Figure 3). This term creates a phase given by<br />
<br />
q<br />
=<br />
p K<br />
(V ∗<br />
cd<br />
Vcs) 2<br />
|VcdVcs|<br />
(41)<br />
2 , (42)<br />
which is real to order λ 4 . It necessary to include this term, however, since there are other<br />
formulations of the CKM matrix than Wolfenstein, which have the phase in a different<br />
location. It is important that the physics predictions not depend on the CKM convention. 3<br />
3 Here we don’t include CP violation in the neutral kaon since it is much smaller than what is expected in the<br />
B decay.<br />
16
In summary, for the case of f = J/ψKs, Imλ = − sin(2β). The angle β is the best measured<br />
CP violating angle measured in B meson decays. The process used is B 0 → J/ψKS, although<br />
there is some data used with the ψ(2S) or with KL (where the phase is + sin(2β)).<br />
b<br />
d<br />
W -<br />
c<br />
c J<br />
s<br />
d<br />
}<br />
}<br />
ψ<br />
Ks<br />
Figure 7: The Feynman diagram for the decay B 0 → J/ψK 0 .<br />
Although it is normally thought that only one decay amplitude contributes here, in fact one<br />
can look for the presence of another source of CP violation, presumably in the decay<br />
amplitude, by not assuming |λ| equals one in Eq. 36. Then the time dependence of the decay<br />
rate is given by<br />
afCP<br />
2Imλ 1 − |λ|2<br />
= − sin(∆mt) − cos(∆mt). (43)<br />
1 + |λ| 2 1 + |λ| 2<br />
Thus afCP (t) has both sin(∆mt) and cos(∆mt) terms, and the coefficients of these terms can<br />
be measured. Let us assign the labels<br />
S = − 2Imλ<br />
1 + |λ| 2,<br />
1 − |λ|2<br />
C =<br />
1 + |λ| 2.<br />
(Note that the sign of the S term changes depending on the CP of the final state, but not the<br />
C term.)<br />
The most precise measurements of sin(2β) have been made by the BaBar and Belle<br />
experiments [34]. These measurements are made at the Υ(4S) resonance using<br />
e + e − → Υ(4S) → B 0 B 0 , and with one of the neutral B’s decaying into J/ψK 0 . Because the<br />
Υ(4S) is a definite quantum state with C = −1, the formulae given above have to modified<br />
somewhat. One important change is the definition of t. The time used here is the difference<br />
between the decay time of the J/ψK 0 and the other B 0 , also called the “tagging” B because we<br />
need to determine its flavor, whether B 0 or B 0 , in order to make the asymmetry measurement.<br />
While we will not discuss flavor tagging in general, it is an important part of CP violation<br />
measurements. At the Υ(4S) once such very useful tag is that of high momentum lepton as a<br />
17<br />
(44)
-quark, part of a B 0 meson decays semileptonically into an ℓ − , while a b-quark decays into an<br />
e + . Other flavor tagging observables include the charge of kaons and fast pions. Modern<br />
experiments combine these in a “neural network,” to maximize their tagging efficiencies [35].<br />
The BaBar data are shown in Figure 8, Belle has similar results.<br />
Events / ( 0.4 ps )<br />
Raw Asymmetry<br />
300 0<br />
B tags<br />
200<br />
100<br />
0.4<br />
0.2<br />
0<br />
-0.2<br />
-0.4<br />
0<br />
B<br />
tags<br />
-5 0 5<br />
a)<br />
BABAR<br />
preliminary<br />
b)<br />
Δ t (ps)<br />
Figure 8: (a) The number of J/ψKs candidates in the signal region with either a B 0 tag (N B 0),<br />
or a B 0 tag (N B 0) as a function of ∆t. (b) The raw asymmetry, (N B 0 − N B 0)/(N B 0 + N B 0).<br />
The solid (dashed) curves represent the fit projections as functions of ∆t for both B 0 and B 0<br />
tags. The shaded regions represent the estimated background contributions.<br />
The average value as determined by the Heavy Flavor Averaging Group is<br />
sin(2β) = 0.671 ± 0.024, where the dominant part of the error is statistical. No evidence is<br />
found for a non-zero C term with the measured average given as 0.005±0.020 .<br />
Determining the sine of any angle gives a four-fold ambiguity in the angle. The decay mode<br />
B 0 → J/ψK ∗0 , K ∗0 → Ksπ 0 offers a way of measuring cos 2β and resolving the ambiguities.<br />
This is a subtle analysis that we will not go into detail on [36]. The result is that<br />
β = 42.14 +1.88<br />
−1.83 degrees.<br />
2.2.4 Measurements of α<br />
The next state to discuss is the CP+ eigenstate f ≡ π + π − . The simple spectator decay<br />
diagram is shown in Figure 9(a). For the moment we will assume that this is the only diagram,<br />
though the Penguin diagram shown in Figure 9(b) could also contribute; its presence can be<br />
18
W<br />
b<br />
-<br />
(a) u<br />
d<br />
d}<br />
u<br />
} π,<br />
d<br />
π, ρ<br />
+ ρ<br />
+<br />
(b)<br />
b<br />
u<br />
W -<br />
t<br />
g<br />
}<br />
}<br />
d<br />
u<br />
d<br />
u<br />
π, ρ<br />
π, + +<br />
ρ<br />
Figure 9: Tree (a) and Penguin (b) processes for neutral B decay into either π + π − or ρ + ρ − .<br />
C<br />
π + π -<br />
0 BaBar<br />
Belle<br />
Average<br />
-0.2<br />
-0.4<br />
-0.6<br />
-0.8<br />
H F A G<br />
ICHEP 2008<br />
PRELIMINARY<br />
-0.8 -0.6 -0.4 -0.2 0<br />
S<br />
Figure 10: Coefficients of the sine term S and the cosine term C in time dependent CP violation<br />
for neutral B decay into π + π − , showing BaBar and Belle results, and the HFAG average.<br />
Contours are shown at 60.7% confidence level.<br />
inferred because it would induce a non-zero value for C, the coefficient of the cosine term in<br />
Eq. 43. For this b → uūd process we have<br />
and<br />
A<br />
A = (V ∗ ud<br />
2<br />
Vub)<br />
2 =<br />
|VudVub|<br />
(ρ − iη) 2<br />
= e−2iγ<br />
(ρ − iη)(ρ + iη)<br />
(45)<br />
Im(λ) = Im(e −2iβ e −2iγ ) = Im(e 2iα ) = − sin(2α) (46)<br />
Time dependent CP violation measurements have been made by both the BaBar and Belle<br />
collaborations [37]. Both groups find a non-zero value of both C and S, though their values are<br />
not in particularly good agreement. The HFAG average is shown in Figure 10 along with the<br />
experimental results. The value of C clearly is not zero, thus demonstrating direct CP<br />
violation. (Historically, this was an important observation because it showed that CP violation<br />
could not be due to some kind of “superweak” model ala Wolfenstein [38].)<br />
19
Table 1: Branching ratios B → ρρ modes in units of 10−6 Mode BaBar Belle Average [7,24]<br />
ρ + ρ− 25.5 ± 2.1 +3.6<br />
−3.9 22.8 ± 3.8 +2.3<br />
ρ<br />
−2.6 24.2 ± 3.1<br />
+ ρ0 16.8 ± 2.2 ± 2.3 31.7 ± 7.1 +3.8<br />
ρ<br />
−6.7 18 ± 4<br />
0ρ0 0.92 ± 0.32 ± 0.14 0.4 +0.4<br />
−0.2 ± 0.3 0.74+0.30 −0.27<br />
The non-zero value of C shows the presence of at least two amplitudes, presumably tree and<br />
penguin, in addition to the mixing amplitude, making extraction of α difficult. All is not lost,<br />
however. Gronau and London [39] showed that α could be extracted without theoretical error<br />
by doing a full isotopic spin analysis of the ππ final state. The required measurements include:<br />
C , S, B(B + → π + π 0 ), B(B 0 → π 0 π 0 ), and B(B 0 → π 0 π 0 ). The last two items require a<br />
flavored tagged analysis that has not yet been done and whose prospects are bleak. Grossman<br />
and Quinn have showed, however, that an upper limit on Γ(B 0 → π 0 π 0 )/Γ(B + → π + π 0 ) can<br />
be used to limit the penguin shift to α [40]. Unfortunately, current data show a relative large<br />
B(B 0 → π 0 π 0 ) = (1.55 ± 0.19) × 10 −6 rate, compared with<br />
B(B 0 → π + π − ) = (5.16 ± 0.22) × 10 −6 , implying a large penguin contribution [7,24], and the<br />
limit is very weak.<br />
Use of the ρ + ρ − final state is in principle quite similar to π + π − , with some important caveats.<br />
First of all, it is a vector-vector final state and therefore could have both CP+ and CP-<br />
components. It is however possible, doing a full angular analysis to measure the CP violating<br />
phase separately in each of these two amplitudes. The best method for this is in the<br />
“transversity” basis and will be discussed later [41] in Section 2.2.6. It is possible, however, for<br />
one polarization component to be dominant and then the angular analysis might not be<br />
necessary. In fact the longitudinal polarization is dominant in this case. BaBar measures the<br />
fraction as 0.992 ± 0.024 +0.026<br />
−0.013 [42], and Belle measures it as 0.941+0.034 −0.040 ± 0.030 [43]. Thus we<br />
can treat this final state without worrying about the angular analysis and just apply a<br />
correction for the amount of transverse amplitude.<br />
In addition, ρ mesons are wide, so non-B backgrounds could be a problem and even if the<br />
proper B is reconstructed, there are non-resonant and possible a1π contributions.<br />
Furthermore, it has been pointed out that the large ρ width could lead to the violation of the<br />
isospin constraints and this effect should be investigated [44]. The relevant branching ratios<br />
are given in Table 1.<br />
Nevertheless, the small branching ratio for ρ 0 ρ 0 , if indeed it has been observed at all, shows<br />
that the effects of the Penguin diagram on the extracted value of sin(2α) are small, and this<br />
may indeed be a good way to extract a value of α. The time dependent decay rates separately<br />
20
Events / 2 ps<br />
Events / 2 ps<br />
Asymmetry<br />
30<br />
20<br />
10<br />
30<br />
20<br />
10<br />
1<br />
0.5<br />
0<br />
-0.5<br />
-1<br />
-6 -4 -2 0<br />
Δ t (ps)<br />
2 4 6<br />
Figure 11: The number of ρ + ρ − candidates in the signal region with either a B 0 tag (a) (N B 0),<br />
or a B 0 tag (b) (N B 0) as a function of ∆t. (c) The raw asymmetry, (N B 0 − N B 0)/(N B 0 + N B 0).<br />
The dashed curves represent the estimated backgrounds.<br />
for B 0 → ρ + ρ − and B 0 → ρ + ρ − and their difference are shown in Figure 11 from BaBar. In is<br />
interesting to compare these results with those in Figure 8. We see that the measured<br />
asymmetry in the ρ + ρ − decay more or less cancels that from B 0 − B 0 mixing inferring that<br />
sin(2α) is close to zero.<br />
Results from the time dependent CP violation analysis from both Belle and BaBar are shown<br />
in Figure 12.<br />
The data can be averaged and α determined by using the isospin analysis and the rates listed<br />
in Table 1. Unfortunately the precision of the data leads only to constraints. These have been<br />
determined by both the CKM fitter group [45] and the UT fit group [20]. These groups<br />
disagree in some cases. The CKM fitter group use a frequentist statistical approach, while UT<br />
fit uses a Bayseian approach. The basic difference is the that the Bayesian approach the<br />
theoretical errors are taken as having a Gaussian distribution. Here we show in Figure 13 the<br />
results from CKM fitter.<br />
The final state π + π − π 0 can also be used to extract α. Snyder and Quinn proposed that a<br />
Dalitz plot analysis of B → ρπ → π + π − π 0 can be used to unravel both α and the relative<br />
penguin-tree phases [46]. The Dalitz plot for simulated events unaffected by detector<br />
acceptance is shown in Figure 14.<br />
21<br />
(a)<br />
(b)<br />
(c)
C<br />
0.4<br />
0.2<br />
0<br />
-0.2<br />
-0.4<br />
H F A G<br />
LP 2007<br />
PRELIMINARY<br />
ρ + ρ -<br />
BaBar<br />
Belle<br />
Average<br />
-0.4 -0.2 0 0.2 0.4<br />
S<br />
Figure 12: Coefficients of the sine term S and the cosine term C in time dependent CP violation<br />
for neutral B decay into ρ + ρ − , showing BaBar and Belle results, and the HFAG average.<br />
Contours are shown at 60.7% confidence level.<br />
The task at hand is to do a time dependent analysis of the magnitude of the decay amplitudes<br />
and phases. The analyses of both collaborations allow for ρ(1450) and ρ(1700) contributions in<br />
addition to the ρ(770). There are a total of 26 free parameters in the fit. The statistics for<br />
such an analysis are not overwhelming: BaBar has about 2100 signal events [47], while Belle<br />
has about 1000 [48].<br />
The results for the confidence levels of α found by both collaborations are shown in Figure 15.<br />
Note that there is also a mirror solution at α+180 ◦ . The Belle collaboration uses their<br />
measured decay rates for B + → ρ + π 0 and B + → ρ 0 π + coupled with isospin relations [49] to<br />
help constrain α.<br />
The <strong>LHCb</strong> experiment expects to be able to significantly improve on the determination of α<br />
using the ρπ mode. They expect 14,000 events in for an integrated luminosity of 2 fb −1 , with a<br />
signal to background ratio greater than 1 [50]. It is expected that this amount of data can be<br />
accumulated in one to two years of normal LHC operation.<br />
Combining all the data, both the CKM fitter and UT fit groups derive a the confidence level<br />
plot for α shown in Figure 16. There is a clear disagreement between the two groups, UT fit<br />
preferring a solution in the vicinity of 160 ◦ , and CKM fitter a value closer to 90 ◦ . The CKM<br />
fitter group believes that this is due to the UT fit group’s use of Bayesian statistics which they<br />
criticize [51].<br />
22
1 – CL<br />
1.2<br />
1<br />
0.8<br />
0.6<br />
0.4<br />
0.2<br />
C K M<br />
f i t t e r<br />
LP 2007<br />
B→ρρ (WA)<br />
B→ρρ (BABAR)<br />
B→ρρ (Belle)<br />
0<br />
0 20 40 60 80 100 120 140 160 180<br />
α (deg)<br />
Figure 13: The probability density, defined as 1 - CL (confidence level) for the angle α as<br />
determined by measurements of B → ρρ.<br />
2.2.5 The Angle γ<br />
<br />
The angle γ = arg<br />
− VudV ∗ ub<br />
VcdV ∗<br />
cb<br />
<br />
. It can be viewed as the phase of the |Vub| matrix element, with<br />
respect to |Vcb|. Interference measurements are required to determine phases. We can use<br />
neutral or even charged B decays to measure γ, and there are several ways to do this without<br />
using any theoretical assumptions, as is the case for α and β. The first relies on the color<br />
suppressed tree diagrams shown in Figure 17, and the second on using the interference in Bs<br />
mixing. At first glance, the diagrams in Figure 17 don’t appear to have any interfering<br />
components. However, if we insist that the final state is common to D 0 and D 0 , then we have<br />
two diagrams which differ in that one has a b → c amplitude and the other a b → u amplitude,<br />
the relative weak phase is then γ. Explicitly the amplitudes are defined as<br />
A(B − → D 0 K − ) ≡ AB (47)<br />
A(B − → D 0 K − ) ≡ ABrBe i(δB−γ) ,<br />
where rB reflects the amplitude suppression for the b → u mode and δB is the relative phase.<br />
We have not yet used identical final states for D 0 and D 0 decays, yet we can see that there will<br />
be an ambiguity in our result between δB and γ that could be resolved by using different D 0<br />
decay modes.<br />
There are several suggestions as to different D 0 decay modes to use. In the original paper on<br />
this topic Gronau and Wyler [52] propose using CP eigenstates for the D 0 decay, such as<br />
23
m 2 (π – π 0 ) (GeV/c 2 ) 2<br />
30<br />
25<br />
20<br />
15<br />
10<br />
5<br />
B 0 → π + π – π 0<br />
interference regs.<br />
0<br />
0 5 10 15 20 25 30<br />
m 2 (π + π 0 ) (GeV/c 2 ) 2<br />
5<br />
4<br />
3<br />
2<br />
1<br />
0<br />
22 23 24 25 26 27<br />
Figure 14: Dalitz plot for Monte-Carlo generated B 0 → ρπ → π + π − π 0 decays. The decays have<br />
been simulated without any detector effect and the amplitudes for ρ + π − , ρ − π + and ρ 0 π 0 have<br />
all been generated with equal magnitudes in order to have destructive interferences where the<br />
ρ bands overlap. The main overlap regions between the ρ bands are indicated by the hatched<br />
areas. Adapted from [47].<br />
K + K − , π + π − etc.., combining with charge specific decays and comparing B − with B + decays.<br />
In the latter, the sign of the strong phase is flipped with respect to the weak phase. In fact<br />
modes such as D ∗0 or K ∗− can also be used. (When using D ∗0 there is a difference in δB of π<br />
between γD 0 and π 0 D 0 decay modes [53].)<br />
It is convenient to define the follow variables:<br />
<br />
Γ(B<br />
ACP ± =<br />
− → D 0(∗)<br />
CP ± K−(∗) ) − Γ(B + → D 0(∗)<br />
<br />
Γ(B− → D 0(∗)<br />
CP ± K−(∗) ) + Γ(B + → D 0(∗)<br />
<br />
Γ(B− → D 0(∗)<br />
CP ± K−(∗) ) + Γ(B + → D 0(∗)<br />
RCP ± =<br />
CP ± K+(∗) <br />
)<br />
CP ± K+(∗) )<br />
CP ± K+(∗) <br />
)<br />
<br />
Γ(B− → D0(∗) K−(∗) ) + Γ(B + → D 0(∗) K +(∗) <br />
) /2<br />
These are related to the variables defined in Eq. 47 as<br />
, (48)<br />
RCP ± = 1 + r 2 B ± 2r cos δB cos γ, (49)<br />
ACP ± = ±2r sin δB sin γ/RCP ±.<br />
Measurements have been made by the BaBar, Belle and CDF collaborations [54]. These data,<br />
however, are not statistically powerful enough by themselves to give a useful measurement of<br />
24<br />
.
1 C.L.<br />
1<br />
0.8<br />
0.6<br />
0.4<br />
0.2<br />
C.L.=68.3%<br />
0<br />
0 30 60 90 120 150 180<br />
(degrees)<br />
α<br />
1-C.L.<br />
1<br />
0.75<br />
0.5<br />
0.25<br />
0<br />
0 50 100 150<br />
α (deg)<br />
Figure 15: The experimental confidence levels for α as determined separately by the Belle<br />
collaboration (left) and the BaBar collaboration (right). The dotted curve for Belle shows the<br />
result without using constraints from charged B to ρπ final states.<br />
1 CL<br />
1.2<br />
1<br />
0.8<br />
0.6<br />
0.4<br />
0.2<br />
CK M<br />
f i t t e r<br />
ICHEP 08<br />
Β→ππ/ρρ/ρπ (WA)<br />
Β→ππ/ρρ/ρπ (BABAR)<br />
Β→ππ/ρρ/ρπ (Belle)<br />
0<br />
0 20 40 60 80 100 120 140 160 180<br />
α (deg)<br />
Probability density<br />
0.008<br />
0.006<br />
0.004<br />
0.002<br />
0<br />
0 50 100 150<br />
Figure 16: The experimental confidence levels for α as determined separately by the CKM fitter<br />
and UT fit groups.<br />
γ. Atwood, Dunietz and Soni suggested using double-Cabibbo suppressed decays as an<br />
alternative means of generating the interference between decay amplitudes [55]. For example<br />
the final state B − → D 0 K − can proceed via the tree level diagram in Figure 2(a) when the<br />
W − → ūs. Then if we use the doubly-Cabibbo suppressed decay D 0 → K + π − , we get a final<br />
state that interferes with the D 0 K − final state with the D 0 → K + π − , which is Cabibbo<br />
allowed. The advantage of this method, besides extending the number of useful final states, is<br />
that both amplitudes are closer to being equal than in the above method, which can generate<br />
larger interferences. Any doubly-Cabibbo suppressed decay can be used. Similar equations<br />
exist relating the measured parameters to γ and the strong phase shift. Measurements have<br />
been made mostly using the K ± π ∓ final state [56]. Again, these attempts do not yet produce<br />
accurate results.<br />
25<br />
o<br />
α [ ]
a)<br />
b<br />
u<br />
W -<br />
b)<br />
c<br />
W<br />
b<br />
u<br />
s<br />
u<br />
-<br />
u<br />
} D<br />
c}<br />
D<br />
- u<br />
} K<br />
s<br />
u K<br />
o o<br />
Figure 17: Two diagrams for a charged B decay into a neutral D meson and a charged kaon.<br />
Thus far, the best method for measuring γ uses the three-body final state KSπ + π − . Since the<br />
final state is accessible by both D 0 and D 0 decays interference results. By its very nature a<br />
three-body state is complicated, and consists of several resonant and non-resonant parts. It is<br />
typically analyzed by examining the Dalitz plot where two of the possible three sub-masses<br />
(squared) are plotted versus one another [57]. In this way, the phase space is described as a<br />
uniform density and thus any resonant structure is clearly visible. For our particular case a<br />
practical method was suggested by Giri et al. [58], where the decay is analyzed in separate<br />
regions of the Dalitz plot. Results from this analysis have been reported by BaBar [59] and<br />
Belle [60]. BaBar finds γ = (76 ± 22 ± 5 ± 5) ◦ , and Belle finds γ = (76 +12<br />
−13 ± 4 ± 5)◦ . In both<br />
cases the first error is statistical, the second systematic, and the third refers to uncertainties<br />
caused by the Dalitz plot model. (There is also a mirror solution at ±180 ◦ .)<br />
It has been shown [61] that measurement of the amplitude magnitudes and phases found in the<br />
decays of ψ(3770) → (CP ± Tag)(KSπ + π − )D provide useful information that help the narrow<br />
model error. The CLEO collaboration is working on such an analysis, and preliminary results<br />
have been reported [62]. (CLEO also is working on incorporating other D 0 decay modes.)<br />
Both the CKM fitter and UT fit groups have formed liklihoods for γ based on the measured<br />
results, as shown in Figure 18. In this case CKM fitter and UT fit agree on the general shape<br />
of the liklihood curve. The CKM fitter plot shows a small disagreement between the Daltiz<br />
method and a combination of the other two methods.<br />
2.2.6 The Angle χ<br />
The angle χ shown in Figure 1 is the phase that appears in the box diagram for Bs mixing,<br />
similar to the diagram for B 0 mixing shown in Figure 3, but with the d quark replaced by an s<br />
quark. The analogous mode to B 0 → J/ψKs in the Bs system is Bs → J/ψη. The Feynman<br />
26<br />
}<br />
-
1 - CL<br />
1.0<br />
0.8<br />
0.6<br />
0.4<br />
0.2<br />
CKM<br />
f i t t e r<br />
ICHEP 08<br />
D(*) K(*) GLW + ADS<br />
D(*) K(*) GGSZ<br />
Full Frequentist treatment on MC basis preliminary<br />
0.0<br />
0 20 40 60 80 100 120 140 160 180<br />
γ (deg)<br />
WA<br />
Combined<br />
Probability density<br />
0.001<br />
0.0005<br />
0<br />
-100 0 100<br />
Figure 18: The experimental confidence levels for γ as determined separately by the CKM fitter<br />
and UT fit groups.<br />
diagrams are shown in Figure 19. This is very similar to measuring β so χ is often called βs. 4<br />
b<br />
s<br />
W -<br />
c<br />
}c J<br />
s<br />
s<br />
}<br />
ψ<br />
η, φ<br />
Figure 19: The Feynman diagram for the decay Bs → J/ψη or φ.<br />
Since there are usually two photons present in the η decay, experiments at hadron colliders,<br />
which can perform time-dependent studies of Bs mesons, preferentially use the J/ψφ final<br />
state. This, unfortunately, introduces another complexity into the problem; as the Bs is<br />
spinless the total angular momentum of the final state particles must be zero. For a decay into<br />
a vector and scalar, such as J/ψη, this forces the vector J/ψ to be fully longitudinally<br />
polarized with respect to the decay axis. For a vector-vector final state both angular<br />
momentum state vectors are either longitudinal (L), both are transverse with linear<br />
polarization vectors parallel () or they are perpendicular (⊥) to one another [63]. Another<br />
way of viewing this is that a spin-0 B decay into two massive vector mesons can form CP even<br />
4<br />
Note that φs = −2χ, since −2χ = arg(VtbV ∗<br />
ts) 2 /(VcbV ∗<br />
cs) 2 , whereas φs is arg(M12/Γ12), with arg(M12) =<br />
VtbV ∗<br />
ts) 2 /(VcbV ∗<br />
cs) 2 , and arg(Γ12) is a linear combination of (VcbV ∗<br />
cs) 2 , VcbV ∗<br />
csVubV ∗ us, and (VubV ∗ us) 2 .<br />
27<br />
o<br />
γ [ ]
states with L=0 or 2, and a CP odd state with L=1. The relative populations in the two CP<br />
states are determined by strong interactions dynamics, but to study the weak phase here we<br />
are not particularly interested in the actual amount, unless of course one state dominated. We<br />
do not expect this to be the case however, since the SU(3) related decay B 0 → J/ψK ∗0 ,<br />
K ∗0 → K + π − has a substantial components of both CP states; the PDG quotes gives the<br />
longitudinal fraction as (80 ± 8 ± 5)% [7].<br />
The even and odd CP components can be disentangled by measuring the appropriate angular<br />
quantities of each event. Following Dighe et al. [64], we can decompose the decay amplitude<br />
for a Bs as<br />
A(Bs → J/ψφ) = A0(mφ)/Eφǫ ∗L<br />
J/ψ − A ǫ ∗T<br />
J/ψ /√ 2 − iA⊥ǫ ∗ φ · ˆp/ √ 2, (50)<br />
where ǫ J/ψ and ǫφ are polarization 3-vectors in the J/ψ rest frame, ˆp is a unit vector giving<br />
the direction of the φ momentum in the J/ψ rest frame, and Eφ is the energy of the φ in the<br />
J/ψ rest frame. We note that the corresponding amplitude for the ¯ Bs decay are Ā0 = A0,<br />
Ā = A , and Ā⊥ = −A⊥. The amplitudes are normalized so that<br />
dΓ(Bs → J/ψφ)/dt = |A0| 2 + |A | 2 + |A⊥| 2<br />
. (51)<br />
The φ meson direction in the J/ψ rest frame defines the ˆx direction. The ˆz direction is<br />
perpendicular to the decay plane of the K + K − system , where py(K + ) ≥ 0. The decay<br />
direction of the ℓ + in the J/ψ rest frame is described by the angles (θ, φ). The angle ψ is that<br />
formed by the K + direction with the ˆx-axis in the φ rest frame. Figure 20 shows the angles.<br />
Figure 20: Pictoral description of the decay angles. On the left θ and φ defined in the J/ψ rest<br />
frame and on the right ψ defined in the φ rest frame. (From T. Kuhr [65].).<br />
28
The decay width can be written as<br />
d 4 Γ[Bs → (ℓ + ℓ − ) J/ψ(K + K − )φ]<br />
dcos θ dφ dcos ψ dt<br />
= 9<br />
32π [2|A0| 2 cos 2 ψ(1 − sin 2 θ cos 2 φ)<br />
+ sin 2 ψ{|A | 2 (1 − sin 2 θ sin 2 φ) + |A⊥| 2 sin 2 θ − Im(A ∗ A⊥)sin 2θ sin φ}<br />
+ 1<br />
√ 2 sin 2ψ{Re(A ∗ 0A )sin 2 θ sin 2φ + Im(A ∗ 0A⊥)sin 2θ cos φ}] . (52)<br />
The decay rate for Bs can be found by replacing A⊥ in the above expression with −A⊥.<br />
Another complexity arises from the expectation that the width difference ∆Γs/Γs ≈ 15%. This<br />
complicates the time dependent rate equations. For convenience, setting −→ ρ ≡ (cos θ,φ,cos ψ),<br />
we have for the decay width for Bs:<br />
where<br />
d 4 P(t, ρ)<br />
dtdρ<br />
∝ |A0| 2 T+f1(ρ) + |A | 2 T+f2(ρ)<br />
+ |A⊥| 2 T−f3(ρ) + |A ||A⊥|U+f4(ρ)<br />
+ |A0||A |cos(δ )T+f5(ρ)<br />
+ |A0||A⊥|V+f6(ρ), (53)<br />
<br />
T± = (1 ± cos(2χ))e −ΓLt −ΓHt<br />
+ (1 ∓ cos(2χ))e <br />
/2,<br />
U± = ±e −Γt <br />
× sin(δ⊥ − δ)cos(∆mst) − cos(δ⊥ − δ)cos(2χ)sin(∆mst) <br />
± cos(δ⊥ − δ)sin(2χ)sinh(∆Γt/2) ,<br />
V± = ±e −Γt × [sin(δ⊥)cos(∆mst)<br />
− cos(δ⊥)cos(2χ)sin(∆mst)<br />
± cos(δ⊥)sin(2χ)sinh(∆Γt/2)] .<br />
f1(ρ) = 2cos 2 ψ(1 − sin 2 θ cos 2 φ),<br />
f2(ρ) = sin 2 ψ(1 − sin 2 θ sin 2 φ),<br />
f3(ρ) = sin 2 ψ sin 2 θ,<br />
f4(ρ) = − sin 2 ψ sin(2θ)sin φ,<br />
f5(ρ) = sin(2ψ)sin 2 θ sin(2φ)/ √ 2,<br />
f6(ρ) = sin(2ψ)sin(2θ)cos φ/ √ 2.<br />
The quantities δ⊥ and δ are the strong phases of A⊥ and A relative to A0, respectively [66].<br />
The expression for Bs mesons can be found by substituting U+ → U− and V+ → V−.<br />
29
The most interesting quantities to be extracted from the data are χ and ∆Γ. There are many<br />
experimental challenges: the angular and lifetime distributions must be corrected for<br />
experimental acceptances; flavor tagging efficiencies and dilutions must be evaluated;<br />
backgrounds must be measured. Both the CDF [67] and D0 [68] experiments have done this<br />
complicated analysis. Updated results as of this writing are summarized by the CKM fitter<br />
derived limits shown in Figure 21.<br />
Figure 21: Constraints at 68% confidence level in the (φs, ∆Γs) plane. Overlaid are the<br />
constraints from the CDF and D0 measurements, the constraint from ∆Γs = cos φs∆ΓSM s ,<br />
the constraint from the flavor specific Bs lifetime [24], and the overall combination. The SM<br />
prediction is also given. From [69].<br />
The Standard Model allowed region is a very thin vertical band centered near zero at φs of<br />
-0.036±0.002 (shown in red). The region labeled “all” (green) shows the allowed region at 68%<br />
confidence level. Although the fit uses several input components besides the CP asymmetry<br />
measurements in Bs → J/ψφ, including use of measured total widths introduced via the<br />
constraint equation ∆Γs = cos φs∆Γ SM<br />
s , it is the measurement of φs that dominates the fit<br />
result. We see that there is a discrepancy that may be as large as 2.7 standard deviations [69].<br />
While this is as not yet significant, it is very tantalizing. The <strong>LHCb</strong> experiment plans to vastly<br />
improve this measurement [70].<br />
It has been pointed out, however, that there is likely an S-wave K + K − contribution in the<br />
region of the φ that contributes 5-10% of the event rate as estimated using D + s decays [71]. For<br />
example, analysis of the analogous channel B0 → J/ψK ∗0 reveals about 8% S-wave in the Kπ<br />
30
system under the K ∗0 , and BaBar has used this to extract a value for cos 2β thus removing an<br />
ambiguity in β [72]. The S-wave amplitude and phase needs to be added to Eq. 53. Note that<br />
the errors will increase due to the addition of another amplitude and phase. The S-wave can<br />
manifest itself as a π + π − , so it is suggested that the decay Bs → J/ψf0(980) be used to<br />
measure χ; here the f0 → π + π − [71]; the estimate is that the useful f0 rate would be about<br />
20% of the φ rate, but the J/ψf0 is a CP eigenstate, so an an angular analysis is unnecessary,<br />
and these events may provide a determination of χ with an error comparable to that using<br />
J/ψφ.<br />
2.2.7 Measurements of Direct CP Violation in B → Kπ Decays<br />
Time integrated asymmetries of B mesons produced at the Υ(4S) resonance can only be due to<br />
direct CP asymmetry, as the mixing generated asymmetry must integrate to zero due to the<br />
fact that the initial state has J PC = 1 −− . The first evidence for such direct CP violation at<br />
the greater than four standard deviation level in the K ∓ π ± final state was given by<br />
BaBar [73]. The latest BaBar result is [74]<br />
AK−π + = Γ(B0 → K−π + ) − Γ(B0 → K + π− )<br />
Γ(B 0 → K−π + ) + Γ(B0 → K + π− = −0.107 ± 0.016+0.006 −0.004 , (54)<br />
)<br />
showing a large statistical significance.<br />
This result was confirmed by the Belle collaboration, but Belle also measured the isospin<br />
conjugate mode. Consider the two-body decays of B mesons into a kaon and a pion, shown in<br />
Figure 22. For netural and charged decays, it can proceed via a tree level diagram (a) or a<br />
Penguin diagram (b). There are two additional decay diagrams allowed for the B − , the<br />
color-suppressed tree level diagram (c) and the elusive “Electroweak” Penguin diagram in (d).<br />
(So named because of the intermediate γ or Z boson.) Since it is expected that diagrams (c)<br />
and (d) are small, the direct CP violating asymmetries in both charged and neutral modes<br />
should be the same. Yet Belle observed [75]<br />
AK∓π0 = Γ(B− → K−π0 ) − Γ(B + → K + π0 )<br />
Γ(B− → K−π0 ) + Γ(B + → K + π0 = 0.07 ± 0.016 ± 0.01 . (55)<br />
)<br />
The Belle data are shown in Figure 23.<br />
The difference between A K − π + and A K ∓ π 0 is not naively expected in the Standard Model and<br />
Belle suggests that this may be a sign of New Physics. Peskin commented on this<br />
possibility [76].<br />
31
(a) (b)<br />
b<br />
W -<br />
u<br />
s}<br />
d, u u<br />
} π , π<br />
d, u<br />
b<br />
u<br />
W -<br />
K<br />
u<br />
u<br />
s } u K<br />
+ o<br />
} πo<br />
b<br />
d, u<br />
(c) (d)<br />
W -<br />
t<br />
g<br />
γ, Z<br />
b<br />
W -<br />
t<br />
s<br />
u u<br />
o<br />
} }<br />
s<br />
u K<br />
u<br />
d, u π , π<br />
u<br />
u}<br />
}<br />
π<br />
K<br />
o<br />
+ o<br />
Figure 22: Processes for B 0 → K − π + and B − → K − π 0 , (a) via tree and (b) Penguin diagrams,<br />
and B − → K − π 0 (c) via color-suppressed tree and (d)“Electroweak” Penguin diagrams.<br />
2.3 Conclusions from CP Violation Measurements<br />
All CP violation in the quark sector is proportional to the parameter η in Eq. 1. In fact all<br />
CP asymmetries are proportional to the “Jarlskog Invariant”, J = A 2 λ 6 η, which represents<br />
the equal area of all the CKM triangles [77]. Since we know the value of these three numbers,<br />
we do know the amount of CP violation we can expect, even without making the<br />
measurements. We also can estimate the amount of CP violation necessary using cosmology.<br />
To reproduce the observed baryon to entropy ratio requires many orders of magnitude more<br />
CP violation than thus far found in heavy quark decays [78]. Thus we believe there are new<br />
sources of CP violation that have not yet been found.<br />
3 The CKM Parameter |Vcb|<br />
There are two experimental methods to determine |Vcb|: the exclusive method, where |Vcb| is<br />
extracted by studying the exclusive B → D (∗) ℓ − ¯ν decay process; and the inclusive method,<br />
which uses the semileptonic decay width of b-hadron decays. In both methods, the extraction<br />
of |Vcb| is systematics limited and the dominant errors are from theory. The inclusive and<br />
exclusive determinations of |Vcb| rely on different theoretical calculations of the hadronic<br />
matrix element needed to extract it from measured quantities, and make use of different<br />
32
Figure 23: The beam constrained mass distributions from Belle in units of GeV for the four<br />
different indicated final states. The dotted curves indicate peaking backgrounds, the dot-dashed<br />
curves the signal and the solid curves the sum. The differences in event numbers between the<br />
charge conjugate modes are apparent.<br />
techniques which, to a large extent, have uncorrelated experimental uncertainties. Thus, the<br />
comparison between inclusive and exclusive decays allows us to test our understanding of<br />
hadronic effects in semileptonic decays. The latest determinations differ by more than 2σ, with<br />
the inclusive method having a stated error half of the size of the exclusive one.<br />
3.0.1 Beauty Quark Mass Definitions<br />
Due to confinement and the non-perturbative aspect of the strong interaction, the concept of<br />
the quark masses cannot be tied to an intuitive picture of the rest mass of a particle, as for<br />
leptons. Rather, quark masses must be considered as couplings of the SM Lagrangian that<br />
have to be determined from processes that depend on them. As such the b-quark mass (mb) is<br />
a scheme-dependent, renormalised quantity.<br />
In principle, any renormalisation scheme or definition of quark masses is possible. In the<br />
framework of QCD perturbation theory the difference between two mass schemes can be<br />
determined as a series in powers of αs. Therefore, higher-order terms in the perturbative<br />
expansion of a quantity that depends on quark masses are affected by the particular scheme<br />
33
employed. There are schemes that are more appropriate and more convenient for some<br />
purposes than others. Here we examine the main quark mass definitions commonly used in the<br />
description of B decays.<br />
• Pole mass: The pole mass definition is gauge-invariant and infrared-safe [79] to all<br />
orders in perturbation theory and has been used as the standard mass definition of many<br />
perturbative computations in the past. By construction, it is directly related to the<br />
concept of the mass of a free quark. The presence of a renormalon ambiguity [80] makes<br />
the numerical value of the pole mass an order-dependent quantity, leading to large<br />
perturbative corrections for Heavy Quark Effective Theory (HQET) parameters (see<br />
below for a discussion of HQET). These shortcomings are avoided by using quark mass<br />
definitions that reduce the infrared sensitivity by removing the ΛQCD renormalon of the<br />
pole mass. Such quark mass definitions are generically called “short-distance” masses.<br />
• MS mass: The most common short-distance mass definition is the MS mass mb(µ) [81],<br />
where the scale µ is typically chosen to be the order of the characteristic energy scale of<br />
the process. In the MS scheme the subtracted divergencies do not contain any infrared<br />
sensitive terms and the MS mass is only sensitive to scales larger than mb. The MS mass<br />
arises naturally in processes where the b-quark is far off-shell, but it is less adequate<br />
when the b-quark has non-relativistic energies.<br />
• Kinetic mass: The shortcomings of the pole and the MS mass in describing<br />
non-relativistic b-quarks can be resolved by so-called threshold masses [82], that are free<br />
of an ambiguity of order ΛQCD and are defined through subtractions that contain<br />
universal contributions for the dynamics of non-relativistic quarks. Since the<br />
subtractions are not unique, an arbitrary number of threshold masses can be<br />
constructed. The kinetic mass is defined as [83,84]:<br />
mb,kin(µkin) = mb,pole − [ ¯ Λ(µkin)]pert −<br />
µ 2 π(µkin)<br />
2mb,kin(µkin)<br />
<br />
pert<br />
+ ... , (56)<br />
where µkin is the nominal kinetic mass renormalisation scale. For µkin → 0 the kinetic<br />
mass reduces to the pole mass.<br />
• 1S mass: The kinetic mass depends on an explicit subtraction scale to remove the<br />
universal infrared sensitive contributions associated with the non-relativistic b-quark<br />
dynamics. The 1S mass [85] achieves the same task without a factorisation scale, since it<br />
is directly related to a physical quantity. The b-quark 1S mass is defined as half of the<br />
perturbative contribution to the mass of the Υ(S1) in the limit<br />
mb ≫ mbv ≫ mbv 2 ≫ ΛQCD.<br />
34
Table 2: List of mb determinations converted into the MS mass scheme.<br />
mb(mb) GeV Method<br />
4.243 ± 0.042 From B → Xsγ and B → Xcℓν fit [86]<br />
4.25 ± 0.02 ± 0.11 Lattice UKQCD [87]<br />
4.346 ± 0.07 Υ(1S) NNNLO [88]<br />
4.164 ± 0.025 low-moment sum rules NNNLO [89]<br />
4.17 ± 0.05 Υ sum rules NNLO [90]<br />
A list of b-quark mass determinations, converted into the MS mass scheme is shown in Table 2.<br />
3.1 Determination Based on Exclusive Semileptonic B Decays<br />
The exclusive |Vcb| determination is obtained by studying the decays B → D ∗ ℓν and B → Dℓν,<br />
where ℓ denotes either an electron or a muon. The exclusive measurements of a single hadronic<br />
final state, e.g. the ground state D or D ∗ , restrict the dynamics of the process. The remaining<br />
degrees of freedom, usually connected to different helicity states of the charmed hadron, can be<br />
expressed in terms of form factors, depending on the invariant mass of the lepton-ν pair, q 2 .<br />
The shapes of those form factors are unknown but can be measured. However, the overall<br />
normalization of these functions needs to be determined from theoretical calculations.<br />
Isgur and Wise formulated a theoretical breakthrough in the late 1980’s. They found that in<br />
the limit of an infinitely heavy quark masses QCD possess additional flavor and spin<br />
symmetries. They showed that since the heavier b and c quarks have masses much heavier<br />
than the scale of the QCD coupling constant, that they are heavy enough to posses this<br />
symmetry but that corrections for the fact that the quark mass was not infinite had to be<br />
made. They showed there was a systematic method of making these corrections by expanding<br />
a series in terms of the inverse quark mass [91]. This theory is known as Heavy Quark<br />
Effective Theory (HQET).<br />
When studying b quark decays into c quarks, it is convenient to view the process in<br />
four-velocity transfer (w) space as opposed to four-momentum transfer space, because at<br />
maximum four-velocity transfer, where w equals one, the form-factor in lowest order is unity,<br />
i.e. the b transforms directly into a c quark without any velocity change. The value of |Vcb| can<br />
be extracted by studying the decay rate for the process B 0 → D ∗+ ℓ − ¯νℓ as a function of the<br />
recoil kinematics of the D ∗+ meson. Specifically, HQET predicts that:<br />
dΓ(B → D ∗ ℓν)<br />
dw<br />
= G2F |Vcb|<br />
2<br />
48π3 K(w)F(w)2 , (57)<br />
35
where w is the product of the four-velocities of the D ∗+ and the ¯ B 0 mesons, related to q 2 .<br />
K(w) is a known phase space factor and the form factor F(w) is generally expressed as the<br />
product of a normalization factor and a shape function described by three form factors,<br />
constrained by dispersion relations [92]:<br />
F(w) 2 =<br />
hA1 (w)<br />
|hA1 (w)|2<br />
(1 − r) 2<br />
<br />
(w − r) 2 (1 − R2(w)) 2 + 2(1 − 2wr − r 2 <br />
w − 1<br />
) 1 −<br />
w + 1 R2 <br />
2(w) ,(58)<br />
hA1 (1) = 1 − 8ρ2 z + (53ρ 2 − 15)z 2 − (231ρ 2 − 91)z 3 ,<br />
R1(w) = R1(1) − 0.12(w − 1) + 0.05(w − 1) 2 ,<br />
R2(w) = R2(1) − 0.11(w − 1) − 0.06(w − 1) 2 ,<br />
where r = mD ∗/mB, z =<br />
√ w+1− √ 2<br />
√ w+1+ √ 2 ; The linear slope of the form-factor is given by the<br />
parameter ρ 2 , and must be determined from the data. In the infinite mass limit,<br />
F(w = 1) = hA1 (w = 1) = 1; for finite quark masses, non-perturbative effects can be expressed<br />
in powers of 1/mQ. There are several different corrections to the infinite mass value F(1) = 1:<br />
F(1) = ηQEDηA<br />
<br />
<br />
1 + δ1/m2 + ...<br />
Q<br />
Note that the first term in the non-perturbative expansion in powers of 1/mQ vanishes [93].<br />
QED corrections up to leading logarithmic order give ηA = 0.960 ± 0.007. Different estimates<br />
of the 1/m 2 Q corrections, involving terms proportional to 1/m2 b , 1/m2 c and 1/(mbmc), have<br />
been performed in a quark model with QCD sum rules, and, more recently, with an HQET<br />
based lattice gauge calculation. The best estimate comes from lattice QCD,<br />
hA1 (1) = F(1) = 0.921 ± 0.013 ± 0.020 [94]. This result does not include a 0.7% QED<br />
correction.<br />
Since the phase-space factor K(w) tends to zero as w → 1, the decay rate vanishes and the<br />
accuracy of the |Vcb| value extracted with this method depends upon experimental and<br />
theoretical uncertainties in the extrapolation. Experiments determine the product |F(1) · Vcb| 2<br />
by fitting the measured dΓ/dw distribution.<br />
This decay has been analyzed by CLEO, BaBar and Belle using B mesons from the Υ(4S)<br />
decay, and by ALEPH, DELPHI, and OPAL at the Z 0 center of mass energy. Experiments<br />
that exploit the Υ(4S) have the advantage that w resolution is quite good. However, they<br />
suffer from lower statistics near w = 1 in the decay B → D ∗+ ℓν due to the lower<br />
reconstruction efficiency of the slow π ± . On the other hand, the decay B → D ∗0 ℓν is not<br />
affected by this problem [95]. In addition, kinematic constraints enable these experiments to<br />
identify the final state including D ∗ without large contamination from the poorly known<br />
portion of semileptonic decays with a hadronic system recoiling against the lepton-ν pair with<br />
masses higher than the D and D ∗ , commonly identified as ‘D ∗∗ ’. B -factories and CLEO fit for<br />
36<br />
(59)
Table 3: Experimental results based on B → D ∗ ℓν after the correction to common inputs and<br />
the world average as obtained by HFAG [99]. All numbers are corrected to use R1 and R2 from<br />
a global fit to CLEO and BaBar data. The newest BELLE result is not included in the world<br />
average.<br />
experiment F(1)|Vcb| (×10 −3 ) ρ 2 Corrstat Branching fraction(%)<br />
ALEPH [100] 31.6±1.8±1.3 0.50±0.20±0.09 94% 5.44±0.25±0.20<br />
BaBar [101] 33.9±0.3±1.1 1.18±0.05±0.03 27% 4.53±0.04±0.13<br />
BaBar [102] 34.9±0.8±1.4 1.11±0.06±0.08 90% 5.40±0.16±0.25<br />
BaBar [103] 35.7±0.2± 1.2 1.20±0.02±0.07 38% -<br />
BELLE [97] 34.7± 0.2± 1.0 1.16± 0.04± 0.03 91% †<br />
BELLE [104] 34.7± 0.2±1.0 1.16±0.04±0.03 91% 4.75±0.25± 0.19<br />
CLEO [105] 41.3±1.3±1.8 1.37±0.08±0.18 91% 6.02± 0.19±0.20<br />
DELPHI(excl) [100] 36.3±1.8±1.9 1.04±0.14±0.15 89% 5.53±0.19±0.34<br />
DELPHI(part rec) [100] 35.8±1.4±2.3 1.18±0.13± 0.25 94% 5.00±0.15±0.18<br />
OPAL(excl) [100] 36.9±1.6±1.5 1.24±0.20±0.14 77% 5.17± 0.20±0.38<br />
OPAL(par rec) [100] 37.6±1.2±2.4 1.14±0.13±0.27 94% 5.63±0.27± 0.43<br />
world average 35.4 ± 0.5 1.16 ± 0.05 20% 5.05 ± 0.10<br />
† - Not used in the World Average<br />
the signal and background components in the distribution of the cosine of the angle between<br />
the direction of the B and the direction of the D ∗ ℓ system. At LEP, B mesons are produced<br />
with a large variable momentum (about 30 GeV on average), giving a relatively poor w<br />
resolution and limited physics background rejection capabilities. By contrast, LEP<br />
experiments benefit from an efficiency that is only mildly dependent upon w.<br />
LEP experiments extracted |Vcb| by performing a two-parameter fit, for F(1)|Vcb| and the slope<br />
ρ 2 . The first measurements of both ratio R1 and R2, and ρ 2 , were made by the CLEO<br />
collaboration [96]. Belle [97] and BaBar [98] improved upon these measurements using the<br />
B 0 → D ∗+ e − ¯νe decay. They determined R1, R2, and ρ 2 using an unbinned maximum<br />
likelihood fit to the full decay distribution. BaBar and CLEO results are combined to give:<br />
R1 = 1.396 ± 0.060 ± 0.035 ± 0.027, R2 = 0.885 ± 0.040 ± 0.022 ± 0.013, and<br />
ρ 2 = 1.145 ± 0.059 ± 0.030 ± 0.035. The stated uncertainties are the statistical from the data<br />
and systematic uncertainty, respectively.<br />
Table 3 summarizes the available data. Values of F(1)|Vcb| from different experiments can be<br />
combined if they are extracted using the same F(w) parametrization. All measurements<br />
included in the exclusive |Vcb| world average relying on the above form factor ratios R1 and R2.<br />
Using the F(1)|Vcb| world average in Table 3 and hA1 (1) = 0.921 ± 0.013 ± 0.020 [94], we find<br />
37
Table 4: Experimental results from B → Dℓν using corrections to the common inputs and world<br />
averages.<br />
experiment G(1)|Vcb|(×10 −3 ) ρ 2 D Corrstat Branching fraction(%)<br />
ALEPH [100] 38.1±11.8±6.1 0.91±0.98± 0.36 98% 2.25 ± 0.18 ± 0.36<br />
BaBar [107] 42.3±1.9±1.0 1.20±0.09±0.04 95% -<br />
BaBar [108] 43.8±0.8±2.1 1.22±0.04±0.06 63% -<br />
BaBar [109] - - - 2.20 ± 0.11 ± 0.12<br />
BELLE [110] 40.7±4.4±5.1 1.12±0.22±0.14 96% 2.09 ± 0.12 ± 0.39<br />
CLEO [111] 44.5±5.9±3.4 1.27±0.25±0.14 95% 2.10 ± 0.13 ± 0.15<br />
World average 42.4 ± 0.7 ± 1.4 1.19 ± 0.04 ± 0.04 96% 2.16 ± 0.12<br />
|Vcb| = (38.2 ± 0.5exp ± 1.0theo) × 10 −3 ,<br />
where the dominant error is theoretical, and it will be difficult to improve upon.<br />
The study of the decay B → Dℓν poses new challenges from the experimental point of view.<br />
The differential decay rate for B → Dℓν can be expressed as [106]<br />
|Vcb| 2<br />
dΓD<br />
dw (B → Dℓν) = G2F 48π3 KD(w)G(w) 2 , (60)<br />
where KD(w) is the phase space factor and the form factor G(w) is generally expressed as the<br />
product of a normalization factor G(1) and a function, gD(w), constrained by dispersion<br />
relations [92]. The strategy to extract G(1)|Vcb| is identical to that used for the B → D⋆ℓν decay. However, dΓD/dw is more heavily suppressed near w = 1 than dΓD∗/dw due to the<br />
helicity mismatch between initial and final states. Moreover, this channel is much more<br />
challenging to isolate from the dominant background B → D ⋆ ℓν as well as from fake D-ℓ<br />
combinations. Table 4 shows the results of two-dimensional fits to |Vcb|G(1) and ρ 2 for different<br />
experiments and the world average.<br />
In the limit of infinite quark masses, G(w = 1) coincides with the Isgur-Wise function [112]. In<br />
this case there is no suppression of 1/mQ corrections and QCD effects on G(1) are calculated<br />
with less accuracy than F(1). Corrections to this prediction have recently been calculated with<br />
improved precision, based on unquenched lattice QCD [113], specifically<br />
G(1) = 1.074 ± 0.018 ± 0.016. Using this result we get<br />
|Vcb| = (39.5 ± 1.4exp ± 0.9theo) × 10 −3<br />
consistent with the value extracted from B → D ⋆ ℓν decay, but with an experimental<br />
uncertainty about twice as large.<br />
38
BaBar recently has also studied the differential decay widths for the decays B − → D 0 ℓν and<br />
B − → D ⋆0 ℓν to extract the ratio G(1)/F(1) = 1.23 ± 0.09 [114], compatible with the lattice<br />
theory prediction of 1.16 ± 0.04 .<br />
3.2 B → D ∗∗ ℓν Decays<br />
It is important to understand the composition of the inclusive B semileptonic decay rate in<br />
terms of exclusive final states for use in semileptonic B decay analyses. The B → D (∗) ℓν<br />
decays are well measured, but a sizeable fraction of semileptonic B decay are to D ∗∗ ℓν. The<br />
D ∗∗ resonances have larger masses than the D ∗ and not well studied. 5 The measurements of<br />
these branching fractions require a good understanding of the different D (∗) nπ systems, which<br />
can be either resonant or non-resonant, each with characteristic decay properties.<br />
There are four orbitally excited states with L=1. They can be grouped in two pairs according<br />
to the value of the spin on the light system, j =L±1/2 (L=1). States with j = 3/2 can have<br />
J P = 1 + and 2 + state. The 1 + state decays only through D ∗ π, and the 2 + through Dπ or D ∗ π.<br />
Parity and angular momentum conservation imply that in the 2 + the D ∗ and π are in a D<br />
wave but allow both S and D waves in the 1 + state. However, if the heavy quark spin is<br />
assumed to decouple, conservation of j = 3/2 forbids S waves even in the 1 + state. A large<br />
D-wave component and the fact that the masses of these states are not far from threshold<br />
imply that the j = 3/2 states are narrow. These states have been observed with a typical<br />
width of 20 MeV/c 2 . On the contrary, j = 1/2 states can have J P = 0 + and 1 + , so they are<br />
expected to decay mainly through an S wave and manifest as broad resonances, with typical<br />
widths of several hundred MeV/c 2 .<br />
The ALEPH [100], CLEO [115], DELPHI [100], and D0 [116] experiments have reported<br />
evidence of the narrow resonant states (D1 and D∗ 2 ) in semileptonic decays, whereas more<br />
recent measurements by the BaBar [117] and Belle [118] experiments provide semi-inclusive<br />
measurements to D (∗) πℓν final states [119].<br />
The differences between the measured inclusive semileptonic branching fraction and the sum of<br />
all exclusive B semileptonic measurements for Belle, BaBar and World averages are given in<br />
Table 5 for B 0 and B − decays. In the case where multiple measurements exist, only the most<br />
precise measurements have been used in the BaBar and Belle columns, i.e. no attempt at an<br />
average is made. In all cases the sum of the exclusive components does not saturate the B<br />
semileptonic rate.<br />
5 D ∗∗ refers to the resonant states, D ∗ 0, D ∗ 1, D ∗ 2 and D 1.<br />
39
Table 5: Inclusive versus sum of exclusive measured B semileptonic branching fractions (%).<br />
B(%) BaBar Belle World Average<br />
B 0<br />
B −<br />
B 0<br />
B → Dℓν 2.20 ± 0.16 2.30 ± 0.10 2.09 ± 0.16 − 2.16 ± 0.12 2.32 ± 0.09<br />
B → D ∗ ℓν 4.53 ± 0.14 5.37 ± 0.21 4.42 ± 0.25 − 5.05 ± 0.10 5.66 ± 0.18<br />
B → Dπℓν 0.42 ± 0.09 0.42 ± 0.07 0.43 ± 0.09 0.42 ± 0.06 0.43 ± 0.06 0.42 ± 0.05<br />
B → D ∗ πℓν 0.48 ± 0.09 0.59 ± 0.06 0.57 ± 0.22 0.68 ± 0.11 0.49 ± 0.08 0.61 ± 0.05<br />
Σ(Exc.) 7.63 ± 0.25 8.68 ± 0.25 7.51 ± 0.73 − 8.13 ± 0.19 9.01 ± 0.21<br />
Inc. 10.14± 0.43 10.90 ± 0.47 10.46 ± 0.38 11.17 ± 0.38 10.33 ± 0.28 10.99 ± 0.28<br />
Inc. - Σ(Exc.) 2.51 ± 0.50 2.22 ± 0.53 2.95 ± 0.82 − 2.20 ± 0.34 1.98 ± 0.35<br />
All measured rates for the D ∗∗ narrow states are in good agreement. Experimental results<br />
seem to point towards a larger rate for broader states. If it is due mainly to D ′ 1 and D∗ 0 decay<br />
channels, these results disagree with the prediction of QCD sum rules. However, Belle set an<br />
upper limit for the D ′ 1 channel below the rate measured by BaBar and DELPHI. More<br />
measurements need to be performed to elucidate this puzzle.<br />
3.3 Determination Based on Inclusive Semileptonic B Decays<br />
Inclusive determinations of |Vcb| are obtained using combined fits to inclusive B decay<br />
distributions [120,121]. These determinations are based on calculations of the semileptonic<br />
decay rate in the frameworks of the Operator Product Expansion (OPE) [122] and<br />
HQET [120,123]. They predict the semileptonic decay rate in terms of |Vcb|, the b-quark mass<br />
mb, and non-perturbative matrix elements. The spectator model decay rate is the leading term<br />
in a well-defined expansion controlled by the parameter ΛQCD/mb [123–126] with<br />
non-perturbative corrections arising to order 1/m2 b . The key issue in this approach is the<br />
ability to separate perturbative and non-perturbative corrections (expressed in powers of αs).<br />
Thus the accuracy of an inclusive determination of |Vcb| is limited by our knowledge of the<br />
heavy quark nonperturbative matrix elements and the b quark mass. It also relies upon the<br />
assumption of local quark hadron duality. This is the statement that a hadronic matrix<br />
element can be related pointwise to a theoretical expression formulated in terms of quark and<br />
gluon variables.<br />
Perturbative and non-perturbative corrections depend on the mb definition, i.e. the<br />
non-perturbative expansion scheme, as well as the non-perturbative matrix elements that enter<br />
the expansion. In order to determine these parameters, Heavy Quark Expansions<br />
(HQE) [120,126,127] express the semileptonic decay width ΓSL, moments of the lepton energy<br />
and hadron mass spectra in B → Xcℓν decays in terms of the running kinetic quark masses<br />
mkin b and mkin c as well as the b-quark mass m1S b in the 1S expansion scheme. These schemes<br />
40<br />
B −<br />
B 0<br />
B −
should ultimately yield consistent results for |Vcb|. The precision of the b-quark mass is also<br />
important for |Vub|.<br />
The shape of the lepton spectrum and of the hadronic mass spectrum provide constraints on<br />
the heavy quark expansion, which allows for the calculation of the properties of B → Xcℓν<br />
transitions. So far, measurements of the hadronic mass distribution and the leptonic spectrum<br />
have been made by BaBar [128], Belle [129], CLEO [130,131], DELPHI [132]. CDF [133]<br />
provides only the measurement of the hadronic mass spectrum with a lepton momentum cut of<br />
0.6 GeV in the B rest frame.<br />
The inclusive semileptonic width can be expressed as<br />
Γ(B → Xcℓ¯ν) = G2F m5 b<br />
|Vcb|<br />
2<br />
192π3 (f(ρ) + k(ρ) µ2π 2m2 b<br />
+d(ρ) ρ3 D<br />
m 3 b<br />
+ l(ρ) ρ3 LS<br />
m 3 b<br />
+ O(m −4<br />
b )),<br />
+ g(ρ) µ2 G<br />
2m 2 b<br />
where ρ = m 2 c/m 2 b , and µ2 π, µ 2 G , ρD and ρLS are non-perturbative matrix elements of local<br />
operators in HQET. To make use of equations such as Eq. 61, the values of the<br />
non-perturbative expansion parameters must be determined experimentally. Although some of<br />
these parameters are related to the mass splitting of pseudoscalar and vector meson states,<br />
most non-perturbative parameters are not so easily obtained. Measurements of the moments of<br />
different kinematic distributions in inclusive B-decays are used to gain access to these<br />
parameters. The first moment of a distribution is given by:<br />
<br />
〈M1〉 = M1(x)dx dΓ<br />
, (62)<br />
dx<br />
corresponding to the mean. Subsequent (central) moments are calculated around the first<br />
moment,<br />
corresponding to a distribution’s width, kurtosis and so on.<br />
(61)<br />
〈Mn〉 = 〈(x − M1) n 〉, (63)<br />
A B → Xcℓ¯ν decay observable calculated with the OPE is a double expansion in terms of the<br />
strong coupling αs(mb) and the ratio ΛQCD/mb. Observables are typically calculated with the<br />
cuts used in the experimental determination for background suppression, and enhanced<br />
sensitivity such as the lepton energy cut. The spectral moments are defined as:<br />
< E n ℓ E m x (M 2 x) ℓ > = 1<br />
<br />
Γ0<br />
<br />
dEℓ<br />
<br />
dEx<br />
dΓ<br />
dMx E<br />
dMXdExdEℓ<br />
n ℓ E m x (M 2 x) ℓ<br />
Ê min<br />
ℓ<br />
= f0[n, Êℓ] + f1[n, Êℓ] ¯ Λ<br />
+<br />
2<br />
i=1<br />
λi<br />
fi+1[n, Êℓ]<br />
m2 b<br />
41<br />
mb<br />
+ O<br />
<br />
αs, Λ3 QCD<br />
m 3 b<br />
<br />
,<br />
(64)
where<br />
Γ0 = G2F m5b |Vcb|<br />
2<br />
192π3 . (65)<br />
The measurement of |Vcb| from inclusive decays requires that these decays be adequately<br />
described by the OPE formalism. The motivation of the moment approach is to exploit the<br />
degree of experimental and theoretical understanding of each moment and for different Êmin<br />
ℓ ,<br />
directly examining the dependence of the various coefficient functions fi on these terms. The<br />
possibility of deviations from the OPE predictions due to quark hadron duality violations have<br />
been raised [134]. To compare the OPE predictions with data, one also has to define how<br />
uncertainties from 1/m3 b corrections are estimated. These uncertainties are hard to quantify<br />
reliably, as the only information on the size of the matrix elements of the dimension six<br />
operators comes from dimensional analysis. The only method to check the reliability of |Vcb|<br />
extraction from inclusive semileptonic decays is how well the OPE fits the data.<br />
To compare with theoretical predictions, the moments are measured with a well defined cut on<br />
the lepton momentum in the B rest frame. The measured hadronic mass distribution and<br />
lepton energy spectrum are affected by a variety of experimental factors such as detector<br />
resolution, accessible phase space, radiative effects. It is particularly important to measure the<br />
largest fraction of the accessible phase space in order to reduce both theoretical and<br />
experimental uncertainties. Each experiment has focused on lowering the lepton energy cut.<br />
The hadronic mass spectrum in B → Xcℓν decays can be split into three contributions<br />
corresponding to D, D ∗ , and D ∗∗ , where D ∗∗ here stands for any neutral charmed state,<br />
resonant or not, other than D and D ∗ . Belle [129], BaBar [128] and CLEO [130] explored the<br />
moments of the hadronic mass spectrum M2 X as a function of the lepton momentum cuts.<br />
CLEO performs a fit for the contributions of signal and background to the full<br />
three-dimensional differential decay rate distribution as a function of the reconstructed<br />
quantities q 2 , M 2 X , cos θℓ. Belle [135] and BaBar [128] use a sample where one of the B mesons,<br />
produced in pairs from Υ(4S) decays, is fully reconstructed and the signal side is tagged by a<br />
well identified lepton. The 4-momentum pX of the hadronic system X, recoiling against the<br />
lepton and neutrino, is determined by summing the 4-momenta of the remaining charged tracks<br />
and unmatched clusters. Belle reconstructs the full hadronic mass spectrum and measures the<br />
first, second central and second non-central moments of the unfolded M2 X spectrum in<br />
B → Xcℓν, for lepton energy thresholds, Emin, varying from 0.7 to 1.9 GeV [129]. BaBar<br />
extracts the moments from the measured distributions using a calibration curve derived from<br />
Monte Carlo data, with a minimum momentum for the electron in the B meson rest frame of<br />
0.9 GeV. The latest BaBar analysis [129] measures the first, second central and second<br />
non-central moments of the M 2 X spectrum for Emin from 0.9 to 1.9 GeV. The main systematic<br />
errors originate from background estimation, unfolding and signal model dependence.<br />
42
DELPHI follows a different approach in extracting the moments, measuring the invariant mass<br />
distribution of the D ∗∗ component only and fixing the D and D ∗ components. DELPHI<br />
measures the first moment with respect to the spin averaged mass of D and D ∗ . At LEP<br />
b-quarks were created with an energy of approximately 30 GeV allowing the measurement of<br />
the hadronic mass moments without a cut on the lepton energy [132].<br />
The shape of the lepton spectrum provides further constraints on the OPE. These<br />
measurements are sensitive to higher order OPE parameters and are considerably more precise<br />
experimentally. Moments of the lepton momentum with a cut pℓ ≥ 1.0 GeV/c have been<br />
measured by the CLEO collaboration [136]. BaBar [128] extract up to the third moment of<br />
this distribution, using a low momentum cut of pℓ ≥ 0.6 GeV/c. Both BaBar and CLEO use<br />
dilepton samples. The most recent measurement of the electron energy spectrum is from<br />
Belle [135]. Events are selected by fully reconstructing one of the B mesons, produced in pairs<br />
from Υ(4S) decays and it determines the true electron energy spectrum by unfolding [137] the<br />
measured spectrum in the B meson rest frame. Belle measures B 0 and B + weighted average<br />
partial branching fractions B(B → Xcℓν)Eℓ>Emin and the first four moments of the electron<br />
energy spectrum in B → Xceν, for Emin from 0.4 to 2.0 GeV [138]. All the lepton moment<br />
measurements are consistent with theory and with the moment of the hadronic and b → sγ<br />
photon energy spectrum. Hadronic and lepton energy measurements are consistent within<br />
their errors. When compared with theory there is no sign of inconsistencies. The B-factories<br />
provide the most precise HQE parameter estimates.<br />
3.3.1 HQE Parameters<br />
Using the moment measurements described above, it is possible to determine the CKM matrix<br />
element |Vcb| and HQE parameters by performing global fits in the kinetic and 1S b-quark mass<br />
schemes [139]. The photon energy moments in B → Xsγ decays [140] are also included in<br />
order to constrain the b-quark mass more precisely. Measurements that are not matched by<br />
theoretical predictions and those with high cutoff energies are excluded (i.e. semileptonic<br />
moments with Emin > 1.5 GeV and photon energy moments with Emin > 2 GeV). The results<br />
are preliminary.<br />
The inclusive spectral moments of B → Xcℓν decays have been derived in the 1S scheme up to<br />
O(1/m3 b ) [120]. The theoretical expressions for the truncated moments are given in terms of<br />
HQE parameters with coefficients determined by theory, as functions of Emin. The<br />
non-perturbative corrections are parametrized in terms of the following non-perturbative<br />
parameters: Λ at O(mb), λ1 and λ2 at O(1/m2 b ), and τ1, τ2, τ3, τ4, ρ1 and ρ2 at O(1/m3 b ). In<br />
Table 6 one finds the following results for the fit parameters [139]. The first error is from the<br />
43
Table 6: Experimental results using corrections to the common inputs and world averages for<br />
the 1S scheme.<br />
|Vcb|(×10 −3 ) m 1S<br />
b (GeV) λ1(GeV 2 ) χ 2 /n.d.f.<br />
Xcℓν + Xsγ 41.81 ± 0.34fit ± 0.08τB 4.700 ± 0.030 −0.315 ± 0.026 24.7/56<br />
Xcℓν 42.03 ± 0.42fit ± 0.08τB 4.656 ± 0.060 −0.343 ± 0.046 19.0/45<br />
|<br />
cb<br />
|V<br />
42.5<br />
42<br />
41.5<br />
-3<br />
× 10<br />
1S scheme 2008<br />
B → Xc<br />
l ν<br />
B → Xc<br />
l ν + B → Xs<br />
γ<br />
4.6 4.65 4.7 4.75<br />
(GeV)<br />
Figure 24: Fit results for |Vcb| and m 1S<br />
b to B → Xcℓν data only (larger blue ellipse) and<br />
B → Xcℓν and B → Xsγ data combined (smaller red ellipse) for the 1S scheme. The ellipses<br />
are for ∆χ 2 = 1 [141].<br />
fit including experimental and theory errors, and the second error (on |Vcb| only) is due to the<br />
uncertainty on the average B lifetime. If the same fit is performed to all measured moments of<br />
inclusive distributions in B → Xcℓν and B → sγ decays, the |Vcb| and mb values obtained are<br />
in Table 6. The fit results for |Vcb| and m 1S<br />
b to B → Xcℓν data only and B → Xcℓν and<br />
B → Xsγ data combined are displayed in Fig. 24.<br />
Spectral moments of B → Xcℓν decays have been derived up to O(1/m3 b ) in the kinetic<br />
scheme [126]. The theoretical expressions used in the fit contain improved calculations of the<br />
m1S<br />
b<br />
perturbative corrections to the lepton energy moments [84] and account for the<br />
Emin dependence of the perturbative corrections to the hadronic mass moments [142]. For the<br />
B → Xsγ moments, the (biased) OPE prediction and the bias correction have been<br />
calculated [127]. All these expressions depend on the b- and c-quark masses mb(µ) and mc(µ),<br />
the non-perturbative parameters, defined at the scale µ = 1 GeV: µ 2 π (µ) and µ2 G (µ) (O(1/m2 b )),<br />
˜ρ 3 D (µ) and ρ3 LS (µ) (O(1/m3 b )), and αs. The CKM element |Vcb| is a free parameter in the fit,<br />
44
Table 7: Experimental results using corrections to the common inputs and world averages for<br />
the kinetic scheme. The first error is from the fit (experimental error, non-perturbative and bias<br />
corrections), and the second error is a 1.5% uncertainty from the theoretical expression for the<br />
semileptonic width [123].<br />
|Vcb|(×10 −3 ) mb (GeV) µ 2 π (GeV2 ) χ 2 /n.d.f.<br />
Xcℓν + Xsγ 41.67 ± 0.47fit ± 0.08τB ± 0.58th 4.601 ± 0.034 0.440 ± 0.040 29.7/57<br />
Xcℓν + Xsγ† 40.85 ± 0.68fit ± 0.08τB ± 0.57th 4.605 ± 0.031 0.312 ± 0.060 54.2/46<br />
Xcℓν 41.48 ± 0.47fit ± 0.08τB ± 0.58th 4.659 ± 0.049 0.428 ± 0.044 24.1/46<br />
† - New theoretical correlations are applied [143].<br />
related to the semileptonic width Γ(B → Xcℓν) [123]. The fit results for various inputs and<br />
correlations are shown in Table 7 .<br />
All the measured moments of inclusive distributions in B → Xcℓν and B → sγ decays are used<br />
in a fit to extract |Vcb| and the b and c quark masses. The |Vcb| and mb values obtained are<br />
listed in the Table 7. The default fit also gives mc = 1.16 ± 0.05 GeV, and µ 2 G = 0.27 ± 0.04<br />
GeV2 . The errors are experimental and theoretical (HQE and ΓSL) respectively. In this fit the<br />
following variations were considered when in the extraction of the HQ parameters, ±20 MeV<br />
for the b and c quark masses, ±20% for µ 2 π and µ 2 G , ±30% for the 3rd order non perturbative<br />
terms and α2 = 0.22 ± 0.04 for the perturbative corrections. The bias corrections uncertainties<br />
for B → sγ were varied by the full amount of their value.<br />
There are open issues relating to the global fits. First of all, the χ 2 / n.d.f. are very small,<br />
pointing to an underestimate in the theoretical correlations. In a recent study [143], the<br />
theoretical correlations used in the fit were scrutinized, and new correlation coefficients were<br />
derived from the theory expressions using a “toy Monte Carlo” approach, showing that the<br />
theoretical correlations were largely underestimated. The result of this new fit is shown in<br />
Table 7. The second issue is related the size of the theoretical error. Recently the NNLO full<br />
two-loop calculations become available [144]. In the Kinetic scheme NNLO calculations include<br />
an estimate of the non-BLM terms and lead to a roughly 0.6 % reduction of the |Vcb| value<br />
−0.25 × 10 −3 . In the 1S scheme the shift on |Vcb| is of about −0.14 × 10 −3 [145]. From the new<br />
power corrections at NLO we expect the chromo-magnetic corrections to be more important as<br />
the tree level corrections are more important, and a change of about 20-30% in the extracted<br />
value of µ 2 π in the pole expansion (may be less with the other schemes) [146]. HQE has been<br />
carried out up to 1/m4 b and the effects are expected to be of the order δ(4) Γ/Γ ≈ 0.25% [147].<br />
All these newly calculated results can be used to scrutinize the earlier error estimates. In the<br />
kinetic scheme, the full NNLO value for Apert = 0.919, which is in good agreement with<br />
Apert = Γ(B → Xcℓν)/Γ(B → Xcℓν)tree = 0.908 ± 0.009. In the 1S scheme the estimated<br />
45
uncertainty from the non-BLM two-loop is half of the BLM part, equivalent to 1.5% of the<br />
tree-level rate, more than 3 times the actual correction. The new results are not implemented<br />
in the global fits as they are available mainly in the pole-mass scheme.<br />
3.4 Outlook<br />
The error on the inclusive and exclusive determination of Vcb is limited by theory. The two<br />
method have a 2σ disagreement, even when results in the same experiment are compared.<br />
For exclusive determinations, the experimental determinations in B → D ∗ ℓν from different<br />
experiments are not in agreement. Improving the statistical error for the determination from<br />
B → Dℓν will help in elucidating the origin of this discrepancy.<br />
In the inclusive method, errors of less than 2% are quoted. However, the latest theoretical<br />
results and the introduction of better correlation between theoretical error show shifts in the<br />
central value larger than the quoted fit error. The situation needs to be reevaluated when all<br />
the new calculations and corrections are implemented in the fit. Another puzzling result of the<br />
global fit to B → Xcℓν moments only is the value of m kin<br />
b , which seems to be in disagreement<br />
with other determinations, such as the ones in Table 2. 6<br />
4 The CKM parameter |Vub|<br />
The parameter |Vub| determines one of the sides of the unitarity triangle, and thus affects one<br />
of the crucial tests of the Yukawa sector of the Standard Model. Also in this case, there are<br />
two general methods to determine this parameter, using B meson semileptonic decays. The<br />
first approach relies on the determination of branching fractions and form factor<br />
determinations of exclusive semileptonic decays, such as B → πℓ¯νℓ. The relationship between<br />
experimental measurements and |Vub| requires a theoretical prediction of the hadronic form<br />
factors governing these decays. The complementary approach relies on measurements of<br />
inclusive properties of B meson semileptonic decays. In this case, the hadronic matrix element<br />
is evaluated in the context of the OPE.<br />
Both methods pose challenges to both experimenters and theorists. The branching fractions<br />
are small, and a substantial background induced by the dominant b → cℓ¯νℓ needs to be<br />
suppressed or accounted for. The large data samples accumulated at the two b-factories, Belle<br />
6 kin<br />
For a detailed comparison between mb Workshop on |Vub| and |Vcb| at the B-Factories Heidelberg, December 14-16, 2007.<br />
and different mass determinations see A. Hoang, talk at Joint<br />
46
and BaBar, have made possible the development of new experimental techniques that have<br />
reduced the experimental errors substantially. In parallel, theorists devoted considerable efforts<br />
to devise measurable quantities for which reliable predictions could be produced, and to<br />
improve the accuracy of the predictions through refinements in the calculation. Although the<br />
precision of the stated errors improved, so did the difference in central values between the<br />
inclusive and exclusive estimates of |Vub|, at least in most determinations. Possible<br />
interpretations of this discrepancy will be discussed.<br />
4.1 Determinations Based on Exclusive B Semileptonic Decays<br />
The decay B → πℓ¯νℓ is the simplest to interpret, as it is affected by a single form factor. The<br />
differential decay width is given by<br />
dΓ<br />
dq2 = G2F |Vub|<br />
2<br />
192π3m3 B<br />
λ(q 2 ) 3/2 | f+(q 2 ) | 2<br />
where GF is the Fermi constant, λ(q 2 ) = (q 2 + m 2 B − m2 π) 2 − 4m 2 B m2 π, and f+(q 2 ) is the<br />
relevant form factor.<br />
The first experimental challenge is to reconstruct this exclusive channel without significant<br />
background from the dominant charm semileptonic decays, and the additional background<br />
component from other b → uℓ¯ν transitions. The advantage of e + e − B-factories is that the B<br />
decaying semileptonically originates from the decay e + e − → B ¯ B. Thus, if the companion B is<br />
fully reconstructed, the ¯νℓ 4-momentum can be inferred from the rest of the event.<br />
CLEO pioneered this approach by reconstructing the ν from the missing energy<br />
(Emiss ≡ 2EB − ΣiEi), and momentum (pmiss ≡ Σipi) in the event; in these definitions the<br />
index i runs over the well reconstructed tracks and photons, and cuts are applied to enhance<br />
the probability that the only missing particle in the event is the ¯ν. This approach allows the<br />
application of a low momentum cut of 1.5 GeV on the lepton for B → πℓ¯νℓ and 2 GeV for<br />
B → ρℓ¯νℓ. Averaging the results from these two exclusive channels, they obtain<br />
|Vub| = (3.3 ± 0.2 +0.3<br />
−0.4 ± 0.7) × 10−3 . Using their relatively modest full data set (16 fb −1 ) at the<br />
center-of-mass energy of the Υ(4S) and considering only the B → πℓ¯νℓ channel, they get the<br />
branching fraction B(B → π + ℓ¯νℓ) = (1.37 ± 0.15 ± 0.11) × 10 −4 , and<br />
|Vub| = (3.6 ± 0.4 ± 0.2± +0.6<br />
−0.4 ) × 10−3 [148].<br />
BaBar [149] uses a sample of 206 fb −1 to obtain B(B → π + ℓ¯νℓ) = (1.46 ± 0.07 ± 0.08) × 10 −4 .<br />
Recently, the availability of very large data sets at Belle and BaBar have made possible tagged<br />
analyses, where semileptonic decays are studied in samples where the other B is fully<br />
47<br />
(66)
econstructed, thus defining the event kinematics even more precisely. The first<br />
implementation relies on the the partial reconstruction of exclusive B → D (⋆) ℓ + νℓ decay to tag<br />
the presence of a B ¯ B event [150,151].<br />
Belle uses fully reconstructed hadronic tags, achieving the best kinematic constraints and thus<br />
the highest background suppression capabilities and the most precise determination of q 2 .<br />
Branching fractions obtained with this technique have a bigger statistical error because of the<br />
penalty introduced by the tag requirement, but the overall error is already comparable with<br />
the other methods. Table 8 summarizes the present status of the experimental information on<br />
this decay. Both the total branching fraction for B → πℓ¯νℓ and the partial branching fraction<br />
for q 2 ≥ 16 GeV 2 are shown. The latter partial branching fraction is useful to extract |Vub|<br />
using unquenched lattice calculations, as this is the only q 2 interval where their calculation is<br />
reliable.<br />
Table 8: Partial and total branching fractions, in units of 10 −4 , for the decay B → πℓ + νℓ.<br />
Whenever possible, B 0 and B + data are combined.<br />
Experiment total q 2 > 16 GeV 2 Method<br />
CLEO [148] 1.37 ± 0.15 ± 0.11 0.41 ± 0.08 ± 0.04 Untagged Analysis<br />
BaBar [149] 1.46 ± 0.07 ± 0.08 0.38 ± 0.04 ± 0.04 Untagged Analysis<br />
Belle [150] 1.38 ± 0.19 ± 0.14 ± 0.03 0.36 ± 0.10 ± 0.04 ± 0.01 B → D (⋆) ℓν Tag<br />
Belle † [152] 1.49 ± 0.26 ± 0.06 0.31 ± 0.12 ± 0.01 B 0 → π − ℓ + νℓ (hadron tags)<br />
Belle † [152] 1.53 ± 0.20 ± 0.06 0.39 ± 0.12 ± 0.02 Combined B 0 and B + tags<br />
BaBar [151] 1.33 ± 0.17 ± 0.11 0.46 ± 0.10 ± 0.06 Combined B 0 and B + tags<br />
combined [99] 1.34 ± 0.06 ± 0.05 0.37 ± 0.03 ± 0.02 HFAG ICHEP08<br />
† - Preliminary results.<br />
In order to interpret these results, we need theoretical predictions for the form factor f+(q 2 ).<br />
This problem can be split into two parts: the determination of the form factor normalization,<br />
f+(0), and the functional form of the q 2 dependence. Form factor predictions have been<br />
produced with quark models [153] and QCD sum rule calculations [154]. Lattice calculations<br />
provide evaluations of f+(q 2 ) at specific values of q 2 or, equivalently, pion momenta (pπ).<br />
Authors then fit these data points with a variety of shapes. Typically a dominant pole shape<br />
has been used in the literature. Nowadays more complex functional forms are preferred.<br />
Becirevic and Kaidalov (BK) [155] suggest using<br />
f+(q 2 )|BK =<br />
cB(1 − α)<br />
(1 − q 2 /M 2 B ⋆)(1 − αq2 /M 2 B ⋆),<br />
where cBM 2 B⋆ is the residue of the form factor at q2 = M2 B⋆, and M2 B⋆/α is the squared mass of<br />
an effective 1− B⋆′ excited state. Ball and Zwicky [154] propose<br />
f+(q 2 r1<br />
)|BZ =<br />
1 − q2 /M 2 B⋆ 48<br />
+<br />
r2<br />
1 − αq 2 /M 2 B ⋆<br />
(67)<br />
, (68)
where the parameters r1, r2, and α are fitted from available data. Lastly, parameterizations<br />
that allow the application of constraints derived from soft-collinear effective theory (SCET),<br />
and dispersion relations have been proposed by Boyd, Grinstein, and Lebedev [92], and later<br />
pursued also by Hill [156]. They define<br />
f+(t) =<br />
1<br />
P(t)Φ(t,t0) Σ∞ 0<br />
ak(t0)z(t,t0) k<br />
where t is (pB − pπ) 2 , defined beyond the physical region, t± = (mB ± mπ) 2 , and t0 is an<br />
expansion point. BGD use t0 = 0.65t−. The parameter αK allows the modeling of different<br />
functional forms, and the variable<br />
z(t,t0) =<br />
√ t+ − t − √ t+ − t0<br />
√ t+ − t + √ t+ − t0<br />
maps t+ < t < ∞ onto |z| = 1 and −∞ < t < t+ onto the z interval [-1,1].<br />
All are refinements of the old ansatz of a simple pole shape, now rarely used. The first lattice<br />
calculations were carried out with the quenched approximation that ignores vacuum<br />
polarization effects [157,158]. In 2004, preliminary unquenched results were presented by the<br />
Fermilab/MILC [159] and HPQCD [160] collaborations. These calculations employed the<br />
MILC collaboration Nf = 2 + 1 unquenched configurations, which attain the most realistic<br />
values of the quark masses so far. Using these calculations and the most recent value of the<br />
partial branching fraction B(B → πℓν) for q 2 > 16 GeV 2 , shown in Table 8, we obtain<br />
|Vub| = (3.51 ± 0.096exp ± 0.49th) × 10 −3 with the HPQCD normalization, and<br />
|Vub| = (3.70 ± 0.10exp ± 0.37th) × 10 −3 with the Fermilab/MILC normalization. Fits to<br />
experimental data, combining lattice predictions, and dispersion relations reduce the<br />
theoretical errors. For example, [161] obtains |Vub| = (3.5 ± 0.17 ± 0.44) × 10 −3 , and, more<br />
recently, [162] obtains |Vub| = (3.47 ± 0.29) × 10 −3 . The most recent lattice calculation [163]<br />
performs a simultaneous fit of improved lattice numerical Monte Carlo results and the 12-bin<br />
BaBar experimental data on |Vub|f+(q 2 ) [164] and derives |Vub| = (3.38 ± 0.35) × 10 −3 . The ∼<br />
10% error includes theoretical and experimental errors, not easily separable.<br />
4.2 Determinations Based on Inclusive B Semileptonic Decays<br />
Inclusive determinations of |Vub| rely on the heavy quark expansion (HQE), which combines<br />
perturbative QCD with an expansion in terms of 1/mb, which accounts for non-perturbative<br />
effects. Although the possible breaking of the assumption of local quark hadron duality may<br />
produce unquantified errors, other non-perturbative uncertainties can be evaluated with<br />
systematic improvements, and their uncertainties are easier to assess than the ones of<br />
49<br />
(69)<br />
(70)
unquenched lattice QCD or QCD sum-rules. This statement applies to the total charmless<br />
semileptonic width Γ SL<br />
u . In the OPE approach, discussed in the |Vcb| section, the observation<br />
by Chay, Georgi and Grinstein that there are no non-perturbative corrections of order<br />
ΛQCD/mb [93] has inspired the hope that this approach would lead to a more precise<br />
determination of this important parameter. Before discussing the methods used to relate data<br />
with theory, it is useful to observe one of the possible expressions available in the literature for<br />
the total semileptonic width [165], including an exact two-loop expression for the perturbative<br />
expansion and second-order power corrections. They obtain<br />
Γu = G2 F |Vub| 2 m 5 b<br />
192π3 {1 + αS(µ)<br />
<br />
+α 2 S(µ)<br />
−2.158 + 1.019ln mb<br />
µ + (1.249 + 2.184ln µ<br />
− 3(µ2π − λ2)<br />
+ ...}<br />
m 2 b<br />
<br />
−0.768 + 2.122 µ⋆<br />
mb<br />
<br />
µ⋆<br />
+ 0.386 µ2 π<br />
µ 2 µ⋆/mb) + 0.811<br />
⋆<br />
µ2⋆ m2 b<br />
where µ ∼ mb is the scale at which αS needs to be evaluated, while the scale µ⋆ applies to the<br />
non-perturbative expansion parameters, namely the b quark mass mb, the chromo-magnetic<br />
operator, λ2, and the kinetic operator, µπ. It is clear that, even restricting our attention to the<br />
total width, a precise knowledge of the b quark mass is critical, and considerable theoretical<br />
effort has been devoted to a reliable extraction of this parameter from experimental<br />
observables. Other uncertainties, such as the effects of weak annihilation or violations of<br />
quark-hadron duality, will be discussed later.<br />
Charmless B meson semileptonic decays constitute only about 1% of the total semileptonic<br />
width. Thus the big challenge for experimentalists is to identify techniques to suppress this<br />
large background. For example, the first evidence for B meson charmless semileptonic decays<br />
came from the study of the end point of the lepton spectrum, where leptons from b → cℓν<br />
processes are forbidden due to the larger mass of the hadronic system formed by the c<br />
quark [166]. While this was very important first evidence that |Vub| = 0, very quickly several<br />
authors pointed out that this region of phase space is ill suited to a precise determination of<br />
|Vub| because near the end point the OPE does not converge and an infinite series of<br />
contributions needs to be taken into account [167–169]. Thus, a large effort has gone into<br />
developing experimental techniques that would feature a low lepton energy Eℓ cut and an<br />
acceptable signal to background ratio. Table 9 summarizes the present status of the |Vub|<br />
determination with this approach.<br />
Next a whole host of papers proposed alternative “model independent” approaches to measure<br />
|Vub| from inclusive decays [165,173,174], with the common goal of identifying a region of<br />
phase space where experimentalists can suppress the b → c background, and where the OPE<br />
50<br />
(71)
Table 9: Summary of the experimental |Vub| determinations using the lepton endpoint; |Vub| is<br />
extracted with the “shape function” method [165].<br />
Experiment Lepton energy range Lint (fb −1 ) ∆B(Xuℓ¯νℓ) (×10 4 ) |Vub| (×10 3 )<br />
Υ(4S) cont.<br />
CLEO [170] 2.6 GeV > Eℓ > 2.1 GeV 9.1 4.3 3.28 ± 0.23 ± 0.75 3.94 ± 0.46 +0.37<br />
−0.33<br />
Belle [171] 2.6 GeV > Eℓ > 1.9 GeV 27 8.8 5.72 ± 0.41 ± 0.65 4.74 ± 0.44 +0.35<br />
−0.30<br />
BaBar [172] 2.6 GeV > Eℓ > 2.0 GeV 80 9.5 5.72 ± 0.41 ± 0.65 4.29 ± 024 +0.35<br />
−0.30<br />
works. The first proposal by Bigi, Dikeman, and Uraltsev proposed considering semileptonic<br />
events where MX ≤ 1.5 GeV [173]. However, Bauer, Ligeti, and Luke pointed out [175] that<br />
the kinematic limit m2 X ∼ m2D has the same properties of the lepton end point, and spoils the<br />
convergence of the OPE; the same authors proposed using dΓ/dq2 up to q2 = m2 D and argue<br />
that this distribution is better behaved in the kinematic region of interest. This is the<br />
theoretical foundation of the so called “improved end point” method, which encompasses the<br />
simultaneous study of Eℓ and q 2 . BaBar [176] used this technique, inferring the ν<br />
4-momentum from the missing momentum (pmiss) in the event. There results give |Vub| central<br />
values between (3.88-4.93)×10 −3 , depending on the explicit model and with total errors of<br />
≈10% on each value.<br />
An alternative approach [165], incorporates hadronic structure functions to model the region of<br />
large hadronic energy and small invariant mass, not well modeled by the OPE, and applies the<br />
OPE to the kinematic region where the hadronic kinematic variables scale with MB, and<br />
smoothly interpolates between them. This approach is commonly referred to as “shape<br />
function” method, and uses the γ spectrum in inclusive B → XSγ to reduce the theoretical<br />
uncertainties. It combines the experimental data on high momentum leptons from B decays<br />
with the constraints from inclusive radiative decays, to produce a precise value of |Vub|<br />
inclusive.<br />
The study of charmless inclusive semileptonic decays benefits from the use of hadronic tags.<br />
Belle used the information of the tag momentum to boost the electron into the B meson rest<br />
frame and to select a sample of high purity. They then reconstruct the ν energy and<br />
momentum from the measured 4-momentum vectors of the Υ(4S), B tag, lepton, and the<br />
additional tracks not used to form the tag or the lepton. They then evaluate the invariant<br />
mass MX and the quantity P + = |EX − PX|, where PX = Pbeam − ptag − pℓ − pν. Both MX<br />
and P + are smaller for b → u transitions. They define different signal region for pℓ > 1 GeV:<br />
P+ < 0.66 GeV/c, MX < 1.7 GeV/c 2 , and MX < 1.7 GeV/c 2 combined with q 2 > 8 GeV 2 /c 2 .<br />
They evaluate the partial branching fractions in each of them, and extract |Vub| directly from<br />
51
the partial branching fractions, normalized by corresponding theoretical scale factors R(∆Φ),<br />
evaluated with the shape function method [177]. The authors observe that different kinematic<br />
cuts give different values of |Vub| and speculate that this may be due to additional theoretical<br />
uncertainties not completely accounted for. Recently, BaBar has also used the same technique<br />
in slightly different kinematic regions: P+ < 0.66 GeV/c, MX < 1.55 GeV/c 2 , and MX < 1.7<br />
GeV/c 2 combined with q 2 > 8 GeV 2 /c 2 . They use both the shape function method [177] and<br />
the dressed gluon exponentation method [178]. The results obtained with this approach are<br />
summarized in Table 10.<br />
Table 10: Inclusive |Vub| determinations with tagged samples.<br />
Experiment Lint(fb−1 ) |Vub| × 103 Υ(4S) cont.<br />
Belle [171] 253 18 4.09 ± 0.44 +0.35<br />
BaBar [172] 347.4<br />
−0.30<br />
4.21 ± 0.20 +0.32<br />
−0.27<br />
In order to provide predictions that are most suited to different experimental cuts, theorists<br />
d have made available the triple differential width 3Γ dEℓdq2 given by<br />
dq0<br />
G2 F |Vub|<br />
2<br />
8π3 {q 2 W1−[2E 2 ℓ −2q0Eℓ+ q2<br />
2 ]W2+q 2 (2Eℓ−q0)W3}×θ(q0−Eℓ) q2<br />
)θ(Eℓ)θ(q<br />
4Eℓ<br />
2 <br />
)θ(q0− q2 ),<br />
(72)<br />
where q0 is the energy of the lepton-ν pair and Eℓ is the energy of the charged lepton in the B<br />
meson rest frame, and W1−3 are the three structure functions relevant if we assume massless<br />
leptons. Reference [179] computes the functions Wi(q0,q 2 ) as a convolution at fixed q2 between<br />
non-perturbative distributions Fi(K+,q 2 ;µ) and the perturbative functions W pert<br />
i (q0,q 2 )<br />
Wi(q0,q 2 <br />
) = dk+Fi(k+,q 2 ;µ)W pert<br />
<br />
i qo − k+<br />
<br />
1 −<br />
2<br />
q2<br />
<br />
,q<br />
mbMB<br />
2 <br />
;mb . (73)<br />
Perturbative corrections to the structure functions W1−3 are now known up to order<br />
O(α2 sβ0) [180] and power corrections are included through O(m2 b ). The separation between<br />
perturbative and non-perturbative physics is set by a cut-off scale µ = 1 GeV, in the “kinetic<br />
scheme” [142], which takes input parameters from fits to the b → c moments. Alternative<br />
choices of kinematical variable have been used, for example, in the SCET approach, the<br />
variables P + ≡ |EX − PX| and P − ≡ |EX + PX| are used. In particular, the “shape function”<br />
method [165] provides theoretical expression for the triple differential d 3 Γ/dEℓdP + dP − and<br />
relates it to moments of the shape function extracted from B → XSγ. Finally, the approach<br />
originally proposed by Gardi [181] uses resummed perturbation theory in momentum space to<br />
provide a perturbative calculation of the on-shell decay spectrum in the entire phase space.<br />
52
HFAG Ave. (BLNP)<br />
4.32 ± 0.16 + 0.32 - 0.27<br />
HFAG Ave. (DGE)<br />
4.26 ± 0.14 + 0.19 - 0.13<br />
HFAG Ave. (GGOU)<br />
3.96 ± 0.15 + 0.20 - 0.23<br />
HFAG Ave. (ADFR)<br />
3.76 ± 0.13 ± 0.22<br />
HFAG Ave. (BLL)<br />
4.87 ± 0.24 ± 0.38<br />
BABAR (LLR)<br />
4.92 ± 0.32 ± 0.36<br />
BABAR endpoint (LLR)<br />
4.28 ± 0.29 ± 0.48<br />
BABAR endpoint (LNP)<br />
4.40 ± 0.30 ± 0.47<br />
2 3 4 5<br />
-3<br />
|V | [ 10 ]<br />
ub<br />
HFAG<br />
ICHEP08<br />
Figure 25: Summary of Inclusive |Vub| determinations.<br />
The method used, dressed gluon exponentiation, is a general resummation formalism for<br />
inclusive distributions near a kinematic threshold. Finally, another model based on soft-gluon<br />
resummation and an analytical time-like QCD coupling has been proposed [182]. Clearly a lot<br />
of work has gone into bringing to fruition the original promise that the inclusive |Vub|<br />
determination is a more precise method to determine this important CKM parameter.<br />
However, Figure 25 shows that different methods provide central values of |Vub| that often<br />
differ beyond the stated errors. Moreover, these estimates are generally significantly higher<br />
than the value of |Vub| extracted from B → πℓ¯νℓ and the one that is obtained from global<br />
unitarity triangle fits.<br />
An effect that can influence the inclusive |Vub| is the contribution due to topologies where the<br />
incoming b¯q pair annihilates into a W boson, with a concomitant soft gluon emission. These<br />
contributions are known as “weak annihilation” and they appear as a delta function at the end<br />
point of the lepton spectrum. This effect introduces a difference between B 0 and B +<br />
semileptonic decays.<br />
A first attempt to quantify the annihilation effect was performed by CLEO [183], studying the<br />
high q 2 contributions to charmless semileptonic decays. They used inclusive data on a sample<br />
including both charged and neutral B mesons. They used a variety of models to set the limit<br />
on the fractional contribution of annihilation diagrams, ΓWA/Γb→u < 7.4 % at 90 % confidence<br />
53
level. BaBar has presented a measurement of B(B 0 → Xuℓ¯νℓ) at the end point region which,<br />
combined with previous inclusive measurement, sets the limit<br />
ΓWA/Γb→u <<br />
3.8%<br />
fWA(2.3 − 2.6)<br />
at 90 % confidence level, where fWA(2.3 − 2.6) represents the fraction of weak annihilation<br />
rate contributing in the momentum interval ∆pℓ comprised between 2.3 and 2.6 GeV used in<br />
this analysis, believed to be close to unity.<br />
Finally, Voloshin [184] has suggested that the difference in semileptonic widths of the D 0 and<br />
Ds mesons can assess non-factorizable terms through the relationship<br />
(Γsl(D 0 ) − Γsl(Ds))<br />
Γ0(c → sℓν)<br />
<br />
= 3.4<br />
fD<br />
0.22 GeV<br />
(74)<br />
2<br />
(B ns<br />
1 − B ns<br />
2 ), (75)<br />
where Γ0(c → sℓν) is the bare parton semileptonic rate c → sℓν, fD is the D decay constant,<br />
− Bns 2 is the non-factorizable term that affects charmless semileptonic decays as well.<br />
Using this formula with the CLEO-c results for inclusive D0 semileptonic decay [185], the sum<br />
and B ns<br />
1<br />
of Ds exclusive semileptonic decays [186], and mc(mc) = 1.268 GeV [187], we obtain an<br />
estimate of non-factorizable effects equal to (9±5)%. Note that annihilation effect induced<br />
uncertainties are estimated to contribute 1.6% in the BLNP approach, 1.5% in the DGE<br />
approach, and (+0.0,-3.1)% in the GGOU approach.<br />
In summary, the values if |Vub| extracted with the inclusive method have quoted errors between<br />
5.5% and 10%, with central values that change well outside these uncertainties and are all<br />
considerably larger than the |Vub| value obtained from the exclusive branching fraction<br />
B(B → πℓν).<br />
5 Rare B Decays<br />
In general, we define as “rare” B decays processes that are suppressed at tree level. They are<br />
interesting because they are typically mediated by loop diagrams which may be characterized<br />
by a matrix element whose strength is comparable to components with similar Feynman<br />
diagrams, where new particles appear in loops. Thus evidence for new physics may appear<br />
either through enhancements in branching fractions relative to the Standard Model<br />
expectation, or through interference effects.<br />
54
5.1 B → τν<br />
Table 11: Summary of recent theoretical evaluations of the decay constant fB.<br />
Method fB (MeV)<br />
HPQCD (unquenched) [188] 216 ± 9 ± 19 ± 4 ± 6<br />
LQCD (chiral extrapolation) [189] 209.4 ± 9.7 ± 1.0<br />
FNAL-MILC-HPQCD [190] 197 ± 6 ± 12<br />
Table 12: Summary of experimental determinations of B(B → τν).<br />
Experiment Method B(B → τν) × 104 Belle [191] Hadronic tag sample 1.79 +0.56+0.46<br />
Belle [192] Semileptonic tag sample<br />
−0.49−0.51<br />
1.65 +0.38+0.35<br />
BaBar [193] Hadronic tag sample<br />
−0.37−0.37<br />
1.8 +0.9<br />
BaBar [194] Semileptonic tag sample<br />
−0.8 ± 0.4 ± 0.2<br />
1.8 ± 0.8 ± 0.1<br />
Average 1.73 ± 0.35<br />
The decay B → τν is affected by two quantities of great interest, the quark mixing parameter<br />
|Vub| and the pseudoscalar decay constant fB. In fact, the leptonic branching fraction is given<br />
by<br />
B(B + → τ + ν) = G2 F mBm 2 τ<br />
8π<br />
<br />
1 − m2 τ<br />
m 2 B<br />
2<br />
f 2 B|Vub| 2 τB, (76)<br />
where mτ is the mass of the τ lepton, and τB is the charged B lifetime. Theoretical predictions<br />
for fB are summarized in Table 11. The most recent value exploits the full machinery of<br />
unquenched Lattice QCD, and has a precision of 7%.<br />
Belle performed the first measurement of the branching fraction B(B + → τ + ν) using a tagged<br />
sample of fully reconstructed B decays [191]. They later used a tagged sample of semileptonic<br />
decays [192]. BaBar also published studies performed using fully reconstructed B decays [193]<br />
and semileptonic tags [194]. The results are listed in Table 12. The resulting average<br />
experimental value B(B → τν) is (1.73 ± 0.35) × 10 −4 .<br />
The Standard Model prediction for B(B → τν) is (0.77 +0.98<br />
−0.52 ) × 10−4 , obtained using the<br />
exclusive value of |Vub| [163] and the most recent Lattice QCD value of fB [190]. The range<br />
has been obtained by calculating the Standard Model branching fraction using the values<br />
|Vub| = |Vub|excl ± σ(|Vub|) and fB = fB ± σ(fB). An intriguing possibility is the enhancement<br />
of this branching fraction due to new physics. For example in a 2-Higgs-doublet model<br />
55
+<br />
B(B + 4<br />
)x10<br />
5<br />
4<br />
3<br />
2<br />
1<br />
0<br />
0 0.5 1 1.5 2 2.5 3 3.5 4 4.5 5<br />
gs Figure 26: B(B → τν) as a function of the effective scalar coupling gs. The shaded region<br />
is the measure data ±1σ The range of theoretical predictions is obtained by assuming |Vub| =<br />
(3.38±0.35)×10 −3 [163], and fB = (0.197±0.06±0.012) MeV [190]. (The curves are theoretical<br />
and explained in the text.<br />
(2HDM) [195] based on supersymmetric extensions of the Standard Model, the ratio<br />
B(B → τν)<br />
B(B → τν)|SM<br />
= |1 − gs| 2<br />
where gs is the effective scalar coupling. Fig. 26 shows the predicted value of B(B → τν) as a<br />
function of gs and the band representing the measured value, which constrains gs to be less<br />
than 0.1 or between 1.8 and 3.9. A better understanding of the |Vub| and fB inputs is<br />
necessary to improve on this estimate.<br />
Note that a quantity that is sensitive to the same coupling is the ratio B(B→Dτν)<br />
B(B→Dℓν) . The present<br />
experimental value for this parameter is (41.6 ± 11.7 ± 5.2)% [7], which constrains gs to be<br />
≤ 1.79. Thus these two measurements provide complementary constraints, which have very<br />
different systematic uncertainties. Thus an improvement in the knowledge of leptonic and<br />
semileptonic branching fractions involving a τ lepton in the final state is very important.<br />
5.2 Radiative B Decays<br />
Radiative B decays involving b → s(d)γ transitions are very sensitive to new physics processes.<br />
These processes are ideals for indirect searches for physics beyond the Standard Model, such as<br />
two-Higgs doublet models , supersymmetric theories and extended technicolor scenarios [196].<br />
Hence, comparison of results from these theories with experimental measurements places<br />
constraints upon new physics. Moreover, b → Xsγ is an ideal laboratory for studying the<br />
56<br />
(77)
dynamics of the b-quark inside the B meson: since the motion of the b-quark inside the B<br />
meson is universal, information gained from a measurement of the energy spectrum of the<br />
emitted photon in this transition is applicable to other processes, for instance semileptonic<br />
decays.<br />
In general, in the OPE, the amplitude A for a process can be expressed as sum<br />
A = 〈Heff〉 = <br />
Ci(µ,MW )〈Qi(µ)〉, (78)<br />
where the Qi are local operators, the Ci are Wilson coefficients, and µ is the QCD<br />
i<br />
renormalization scale [197]. The B → Xsγ branching fraction directly probes the Wilson<br />
coefficient C7. However, some new physics contributions may leave the B → Xsγ rate<br />
unaltered, with changes to the C7 amplitude. In this case the direct CP asymmetry is sensitive<br />
to new phases that may appear in the decay loop [198] and the B → Xsℓ + ℓ − transition may<br />
provide information on the sign of the amplitude, since it also probes C9 and C10.<br />
The B → Xsγ branching fraction, as a function of a photon energy cut-off E0, is related to the<br />
B → Xcνℓ transition by<br />
<br />
<br />
B(B → Xsγ ; Eγ > E0 GeV) = B(B → Xce¯ν)exp<br />
<br />
V<br />
<br />
∗<br />
tsVtd <br />
<br />
<br />
<br />
Vcb<br />
<br />
Vcb 2<br />
= <br />
<br />
Γ( ¯ B → Xce¯ν)<br />
Γ( ¯ <br />
B → Xue¯ν)<br />
Vub<br />
where the perturbative corrections P(E0) are defined as<br />
<br />
<br />
<br />
V<br />
<br />
∗<br />
tsVtd <br />
2<br />
6αem <br />
π P(E0)<br />
<br />
Vcb<br />
2<br />
= <br />
Γ(b → ce¯ν)<br />
Vcb<br />
Vub<br />
and the non-perturbative N(E0) terms are O( Λ2<br />
m 2 b<br />
+O(αs Λ<br />
mb ) NLO+mLO b<br />
<br />
Γ(b → sγ)E>E0<br />
2 6αem<br />
πC × [P(E0) − N(E0)](79)<br />
× (80)<br />
LO<br />
<br />
1 + O(αs)NLO + O(α)NLO + O(α 2 s )NNLO<br />
) LO+m NLO<br />
b<br />
+O( Λ2<br />
m2) LO+mNLO c c<br />
. Note that the minimum value of E0 for which this relation is valid is 1.6<br />
GeV. The theoretical error from NLO perturbative calculations is about 10%, dominated by<br />
the renormalization scale dependence and a charm quark mass uncertainty. This uncertainty is<br />
mainly due to the change from the ratio in the pole scheme mpole c /m pole<br />
b = 0.29 ± 0.02 to the<br />
ratio mMS c /mMS<br />
b = 0.22 ± 0.04 in the MS scheme (see section 3.0.1). The large mc dependence<br />
is due to the fact that mc first enters at NLO matrix elements. Hence, the natural scale at<br />
which mc should be renormalized can only be determined by dedicated calculations at NNLO.<br />
Two predictions for the branching fraction at NNLO have been given:<br />
B(B → Xsγ ; Eγ>1.6 GeV) = (3.15 ± 0.23) × 10 −4 , (81)<br />
57<br />
= (2.98 ± 0.26) × 10 −4 ,<br />
<br />
,
from [199] and [200], respectively. Both agree with the world average in Table 13. The<br />
theoretical error of 7% is obtained by quadratically adding the uncertainty due to<br />
non-perturbative corrections (5%) [201], the uncertainty due to missing higher-order<br />
corrections (3%), the mc interpolation ambiguity (3%) and the parametric uncertainty (3%).<br />
Not included are some known NNLO and non-perturbative corrections. The size of these<br />
neglected contributions is about 1.6%, which is smaller than the present theoretical error.<br />
While progress in the calculation of the perturbative corrections is expected in the future, the<br />
uncertainty on the non-perturbative effects will not be easily reduced as they are very difficult<br />
to estimate.<br />
Experimentally, two methods are used to extract the b → Xsγ signal: the fully inclusive<br />
method and the semi-inclusive method. In the fully inclusive method, events containing a hard<br />
photon consistent with B → Xsγ are selected. In this method the subtraction of a very large<br />
background, primarily from q¯q continuum events, is the main issue. There are several options<br />
to reduce this large background. Particularly effective in the suppression of continuum<br />
backgrounds is the requirement of a high momentum lepton, tagging the semileptonic decay of<br />
the accompanying B meson. Alternatively, a fully reconstructed B can be used to identify B<br />
decays. In this measurement the large background increases towards the lower photon energy,<br />
making it impossible to measure the full photon spectrum. Hence, all measurements require a<br />
minimum photon energy where the signal to noise ratio is still acceptable. The total branching<br />
fraction is then obtained by extrapolating the signal to the full phase space. This<br />
extrapolation is based on theoretical models and is an irreducible source of systematic error. It<br />
has been argued that the energy scale ∆ = mb − 2E min<br />
γ is significantly smaller than mb and<br />
therefore the above extrapolation error is underestimated. Therefore it is important to<br />
measure the b → sγ photon energy spectrum as precisely as possible. So far we have been able<br />
to lower the minimum photon energy to 1.7 GeV.<br />
In the semi-inclusive method, the B → Xsγ branching fraction is determined by summing up<br />
exclusive modes, with an extrapolation procedure to account for the unobserved modes. The<br />
semi-inclusive analysis provides a more precise photon energy in the B-meson rest frame and<br />
usually provides the flavor of the decay (i.e. b or b). The extrapolation to account for the<br />
unobserved modes is is the key issue in this approach; it is based on isospin symmetry and the<br />
B-meson Monte Carlo hadronization model, which is hardly precise and reliable. All the<br />
available measurements are summarized in Table 13. Note that the CLEO measurement on the<br />
branching fraction includes b → dγ events, which is expected to be quite small<br />
∼ |Vtd/Vts| 2 ≈ 5%.<br />
At the parton level in the two-body decay b → sγ, the energy of the photon is Eγ ≈ mb/2 in<br />
the b-quark rest frame. However, the b → Xsγ is not mono-chromatic, due to several effects<br />
58
including the width of the Xs mass distribution, gluon emission and the Fermi motion of the<br />
b-quark in the B meson. The non-perturbative Fermi motion effects will raise the photon<br />
energy above mb/2, while the gluon emission will give a long low-energy tail. The low-energy<br />
tail can be described by HQE a part non-perturbative effects that can be modeled by<br />
process-independent shape functions described by a few parameters, e.g. the b quark mass and<br />
the Fermi momentum (µ 2 π) that are considered to be universal in the following inclusive B<br />
decays: B → Xsγ, B → Xsℓℓ, B → Xcℓν and B → Xuℓν. Recently a significant effort was<br />
made to combine all available data for B → Xsγ and B → Xcℓν to determine the HQE<br />
parameters. Using these parameters, B → Xsγ branching fraction results are combined<br />
together to provide a rather precise branching fraction. The method to combine these<br />
measurement has been provided by Limosani [202] and it is different from the method used by<br />
HFAG, as explained below.<br />
The extrapolated branching fractions do not include the published model uncertainties and the<br />
uncertainty on the extrapolation factor. These errors are included in the average by<br />
recalculation in the framework of a particular ansatz. Correlations between different<br />
measurements have been ignored. The parametric error on mb is evaluated by varying mb<br />
within its uncertainty. The world average has been calculated taking into account the<br />
correlations, when available, 7 between partial branching fraction measured at different photon<br />
energy thresholds for each single analysis. In the branching fraction average we use the energy<br />
threshold of each photon energy spectrum that corresponds to the optimal overall uncertainty<br />
on the full rate after extrapolation. This differs from the HFAG method, which uses the lowest<br />
energy thresholds for each spectrum measurement. The HFAG method penalizes analyses that<br />
quote measurements at low Emin, which suffer from larger systematic uncertainties.<br />
Two different calculations were used to extrapolate the measured partial branching fractions<br />
down to a photon energy lower threshold of 1.6 GeV. The extrapolation factors were<br />
determined using m MS<br />
b<br />
and µ 2 π<br />
= 4.243 ± 0.042 GeV as input [178], or with mSF<br />
b<br />
= 4.63 ± 0.04 GeV<br />
= 0.272+0.056<br />
−0.076 GeV2 as input [200]. The two world averages are listed in Table 13 and<br />
they agree within their theoretical errors.<br />
The agreement between the measured B → Xsγ branching fraction and the theoretical<br />
prediction constrains various new physics scenarios. One of the most popular examples is the<br />
lower bound on the type-II charged Higgs mass, since it always constructively interferes with<br />
the SM amplitude. The current limit is around 200 GeV for any tan β if no other destructive<br />
new physics contribution exists [203]. This limit is significantly higher than the direct search<br />
limit.<br />
7 For the time being only Belle provides these correlations.<br />
59
Table 13: Measured branching fractions, minimum photon energy, and branching fractions for<br />
Emin = 1.6 GeV photon energy for b → sγ. The third error is the model uncertainty quoted<br />
by the experiment. Two world averages are calculated extrapolating all the branching fractions<br />
using two different theoretical calculations [178] and [200]. The Belle semi-inclusive measurement<br />
sums up 16 modes, BaBar 38 modes. The Belle inclusive analysis calculates the branching<br />
fraction for different photon energy cut-offs.<br />
Experiment Emin B (10 −6 ) BModif.(10 −6 ) [200] BModif.(10 −6 ) [178]<br />
at Emin Emin = 1.6 GeV Emin = 1.6 GeV<br />
CLEO(Incl.) [204] 2.0 306 ± 41 ± 26 337 323<br />
Belle(Semi-inc) [205] 2.24 336 ± 53 ± 42 496 434<br />
BaBar(Semi-inc) [206] 1.9 327 ± 18 +55<br />
−40 354 337<br />
BaBar(Incl.) [207] 1.9 367 ± 29 ± 34 397 378<br />
BaBar(recoil) [208] 1.9 366 ± 85 ± 60 396 377<br />
Belle(Incl.) [209] 1.7 331 ± 19 ± 37 337 333<br />
Belle(Incl.) [209] 1.8 324 ± 17 ± 24 339 329<br />
Belle(Incl.) [209] 1.9 312 ± 15 ± 16 338 321<br />
Belle(Incl.) [209] 2.0 294 ± 14 ± 12 334 310<br />
Average 1.6 – 350 ± 14exp ± 5mb ± 8 µ 2 π 322 ± 14exp ± 3mb<br />
χ 2 /ndf = 7.3/8 χ 2 /ndf = 8.3/8<br />
New physics contributions may leave the B → Xsγ rate unaltered, with new phases appearing<br />
in the decay loop [198]. Since the Standard Model prediction of the CP asymmetry (ACPsγ) is<br />
zero in the limit of U-spin symmetry [210], significant non-zero values would be evidence for<br />
new phenomena. ACPsγ has been measured by Belle, BaBar and CLEO. The values of all such<br />
measurements are listed in Table 14. All measurements are in agreement with the Standard<br />
Model predictions. BaBar also report a CP-asymmetry for b → (d + s)γ of<br />
ACPsγ = −0.11 ± 0.12 ± 0.02 [207], measured using an inclusive analysis with a lepton tag.<br />
The B-factories also attempted to measure the polarization of the photon in the b → sγ<br />
transition, which can provide a test of the Standard Model, which predicts the photon to be<br />
mainly left-handed [198]. The measurements rely on either the exploitation of the B 0 − ¯ B 0<br />
interference [198] or the interference between higher-Kaon resonances decaying into<br />
Kππ 0 [211]. However, both Belle and BaBar [212] measurements are not precise enough to pin<br />
down the photon polarization. The list of established decay modes of the type B → K (∗) Xγ,<br />
where X is one or more flavorless mesons, is increasing. These channels are interesting as they<br />
can provide a measurement of the polarization of the photon. Many decay involving kaon<br />
resonances modes (e.g. K∗ (892),K1(1270),K ∗ 2 (1430)) are now well established and their<br />
branching ratios agree with the Standard Model predictions.<br />
60
Table 14: CP Asymmetries for exclusive and inclusive b → sγ transitions for B 0 , B ± and B 0 /B ±<br />
admixture.<br />
5.3 B → ℓℓ<br />
Experiment K ∗ γ ACP<br />
BaBar [213] −0.013 ± 0.036 ± 0.010<br />
Belle [214] −0.015 ± 0.044 ± 0.012<br />
CLEO [215] 0.08 ± 0.13 ± 0.03<br />
Average [99] −0.010 ± 0.028<br />
Experiment Xsγ ACP<br />
BaBar [216] −0.011 ± 0.030 ± 0.014<br />
Belle [217] 0.002 ± 0.050 ± 0.030<br />
CLEO [218] −0.079 ± 0.108 ± 0.022<br />
Average [99] −0.012 ± 0.028<br />
Table 15: Summary of upper limits for B → ℓℓ decays.<br />
Mode Experiment UL 90% CL (×10 8 )<br />
B 0 → µ + µ − BaBar [219] 5.2<br />
B 0 → µ + µ − CDF [220] 1.5<br />
Bs → µ + µ − CDF [220] 4.7<br />
Bs → µ + µ − D0 [221] 7.5<br />
B 0 → e + e − BaBar [222] 11.3<br />
B 0 → e + e − Belle [223] 19<br />
B 0 → e + e − CDF [224] 8.3<br />
Bs → e + e − CDF [224] 28<br />
Flavor changing neutral current (FCNC) decays proceed only through loop diagrams in the<br />
Standard Model, and are further reduced by helicity and Glashow-Iliopoulos-Maiani (GIM)<br />
suppression. Thus even the largest branching fraction predicted by the Standard Model,<br />
BSM(Bs → µ + µ − ) ∼ 4 × 10 −9 , is very tiny. New physics can enter either at tree level, for<br />
example through the presence of an additional Z ′ boson, or through new particles appearing in<br />
loops, and can increase the actual value of these branching fractions. Decay modes involving<br />
two muons in the final state are particularly interesting because they are amenable to<br />
measurements in experiments operating at hadronic machines. In fact the best upper limits<br />
come from CDF and D0, which are reaching a sensitivity comparable to the SM prediction.<br />
Table 15 shows a summary of the present experimental values.<br />
61
Table 16: Summary of inclusive and exclusive b → Xsℓℓ branching fractions.<br />
Mode BaBar [225] Belle [226] CDF [227] Average [99]<br />
K + ℓ + ℓ− 0.38 +0.09<br />
K<br />
−0.08 ± 0.02 0.53+0.06 −0.05 ± 0.03 – 0.49 ± 0.05<br />
+ e + e− 0.42 +0.12<br />
K<br />
−0.11 ± 0.02 0.57+0.09 −0.08 ± 0.03 – 0.52 ± 0.07<br />
+ µ + µ − 0.31 +0.15<br />
−0.12 ± 0.03 0.53 ± 0.08+0.07 −0.03 0.59 ± 0.15 ± 0.04 0.50 +0.07<br />
K<br />
−0.06<br />
∗+ ℓ + ℓ− 0.73 +0.50<br />
K<br />
−0.42 ± 0.21 1.24+0.23 −0.20 ± 0.12 – 1.15+0.23 −0.21<br />
∗+ e + e− 0.75 +0.76<br />
K<br />
−0.65 ± 0.38 1.64+0.50 −0.42 ± 0.18 – 1.42+0.43 −0.39<br />
∗+ µ + µ − 0.97 +0.94<br />
−0.69 ± 0.14 1.14+0.32 −0.27 ± 0.10 – 1.12+0.32 −0.27<br />
5.4 B → Xsℓℓ<br />
The physics of B → Xsℓℓ is governed by the Wilson coefficients C7, C9 and C10, which<br />
describe the strengths of the corresponding short-distance operators in the effective<br />
Hamiltonian, i.e. the electromagnetic operator O7 and the semileptonic vector and axial-vector<br />
operators O9 and O10, respectively [197]. The Wilson coefficients are experimental observables.<br />
Contributions from new physics appear in the experiment as deviations from the SM values,<br />
which have been calculated to next-to-next-to-leading order (NNLO). The experimental<br />
knowledge on the Wilson coefficient C7 comes from the inclusive b → Xsγ branching fraction,<br />
which determines its absolute value to about 20% accuracy, but not its sign. The partial<br />
b → Xsℓℓ decay rate in the lepton invariant mass range below the J/ψ resonance is sensitive to<br />
the sign of C7. Measurements of the inclusive b → Xsℓℓ decay rate have been published by<br />
Belle [228] and BaBar [229] (see Table 16, who also report a direct CP asymmetry compatible<br />
with zero, see Table 17.<br />
The inclusive B → Xsℓℓ branching fraction, which constrains C9 and C10 [230], gives no<br />
information on the individual signs and magnitudes of these coefficients. To further pin down<br />
the values of these coefficients, it is necessary to exploit interference effects between the<br />
contributions from different operators. This is possible in B → Xsℓℓ decays by evaluating the<br />
differential inclusive decay rate as a function of the lepton invariant mass, q 2 = m(ℓℓ) 2 , or by<br />
measuring the forward-backward asymmetry in the exclusive decay B → K ∗ ℓℓ.<br />
The forward-backward asymmetry in B → K ∗ ℓℓ, defined as<br />
AFB(q 2 ) = N(q2 ; θBℓ + > θBℓ−) − N(q2 ; θBℓ + < θBℓ−) N(q2 ; θBℓ + > θBℓ−) + N(q2 , (82)<br />
; θBℓ + < θBℓ−) is a function of q 2 and of θ Bℓ −, the angle between the negative lepton and the B meson. It is<br />
an ideal quantity to disentangle the Wilson coefficients Ci since the numerator of Eq. 82 can<br />
62
Table 17: CP Asymmetries for exclusive and inclusive b → Xsℓℓ transitions for B 0 , B ± and<br />
B 0 /B ± admixture.<br />
be expressed as<br />
Mode BaBar [231,232] Belle [226] Average [99]<br />
K + ℓℓ −0.07 ± 0.22 ± 0.02 −0.04 ± 0.10 ± 0.02 −0.05 ± 0.09<br />
K ∗+ ℓℓ – −0.13 ± 0.17 ± 0.02 −0.13 ± 0.17<br />
K 0 ℓℓ – −0.08 ± 0.12 ± 0.02 −0.08 ± 0.12<br />
K ∗0 ℓℓ – −0.10 ± 0.10 ± 0.02 −0.10 ± 0.10<br />
K ∗ ℓℓ 0.03 ± 0.23 ± 0.03 – 0.03 ± 0.23<br />
sℓℓ −0.22 ± 0.26 ± 0.02 – −0.22 ± 0.26<br />
K ∗ ℓℓ 0.03 ± 0.23 ± 0.03 – 0.03 ± 0.23<br />
− C10ξ(q 2 <br />
) × Re(C9)F1 + 1<br />
q2C7F2 <br />
where ξ is a function of q 2 , and F1,2 are functions of form factors. It is straightforward to<br />
determine C10, Re(C9) and the sign of C7 from the AFB distribution as a function of q 2 , using<br />
the value of |C7| from B → Xsγ and a few more assumptions: phases of C10 and C7 are<br />
neglected, and higher order corrections are known. These assumptions should be examined by<br />
comparing the results with the inclusive B → Xsℓℓ differential branching fraction as a function<br />
of q 2 , since it is also sensitive to C9 and C10 in a different way. Most of the eight individual<br />
B → K(K ∗ )ℓℓ modes have been established. Both experiments have searched for asymmetries<br />
with respect to lepton flavour. Currently available data clearly favour a negative sign for C7,<br />
as predicted by the Standard Model.<br />
In some SUSY scenarios the sign of the b → sγ amplitude (C7) can be opposite to the SM<br />
prediction, while the transition rate may be the same. Within the SM there is a zero crossing<br />
point of the forward-backward asymmetry in the low q 2 region, while it disappears with the<br />
opposite sign C7 if the sign of Re(C9) is the same as in the SM. In another model with SU(2)<br />
singlet down-type quarks, tree-level Z flavor-changing-neutral-currents are induced. In this<br />
case, the larger effect is expected on the axial-vector coupling (C10) to the dilepton than on<br />
the vector coupling (C9). Because the forward-backward asymmetry is proportional to the<br />
axial-vector coupling, the sign of the asymmetry can be opposite to the SM. The same new<br />
physics effect is also a possibility for B → φKS where anomalous mixing-induced CP violation<br />
can occur.<br />
Belle attempted to extract C9 and C10 from AFB in B → K ∗ ℓℓ with 357 fb −1 data [233]. The<br />
Belle analysis constrains the sign of the product C9C10 to be negative as in the SM. In this<br />
study higher order QCD correction terms are assumed to be the same as in the Standard<br />
63<br />
(83)
Model. Only the leading order terms, C9 and C10, are allowed to float in the fit to the data.<br />
Since B 0 → K 0∗ ℓ + ℓ − is an all charged particle final state, <strong>LHCb</strong> may be able to measure the<br />
zero crossing point with a better precision than a B factory. However, a model independent<br />
analysis requires measurement of the forward-backward asymmetry in B → Xsℓℓ, which is only<br />
possible at a super-B factory.<br />
The precision of the B → K(K ∗ )ℓℓ branching fractions is dominated by the theoretical errors,<br />
which have large model dependent irreducible uncertainties in the form-factors, which can be<br />
as large as a factor two. These uncertainties are much smaller if the ratio<br />
R K (∗) = B(B → K(K ∗ )µ + µ − )/B(B → K(K ∗ )e + e − ) is measured. In the SM, the B → Ke + e −<br />
and B → Kµ + µ − branching fraction are almost equal, a part from a small phase space<br />
difference due to the lepton masses. However, the B → K ∗ e + e − branching fraction is expected<br />
to be larger than the B → K ∗ µ + µ − branching fraction, due to a larger interference<br />
contribution from B → K ∗ γ in B → K ∗ e + e − . In new physics models with a different Higgs<br />
sector than that of the SM, scalar and pseudo-scalar types of interactions may arise in b → sℓℓ.<br />
Therefore, RK = B(B → Kµ + µ − )/B(B → Ke + e − ) is an observable that is sensitive to new<br />
physics. For example, a neutral SUSY Higgs contribution can significantly enhance only the<br />
B → K(K ∗ )µ + µ − channel at large tan β. The current world average for the branching<br />
fractions gives: RK = 0.96 ± 0.26, dominated by the statistical error.<br />
Finally, the transition b → sν¯ν is theoretically much cleaner than its charged counterpart,<br />
thanks to the absence of the photon penguin diagram and hadronic long-distance effects<br />
(charmonium resonances). From the experimental point of view these modes are very<br />
challenging due to the presence of the two neutrinos. Searches for such modes at the B<br />
factories use a fully reconstructed B sample or semileptonic tagged mode. Both Belle and<br />
BaBar report limits for these modes.<br />
6 Current Status of Overall CKM fits<br />
We have seen that there are no startling departures from the Standard Model. Yet, we need to<br />
formulate quantitatively how restrictive the measurements are. First of all, we can<br />
demonstrate that the data are consistent among the different measurements by plotting the<br />
extracted values of ρ versus η along, with their experimental and theoretical errors, shown in<br />
Figure 27, from many of the measurements described above, also including the measurement of<br />
CP violation in the neutral kaon system, designed as “ǫK.” Physics beyond the Standard<br />
Model could be revealed by seeing a particular measurement that is not in agreement with the<br />
others. The width of the bands are the one-standard deviation combined overall errors. For<br />
64
many of the measurements, e.g. |Vub|, ǫK, ∆md and ∆ms, the theoretical errors dominate and<br />
thus how they are treated is important. The CKM fitter [11] group generally treats the errors<br />
more conservatively than the UT fit group [20]. The former uses a frequentist statistical<br />
approach, while the later a Bayesian approach. The Bayesian errors are smaller, but if the<br />
question is one of seeing new physics or not, a conservative approach may be better. The<br />
η<br />
1.5<br />
1.0<br />
0.5<br />
0.0<br />
-0.5<br />
-1.0<br />
excluded area has CL > 0.95<br />
sin 2β<br />
εK<br />
α<br />
CK M<br />
f i t t e r<br />
ICHEP 08<br />
γ<br />
Vub<br />
γ<br />
α<br />
γ<br />
excluded at CL > 0.95<br />
ρ<br />
β<br />
α<br />
Δmd<br />
& Δms<br />
Δmd<br />
εK<br />
sol. w/ cos 2β<br />
< 0<br />
(excl. at CL > 0.95)<br />
-1.5<br />
-1.0 -0.5 0.0 0.5 1.0 1.5 2.0<br />
Figure 27: The projections in the ρ-η plane from measurements of the angles and sides of the<br />
unitarity triangle. The colored area at the apex shows the 95% confidence level point. (From<br />
the CKM fitter group [69]).<br />
results for the Standard Model CKM parameters from both groups are listed in Table 18. The<br />
Table 18: Values of Wolfenstein parameters from CKM fits assuming the Standard Model<br />
Group ρ η A λ<br />
CKM fitter 0.135 +0.033<br />
−0.016 0.345 +0.015<br />
−0.018 0.795 +0.025<br />
UT fit 0.155±0.022 0.342±0.014<br />
−0.015 0.2252 ± 0.0008<br />
central values of ρ and η are in agreement. The value of λ is in agreement with that found by<br />
Blucher and Marciano [235]. The fact that there is an overlap region common to all the<br />
65
measurements shows no obvious deviation from the Standard Model, which does not predict<br />
values for ρ and η, but merely that the various measurements must find the same values.<br />
To search for deviations from the SM it is useful to compare measurements involving CP<br />
violating loop diagrams, where imaginary parts of amplitudes come into play, with<br />
measurements of the sides of triangle. The UT fit group shows in Figure 28 a comparison in<br />
the ρ-η plane of angle measurements with those of the sides of the unitarity triangle. The<br />
overlap regions in both cases are consistent.<br />
Figure 28: Constraints at 68% confidence level in the ρ-η plane. On the left side are measurements<br />
of the CP violating angles α, β and γ and ǫK in the neutral kaon system. On the<br />
right side are measurements of |Vub|/Vcb| and the ratio of Bs to Bd mixing. (From the UT fit<br />
group [234]).<br />
It remains to set limits on New Physics. We allow for NP to contribute to the mixing<br />
amplitude of either Bd or Bs mesons, which we consider separately. Then the amplitude of this<br />
second order (∆F = 2) flavor changing interaction can be expressed as<br />
<br />
<br />
〈Bq H SM+NP<br />
<br />
<br />
<br />
<br />
Bq〉 = [Re(∆q) + iIm(∆q)] · 〈Bq<br />
∆F=2<br />
H SM+NP<br />
<br />
<br />
∆F=2<br />
Bq〉 , (84)<br />
where q specifies the type of neutral B meson, and ∆q gives the relative size of NP to SM<br />
physics. (The SM point has Re(∆q)=1 and Im(∆q)=0.)<br />
To set limits it is necessary to make some simplifying, but very reasonable, assumptions [236].<br />
We assume that there is no NP in the tree level observables starting with the magnitudes |Vud|,<br />
66
|Vus|, |Vcb|, and |Vub|. Since since γ is measured using tree level B ∓ decays we include it in this<br />
category. Now we incorporate the measurement of β by noting that α = π − γ − β meas , allowing<br />
that the measured β meas = β SM − Arg(∆d). Also used are measurements of the semileptonic<br />
asymmetries (see Eq. 34) [237], and the constraint equation ∆Γs = cos φs∆Γ SM<br />
s [238]. The<br />
allowed range in the ρ-η plane for NP via B mixing is shown in Figure 29.<br />
d<br />
Δ<br />
Im<br />
2<br />
1<br />
0<br />
-1<br />
-2<br />
excluded area has CL > 0.68<br />
A<br />
SL<br />
(B<br />
CK M<br />
) & A (B )<br />
SL s<br />
d<br />
Δmd<br />
& Δms<br />
Re Δ<br />
d<br />
SM point<br />
α<br />
sin 2β;<br />
cos 2β>0<br />
f i t t e r New Physics in B -Bd<br />
mixing<br />
ICHEP 08<br />
d<br />
-2 -1 0 1 2 3<br />
s<br />
Δ<br />
Im<br />
2<br />
1<br />
0<br />
-1<br />
-2<br />
excluded area has CL > 0.68<br />
CK M<br />
A<br />
SL<br />
(B<br />
Δmd<br />
& Δms<br />
) & A (B )<br />
SL s<br />
d<br />
Re Δ<br />
s<br />
SM point<br />
FS<br />
Δ Γs,<br />
ΔΓd/<br />
Γd<br />
& τs<br />
f i t t e r New Physics in B -Bs<br />
mixing<br />
ICHEP 08<br />
s<br />
-2 -1 0 1 2 3<br />
Figure 29: Constraints on the imaginary part versus the real part of a New Physics amplitude<br />
proceedings via B mixing for (left) Bd mesons and (right) Bs mesons. The SM point is at (1,0).<br />
The contours shown are all at 68% confidence level. (From the CM fitter group [69]).<br />
In both case quite large values of the real part of NP amplitudes are allowed. In the Bs case a<br />
large negative value of the imaginary part is also preferred, but again the effect is only 2.7σ.<br />
We can conclude that we need to do a lot more work to constrain NP in these transitions.<br />
7 Conclusions<br />
The goals of our studies are to elucidate the features of the electroweak interactions and the<br />
fundamental constituents of nature. The b was discovered at fixed target experiment in a<br />
proton beam, by the first observation of narrow Υ states in 1977. Experiments at several e + e −<br />
colliders have increased our knowledge enormously. CLEO provided the first fully<br />
reconstructed B mesons and measurements of their mass. The Mark II and MAC experiments<br />
at PEP gave the first measurements of the b lifetime, which were confirmed by PETRA<br />
experiments. ARGUS first measured B 0 mixing. CLEO, ARGUS and the LEP experiments<br />
67<br />
φ<br />
s
competed on the first precision measurements of the CKM parameters Vcb and Vub. The two<br />
most recent, BaBar and Belle, have provided measurements of CP violation.<br />
The hadron collider experiments have measured Bs mixing and are starting to probe CP<br />
violation in the Bs system. The torch will soon be passed to first hadron collider experiment<br />
designed to measure b decays, <strong>LHCb</strong>. The ATLAS and CMS experiments will also contribute.<br />
In the 31 years since the discovery of the b quark we have learned a great deal about the<br />
physics of b-flavored hadrons. We have seen that the Standard Model describes most decays<br />
well, yet studies continue as any new particles that we believe must exist have influence,<br />
especially on rare and CP violating B decays. We expect that future experiments will learn a<br />
great deal about these new particles either by observing their effects on B decays, or by seeing<br />
that they do not have observable effects. The latter case is one that experimentalists do not<br />
like, but it can be just as important in firming up our understanding of the basic constituents<br />
of matter and the forces that operate between them.<br />
Acknowledgements<br />
We thank Phillip Urquijo and Antonio Limosani for useful discussions concerning the CKM<br />
elements. M. Artuso and S. Stone thank the U. S. National Science Foundation for support.<br />
References<br />
1. N. Cabibbo, Phys. Rev. Lett. 10, 531 (1963).<br />
2. J. H. Christenson, J. W. Cronin, V. L. Fitch and R. Turlay, Phys. Rev. Lett., 13, 138<br />
(1964). In CP, C stands for charge conservation invariance and P for parity invariance.<br />
The operation of C takes a particle to anti-particle state and the operation of P changes<br />
left to right. See the article by John Ellis in the <strong>CERN</strong> courier<br />
http://cerncourier.com/cws/article/cern/28092. Also see Yosi Nir in<br />
http://www.symmetrymagazine.org/cms/?pid=1000194. Streaming video of several talks<br />
is available at<br />
http://www-project.slac.stanford.edu/streaming-media/CPViolation/CPViolation.htm.<br />
3. An excellent resource is the book by I. I. Bigi and A. I. Sanda, “CP Violation,”<br />
Cambridge Monographs on Particle Physics, Nuclear Physics and Cosmology (No. 9),<br />
(1999).<br />
68
4. J. J. Aubert et al., Phys. Rev. Lett. 33, 1404 (1974); J. E. Augustin et al., Phys. Rev.<br />
Lett. 33, 1406 (1974).<br />
5. J. D. Bjorken and S. L. Glashow, Phys. Lett. 11, 255 (1964); S. L. Glashow, J. Iliopoulos<br />
and L. Maiani, Phys. Rev. D2, 1412 (1972); S. L. Glashow, “Charm: An Invention<br />
Awaits Discovery,” IV Int. Conf. on Experimental Meson Spectroscopy, Apr, 1974,<br />
Boston, Mass. Published in AIP Conf. Proc. 21, 387 (1974).<br />
6. M. Kobayashi and T. Maskawa, Progress in Theoretical Physics 49, 652 (1973).<br />
7. Particle Data Group, C. Amsler et al., Phys. Lett. B 667, 1 (2008).<br />
8. S. L. Glashow, Nucl. Phys. 22 579, (1961); S. Weinberg, Phys. Rev. Lett. 19 1264,<br />
(1967); A. Salam in Elementary Particle Physics (Nobel Symp. N.8), Ed. N.Svartholm,<br />
Almquist and Wiksells, Stockholm (1968), p.367.<br />
9. To view a cartoon of the mechanism of Higgs mass generation see<br />
http://www.exploratorium.edu/origins/cern/ideas/higgs.html.<br />
10. L. Wolfenstein, Phys. Rev. Lett. 51, 1945 (1983).<br />
11. J. Charles et al. Eur. Phys. J. C41, 1 (2005); see also<br />
http://www.slac.stanford.edu/xorg/ckmfitter/ckm intro.html.<br />
12. R. Aleksan et al., Phys. Rev. Lett. 73, (1994) 18; J. P. Silva and L. Wolfenstein, Phys.<br />
Rev. D55, 5331 (1997).<br />
13. M. A. Srednicki, “Particle Physics and Cosmology: Dark Matter,” Amsterdam,<br />
Netherlands, North-Holland (1990).<br />
14. D. Hunter, G. D. Starkman and M. Trodden, Phys. Rev. D66, 043511 (2002).<br />
15. J. Hewett and M. Spiropulu, Ann. Rev. Nucl. Part. Sci. 52, 397 (2002).<br />
16. A. Sakharov, JETP, 5, 32 (1967).<br />
17. M. B. Gavela, P Hernandez, J. Orloff and O. Pene, Modern Phys. Lett. A 9, 795 (1994),<br />
and references contained therein.<br />
18. http://www.esi-topics.com/brane/interviews/DrLisaRandall.html.<br />
19. http://www.slac.stanford.edu/econf/C040802/lec notes/Lykken/default.htm.<br />
20. See http://www.utfit.org/.<br />
21. H. Albrecht et al. (ARGUS), Phys. Lett. B 192, 245 (1987).<br />
69
22. C. Albajar et al. (UA1), Phys. Lett. B 186, 247 (1987), erratum-ibid B 197 565, (1987).<br />
23. R. Akers et al. (OPAL), Z. Phys. C 66, 555 (1995).<br />
24. E. Barberio et al. (HFAG), “Averages of b-hadron and c-hadron Properties at the End of<br />
2007,” arXiv:0808.1297 [hep-ex].<br />
25. M. Gaillard and B. Lee, Phys. Rev. D 10, 897 (1974).<br />
26. A. Abulencia, et al. (CDF), Phys. Rev. Lett. 97, 062003 (2006)<br />
[arXiv:hep-ex/0606027v1], ibid 97, 214003 (2006) [arXiv:hep-ex/0609040v1].<br />
27. V. Abazov et al. (D0), Phys. Rev. Lett. 97, 021802 (2006) [arXiv:hep-ex/0603029v2].<br />
28. H. G. Moser and A. Roussarie, Nucl. Instrum. Methods Phys. Res., Sect. A 384, 491<br />
(1997).<br />
29. E. Follana, C. T. H. Davies, G. P. Lepage, and J. Shigemitsu, Phys. Rev. Lett. 100,<br />
062002 (2008,) arXiv:0706.1726v2 [hep-lat].<br />
30. B. I. Eisenstein et al. (CLEO), Phys. Rev. D 78, 052003 (2008), arXiv:0806.2112v3<br />
[hep-ex].<br />
31. J. Rosner and S. Stone, “Decay Constants of Charged Pseudoscalar Mesons,” review for<br />
the Particle Data Group [7], arXiv:0802.1043v3 [hep-ex]. For updated results see P.U.E.<br />
Onyisi et al.(CLEO), arXiv:0901.1147 [hep-ex], and J. P. Alexander et al.(CLEO),<br />
arXiv:0901.1216 [hep-ex].<br />
32. N. Tantalo, “Lattice calculations for B and K mixing,” [arXiv:hep-ph/0703241v1].<br />
33. M. Beneke, G. Buchalla, A. Lenz and U. Nierste, Phys. Lett. B 576, 173 (2003)<br />
[hep-ph/0307344].<br />
34. B. Aubert et al. (BABAR), arXiv:0808.1903 [hep-ex]; K. F. Chen et al. (BELLE) Phys.<br />
Rev. Lett. 98, 031802 (2007) arXiv:hep-ex/0608039v4 [hep-ex].<br />
35. P. C. Bhat, and H. B. Prosper, “Multivariate Methods in High Energy Physics: The<br />
Neural Network Revolution, World Scientific, ISBN-13: 978-9810243470 (2005); see also<br />
http://neuralnets.web.cern.ch/NeuralNets/nnwinhep.html.<br />
36. R. Itoh et al. (BELLE), Phys. Rev. Lett. 95, 091601 (2005) [hep-ex/0504030]; B. Aubert<br />
et al. BABAR Phys. Rev. D 71, 032005 (2005) [hep-ex/0411016].<br />
37. B. Aubert, et al. (BABAR), arXiv:0807.4226v2 [hep-ex]; H. Ishino et al. (BELLE), Phys.<br />
Rev. Lett. 98, 211801 (2007) [hep-ex/0608035].<br />
70
38. L. Wolfenstein Phys. Lett. 13, 562 (1964).<br />
39. M. Gronau and D. London, Phys. Rev. Lett. 65, 3381 (1990).<br />
40. Y. Grossman and H. Quinn, Phys. Rev. D 58, 017504 (1998). See also J. Charles, Phys.<br />
Rev. D 59, 054007 (1999) [hep-ph/9806468]; M. Gronau, D. London, N. Sinha and R.<br />
Sinha, Phys. Lett. B 514, 315 (2001) [hep-ph/0105308].<br />
41. I. Dunietz, H. R. Quinn, A. Snyder, W. Toki and H. J. Lipkin, Phys. Rev. D 43, 2193<br />
(1991).<br />
42. B. Aubert et al. (BABAR) Phys. Rev. D 76, 052007 (2007) arXiv:0705.2157 [hep-ex].<br />
43. A. Somov et al. BELLE, Phys. Rev. Lett. 96, 171801 (2006) [arXiv:hep-ex/0601024].<br />
44. A. F. Falk, Z. Ligeti, Y. Nir, and H. Quinn, Phys. Rev. D 69, 011502 (2004)<br />
[hep-ph/0310242].<br />
45. http://ckmfitter.in2p3.fr/.<br />
46. A. E. Snyder and H. Quinn, Phys. Rev. D 48, 2139 (1993).<br />
47. B. Aubert et al. (BABAR), [arXiv:hep-ex/0703008v2].<br />
48. A. Kusaka et al. (BELLE), Phys. Rev. Lett. 98, 221602 (2007) [arXiv:hep-ex/0701015].<br />
49. H. J. Lipkin, Y. Nir, H. R. Quinn, and A. E. Snyder, Phys. Rev. D 44, 1454 (1991); M.<br />
Gronau, Phys. Lett. B 265, 389 (1991).<br />
50. P. Robbe (<strong>LHCb</strong>), Nucl. Phys. Proc. Suppl. 170, 46 (2007).<br />
51. J. Charles, A. Hocker, H. Lacker, F.R. Le Diberder, S. T’Jampens,<br />
[arXiv:hep-ph/0607246v1].<br />
52. M. Gronau and D. Wyler, Phys. Lett. B 265, 172 (1991); see also M. Gronau and D.<br />
London, Phys. Lett. B 253, 483 (1991).<br />
53. A. Bondar and T. Gerson, Phys. Rev. D 70, 091503 (2004) [arXiv:hep-ph/0409281].<br />
54. B. Aubert et al. BABAR, Phys. Rev. D 77 111102 (2008) arXiv:0802.4052 [hep-ex]; K.<br />
Abe et al. (BELLE), Phys. Rev. D 73, 051106 (2006) [hep-ex/0601032]; K.<br />
Gibson (CDF), arXiv:0809.4809; B. Aubert et al. BABAR, arXiv:0807.2408v2 [hep-ex];<br />
K. Abe et al. (BELLE), Phys. Rev. D 73, 051106 (2006) [hep-ex/0601032]; G.<br />
Marchiori (BABAR) arXiv:0810.0502.<br />
55. D. Atwood, I. Dunietz and A. Soni, Phys. Rev. Lett. 78, 3257 (1997) [hep-ph/9612433].<br />
71
56. Y. Horii et al. (BELLE), arXiv:0804.2063v1 [hep-ex]; B. Aubert et al. (BABAR) Phys.<br />
Rev. D 72, 032004 (2005) [hep-ex/0504047].<br />
57. R.H. Dalitz, Phys. Rev. 94, 1046 (1954).<br />
58. A. Giri, Y. Grossman, A. Soffer, and J. Zupan, Phys. Rev. D 68, 054018 (2003)<br />
[arXiv:hep-ph/0303187].<br />
59. B. Aubert et al. (BABAR), Phys. Rev. D 78, 034023 (2008) arXiv:0804.2089 [hep-ex],<br />
they also include the mode D 0 → KSK + K − .<br />
60. K. Abe et al. (BELLE), arXiv:0803.3375 [hep-ex];<br />
61. A. Bondar and Poluektov, Eur. Phys. J. C47, 347 (2006); A. Bondar, A. Poluektov,<br />
arXiv:0801.0840 [hep-ex].<br />
62. P. Naik (CLEO), arXiv:0810.3666 [hep-ex].<br />
63. J. L. Rosner, Phys. Rev. D 42, 3732 (1990).<br />
64. A. S. Dighe, I. Dunietz, H. J. Lipkin and J. L. Rosner, Phys. Lett. B 369, 144 (1996)<br />
[hep-ph/9511363].<br />
65. T. Kuhr (CDF), arXiv:0710.1789 [hep-ex]).<br />
66. A. S. Dighe, I. Dunietz and R. Fleischer, Eur. Phys. J. C 6, 647 (1999).<br />
67. T. Aaltonen et al.(CDF), Phys. Rev. Lett. 100, 161802 (2008) arXiv:0712.2397v1<br />
[hep-ex]; updated results in D. Tonelli et al. (CDF), arXiv:0810.3229v2 [hep-ex].<br />
68. V. M. Abazov et al. (D0), arXiv:0802.2255v1 [hep-ex].<br />
69. J. Charles (CKM Fitter)<br />
http://www.slac.stanford.edu/xorg/ckmfitter/TalkBuffer/StatusOfTheCkmMatrixCapri2008.pdf,<br />
see also O. Deschamps (CKM Fitter) arXiv:0810.3139v1 [hep-ph].<br />
70. J. Blouw (<strong>LHCb</strong>), arXiv:0710.5124v2 [hep-ex].<br />
71. S. Stone and L. Zhang, arXiv:0812.2832v3 [hep-ph].<br />
72. B. Aubertet et al. (BABAR), Phys. Rev. D76, 031102 (2007) arXiv:0704.0522v2 [hep-ex].<br />
73. B. Aubert et al.(BABAR), Phys. Rev. Lett. 93, 131801 (2004) [arXiv:hep-ex/0407057].<br />
74. B. Aubert et al., (BABAR), arXiv:0807.4226 [hep-ex].<br />
75. S.-W. Lin et al.(BELLE), Nature 452, 332 (2008).<br />
72
76. M. Peskin, Nature 452, 293 (2008).<br />
77. C. Jarlskog, Phys. Rev. D 35, 1685 (1987).<br />
78. M. Trodden, Rev. Mod. Phys. 71, 1463, (1999).<br />
79. R. Tarrach, Nucl. Phys. B 183, 384 (1981); A. S. Kronfeld, Phys. Rev. D 58, 051501<br />
(1998); P. Gambino and P. A. Grassi, Phys. Rev. D 62, 076002 (2000).<br />
80. I. I. Bigi, M. A. Shifman, N. G. Uraltsev and A. I. Vainshtein, Phys. Rev. D 50, 2234<br />
(1994); M. Beneke and V. M. Braun, Nucl. Phys. B 426, 301 (1994).<br />
81. N. Gray, D. J. Broadhurst, W. Grafe and K. Schilcher, Z. Phys. C 48, 673 (1990);<br />
K. Melnikov and T. v. Ritbergen, Phys. Lett. B 482, 99 (2000); K. G. Chetyrkin and<br />
M. Steinhauser, Nucl. Phys. B 573, 617 (2000).<br />
82. A. H. Hoang et al., Eur. Phys. J. C 3, 1 (2000).<br />
83. I. I. Bigi, M. A. Shifman and N. G. Uraltsev, Ann. Rev. Nuc. Part. Sci. 47, 591 (1997).<br />
84. P. Gambino, private communication (2006).<br />
85. A. H. Hoang, Z. Ligeti and A. V. Manohar, Phys. Rev. Lett. 82, 277 (1999).<br />
A. H. Hoang, Z. Ligeti and A. V. Manohar, Phys. Rev. D 59, 074017 (1999).<br />
86. E. Gardi for HFAG 2008 averages.<br />
87. C.McNelle, C. Michael and G. Thompson, Physics Letters B 600, 77 (2004).<br />
88. A. Penin and M. Steinhauser, Phys. Lett. B 538, 335 (2002).<br />
89. J.H Kuhn et al, Nucl. Phys. B 778, 192 (2007).<br />
90. A. H. Hoang, Phys. Lett. B 483, 94 (2000).<br />
91. N. Isgur and M. B. Wise, “Heavy Quark Symmetry,” page 231, in B Decays Revised<br />
2nd Edition, ed. S. Stone, World Scientifc, Singapore (1994) .<br />
92. C. Glenn Boyd, B. Grinstein and R.F. Lebed, Phys. Lett. B 353, 306 (1995).<br />
93. J. Chay, H. Georgi and B. Grinstein, Phys. Lett. B 247, 399 (1990).<br />
94. C. Bernard et al. Submitted to Phys. Rev. D, arXiv:0808.2519 .<br />
95. N. E. Adam et al. (CLEO), Phys. Rev. D 67, 032001 (2003) [arXiv:hep-ex/0210040].<br />
96. J. E. Duboscq et al. (CLEO), Phys. Rev. Lett. 76, 3898 (1996).<br />
73
97. I. Adachi et al. (BELLE), arXiv:0810.1657 [hep-ex].<br />
98. B. Aubert et al. (BABAR), Phys. Rev. D 74, 092004 (2006).<br />
99. ICHEP08 updates available online at:<br />
http://www.slac.stanford.edu/xorg/hfag/semi/ichep08/home.shtml.<br />
100. D. Abbaneo et al. [ALEPH, CDF, DELPHI, L3, OPAL, SLD], arXiv:hep-ex/0112028. See<br />
references therein.<br />
101. B. Aubert et al. (BABAR), Phys.Rev.D 77, 032002 (2008).<br />
102. B. Aubert et al. (BABAR), arXiv:0712.3493 [hep-ex]<br />
103. B. Aubert et al. (BABAR), arXiv:0809.0828 [hep-ex]<br />
104. K.Abe, et al. (BELLE), Phys. Lett .B 526, 247 (2002).<br />
105. R. A. Briere et al. (CLEO), Phys. Rev. Lett. 89, 081803 (2002).<br />
106. I. Caprini, L. Lellouch and M. Neubert, Nucl. Phys. B 530, 153 (1998); C.G. Boyd, B.<br />
Grinstein, R.F. Lebed, Phys. Rev. D 56, 6895 (1997).<br />
107. B. Aubert et al. (BABAR), arXiv:0807.4978 [hep-ex].<br />
108. B. Aubert et al. (BABAR), arXiv:0809.0828 [hep-ex].<br />
109. B. Aubert et al. (BABAR), arXiv:0712.3503 [hep-ex].<br />
110. K. Abe, et al. (BELLE), Phys. Lett. B 526, 258 (2002).<br />
111. J. Bartelt, et al. (CLEO), Phys. Rev. Lett. 82, 3746 (1999).<br />
112. N. Isgur and M. Wise, Phys. Rev. D 93, 819 (1991).<br />
113. M. Okamoto (Fermilab Lattice, MILC and HPQCD Collaborations), Int. J. Mod. Phys. A<br />
20, 3469 (2005).<br />
114. B. Aubert et al. (BABAR), arXiv:0809.0828 [hep-ex].<br />
115. A. Anastassov et al. (CLEO), Phys. Rev. Lett. 80, 4127 (1998).<br />
116. V. Abazov et al. (D0), Phys. Rev. Lett. 95, 171803 (1995).<br />
117. B. Aubert et al. (BABAR), arXiv:0708.1738 [hep-ex].<br />
118. D. Liventsev, T. Matsumoto et al. (BELLE), Phys. Rev. D 72, 051109(R) (2005).<br />
74
119. K. Abe et al. (BELLE), Phys. Rev. Lett. 94, 221805 (2005);<br />
K. Abe et al. (BELLE), Phys. Rev. D 69, 112002 (2004).<br />
120. C. W. Bauer et al., Phys. Rev. D 70, 94017 (2004).<br />
121. O. Buchmuller, H. Flacher, Phys. Rev. D 73, 73008 (2006).<br />
122. K. Wilson, Phys. Rev. 179, 1499 (1969).<br />
123. D. Benson et al., Nucl. Phys. B 665, 367 (2003).<br />
124. M. Gremm and A. Kapustin, Phys. Rev. D55, 6924 (1997).<br />
125. A. Falk, M. Luke, and M.J. Savage, Phys. Rev. D 53, 2491 (1996); A. F. Falk and<br />
M. Luke, Phys. Rev. D 57, 424 (1998).<br />
126. P. Gambino and N. Uraltsev, Eur. Phys. J. C 34, 181 (2004).<br />
127. D. Benson et al., Nucl. Phys. B 710, 371 (2005).<br />
128. B. Aubert et al. (BABAR), Phys. Rev. D 69, 111103 (2004).<br />
129. C. Schwanda et al. (BELLE), Phys. Rev. D 75, 032005 (2007).<br />
130. A.H Mahmood et al. (CLEO) Phys. Rev. D 70, 32002 (2004).<br />
131. S. Chen et al., Phys. Rev. Lett. 87, 251807 (2001).<br />
132. J. Abdallah et al. (DELPHI), Eur. Phys. J. C 45, 35 (2006).<br />
133. D. Acosta, et al. (CDF), Phys.Rev. D 71, 051103 (2005).<br />
134. N. Isgur, Phys. Lett. B 448, 111 (1999).<br />
135. K. Abe et al. (BELLE), [ArXiv:hep-ex/0408139]; ibid. [ArXiv:hep-ex/0409015].<br />
136. A. H. Mahmood et al. (CLEO), Phys. Rev. Lett. 67, 072001, (2003).<br />
137. A. Höcker and V. Kartvelishvili, Nucl. Instr. Meth. A 372 (1996) 469.<br />
138. P. Urquijo et al. (BELLE), Phys. Rev. D75, 032001 (2007).<br />
139. K. Abe et al. (BELLE), [arXiv:hep-ex/0611047].<br />
140. K. Abe et al. (BELLE), [arXiv:hep-ex/0508005].<br />
141. P. Urquijo, “Measurement of the CKM elements |Vcb| and |Vub| from inclusive semileptoic<br />
B decays”, PhD thesis (2008).<br />
75
142. N. Uraltsev, Int. J. Mod. Phys. A 20, 2099 (2005).<br />
143. Presented by C. Schwanda, CKM08, Rome, Italy (2008).<br />
144. V. Aquila, P. Gambino, G. Ridolfi, and N. Uraltsev, Nucl. Phys. B 719, 77 (2005); A.<br />
Pak and A. Czarnecki, Phys. Rev. D 78, 114015 (2008); M. Dowling et al. Phys. Rev. D<br />
78, 074029 (2008). See also K. Melnikov, arXiv:0803.0951v1 [hep-ph].<br />
145. K. Melnikov, arXiv:0803.0951 [hep-ph] (2008).<br />
146. T. Beicher et al., arXiv:0710.0680 (2007).<br />
147. B. M. Dassinger, T. Mannel and S. Turczyk, JHEP 0703, 087 (2007)<br />
[arXiv:hep-ph/0611168].<br />
148. N. E. Adam et al. (CLEO), Phys. Rev. Lett. 99, 041802 (2007) [arXiv:hep-ex/0703041].<br />
149. B. Aubert et al. (BABAR), Phys. Rev. Lett. 98, 091801 (2007) [arXiv:hep-ex/0612020].<br />
150. T. Hokuue et al. (BELLE), Phys. Lett. B 648, 139 (2007) [arXiv:hep-ex/0604024].<br />
151. B. Aubert et al. (BABAR), Phys. Rev. Lett. 97, 211801 (2006) [arXiv:hep-ex/0607089].<br />
152. K. Abe et al. (BELLE), [arXiv:hep-ex/0610054].<br />
153. N. Isgur, D. Scora, B. Grinstein and M.B. Wise, Phys Rev. D 39, 799 (1989).<br />
154. P. Ball and R. Zwicky, Phys. Rev. D 71, 014015 (2005) [arXiv:hep-ph/0406232].<br />
155. D. Becirevic and A. B. Kaidalov, Phys. Lett. B 478, 417 (2000) [arXiv:hep-ph/9904490].<br />
156. R. Hill, Phys. Rev. D 73, 014012 (2006) [arXiv:hep-ph/0505129v2].<br />
157. K. C. Bowler et al. [UKQCD Collaboration], Phys. Lett. B 486, 111 (2000)<br />
[arXiv:hep-lat/9911011].<br />
158. J. Shigemitsu, S. Collins, C. T. H. Davies, J. Hein, R. R. Horgan and G. P. Lepage, Phys.<br />
Rev. D 66, 074506 (2002) [arXiv:hep-lat/0207011].<br />
159. M. Okamoto et al., Nucl. Phys. Proc. Suppl. 140, 461 (2005) [arXiv:hep-lat/0409116].<br />
160. E. Dalgic, A. Gray, M. Wingate, C. T. H. Davies, G. P. Lepage and J. Shigemitsu, Phys.<br />
Rev. D 73, 074502 (2006) [Erratum-ibid. D 75, 119906 (2007)] [arXiv:hep-lat/0601021].<br />
161. M. C. Arnesen, B. Grinstein, I. Z. Rothstein and I. W. Stewart, Phys. Rev. Lett. 95,<br />
071802 (2005) [arXiv:hep-ph/0504209].<br />
76
162. J. M. Flynn and J. Nieves, PoS LAT2007, 352 (2007) arXiv:0711.3339 [hep-lat].<br />
163. J. Bailey et al., arXiv:0811.3640 [hep-lat].<br />
164. B. Aubert et al. (BABAR), Phys. Rev. Lett. 97, 211801 (2006) [arXiv:hep-ex/0607089].<br />
165. B. O. Lange, M. Neubert and G. Paz, Phys. Rev. D 72, 073006 (2005)<br />
[arXiv:hep-ph/0504071].<br />
166. J. E. Bartelt et al. (CLEO), Phys. Rev. Lett. 71, 4111 (1993).<br />
167. N. Isgur, J. Phys. G 18, 1665 (1992).<br />
168. I. I. Y. Bigi, M. A. Shifman, N. G. Uraltsev and A. I. Vainshtein, Int. J. Mod. Phys. A 9,<br />
2467 (1994) [arXiv:hep-ph/9312359].<br />
169. M. Neubert, Phys. Rev. D 49, 3392 (1994) [arXiv:hep-ph/9311325].<br />
170. A. Bornheim et al. CLEO Collaboration Phys. Rev. Lett. 88, 231803 (2002).<br />
171. A. Limosani et al. (BELLE), Phys. Lett. B 621, 28 (2005).<br />
172. B. Aubert et al. (BABAR), Phys. Rev. D 73, 012006 (2006).<br />
173. I. I. Y. Bigi, R. D. Dikeman and N. Uraltsev, Eur. Phys. J. C 4, 453 (1998)<br />
[arXiv:hep-ph/9706520].<br />
174. C. W. Bauer, Z. Ligeti and M. Luke, arXiv:hep-ph/0111387.<br />
175. C. W. Bauer, Z. Ligeti and M. E. Luke, Phys. Lett. B 479, 395 (2000)<br />
[arXiv:hep-ph/0002161].<br />
176. B. Aubert et al. (BABAR), Phys. Rev. Lett. 100, 171802 (2008) arXiv:0708.3702 [hep-ex].<br />
177. B.O. Lange, M. Neubert and G. Paz. Phys. Rev. D 72, 073006 (2005).<br />
178. J.R. Andersen and E. Gardi. JHEP 0601, 097 (2006).<br />
179. P. Gambino, P. Giordano, G. Ossola and N. Uraltsev, JHEP 0710, 058 (2007)<br />
arXiv:0707.2493 [hep-ph].<br />
180. V. Aquila, P. Gambino, G. Ridolfi and N. Uraltsev, Nucl. Phys. B 719, 77 (2005)<br />
[arXiv:hep-ph/0503083].<br />
181. E. Gardi, JHEP 0404, 049 (2004) [arXiv:hep-ph/0403249].<br />
182. U. Aglietti, G. Ferrera and G. Ricciardi, Nucl. Phys. B 768, 85 (2007)<br />
[arXiv:hep-ph/0608047].<br />
77
183. J. L. Rosner et al. (CLEO), Phys. Rev. Lett. 96, 121801 (2006) [arXiv:hep-ex/0601027].<br />
184. M. B. Voloshin, Phys. Lett. B 515, 74 (2001) [arXiv:hep-ph/0106040].<br />
185. N. E. Adam et al. (CLEO), Phys. Rev. Lett. 97, 251801 (2006) [arXiv:hep-ex/0604044].<br />
186. J. Yelton et al. (CLEO), [arXiv:0903.0601].<br />
187. M. Steinhauser, arXiv:0809.1925 [hep-ph].<br />
188. A. Gray et al. [HPQCD Collaboration], Phys. Rev. Lett. 95, 212001 (2005)<br />
[arXiv:hep-lat/0507015].<br />
189. X. H. Guo and M. H. Weng, Eur. Phys. J. C 50, 63 (2007) [arXiv:hep-ph/0611301].<br />
190. C. Bernard et al. [Fermilab Lattice, MILC and HPQCD Collaborations], PoS LAT2007,<br />
370 (2007).<br />
191. K. Ikado et al. (BELLE), Phys. Rev. Lett. 97, 251802 (2006).<br />
192. I. Adachi (et al.) (BELLE), arXiv:0809.3834 .<br />
193. B. Aubert et al. (BABAR), Phys. Rev. D 77, 011107 (2008).<br />
194. et al. (BABAR), arXiv:0809.4027 [hep-ex].<br />
195. S. Trine, arXiv:0810.3633 [hep-ph].<br />
196. Flavour in the era of the LHC <strong>CERN</strong>, 15-17 May, 2006, Yellow Reports<br />
(<strong>CERN</strong>-2007-004) and reference therein.<br />
197. G. Buchalla, A.J. Buras, M. E. Lautenbacher, Rev. Mod. Phys. 68, 1125 (1996).<br />
198. D.Atwood, M. Gronau, A. Soni, Phys. Rev. Lett. 79, 185 (1997); B. Grinstein, Y.<br />
Grossman, Z. Ligeti, D. Pirjol Phys. Rev. D 71, 011504 (2005).<br />
199. M. Misiak et al., Phys. Rev. Lett. 98, 022002 (2007).<br />
200. T. Becher, M. Neubert, Phys. Rev. Lett. 98, 022003 (2007).<br />
201. S. J. Lee, M. Neubert and G. Paz, Phys. Rev. D 75, 114005 (2007)<br />
[arXiv:hep-ph/0609224].<br />
202. A. Limosani, in a private communication performed the average for this article.<br />
203. P. Gambino and M. Misiak, Nucl. Phys. B 611, 338 (2001) [arXiv:hep-ph/0104034].<br />
204. S. Chen et al. (CLEO), Phys. Rev. Lett. 87, 251807 (2001).<br />
78
205. K. Abe et al. (BELLE), Phys. Lett. B 511, 151 (2001).<br />
206. B. Aubert et al. (BABAR), Phys. Rev. D 72, 052004 (2005).<br />
207. B. Aubert et al. (BABAR), Phys. Rev. Lett. 97, 171803 (2006).<br />
208. B. Aubert et al. (BABAR), Phys. Rev. D 77, 051103 (2008).<br />
209. A. Limosani et al. (BELLE), presented at Moriond E.W. (2008).<br />
210. T. Hurt, E. Lunghi, W. Porod, Nucl. Phys. B 704, 56 (2005).<br />
211. M. Gronau, Y. Grossman, D. Pirjol, A. Ryd, Phys. Lett. 88, 051802 (2002); M. Gronau<br />
and D. Pirjol Phys. Rev. D 66, 054008 (2002).<br />
212. B. Aubert et al., (BABAR), Phys. Rev. D 72, 051103 (2004); M. Nakao et al. (BELLE),<br />
Phys. Rev. D 69, 112001 (2004).<br />
213. B. Aubert et al. (BABAR), Phys. Rev. D 70, 112006 (2004).<br />
214. M. Nakao et al. (BELLE), Phys. Rev. D 69, 112001 (2004).<br />
215. M. Beneke et al., JHEP 0506, 071 (2005).<br />
216. B. Aubert et al. (BABAR), arXiv:0805.4796 (submitted to PRL).<br />
217. S. Nishida et al.(BELLE), Phys. Rev. Lett. 93, 031803 (2004).<br />
218. T. E. Coan et al. (CLEO), Phys. Rev. Lett. 86, 5661 (2001).<br />
219. B. Aubert et al. (BABAR), Babar Collaboration Phys. Rev. D bf 77, 032007 (2008).<br />
220. T. Aaltonen et al (CDF), Phys. Rev. Lett. 100, 101802 (2008).<br />
221. V. Abazov et al . (D0), Phys. Rev. D 76, 092001 (2007).<br />
222. B. Aubert et al. (BABAR), Phys. Rev. D 77, 032007 (2008).<br />
223. M.C. Chang et al BELLE collaboration Phys. Rev. D 68, 111101 (2003).<br />
224. R. F. Harr, (CDF), “Rare Decays of B and D Hadrons at CDF,” arXiv:0810.3444<br />
[hep-ex].<br />
225. B. Aubert et al. (BABAR), Phys. Rev. D 73, 092001 (2006).<br />
226. I. Adachi, et al. (Belle), arXiv:0810.0335 [hep-ex].<br />
227. A. Aaltonen et al. (CDF), arXiv:0804.3908, (2008).<br />
79
228. M. Iwasaki et al. (BELLE, Phys. Rev. D 72, 092005 (2005).<br />
229. B. Aubert et al. (BABAR), Phys. Rev. Lett. 93, 081802 (2004).<br />
230. A. Ali, E. Lunghi, C. Greub, M. Walker, Phys. Lett. B 66, 034002 (2002).<br />
231. B. Aubert et al. (BABAR), Phys. Rev. D 73, 092001 (2006).<br />
232. B. Aubert et al. (BABAR), Phys. Rev. Lett. 93, 081802 (2004).<br />
233. A. Ishikawa et al., Phys. Rev. Lett. 96, 251801 (2006) [arXiv:hep-ex/0603018].<br />
234. M. Pierini,“Update on the unitarity triangle (UTFit),” presented at 34th Int. Conf. on<br />
High Energy Physics (ICHEP 2008), Philadelphia, PA, July 2008.<br />
235. E. Blucher and W. B. Marciano, “Vud, Vus, THE CABIBBO ANGLE, AND CKM<br />
UNITARITY,” in the Particle Data Group reviews [7].<br />
236. This type of analysis was done with somewhat different assumptions earlier by K.<br />
Agashe, M. Papucci, G. Perez and D. Pirjol [hep-ph/0509117].<br />
237. Measurement of ASL for Bs mesons are given by V. Abazov et al. (D0), Phys. Rev. Lett.<br />
98, 151801 (2007); CDF Note 9015 07-08-16 available at<br />
http://www-cdf.fnal.gov/physics/new/bottom/bottom.html. See also S. Laplace, Z.<br />
Ligeti, Y. Nir, and G. Perez, Phys. Rev. D 65, 094040, (2002) [hep-ph/0202010] and<br />
references contained therein.<br />
238. There are considerable theoretical uncertainties, see A. Lenz and U. Nierste, JHEP 06, 72<br />
(2007) [hep-ph/0612167].<br />
80