Electronics of LHCb calorimeter monitoring system - LHCb - Cern
Electronics of LHCb calorimeter monitoring system - LHCb - Cern
Electronics of LHCb calorimeter monitoring system - LHCb - Cern

Create successful ePaper yourself
Turn your PDF publications into a flip-book with our unique Google optimized e-Paper software.
<strong>Electronics</strong> <strong>of</strong> <strong>LHCb</strong> <strong>calorimeter</strong> <strong>monitoring</strong> <strong>system</strong><br />
A. Konoplyannikov a , on behalf <strong>of</strong> the <strong>LHCb</strong> <strong>calorimeter</strong> group<br />
Abstract<br />
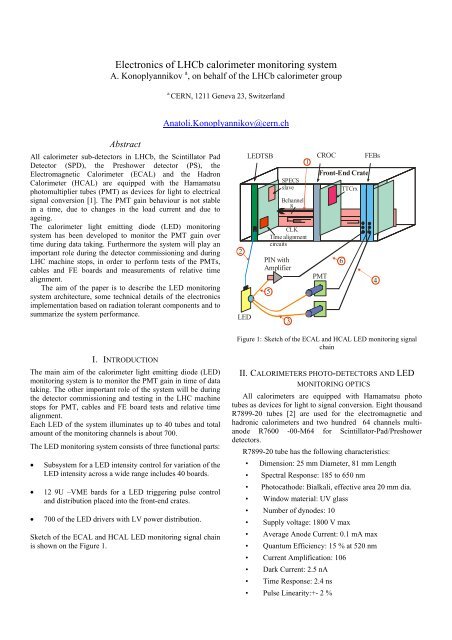
All <strong>calorimeter</strong> sub-detectors in <strong>LHCb</strong>, the Scintillator Pad<br />
Detector (SPD), the Preshower detector (PS), the<br />
Electromagnetic Calorimeter (ECAL) and the Hadron<br />
Calorimeter (HCAL) are equipped with the Hamamatsu<br />
photomultiplier tubes (PMT) as devices for light to electrical<br />
signal conversion [1]. The PMT gain behaviour is not stable<br />
in a time, due to changes in the load current and due to<br />
ageing.<br />
The <strong>calorimeter</strong> light emitting diode (LED) <strong>monitoring</strong><br />
<strong>system</strong> has been developed to monitor the PMT gain over<br />
time during data taking. Furthermore the <strong>system</strong> will play an<br />
important role during the detector commissioning and during<br />
LHC machine stops, in order to perform tests <strong>of</strong> the PMTs,<br />
cables and FE boards and measurements <strong>of</strong> relative time<br />
alignment.<br />
The aim <strong>of</strong> the paper is to describe the LED <strong>monitoring</strong><br />
<strong>system</strong> architecture, some technical details <strong>of</strong> the electronics<br />
implementation based on radiation tolerant components and to<br />
summarize the <strong>system</strong> performance.<br />
I. INTRODUCTION<br />
The main aim <strong>of</strong> the <strong>calorimeter</strong> light emitting diode (LED)<br />
<strong>monitoring</strong> <strong>system</strong> is to monitor the PMT gain in time <strong>of</strong> data<br />
taking. The other important role <strong>of</strong> the <strong>system</strong> will be during<br />
the detector commissioning and testing in the LHC machine<br />
stops for PMT, cables and FE board tests and relative time<br />
alignment.<br />
Each LED <strong>of</strong> the <strong>system</strong> illuminates up to 40 tubes and total<br />
amount <strong>of</strong> the <strong>monitoring</strong> channels is about 700.<br />
The LED <strong>monitoring</strong> <strong>system</strong> consists <strong>of</strong> three functional parts:<br />
• Sub<strong>system</strong> for a LED intensity control for variation <strong>of</strong> the<br />
LED intensity across a wide range includes 40 boards.<br />
• 12 9U –VME bards for a LED triggering pulse control<br />
and distribution placed into the front-end crates.<br />
• 700 <strong>of</strong> the LED drivers with LV power distribution.<br />
Sketch <strong>of</strong> the ECAL and HCAL LED <strong>monitoring</strong> signal chain<br />
is shown on the Figure 1.<br />
a CERN, 1211 Geneva 23, Switzerland<br />
Anatoli.Konoplyannikov@cern.ch<br />
2<br />
LED<br />
LEDTSB CROC FEBs<br />
1<br />
SPECS<br />
slave<br />
Bchannel<br />
8<br />
CLK<br />
Time alignment<br />
circuits<br />
PIN with<br />
Amplifier<br />
5<br />
3<br />
Front-End Crate<br />
PMT<br />
TTCrx<br />
Figure 1: Sketch <strong>of</strong> the ECAL and HCAL LED <strong>monitoring</strong> signal<br />
chain<br />
II. CALORIMETERS PHOTO-DETECTORS AND LED<br />
MONITORING OPTICS<br />
All <strong>calorimeter</strong>s are equipped with Hamamatsu photo<br />
tubes as devices for light to signal conversion. Eight thousand<br />
R7899-20 tubes [2] are used for the electromagnetic and<br />
hadronic <strong>calorimeter</strong>s and two hundred 64 channels multianode<br />
R7600 -00-M64 for Scintillator-Pad/Preshower<br />
detectors.<br />
R7899-20 tube has the following characteristics:<br />
• Dimension: 25 mm Diameter, 81 mm Length<br />
• Spectral Response: 185 to 650 nm<br />
• Photocathode: Bialkali, effective area 20 mm dia.<br />
• Window material: UV glass<br />
• Number <strong>of</strong> dynodes: 10<br />
• Supply voltage: 1800 V max<br />
• Average Anode Current: 0.1 mA max<br />
• Quantum Efficiency: 15 % at 520 nm<br />
• Current Amplification: 106<br />
• Dark Current: 2.5 nA<br />
• Time Response: 2.4 ns<br />
• Pulse Linearity:+- 2 %<br />
6<br />
4
Each LED <strong>of</strong> the <strong>system</strong> illuminates up to 40 tubes. The<br />
light is distributed to a PMT light mixer by clear fiber. HCAL<br />
light distribution schema is shown on Figure 2.<br />
Figure 2: An HCAL light distribution schema<br />
For LED light stability <strong>monitoring</strong> the PIN diode is used.<br />
The PIN diode signal after amplification is sent to the FE<br />
electronics board.<br />
III. ELECTRONICS OF LED MONITORING SYSTEM<br />
A. LED driver and intensity control board<br />
Designed LED driver produce the LED signals in a wide<br />
intensity range with pulse shape similar the particle response.<br />
Design peculiarities:<br />
1) Edge triggering circuit with fast pulse shaper on the<br />
board;<br />
2) Decoupling by air transformer.<br />
LED driver simplified circuit diagram is shown on Figure<br />
3 and the signal shapes oscillogram for PMT response on 50<br />
Gev particle and LED signal are shown on Figure 4 and 5.<br />
The LED intensity control<br />
voltage 3V - 12V<br />
Air transformer<br />
"Flashing" pulse<br />
LVDS levels<br />
DS92LV010A<br />
Fast<br />
Shaper<br />
15 ns Driver<br />
ACT Logic<br />
Figure 3: LED driver simplified circuit diagram<br />
Figure 4: Oscillograms <strong>of</strong> PMT response on a particle<br />
OA<br />
TL072CD<br />
EL7212<br />
LED<br />
Shaping<br />
and overshot<br />
circuit<br />
Figure 5: Oscillograms <strong>of</strong> PMT (right shape) and PIN amplifier<br />
responses on a LED<br />
LED intensity signals are produced by the electronics<br />
board common with HV <strong>system</strong>. The LED intensity signal<br />
distribution board consists <strong>of</strong> the mother card and four types<br />
<strong>of</strong> the mezzanine board:<br />
SPECS slave for interconnection with the <strong>LHCb</strong> ECS<br />
<strong>system</strong>.<br />
Control Logic board for interface between the SPECS<br />
slave and others functional parts <strong>of</strong> Distribution board.<br />
HV control signal generation mezzanine.<br />
LED control signal generation mezzanine with 12 bits<br />
DACs.<br />
Figure 6: Photo <strong>of</strong> the LED intensity signals distribution board
B. LEDTSB – 64 channels LED triggering<br />
board<br />
The source <strong>of</strong> the calibration signal is the TTCrx broadcast<br />
command, generated by Read Out Supervisor. Then this<br />
command is distributed by <strong>LHCb</strong> TTC <strong>system</strong> to each<br />
detector and propagated throughout the detector specific<br />
chains. In the <strong>calorimeter</strong> electronics this command is<br />
distributed by a CROC card to each slot <strong>of</strong> FE crate. There is<br />
no any delay time compensation <strong>of</strong> the bus length difference<br />
for different slots <strong>of</strong> the FE crate. The time spread <strong>of</strong> the<br />
broadcast command on the FE backplane could be up to 3 ns.<br />
Due to the reason mentioned above, an additional timealignment<br />
with 40 MHz clock is needed and implemented in<br />
LED Trigger Signal Board (LEDTSB).<br />
LEDTSB distributes the LED trigger pulses to LED<br />
drivers by a twisted pair cable (RJ-45) with a different for<br />
each sub-detector length. Then a light pulse from LED comes<br />
to PMT through the optic fiber and from PMT the signal<br />
comes to FEB.<br />
Back Plane<br />
<strong>of</strong> FE crate<br />
SPECS Bus<br />
Broadcast<br />
commands<br />
from<br />
TTCrx<br />
40 MHz Clk<br />
Control Logic<br />
ACTEL FPGA<br />
Broadcast<br />
Command<br />
Decoder<br />
BCALIB[3..0]<br />
SPECS slave<br />
Mezzanine<br />
Channel Mask<br />
Coarse 1<br />
Delay<br />
0 - 15 ckl<br />
Coarse<br />
Delay<br />
0 - 15 ckl<br />
Parallel<br />
Bus [16..0]<br />
64<br />
4 channels<br />
TDC<br />
I2C<br />
Clk<br />
Phase<br />
Shifter<br />
Clk<br />
Phase<br />
Shifter<br />
Clk<br />
Phase<br />
Shifter<br />
Clk<br />
Phase<br />
Shifter<br />
Signal<br />
Shaper<br />
Signal<br />
Shaper<br />
Signal<br />
Shaper<br />
Signal<br />
Shaper<br />
Signal<br />
Shaper<br />
Signal<br />
Shaper<br />
Signal<br />
Shaper<br />
Signal<br />
Shaper<br />
LED trigger pulse<br />
Figure 7: Block diagram <strong>of</strong> the LED triggering signals distribution<br />
board<br />
The LEDTSB board consists <strong>of</strong> the mother board and two<br />
types <strong>of</strong> the mezzanine cards: SPECS slave mezzanine for<br />
interconnection with the <strong>LHCb</strong> ECS <strong>system</strong> and Control<br />
Logic mezzanine based on radiation tolerant ACTEL FPGA.<br />
Block diagram and photo <strong>of</strong> the LEDTSB board are shown on<br />
Figure 7 and 8.<br />
LEDTSB specification<br />
• Number <strong>of</strong> channels – 64.<br />
• 16 output connectors RJ45 type on a front panel,<br />
• A level <strong>of</strong> the output signals is LVDS,<br />
• Each channel equipped with individual delay line<br />
that varies from 0 to 300 ns with 1 ns step,<br />
• A LED trigger signal width is 50 ns,<br />
• LEDTSB boards ,the same size as LFB board, will<br />
be placed in the FE crate,<br />
• Control Logic FPGA is placed on a mezzanine card<br />
for simplifying the chip exchange from non radhard<br />
to radiation hard ACTEL proASIC chip,<br />
• Memory <strong>of</strong> the scanning algorithm FPGA with 64<br />
patterns <strong>of</strong> the output trigger signals allows perform<br />
all needed sequences for LED flashing,<br />
1<br />
2<br />
16<br />
17<br />
18<br />
32<br />
33<br />
34<br />
48<br />
49<br />
50<br />
64<br />
1 - 4<br />
LVDS<br />
• SPECS slave mezzanine card (developed in LAL) is<br />
used for connection with ECS and TTCrx decoding,<br />
• There are two operational mode:<br />
A. The main mode, when the LED trigger signals<br />
are generated from TTCrx command,<br />
B. The trigger signals are generated from a build in<br />
internal generator (Freq. ~ 1 kHz).<br />
Power consumption: +3.3 V -> 0.6 A; +5 V -> 0.1 A; -5 V<br />
-> 0.16 A.<br />
Figure 8: Photo <strong>of</strong> the LED triggering signals distribution board<br />
IV. PERFORMANCE OF THE LED MONITORING<br />
SYSTEM<br />
The <strong>calorimeter</strong> <strong>monitoring</strong> <strong>system</strong> is placed on the<br />
detector in a radiation hard environment. The electronics<br />
has been designed taken into account this factor.<br />
Main characteristics <strong>of</strong> the <strong>monitoring</strong> <strong>system</strong> are<br />
mentioned below:<br />
• Precision <strong>of</strong> the PMT gain <strong>monitoring</strong> is about<br />
0.3 %.<br />
• LED stability <strong>monitoring</strong> by a PIN diode with<br />
precision <strong>of</strong> 0.1 %.<br />
• Individual time setting for each LED in range <strong>of</strong><br />
400 ns with 1 ns step.<br />
• PIN diode with amplifier is used for <strong>monitoring</strong> the<br />
LED stability itself.<br />
• Control Logic FPGA is placed on a mezzanine card<br />
and equipped with radiation hard ACTEL pro-ASIC<br />
chip APA300.
• Memory <strong>of</strong> the scanning algorithm FPGA with 64<br />
patterns <strong>of</strong> the output trigger signals allows perform<br />
all needed sequences for LED flashing.<br />
• The <strong>calorimeter</strong> <strong>monitoring</strong> <strong>system</strong> is linked to the<br />
<strong>LHCb</strong> ECS <strong>system</strong> by the SPECS serial bus<br />
(developed in LAL).<br />
Typical LED and PMT stability plots are shown on Figure<br />
9 and 10. Each point corresponds <strong>of</strong> the mean value <strong>of</strong> PM<br />
amplitude for 200 events<br />
Figure 9: Typical LED stability plot (time in hour)<br />
Figure 10: Typical LED stability plot (time in hour)<br />
Time scan technique is used for a correct time adjustment<br />
<strong>of</strong> the LED <strong>monitoring</strong> <strong>system</strong> and checking an inter-crate<br />
synchronization. For doing the detector time alignment the<br />
automated process has been implemented to scan the LED<br />
delay from PVSS project and collect data by DAQ (increment<br />
step by step the 1 ns delay <strong>of</strong> the LEDTSB). Precision and<br />
stability <strong>of</strong> the signal arriving time measurement [3] is about<br />
<strong>of</strong> 0.3 ns. Figure 11 illustrates the LED signal scanned shapes<br />
<strong>of</strong> the HCAL module [4] and Figure 12 shows the time and<br />
amplitude distributions <strong>of</strong> the PMT response on LED flash.<br />
Figure 11: Typical LED integrated signal scanned shapes<br />
<strong>of</strong> the HCAL module (time in ns)<br />
Figure 12: Time and amplitude distributions <strong>of</strong> the PMT<br />
response on LED for HCAL<br />
V. ECS SOFTWARE FOR CONTROL OF THE LED<br />
MONITORING SYSTEM<br />
<strong>LHCb</strong>'s Experiment Control System is in charge <strong>of</strong> the<br />
configuration, control and <strong>monitoring</strong> <strong>of</strong> all the components<br />
<strong>of</strong> the online <strong>system</strong>. This includes all devices in the areas <strong>of</strong>:<br />
data acquisition, detector control (ex slow controls), trigger,<br />
timing and the interaction with the outside world.<br />
The control framework <strong>of</strong> the <strong>LHCb</strong> is based on a SCADA<br />
(Supervisory Control and Data Acquisition) <strong>system</strong> called<br />
PVSSII. Which provides the following main components and<br />
tools:<br />
• A run time database<br />
• Archiving<br />
• Alarm Generation & Handling<br />
• A Graphical Editor<br />
• A Scripting Language<br />
• A Graphical Parameterization tool
The LEDTSB and LED intensity boards configuring is<br />
performed by standard FSM way. In the same time to prepare<br />
or modify a recipe one needs a mechanism to update recipe<br />
content. The LEDTSB half Configuration panel allows<br />
loading new values from the configuration files or from the<br />
dedicated CALO Data Base. The LEDTSB parameters could<br />
be modified and with using the expert LEDTSB panels too.<br />
After updating the recipe content one can save the recipe with<br />
specified name. Examples <strong>of</strong> the LED <strong>monitoring</strong> panels are<br />
shown on Figure 13 and 14.<br />
Figure 13: Device Unit panel <strong>of</strong> the LEDTSB delay<br />
triggering pulse configuration<br />
Figure 14: Device Unit panel <strong>of</strong> the LEDTSB triggering<br />
pulse sequence configuration<br />
The designed LED <strong>monitoring</strong> electronics have been<br />
successfully commissioned and using now for preparing the<br />
<strong>calorimeter</strong> detectors for first beam.<br />
VI. REFERENCES<br />
[1] <strong>LHCb</strong> Calorimeters, Technical Design Report,<br />
CERN/LHCC/2000-0036, 6 Sept. 2000.<br />
[2] “Design <strong>of</strong> PMT base for the <strong>LHCb</strong><br />
electromagnetic <strong>calorimeter</strong>”, A.Arefiev et al, <strong>LHCb</strong><br />
2004-xxx.<br />
[3] “Zero dead-time charge sensitive shaper for <strong>calorimeter</strong><br />
signal processing”, A.Konopliannikov, <strong>LHCb</strong> 2000-041.<br />
[4] “The <strong>LHCb</strong> Hadron Calorimeter”, R.Djeliadine, NIM<br />
A494/1-3, p332, 2002.