SHOPPER INSIGHTS - Kantar Retail iQ
SHOPPER INSIGHTS - Kantar Retail iQ
SHOPPER INSIGHTS - Kantar Retail iQ

You also want an ePaper? Increase the reach of your titles
YUMPU automatically turns print PDFs into web optimized ePapers that Google loves.
<strong>SHOPPER</strong> <strong>INSIGHTS</strong> February 2012<br />
American ShopperScape ®
2011 American ShopperScape ®<br />
/ Table of Contents<br />
Shoppers Today ...................................................................................................2<br />
Shopping Modes..................................................................................................6<br />
Measuring Loyalty & Leakage ............................................................................9<br />
Walmart Watch: Declining Shopping Frequency .............................................12<br />
Amazon.com Continues Move Toward Being a ................................................19<br />
Mainstream Shopping Destination<br />
Online Shopping: The New General Store .......................................................24<br />
/ Authors<br />
Mary Brett Whitfield<br />
Senior Vice President<br />
marybrett.whitfield@kantarretail.com<br />
Rachel McGuire<br />
Senior Analyst<br />
rachel.mcguire@kantarretail.com<br />
Kate Senzamici<br />
Analyst<br />
kate.senzamici@kantarretail.com<br />
© 2012 <strong>Kantar</strong> <strong>Retail</strong>. All rights reserved.<br />
/ <strong>Kantar</strong> <strong>Retail</strong><br />
Two Easton Oval<br />
Suite 500<br />
Columbus, Ohio 43219<br />
Telephone: (614)-355-4000<br />
www.kantarretail.com<br />
www.kantarretailiq.com<br />
No part of this work may be reproduced or transmitted in any form or by any means, electronic or mechanical,<br />
including photocopying, recording, or by any information storage and/or retrieval system, without permission in<br />
writing from the publisher.
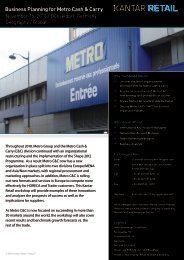
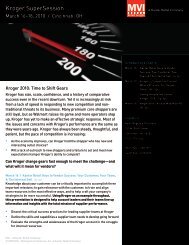
Shoppers Today<br />
Even with the economy still stuck in low gear, shoppers<br />
have started 2012 with a fairly positive outlook for the year<br />
(Figure 1):<br />
A quarter of shoppers (26%) expect to be better off in<br />
2012 vs. last year in terms of their personal household<br />
financial situation; this number rockets to nearly four<br />
in 10 Gen Y shoppers and one-third of shoppers in the<br />
Gen X cohort.<br />
Figure 1: Shoppers’ Outlook for Personal Financial<br />
Situation in 2012, by Generation<br />
26%<br />
46%<br />
“Note: Boxes indicates significant difference from all shoppers (90%<br />
confidence level<br />
Source: <strong>Kantar</strong> <strong>Retail</strong> ShopperScape ® , October 2011<br />
© 2012 <strong>Kantar</strong> <strong>Retail</strong><br />
39%<br />
36%<br />
33%<br />
44%<br />
22%<br />
47%<br />
21% 12% 15% 25% 28%<br />
7% 13% 9% 6% 5%<br />
All Shoppers Gen Y Gen X Baby<br />
Boomers<br />
Not sure Worse than it is today<br />
About the same as it is today Better than it is today<br />
16%<br />
52%<br />
Seniors<br />
- 2 -<br />
Consistent with other attitudes and below-average<br />
spending intentions throughout the recession and<br />
recovery, Seniors and Boomers continue to be<br />
skeptical about improving prospects.<br />
Shoppers’ assessment of the outlook for the economy<br />
as a whole are not nearly as positive: only 19%<br />
expect the economy to be better in 2012 than it was in<br />
2011, and that assessment is fairly consistent across<br />
generational cohorts (Figure 2).<br />
Figure 2: Shoppers’ Outlook for Overall U.S. Economy<br />
in 2012, by Generation<br />
19% 23% 19% 16% 20%<br />
35%<br />
37%<br />
9%<br />
34% 40%<br />
26%<br />
29%<br />
17% 11%<br />
Source: <strong>Kantar</strong> <strong>Retail</strong> ShopperScape ® , October 2011<br />
32%<br />
43%<br />
All Shoppers Gen Y Gen X Baby<br />
Boomers<br />
33%<br />
42%<br />
8% 5%<br />
Not sure Worse than it is today<br />
About the same as it is today Better than it is today<br />
Seniors
Even though shoppers have low expectations for an<br />
improving economy in 2012, a positive outlook is apparent<br />
in spending intentions. After deteriorating early in 2011<br />
and stalling out mid-year, shoppers’ spending sentiment<br />
has been improving now for four consecutive months<br />
(Figure 3).<br />
Despite the current positive indicators, few factors<br />
related to shopper’s financial outlook seem likely to boost<br />
spending in a dramatic way (Figure 4). Across six measure<br />
of household financial health, shoppers are more likely<br />
to assess their household financial situation as worse<br />
off vs. better off compared with last year, but on most<br />
measures, they don’t perceive a change in their situation in<br />
either direction. Particular pockets of concern, however:<br />
shoppers’ assessments of worth of investments and home<br />
values.<br />
© 2012 <strong>Kantar</strong> <strong>Retail</strong><br />
- 3 -<br />
Figure 3: Spending Intentions in Coming Month Compared<br />
with Same Period Last Year<br />
60%<br />
50%<br />
40%<br />
30%<br />
20%<br />
10%<br />
0%<br />
May-08<br />
Jul-08<br />
Sep-08<br />
Nov-08<br />
Jan-09<br />
(three-month moving average)<br />
Spend Much/<br />
Somewhat More<br />
Mar-09<br />
May-09<br />
Jul-09<br />
Sep-09<br />
Source: <strong>Kantar</strong> <strong>Retail</strong> ShopperScape ® , May 2008-January 2012<br />
Figure 4: Household Financial Health Compared with Same Period a Year Ago<br />
Job security<br />
Source: <strong>Kantar</strong> <strong>Retail</strong> ShopperScape ® October–December 2010 and 2011<br />
Nov-09<br />
Jan-10<br />
Mar-10<br />
May-10<br />
Q4 2010 Q4 2011<br />
Net - Much better/somewhat better off 17% 17%<br />
No change from last year 63% 62%<br />
Net - Somewhat worse/much worse off 20% 21%<br />
Household Income level<br />
Net - Much better/somewhat better off 25% 25%<br />
No change from last year 47% 47%<br />
Net - Somewhat worse/much worse off 28% 28%<br />
Credit card debt<br />
Net - Much better/somewhat better off 25% 24%<br />
No change from last year 56% 57%<br />
Net - Somewhat worse/much worse off 19% 19%<br />
Monthly mortgage/car payments<br />
Net - Much better/somewhat better off 19% 20%<br />
No change from last year 68% 67%<br />
Net - Somewhat worse/much worse off 13% 13%<br />
Worth of investments<br />
Net - Much better/somewhat better off 23% 16%<br />
No change from last year 51% 52%<br />
Net - Somewhat worse/much worse off 25% 32%<br />
Value of home<br />
Net - Much better/somewhat better off 15% 14%<br />
No change from last year 56% 55%<br />
Net - Somewhat worse/much worse off 29% 31%<br />
Jul-10<br />
Sep-10<br />
Nov-10<br />
Jan-11<br />
Shoppers Today<br />
Mar-11<br />
May-11<br />
Spend About<br />
the Same<br />
Spend Much/<br />
Somewhat Less<br />
Jul-11<br />
Sep-11<br />
Nov-11<br />
Jan-12
Shoppers’ assessments of their own situations can<br />
run counter to the situation of the aggregate (as in the<br />
case of more shoppers feeling worse off regarding job<br />
security despite an improving jobs picture). Therefore,<br />
it is important to monitor shoppers’ actions, paying<br />
attention to what shoppers do as measured by retail<br />
sales results, shopping patterns, and spending intentions<br />
vs. what shoppers say in measures of confidence and<br />
sentiment. However, expect cautiousness toward<br />
spending to resurface amid uncertainty in the run-up to<br />
the November elections—as was the case in the approach<br />
to the 2010 mid-term elections, when shoppers’ spending<br />
intentions leveled off for several months. As the election<br />
approaches and negative campaign ads ramp up, the same<br />
pattern could very well appear, regardless of the health of<br />
economic or household fundamentals.<br />
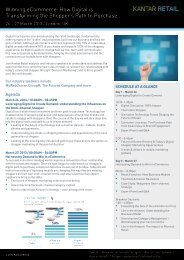
In terms of planned approaches to shopping this year,<br />
shoppers continue to signal that deal-seeking and limiting<br />
behaviors will characterize the shopping mindset<br />
(Figure 5):<br />
© 2012 <strong>Kantar</strong> <strong>Retail</strong><br />
Figure 5: Participation in Shopping Behavior Changes<br />
Behavior Changes In Recession<br />
Source: <strong>Kantar</strong> <strong>Retail</strong> ShopperScape ® , February 2010 and October 2011<br />
- 4 -<br />
Shoppers Today<br />
Among the Top 10 behaviors shoppers anticipate<br />
adopting in 2012—all of which have participation<br />
rates between one-quarter and just over a half of<br />
shoppers—three are “deal-seeking” behaviors (e.g.,<br />
taking advantage of good sales and deals) and six<br />
are related to “limiting” (e.g., buying only things truly<br />
needed).<br />
Only one of the Top 10 shopping approaches is related<br />
to “trading down”: shopping more at value/discount<br />
retailers.<br />
Relative to deal-seeking, limiting or even trading<br />
down behaviors, few shoppers indicate plans to move<br />
some shopping online—by shopping online for more<br />
things, shopping online more often, or switching<br />
some purchasing to auto-replenishment programs.<br />
However, with as many as one in 10 shoppers planning<br />
to adopt these behaviors, it is certain that the<br />
Internet’s role in shopping will accelerate over time.<br />
Plan for<br />
2012 Type of Behavior<br />
Taking advantage of good sales/deals 41% 54% Deal-Seeking<br />
Buying only things I truly need 40% 52% Limiting<br />
Using more coupons 34% 48% Deal-Seeking<br />
Buying fewer things 33% 42% Limiting<br />
Doing more price comparisons before purchasing 33% 38% Deal-Seeking<br />
Shopping less often 31% 34% Limiting<br />
Using/keeping items longer before replacing 20% 30% Limiting<br />
Buying only items needed in the near term 23% 28% Limiting<br />
Shopping more at discount/value retailers 22% 28% Trading-Down<br />
Postponing more purchases 28% 25% Limiting<br />
Buying less expensive versions of products 27% 24% Trading-Down<br />
Buying fewer luxury items 35% 24% Limiting<br />
Buying more store brands vs. national brands 26% 22% Trading-Down<br />
Trading down to less-expensive brands na 16% Trading-Down<br />
Shopping online for more things na 13% Moving Online<br />
Shopping online more often na 12% Moving Online<br />
Using smart phone to compare prices while in stores na 6% Deal-Seeking<br />
Switching some purchasing to "auto-replenishment"<br />
programs<br />
na 1% Moving Online
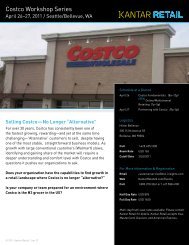
Regardless of how shoppers plan to attack shopping in<br />
2012, it is quite likely they will be doing their shopping at<br />
a broader set of retailers than have been on the shopping<br />
list during the past few years (Figure 6). The average<br />
number of retailers shopped in December 2011 hit 13.4,<br />
the most retailers shopped in any December since 2008<br />
but still below the pre-recession December high of 14.7<br />
retailers in 2007.<br />
After two years of declining or steady figures, the number<br />
of retailers shopped on a monthly basis trended upward<br />
in 2011. Specifically in the fourth quarter, the pattern<br />
in previous years has been that the number of retailers<br />
shopped per month dropped off early from the mini-peak<br />
of retailers shopped during the core back-to-school<br />
16.0<br />
14.0<br />
12.0<br />
10.0<br />
8.0<br />
6.0<br />
4.0<br />
2.0<br />
0.0<br />
Jan-07<br />
© 2012 <strong>Kantar</strong> <strong>Retail</strong><br />
Mar-07<br />
May-07<br />
- 5 -<br />
shopping months before spiking again in December. In<br />
2011, however, the number of retailers shopped in the<br />
fourth quarter ramped up month-to-month. The relatively<br />
high number of retailers shopped in November 2011 (11.8<br />
vs. 10.8 in 2010) likely reflects holiday shoppers seeking<br />
out Black Friday deals from a wider variety of retailers—<br />
many of which started “Black Friday” on Thanksgiving or<br />
earlier in the month—to start the holiday season.<br />
The number of retailers shopped within each group of<br />
retailers—FDM, Softgoods, Homegoods, and others—<br />
exhibited the same pattern of month-to-month growth<br />
over the course of the quarter. Shoppers had more<br />
Softgoods retailers on their shopping list in December<br />
2011—5.0—than any month since December 2007.<br />
Figure 6: Average Number of <strong>Retail</strong>ers Shopped during Past Four Weeks<br />
Jul-07<br />
14.7<br />
Total Avg. # of<br />
<strong>Retail</strong>ers Shopped<br />
Sep-07<br />
Avg. # of Homegoods<br />
<strong>Retail</strong>ers Shopped<br />
Nov-07<br />
Jan-08<br />
(inclusive of all visits to stores, Web sites, or catalogs)<br />
13.5<br />
Source: <strong>Kantar</strong> <strong>Retail</strong> ShopperScape ® , January 2007-December 2011<br />
Mar-08<br />
May-08<br />
Jul-08<br />
Sep-08<br />
Nov-08<br />
Jan-09<br />
Avg. # of FDM<br />
<strong>Retail</strong>ers Shopped<br />
Mar-09<br />
May-09<br />
Jul-09<br />
Sep-09<br />
Nov-09<br />
13.1 13.1<br />
Jan-10<br />
Mar-10<br />
Avg. # of Softgoods<br />
<strong>Retail</strong>ers Shopped<br />
May-10<br />
Jul-10<br />
Avg. # of Other<br />
<strong>Retail</strong>ers Shopped<br />
Sep-10<br />
Nov-10<br />
Jan-11<br />
Mar-11<br />
May-11<br />
Jul-11<br />
Sep-11<br />
Shoppers Today<br />
Nov-11<br />
13.4
Shopping Modes: Low-Cost Replenishment Leads<br />
The Six Shopping Modes typology reflects the primary ways shoppers approach shopping (Figures 1 and 2).<br />
1. Low-cost Replenishment proves to be the most common shopping mode yet again—consistent with data from March<br />
2008 and June 2009. However, the mode registers even higher percentages of shoppers indicating this is a typical<br />
approach to shopping (71%, compared with 62% in March 2008 and 65% two years ago). As usual, food/drug/mass<br />
retailers hold the top spots here—with Walmart and Target as the top two retailers shoppers associated with this<br />
shopping mode, but Kohl’s and JCPenney also make the Top 10 list. Warehouse clubs also are in the ranking for this<br />
mode, with Costco and Sam’s Club occupying the sixth and 10 th spots.<br />
© 2012 <strong>Kantar</strong> <strong>Retail</strong><br />
62%<br />
65%<br />
71%<br />
Low-cost<br />
Replenishment<br />
Figure 1: Participation Rate in Shopping by Shopping Mode<br />
54% 55% 55%<br />
50% 50% 49%<br />
Thrill of<br />
the Hunt<br />
Shopping Mode Descriptions:<br />
Speed &<br />
Convenience<br />
Source: <strong>Kantar</strong> <strong>Retail</strong> ShopperScape ® , March 2008, June 2009, June 2011<br />
- 6 -<br />
31%<br />
31%<br />
Sense of<br />
Discovery<br />
29%<br />
Mar-08 Jun-09 Jun-11<br />
18% 20% 18%<br />
12% 14% 14%<br />
Solve a<br />
Problem<br />
Low-Cost Replenishment: Shopping for products that need to be replaced on a routine basis<br />
Thrill of the Hunt: Hunting for unique bargains<br />
Speed & Convenience: Buying goods in the fastest and most convenient way<br />
Sense of Discovery: Shopping at a retailer to discover new things<br />
Solve a Problem: Looking to a retailer for advice on how to do things or get help solving problems<br />
Self Expression: Shopping at a retailer because it reflects how I express myself and my lifestyle<br />
Self-<br />
Expression
2. Thrill of the Hunt remains the second-most common shopping mode—but is down slightly compared with<br />
June 2009. Walmart again gets the top nod here, but at a much lower rate than its association with low-cost<br />
replenishment shopping. Thrill of the Hunt shopping is strongly associated with off-price apparel specialty retailers,<br />
as well as small-format value retailers and “alternative” retail options such as thrift stores and eBay. The attraction<br />
of half of U.S. primary household shoppers to this shopping mode is likely linked to the deal-seeking behavior<br />
shoppers adopted during the economic recession. This has led to the dollar channel’s increased popularity, as well<br />
as shoppers’ tendency to shop around for the best deal.<br />
3. The incidence of shoppers engaging in shopping in Speed and Convenience mode holds steady in the third spot. This<br />
mode has lost some popularity, however, compared with previous periods. Here, as with low-cost replenishment<br />
mode shopping, food/drug/mass retailers continue to play an important role, with Walmart and Target occupying the<br />
top two spots of retailers mentioned on an unaided basis as being associated with this mode of shopping. However,<br />
online has a far greater impact on this mode compared with low-cost replenishment, with Amazon.com as the thirdmost<br />
mentioned retailer associated with this mode. With the wide variety of products available online, as well as the<br />
ability to shop any time of day or night, it is no surprise that Amazon is so strongly related to a quick and convenient<br />
shopping experience.<br />
1 Walmart/<br />
WMSC<br />
Low Cost<br />
Replenishment<br />
n = 794<br />
2 Target/<br />
SuperTarget<br />
© 2012 <strong>Kantar</strong> <strong>Retail</strong><br />
- 7 -<br />
Shopping Modes: Low-Cost Replenishment Leads<br />
Figure 2: Top 10 <strong>Retail</strong>ers Shoppers Most Associated with Shopping Modes<br />
39% Walmart/<br />
WMSC<br />
Thrill of the Hunt<br />
n = 809<br />
17% Walmart/<br />
WMSC<br />
Speed &<br />
Convenience<br />
n = 790<br />
9% Kohl's 8% Target/<br />
SuperTarget<br />
Note: Unaided mentions by shoppers indicating shopping in shopping mode<br />
Source: <strong>Kantar</strong> <strong>Retail</strong> ShopperScape ® , June 2011<br />
41% Walmart/<br />
WMSC<br />
Sense of Discovery<br />
n= 690<br />
9% Target/<br />
SuperTarget<br />
15% The Home<br />
Depot<br />
3 Kroger 3% Thrift Stores 6% Amazon 4% Kohl's 6% Walmart/<br />
WMSC<br />
4 Meijer 2% Target/<br />
SuperTarget<br />
Solve a Problem<br />
n = 477<br />
Self-Expression<br />
n = 465<br />
26% Kohl's 11%<br />
10% Lowe's 24% Target/<br />
SuperTarget<br />
7% Walmart/<br />
WMSC<br />
6% Kroger 3% Amazon 6% Ace Hardware 5% Macy's 5%<br />
5 Kohl's 2% TJ Maxx 5% Publix 2% Macy's 4% Best Buy 4% Nordstrom/<br />
Nordstrom<br />
Rack<br />
6 Costco 2% Marshalls 5% Meijer 2% TJ Maxx 3% Menard's 3% JCPenney 3%<br />
7 WinCo Foods 2% Big Lots 3% Kohls 2% Lowe's 3% Macy's 2% Whole<br />
Foods<br />
8 Shop Rite 2% Ross Dress<br />
for Less<br />
9 JCPenney 2% eBay.com 2% Dollar<br />
General<br />
3% Costco 2% JCPenney 2% Target/<br />
SuperTarget<br />
10%<br />
9%<br />
3%<br />
3%<br />
1% Amazon 2%<br />
1% Marshalls 2% Walgreens 1% Express 2%<br />
10 Sam's Club 1% JCPenney 2% JCPenney 1% Best Buy 2% Bed Bath &<br />
Beyond<br />
1% Old Navy 1%<br />
HEB 1% Amazon 1% Kmart 1%<br />
Ann Taylor/<br />
Ann Taylor<br />
Loft<br />
1%
4. As the fourth-most popular shopping mode, Sense of Discovery is an approach to shopping engaged in by fewer<br />
than one-third of shoppers. This mode shows yet another instance where Walmart and Target appeal to shoppers.<br />
However, apparel retailers dominate the Top 10 list, with Kohl’s as the top apparel retailer that shoppers associate<br />
with sense of discovery shopping, and Macy’s landing on the list in fifth place. Amazon.com, with its huge range<br />
and variety of products, comes in at #4. Home-improvement/consumer electronics retailers also are strongly<br />
associated with this mode—namely Lowe’s, but Best Buy makes the Top 10 list too.<br />
5. Among all shoppers, Solve a Problem ties as the fifth-most common shopping mode (14%)—with participation<br />
rates in this shopping mode up and down over time. Not surprisingly, home improvement/CE retailers are most<br />
associated with looking for advice or getting help solving a problem—although Walmart is sandwiched into the #3<br />
spot among The Home Depot, Lowe’s, Ace Hardware, and Best Buy.<br />
6. Last on the list is Self-expression mode shopping, with participation rates declining over time. Many apparel<br />
retailers are associated with this mode (Kohl’s tops the list), but Target and Walmart still get a nod here. Some<br />
higher-end retailers make the list of those most associated with self-expression shopping—Nordstrom, Whole<br />
Foods—which is not surprising as higher-income shoppers are more likely to have that luxury of selecting retailers<br />
based on the desire to self-express.<br />
The participation rate in shopping modes can vary by generational cohort (Figure 3). However, Thrill of the Hunt and<br />
Speed & Convenience shopping have fairly consistent participation rates across generations.<br />
© 2012 <strong>Kantar</strong> <strong>Retail</strong><br />
» Older shoppers—especially Seniors, but also Boomers to a slightly lesser extent—are most likely to shop in<br />
Low-cost Replenishment and Solve a Problem mode.<br />
» Only just over half (56%) of Gen Y shoppers report the Low-cost replenishment mode shopping is common<br />
for them, which is a significantly lower participation rate then for all shoppers.<br />
» In contrast, Gen Y shoppers are the most likely Self Expression and Sense of Discovery Shoppers.<br />
90%<br />
80%<br />
70%<br />
60%<br />
50%<br />
40%<br />
30%<br />
20%<br />
10%<br />
0%<br />
Low-cost<br />
Replenishment<br />
Figure 3: Partcipation Rate in Shopping Mode by Generation, 2011<br />
Thrill of the Hunt Speed &<br />
Convenience<br />
Source: <strong>Kantar</strong> <strong>Retail</strong> ShopperScape ® , June 2011<br />
Gen Y Gen X Boomers Seniors<br />
- 8 -<br />
Shopping Modes: Low-Cost Replenishment Leads<br />
Sense of Discovery Solve a Problem Self-Expression<br />
Represents All Shoppers Incidence Rate
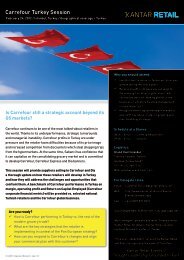
Measuring Loyalty and Leakage<br />
One of the ways to measure loyalty to a retailer is to<br />
understand the degree to which its regular shoppers<br />
use it as their primary or preferred store in any given<br />
category. Obviously, the goal for every retailer is to<br />
capture a significant share of its regular shoppers’<br />
spending in the categories the retailer is most known<br />
for. But the reality is that very few retailers can claim a<br />
“capture rate” in core categories that even approaches<br />
50%.<br />
Groceries<br />
For food and groceries, approximately 50% of leading<br />
supermarkets’ monthly shoppers indicate spending<br />
51% 51%<br />
© 2012 <strong>Kantar</strong> <strong>Retail</strong><br />
- 9 -<br />
the most there (Figure 1). Safeway’s 41% capture rate<br />
is ominously low when compared with other leading<br />
conventional supermarket operators. It leaks shoppers<br />
at a greater rate than other supermarkets to warehouse<br />
clubs: 10% of regular Safeway shoppers report spending<br />
the most on food and groceries at Costco.<br />
Specialty food retailers or those that cater to a specific<br />
shopper niche—e.g., Whole Foods, Trader Joe’s, or ALDI—<br />
have capture rates of no more than 20%, meaning that<br />
just one in five shoppers uses the retailer as her primary<br />
grocery store.<br />
Figure 1: Capture Rate: Food/Groceries<br />
Percent of <strong>Retail</strong>er’s Monthly Shopper Base that Spends the Most at that <strong>Retail</strong>er<br />
41%<br />
51%<br />
18%<br />
Kroger Publix Safeway Wegman's Whole<br />
Foods<br />
Source: <strong>Kantar</strong> <strong>Retail</strong> ShopperScape®, January–December 2011<br />
14%<br />
Trader<br />
Joe's<br />
20%<br />
38%<br />
24%<br />
15%<br />
ALDI Walmart Costco Sam's Target Dollar<br />
Stores<br />
6%<br />
2%
The mass retailers—both the supercenter/warehouse club<br />
big-box variety and the small-box dollar store variety—<br />
capture no more than approximately one-third of shoppers<br />
in terms of primary grocery spending. Costco has a<br />
higher capture rate than Sam’s but both pale vs. Walmart.<br />
With single-digit capture rates for groceries, Target and<br />
dollar stores clearly serve as secondary channels for<br />
purchasing in these categories. But Walmart plays a<br />
significant role in grocery shopping routines (Figure 2).<br />
Among the regular shoppers of all these leading retailers,<br />
Walmart is either the top or second-place destination<br />
for groceries—with the exception of Trader Joe’s: its<br />
shoppers’ top two destinations are indeed Trader Joe’s<br />
and Costco. Among Aldi, Sam’s Club, and Target monthly<br />
shoppers, more choose Walmart as the retailer where<br />
they spend the most on groceries.<br />
Health & Beauty Care<br />
Overall, Walmart has the highest share of preference for<br />
health and beauty care spending, and the retailer is the<br />
store of preference for more than half of its shoppers<br />
(Figure 3). Walmart’s capture rate of 52% is significantly<br />
higher than the capture rate of the Big 3 drug store<br />
retailers—all of which leak a substantial share of shoppers<br />
to Walmart, but Walgreens most of all (Figure 4). Walmart’s<br />
capture rate also exceeds Target’s, but Target is more likely<br />
to leak shoppers to the drug store channel than Walmart.<br />
Typically, supermarkets have a capture rate in this<br />
category that registers in the single digits. Kroger is an<br />
exception: 13% of its monthly shoppers spend the most on<br />
health and beauty care there.<br />
36%<br />
© 2012 <strong>Kantar</strong> <strong>Retail</strong><br />
31%<br />
Figure 3: Capture Rate: Health & Beauty Care<br />
Percent of <strong>Retail</strong>er’s Monthly Shopper Base that Spends the Most at that <strong>Retail</strong>er<br />
25%<br />
52%<br />
31%<br />
Source: <strong>Kantar</strong> <strong>Retail</strong> ShopperScape ® CVS Rite Aid Walgreeens Walmart Target Dollar<br />
Stores<br />
, January–December 2011<br />
- 10 -<br />
Percent of <strong>Retail</strong>er's<br />
Monthly Shopper Base<br />
that Spends the<br />
Most at Walmart<br />
Kroger 20%<br />
Publix 20%<br />
Safeway 10%<br />
Wegman's 7%<br />
Percent of <strong>Retail</strong>er's<br />
Monthly Shopper Base<br />
that Spends the<br />
Most at Walmart<br />
Measuring Loyalty and Leakage<br />
Figure 2: Role of Walmart: Food/Groceries<br />
Share Spending<br />
Most at Walmart ><br />
Share Spending Most<br />
at <strong>Retail</strong>er<br />
Whole Foods 11%<br />
Trader Joe's 6%<br />
Aldi 23% √<br />
Costco 10%<br />
Sam's 28% √<br />
Target 14% √<br />
Dollar Store 33% √<br />
Source: <strong>Kantar</strong> <strong>Retail</strong> ShopperScape®, January–December 2011<br />
Figure 4: Role of Walmart: Health and Beauty Care<br />
Share Spending<br />
Most at Walmart ><br />
Share Spending Most<br />
at <strong>Retail</strong>er<br />
CVS 19%<br />
Rite Aid 18%<br />
Walgreens 28% √<br />
Target 20%<br />
Dollar Stores 41% √<br />
Kroger 32% √<br />
Safeway 23% √<br />
Publix 30% √<br />
Costco 21% √<br />
Sams 39% √<br />
Dollar Store 33% √<br />
Source: <strong>Kantar</strong> <strong>Retail</strong> ShopperScape®, January–December 2011<br />
14% 13%<br />
7% 7%<br />
9%<br />
4%<br />
Kroger Safeway Publix Costco Sam's
Casual Apparel<br />
Among leading apparel retailers, Kohl’s has the highest<br />
capture rate: 54% of its monthly shoppers spend the most<br />
on casual apparel there (Figure 5). Sears has the lowest<br />
capture rate of the value department stores; more of its<br />
shoppers spend most on casual apparel at Walmart than<br />
do at Sears.<br />
Walmart’s capture rate of 26% is double that of Target’s.<br />
Despite Target’s appeal to “Target-ista Fashionistas,”<br />
many of its monthly shoppers spend the most on casual<br />
apparel at specialty apparel stores or Kohl’s. When<br />
Walmart shoppers don’t spend the most on casual clothes<br />
© 2012 <strong>Kantar</strong> <strong>Retail</strong><br />
54%<br />
- 11 -<br />
at Walmart, they also are most likely to be spending at<br />
apparel specialists.<br />
Consumer Electronics<br />
As with other merchandise groups, there is a retailer<br />
with a standout capture rate for consumer electronics<br />
spending. Best Buy captures more than one-half of its<br />
regular shoppers’ spending on consumer electronics and<br />
computers. A very respectable 22% of regular Amazon.<br />
com shoppers spend the most on consumer electronics at<br />
the online giant, but nearly as many (20%) spend the most<br />
at Best Buy (Figure 6).<br />
Figure 5: Capture Rate: Casual Clothing for Everyday/Weekends<br />
Percent of <strong>Retail</strong>er’s Monthly Shopper Base that Spends the Most at that <strong>Retail</strong>er<br />
41%<br />
15%<br />
Source: <strong>Kantar</strong> <strong>Retail</strong> ShopperScape ® Kohl's JCPenney Sears Macy's Nordstrom Apparel<br />
Speciality<br />
Stores<br />
, January–December 2011<br />
53%<br />
36%<br />
21%<br />
38%<br />
26%<br />
13%<br />
Walmart Target<br />
Figure 6: Capture Rate: Consumer Electronics/Computers<br />
Percent of <strong>Retail</strong>er’s Monthly Shopper Base that Spends the Most at that <strong>Retail</strong>er<br />
29%<br />
11%<br />
28%<br />
Source: <strong>Kantar</strong> <strong>Retail</strong> ShopperScape ® , January–December 2011<br />
11%<br />
Best Buy Apple Game Stop Walmart Target Costco Sam's Staples Amazon<br />
13%<br />
9%<br />
21%<br />
22%
Walmart Watch: Declining Shopping Frequency<br />
In a period in which Walmart is in the midst of a change<br />
in strategy, about one-fifth of Walmart shoppers say they<br />
are shopping there less often than they were a year ago—<br />
while only 15% say they are shopping the retailer more<br />
often (Figure 1). Although Walmart is leaking shoppers at<br />
a consistent rate across all demographic segments, it is<br />
© 2012 <strong>Kantar</strong> <strong>Retail</strong><br />
All Shoppers<br />
Gen Y<br />
Gen X<br />
Baby Boomers<br />
Seniors<br />
No children at home<br />
Children at home<br />
Down Market<br />
Middle Market<br />
Up Market<br />
Source: <strong>Kantar</strong> <strong>Retail</strong> ShopperScape ® , May 2011<br />
Figure 1: Changes in Walmart Shopping Frequency<br />
13%<br />
9%<br />
15%<br />
13%<br />
14%<br />
12%<br />
17%<br />
20%<br />
19%<br />
25%<br />
(among Walmart shoppers)<br />
- 12 -<br />
having slightly better luck attracting young, down-market<br />
families more frequently. Gen Y shoppers, shoppers with<br />
children at home, and down-market shoppers represent<br />
the Walmart shopper segments with the highest<br />
percentages who say they are shopping there more<br />
often—25%, 20%, and 19%, respectively.<br />
66%<br />
71%<br />
64%<br />
61%<br />
65%<br />
58%<br />
65%<br />
68%<br />
59%<br />
54%<br />
0% 10% 20% 30% 40% 50% 60% 70% 80% 90% 100%<br />
Shopping more often Shopping about the same Shopping less often<br />
21%<br />
21%<br />
22%<br />
22%<br />
21%<br />
22%<br />
20%<br />
23%<br />
22%<br />
19%
In tune with the broader retail landscape, Walmart is<br />
experiencing the effect of shoppers scaling back on trips<br />
overall (Figure 2).<br />
While the grocery channel still holds the highest<br />
percentage of shoppers making weekly trips, this<br />
figure has dropped 2.3 percentage points in the past<br />
year.<br />
Walmart is second to grocery in loss of weekly trip<br />
© 2012 <strong>Kantar</strong> <strong>Retail</strong><br />
Supermarkets<br />
Walmart/Walmart<br />
Supercenter<br />
Drug stores<br />
Value discounters/dollar<br />
stores<br />
Target/SuperTarget<br />
Warehouse clubs<br />
Kmart/Big Kmart/Kmart<br />
Super Center<br />
Figure 2: Weekly Shoppers of Format/<strong>Retail</strong>er<br />
5%<br />
4%<br />
5%<br />
4%<br />
3%<br />
9%<br />
8%<br />
9%<br />
7%<br />
7%<br />
11%<br />
10%<br />
11%<br />
12%<br />
12%<br />
16%<br />
14%<br />
15%<br />
14%<br />
16%<br />
Source: <strong>Kantar</strong> <strong>Retail</strong> ShopperScape ® October 2007–2011<br />
24%<br />
21%<br />
21%<br />
19%<br />
21%<br />
- 13 -<br />
Walmart Watch: Declining Shopping Frequency<br />
shoppers; the percentage of shoppers making weekly<br />
trips to Walmart decreased by 1.4 percentage points.<br />
Kmart and club channel retailers also experienced a<br />
decrease in shoppers making weekly trips, while the<br />
weekly Target shopper base held steady.<br />
Dollar and drug channels saw an increase in the<br />
percentage of shoppers making weekly trips—<br />
indicating that there is some transferring of trips<br />
occurring.<br />
34%<br />
33%<br />
33%<br />
32%<br />
31%<br />
2007 2008 2009 2010 2011<br />
52%<br />
49%<br />
50%<br />
50%<br />
48%<br />
Ppt Change<br />
2010-11<br />
-2.3<br />
-1.4<br />
+1.8<br />
+1.8<br />
+0.1<br />
-0.4<br />
-1.0
However, 36% of shoppers who say that they are shopping<br />
Walmart less compared to a year ago do claim that they<br />
are just shopping less overall, and are not necessarily<br />
transferring their Walmart trips to another retailer (Figure<br />
3).<br />
This still means that more than half of shoppers who are<br />
shopping Walmart less are shopping somewhere else.<br />
21% of shoppers who are shopping Walmart less say<br />
that they are shopping conventional supermarkets<br />
more instead.<br />
Target also is winning trips from Walmart, with 19% of<br />
shoppers saying they are shopping Target more.<br />
Walgreens, Dollar General, Family Dollar, and other<br />
dollar stores all gain more or less equal percentages<br />
of Walmart defectors (just under 10% each).<br />
This, combined with the fact that shoppers are shopping<br />
supermarkets more, indicates that shoppers are no longer<br />
as attracted by the “one-stop shopping” appeal of Walmart<br />
and are likely splitting their trips: using supermarkets for<br />
certain grocery necessities, and then shopping around<br />
to find a good value on other items on their lists. The<br />
growth of dollar store’s weekly shopper base supports the<br />
prevalence of deal seeking in the shopper landscape.<br />
Importance of Value: Walmart Shoppers<br />
Divert to Dollar Channel<br />
Among those shopping Walmart less, there are some key<br />
differences in leakage across income groups (Figure 4).<br />
Just over one-quarter (26%) of higher-income Walmart<br />
shoppers state that they are now shopping Target more<br />
often than Walmart—a significantly higher percentage<br />
compared to low or middle-income shoppers. Downmarket<br />
shoppers, however, are converting Walmart trips<br />
to dollar channel trips. Significantly higher percentages of<br />
down-market shoppers say that they are shopping Dollar<br />
General (19%) or Family Dollar (19%) more now instead of<br />
Walmart.<br />
© 2012 <strong>Kantar</strong> <strong>Retail</strong><br />
- 14 -<br />
Walmart Watch: Declining Shopping Frequency<br />
Figure 3: Where Shoppers Are Shopping Instead of Walmart<br />
(Among those who are shopping Walmart/Walmart<br />
Supercenter less compared with a year ago)<br />
Just shopping less<br />
overall<br />
Conventional<br />
supermarket<br />
Target/SuperTarget<br />
Walgreens<br />
Dollar General<br />
Family Dollar<br />
Other dollar store<br />
9%<br />
9%<br />
8%<br />
8%<br />
19%<br />
Source: <strong>Kantar</strong> <strong>Retail</strong> ShopperScape ® , May 2011<br />
21%<br />
36%<br />
Figure 4: Top <strong>Retail</strong>ers Shopping More Often Instead of<br />
Walmart, by Household Income<br />
Total<br />
Down Middle<br />
Market Market Up<br />
(Less than ($25K– Market<br />
$25K) $84.9K) ($85K+)<br />
(a) (b) (c)<br />
Conventional supermarket 21% 18% 23% 22%<br />
a b<br />
Target or SuperTarget 19% 14% 18% 26%<br />
Walgreens 9% 11% 8% 8%<br />
b c<br />
Dollar General 9% 19%<br />
b c<br />
Family Dollar 8% 19%<br />
Other dollar store (i.e., not Dollar<br />
General or Family Dollar)<br />
8% 11% c<br />
5% 2%<br />
4% 4%<br />
8% 4%<br />
CVS/pharmacy 7% 9% 7% 6%<br />
Limited assortment/cut-price<br />
supermarket<br />
b c<br />
6% 10%<br />
5% 4%<br />
Costco 5% 2% 6% 10% a<br />
Sam's Club 4% 2% 4% 5%<br />
Amazon.com 4% 2% 4% 7% a<br />
Not shopping any retailers more<br />
often, just shopping less overall<br />
36% 38% 39% c<br />
29%<br />
Note: Bolding/highlighting indicates significantly greater than Total;superscript<br />
letters indicate significant difference between income groups (95% confidence<br />
level)<br />
“Source: <strong>Kantar</strong> <strong>Retail</strong> ShopperScape ® May 2011
In fact, dollar stores prove to be an increasingly popular<br />
destination among Walmart shoppers in general<br />
(Figure 5). The percentage of monthly Walmart shoppers<br />
shopping the dollar channel in any given four-week period<br />
has risen overall from since August 2010, with a notable<br />
spike during 2010’s holiday shopping season.<br />
This cross-shopping percentage has increased<br />
significantly for the channel as a whole from 2010–2011, as<br />
well as individual small-format value retailers (Figure 6).<br />
Additionally:<br />
The percentage of Walmart shoppers cross-shopping<br />
online retailers has increased significantly—most<br />
notably Amazon (42% of monthly Walmart shoppers,<br />
up from 34% last year), and, to a lesser extent, eBay.<br />
com (24% of Walmart shoppers).<br />
JCPenney, Kmart, and Macy’s also gained Walmart<br />
shoppers from 2010–2011.<br />
59%<br />
34%<br />
© 2012 <strong>Kantar</strong> <strong>Retail</strong><br />
40% 41%<br />
31% 32% 32% 29% 29% 28% 28%<br />
- 15 -<br />
Walmart Watch: Declining Shopping Frequency<br />
Figure 5: Percentage of Monthly Walmart/Walmart<br />
Supercenter Shoppers Who Shopped Dollar Stores<br />
during Past Four Weeks<br />
Source: <strong>Kantar</strong> <strong>Retail</strong> ShopperScape ® August 2010-October 2011<br />
61% 22% 22% 22%<br />
42% 41% 20% 18% 17% 18%<br />
40% 17% 17% 16%<br />
33% 32% 31% 31% 31% 30% 30%<br />
24% 22% 22% 21% 20% 19% 19% 19% 18% 17% 15%<br />
Dollar Channel<br />
Figure 6: Top <strong>Retail</strong>ers Shopped in the Past 4 Weeks by Monthly Walmart/Walmart Supercenter Shoppers<br />
Amazon.com<br />
Walgreens<br />
Target/SuperTarget<br />
JCPenney<br />
Lowe's<br />
Source: <strong>Kantar</strong> <strong>Retail</strong> ShopperScape ® January-October 2010; January-October 2011<br />
The Home Depot<br />
Dollar Tree<br />
Kohl's<br />
CVS/pharmacy<br />
Dollar General<br />
68%<br />
66%<br />
64%<br />
62%<br />
60%<br />
58%<br />
56%<br />
54%<br />
52%<br />
eBay.com<br />
Best Buy<br />
Sam's Club<br />
Family Dollar<br />
Kmart/Big Kmart<br />
Netflix<br />
Macy's<br />
Barnes & Noble<br />
2010<br />
2011<br />
Staples<br />
Sears<br />
Big Lots
Value seems to be the driving force in Walmart’s leakage<br />
to dollar. Among Walmart shoppers who also shopped<br />
a dollar store, over half said that their ability to get<br />
individual items for less money as well as a less expensive<br />
basket overall, are very important factors driving them to<br />
shop dollar stores (Figure 7). Convenience also plays a<br />
role here, with just about half of Walmart shoppers rating<br />
dollar stores’ convenient location and quick shopping<br />
experience as very important factors—significantly higher<br />
percentages compared with all dollar store shoppers.<br />
Not only are Walmart shoppers looking for a better<br />
value overall, they also place value on a quick, easy, and<br />
convenient shopping experience—making the Internet<br />
another popular shopping option for Walmart shoppers.<br />
© 2012 <strong>Kantar</strong> <strong>Retail</strong><br />
- 16 -<br />
One-Stop Shopping … Online: Walmart<br />
Shoppers Make Amazon Part of Their<br />
Regular Routine<br />
In terms of gaining Walmart shoppers year-to-year,<br />
Amazon.com is second to the dollar channel (see Figure<br />
6). The percentage of monthly Walmart shoppers who<br />
shopped Amazon has risen significantly from 34% in 2010<br />
to 42% in 2011. This percentage has increased steadily<br />
overall from February 2007 to October 2011 (Figure 8).<br />
As a result, Amazon is now the retailer most frequently<br />
cross-shopped by regular Walmart shoppers, taking the<br />
top spot from Target in the past year.<br />
Figure 7: % Shoppers Rating Factors as “Very Important” in Causing Them to Shop Dollar Stores<br />
(among shoppers who have shopped a dollar store retailer in the past 4 weeks)<br />
Can get individual items for less money<br />
Less expensive overall<br />
Convenient location<br />
Can get in and out quickly<br />
Best option considering economic situation<br />
Easier to shop<br />
Friendly neighborhood atmosphere<br />
Wide variety of national brands<br />
"Thrill of the hunt"<br />
Limited assortment = less temptation<br />
NOTE: Star indicates significantly higher percentage compared to all shoppers (95% confidence level).<br />
Source: <strong>Kantar</strong> <strong>Retail</strong> ShopperScape ® , May 2011<br />
18%<br />
20%<br />
24%<br />
24%<br />
24%<br />
25%<br />
32%<br />
30%<br />
36%<br />
36%<br />
Walmart Watch: Declining Shopping Frequency<br />
39%<br />
38%<br />
45%<br />
48%<br />
52%<br />
54%<br />
57%<br />
59%<br />
66%<br />
68%<br />
Monthly WM/WMSC Shoppers<br />
All Shoppers
Amazon is especially relevant for younger Walmart<br />
shoppers. Gen Y Walmart shoppers are more likely to<br />
have incorporated Walmart into their weekly shopping<br />
routine: 24% of Gen Y shoppers shop Amazon on a weekly<br />
basis compared with 17% of all Walmart shoppers<br />
(Figure 9). Younger Walmart shoppers also are more<br />
likely to belong to an Amazon loyalty program—such as<br />
Amazon Mom or Amazon Subscribe & Save (Figure 10).<br />
As with the discounter/dollar channel, value is a big factor<br />
in causing Walmart shoppers to shop online overall (not<br />
just Amazon.com). Significantly more Walmart shoppers—<br />
nearly three-quarters—rated the fact that they can get<br />
lower prices on specific items as very important in causing<br />
them to shop or purchase online, compared to all online<br />
shoppers. Walmart shoppers also are more likely to value<br />
the instant replenishment options available online—which<br />
are increasingly popular components of Amazon’s offer<br />
(Figure 11).<br />
© 2012 <strong>Kantar</strong> <strong>Retail</strong><br />
Figure 9: Amazon Shopping Frequency<br />
68%<br />
33%<br />
18%<br />
17%<br />
72%<br />
27%<br />
21%<br />
24%<br />
All Walmart Shoppers Gen Y Walmart Shoppers<br />
Source: <strong>Kantar</strong> <strong>Retail</strong> ShopperScape ® July 2011<br />
Less than Once a<br />
month<br />
1–3 times/Month<br />
Weekly<br />
- 17 -<br />
Walmart Watch: Declining Shopping Frequency<br />
Figure 8: Percentage of Monthly Walmart/Walmart<br />
Supercenter Shoppers Who Shopped Amazon.com<br />
during Past Four Weeks<br />
Source: <strong>Kantar</strong> <strong>Retail</strong> ShopperScape ® February 2007-October 2011<br />
Figure 10: Membership in Amazon.com Programs<br />
Amazon Mom<br />
Subscribe & Save<br />
4%<br />
5%<br />
5%<br />
Source: <strong>Kantar</strong> <strong>Retail</strong> ShopperScape ® July 2011<br />
10%<br />
Gen Y Walmart<br />
Shoppers<br />
All Walmart Shoppers
© 2012 <strong>Kantar</strong> <strong>Retail</strong><br />
- 18 -<br />
Walmart Watch: Declining Shopping Frequency<br />
Figure 11: % Shoppers Rating Factors as “Very Important” in Casuing Them to Shop/Purchase Online<br />
(among shoppers who have shopped online during the past 6 months)<br />
NOTE: Star indicates significantly higher percentage compared to all shoppers (95% confidence level).<br />
Source: <strong>Kantar</strong> <strong>Retail</strong> ShopperScape ® July 2011<br />
Free shipping<br />
I can get lower prices for specific items I want<br />
Ability to browse at my leisure<br />
Ability to shop any time<br />
Convenience<br />
Enormous variety of products<br />
Free return shipping<br />
Shopping/purchasing online saves time<br />
Availability of good coupons/promotional codes<br />
Availability of customer reviews of products<br />
Tax-free purchases<br />
Shopping/purchasing online is entertaining/fun<br />
Credit card rewards<br />
Site recommends products based on past purchases<br />
Availability of instant replenishment option on products I<br />
purchase regularly<br />
21%<br />
20%<br />
20%<br />
17%<br />
19%<br />
17%<br />
28%<br />
25%<br />
48%<br />
47%<br />
48%<br />
46%<br />
47%<br />
47%<br />
57%<br />
57%<br />
60%<br />
60%<br />
65%<br />
63%<br />
73%<br />
71%<br />
71%<br />
70%<br />
69%<br />
68%<br />
69%<br />
70%<br />
77%<br />
78%<br />
Monthly Walmart /<br />
Walmart Supercenter<br />
Shoppers<br />
All Shoppers
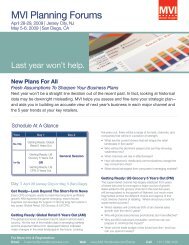
Amazon.com Continues Move Toward Being a Mainstream<br />
Shopping Destination<br />
Amazon’s place as a holiday retail powerhouse is<br />
nothing new: Amazon has been an extremely popular<br />
destination for holiday shopping for several years now.<br />
But for a growing number of shoppers, the online giant is<br />
increasingly a part of regular shopping routines, and will<br />
serve as a major disruptor for an increasing number of<br />
categories in years to come.<br />
59%<br />
56%<br />
53%<br />
Source: <strong>Kantar</strong> <strong>Retail</strong> ShopperScape ® , December 2009, 2010, 2011<br />
© 2012 <strong>Kantar</strong> <strong>Retail</strong><br />
40%<br />
38%<br />
46%<br />
46% 45%<br />
41%<br />
WMT/WMSC Amazon.com Target/<br />
SuperTarget<br />
Figure 1: Top 10 <strong>Retail</strong>ers Shopped for Holiday Gifts<br />
(among holiday gift shoppers)<br />
33% 33% 33%<br />
31%<br />
29% 30%<br />
- 19 -<br />
Amazon’s dominance during the holiday season is wellestablished.<br />
Among the 35 retailers and channels tracked,<br />
Amazon.com is the only retailer/channel to have grown<br />
its holiday shopper base for both of the past two holiday<br />
seasons. It had been the third most-shopped retailer for gifts<br />
in 2009 and 2010, but as its holiday shopper base grew and<br />
Target’s shrank in 2011, Amazon ended up being the second<br />
most-shopped retailer for holiday gifts in 2011.<br />
23%<br />
14%<br />
Kohl’s JCPenney Small-format<br />
value stores<br />
2009 2010 2011<br />
29%<br />
26% 25%<br />
23%<br />
26% 25% 25%<br />
23% 22% 23% 22% 22%<br />
Best Buy Toys "R" Us Macy’s Other online-only<br />
retailers
Having just had its best holiday season ever, as Amazon<br />
continues to leverage its online and digital strengths (such<br />
as enticing shoppers to collect brick-and-mortar pricing<br />
information using its Price Check app) to get even smarter<br />
about its shoppers, it is poised to embed itself in shopping<br />
patterns year-round.<br />
Because of its role as a key holiday shopping destination,<br />
Amazon has become a major threat in key categories. For<br />
instance, about one-third of toy shoppers at major mass<br />
and toy retailers reported having also shopped Amazon.<br />
com for toys during the previous six months (Figure 2). In<br />
fact, many more toy shoppers of multichannel retailers<br />
report cross-shopping Amazon.com for toys than report<br />
shopping that multi-channel retailer’s Web site.<br />
Amazon is moving well beyond serving as just a holiday<br />
shopping destination that lures shoppers with deep<br />
discounts and in-stock positions on hot gifts. Increasingly,<br />
Amazon is becoming part of shoppers’ routines throughout<br />
the year. The percentage of shoppers who report having<br />
shopped Amazon.com on a recent basis has risen steadily<br />
since January 2007 (Figure 3).<br />
© 2012 <strong>Kantar</strong> <strong>Retail</strong><br />
Amazon.com Continues Move Toward Being a Mainstream Shopping Destination<br />
Figure 2: Cross-Shopping Web Destinations for Toys Among In-Store Toy Shoppers<br />
Walmart/<br />
WMSC<br />
Store<br />
Target/<br />
SuperTarget<br />
store<br />
Kmart<br />
store<br />
Note: Blue highlighted cells show the percent of a retailer’s in-store toy shopper who cross-shopped that retailer’s Web site<br />
Source: <strong>Kantar</strong> <strong>Retail</strong> ShopperScape ® , March 2011<br />
- 20 -<br />
Figure 3: Amazon.com Past Four-Week Shopping Incidence<br />
Source: <strong>Kantar</strong> <strong>Retail</strong> ShopperScape ® , January 2007-November 2011<br />
Toys<br />
"R" Us<br />
store<br />
Babies<br />
"R" Us<br />
store<br />
Dollar<br />
General<br />
Family<br />
Dollar<br />
Amazon.com 27% 36% 33% 35% 34% 33% 33% 48%<br />
Walmart.com 17% 20% 29% 19% 23% 26% 21% 26%<br />
Target.com 13% 18% 23% 17% 24% 17% 19% 27%<br />
ToysRus.com 11% 17% 20% 20% 22% 12% 13% 19%<br />
eBay.com 11% 11% 15% 10% 10% 22% 17% 25%<br />
Kmart.com 5% 7% 19% 7% 10% 10% 14% 11%<br />
Other toy Web site 4% 6% 7% 5% 6% 4% 6% 9%<br />
BabiesRus.com 1% 3% 5% 3% 19% 3% 2% 3%<br />
eToys.com 1% 1% 3% 2% 3% 3% 3% 3%<br />
diapers.com 1% 1% 1% 1% 7% 1% 0% 1%<br />
60%<br />
50%<br />
40%<br />
30%<br />
20%<br />
10%<br />
0%<br />
28%<br />
Jan-07<br />
Apr-07<br />
Jul-07<br />
Oct-07<br />
Jan-08<br />
Apr-08<br />
Jul-08<br />
Oct-08<br />
Jan-09<br />
Apr-09<br />
Jul-09<br />
Oct-09<br />
Jan-10<br />
Apr-10<br />
Jul-10<br />
Oct-10<br />
Jan-11<br />
Apr-11<br />
Jul-11<br />
Oct-11<br />
45%<br />
Drug<br />
stores
In fact, Amazon.com is the only retailer among the<br />
200+ tracked by ShopperScape ® to enjoy such a<br />
relentless increase in its shopper base over this time<br />
period.<br />
Note the small dip—and nearly instantaneous<br />
recovery—in Amazon.com’s shopping incidence in<br />
October 2008 at the peak of the financial crisis on Wall<br />
Street.<br />
Nearly three-quarters (72%) of all shoppers report that<br />
they shop Amazon.com, while just over one-third (36%) say<br />
they shop the online retailer on at least a monthly basis<br />
(Figure 4).<br />
Amazon’s shopper penetration is highest among<br />
younger shoppers: nearly eight in 10 Gen X shoppers<br />
report shopping Amazon.com with some frequency,<br />
while over one-half (53%) of Gen Y shoppers say they<br />
shop the online retailer on at least a monthly basis.<br />
Over one-quarter (27%) of Gen Y shoppers shop<br />
Amazon.com on a weekly basis!<br />
While Amazon may still be somewhat of a novelty to many<br />
older shoppers, younger shoppers have “grown up” with<br />
the online retailer. As these younger shoppers begin to<br />
enter the household formation and accumulation stages of<br />
Total<br />
Shopper<br />
Base<br />
© 2012 <strong>Kantar</strong> <strong>Retail</strong><br />
Figure 4: Amazon.com Shopping Frequency<br />
by Generational Cohort<br />
72% 78% 79% 72% 58%<br />
36%<br />
19%<br />
17%<br />
All<br />
Shoppers<br />
26%<br />
26%<br />
27%<br />
21%<br />
22%<br />
Note: Total Shopper Base = percent of shoppers who say they shop Amazon.com<br />
less than once a month or more frequently<br />
Source: <strong>Kantar</strong> <strong>Retail</strong> ShopperScape ® , July 2011<br />
36%<br />
Amazon.com Continues Move Toward Being a Mainstream Shopping Destination<br />
39%<br />
18%<br />
15%<br />
Gen Y Gen X Baby<br />
Boomers<br />
Weekly Monthly Less than once a month<br />
36%<br />
12%<br />
9%<br />
Seniors<br />
- 21 -<br />
Figure 5: Gen Y’s Shopping Frequency at Key <strong>Retail</strong>ers<br />
Total<br />
Shopper<br />
Base<br />
90% 80% 78% 69%<br />
23%<br />
26%<br />
41%<br />
Walmart/<br />
Walmart<br />
Supercenter<br />
28% 26%<br />
15%<br />
29% 26% 24%<br />
23% 27% 30%<br />
Target/<br />
SuperTarget<br />
Amazon.com Conventional<br />
Supermarkets<br />
Weekly Monthly Less than once a month<br />
Note: Total Shopper Base = percent of shoppers who say they shop Amazon.com<br />
less than once a month or more frequently<br />
Source: <strong>Kantar</strong> <strong>Retail</strong> ShopperScape ® , July 2011<br />
their lives, Amazon will continue to play a prominent role.<br />
To better understand just how important Amazon is to Gen<br />
Y shoppers, a comparison of Gen Y shoppers’ shopping<br />
frequency of the online giant compared with major mass<br />
players is revealing (Figure 5).<br />
The vast majority (90%) of Gen Y shoppers shop<br />
at Walmart, but Amazon.com is not far behind the<br />
world’s largest retailer.<br />
About two-thirds (67%) of Gen Y shoppers say they<br />
shop Walmart on at least a monthly basis, while just<br />
over one-half (53%) of those shoppers report shopping<br />
Amazon at least monthly.<br />
Amazon is neck-and-neck with Target in terms of<br />
attracting Gen Y shoppers, and Amazon actually<br />
edges Target in terms of drawing these shoppers on a<br />
monthly basis.<br />
More Gen Y shoppers shop Amazon.com than shop at<br />
conventional supermarkets.<br />
The wealth of young shoppers who turn to Amazon on a<br />
regular basis is further reflected in Amazon’s shopper<br />
profile, which skews toward younger and more affluent<br />
shoppers (Figure 6).
No retailer is immune from Amazon, and retailers should<br />
assume that most of their shoppers are visiting Amazon.<br />
com, even if only to check prices or read reviews (Figure 7).<br />
Among mass retailers, Target and Costco share the<br />
highest percentage of their core monthly shoppers<br />
with Amazon (82%). About one-quarter of each of<br />
those shopper bases shops Amazon on a weekly basis.<br />
Monthly shoppers of apparel retailers are also very<br />
likely to be Amazon shoppers: well over one-half of<br />
Macy’s and Kohl’s monthly shoppers (and Nordstrom’s<br />
past four-week shoppers) also are monthly Amazon<br />
shoppers.<br />
Specialty retailer Toys “R” Us is especially vulnerable<br />
to Amazon, with 85% of its core monthly shoppers<br />
cross-shopping the online giant.<br />
Amazon’s loyalty programs (Amazon Mom, Subscribe &<br />
Save, and Prime) will only help to solidify its place as a<br />
cornerstone of shopping routines, further moving Amazon<br />
away from a once-a-year holiday shopping destination.<br />
Total<br />
Shopper<br />
Base<br />
© 2012 <strong>Kantar</strong> <strong>Retail</strong><br />
- 22 -<br />
Figure 6: Demographic Profile of Amazon.com Shoppers<br />
All<br />
Shoppers<br />
Amazon.com<br />
Past<br />
4-Week<br />
Shoppers<br />
Monthly<br />
Shoppers<br />
Age 18 –24 6% 6% 7%<br />
25 –34 17% 21% 22%<br />
35 –44 19% 21% 20%<br />
45 –54 21% 21% 21%<br />
55 –64 17% 16% 16%<br />
65+ 20% 14% 14%<br />
Income < $25,000 25% 19% 18%<br />
Presence<br />
of Children<br />
$25,000–$49,999 25% 23% 22%<br />
$50,000 –$74,999 18% 19% 19%<br />
$75,000 –$99,999 12% 14% 14%<br />
$100,000+ 20% 25% 26%<br />
Children under 19<br />
at home<br />
No children<br />
under 19 at home<br />
25% 28% 27%<br />
75% 72% 73%<br />
Note: Bolding/highlighting indicates significantly greater than all shoppers<br />
(95% confidence level)<br />
Source: <strong>Kantar</strong> <strong>Retail</strong> ShopperScape ® , January-November 2011<br />
Figure 7: Amazon.com Shopping Frequency among Monthly Shoppers of Select <strong>Retail</strong>ers<br />
72% 82% 69% 76% 74% 82% 74% 73% 82% 81% 86% 85%<br />
36%<br />
19%<br />
17%<br />
32%<br />
25%<br />
24%<br />
33%<br />
18%<br />
All Target/ Walmart/<br />
Shoppers SuperTarget WMSC<br />
Amazon.com Continues Move Toward Being a Mainstream Shopping Destination<br />
33%<br />
23% 19% 20% 21%<br />
17% 21% 22% 23% 22% 21%<br />
32% 28%<br />
Note: Total Shopper Base = percent of shoppers who say they shop Amazon.com less than once a month or more frequently<br />
Source: <strong>Kantar</strong> <strong>Retail</strong> ShopperScape ® , July 2011<br />
33%<br />
39%<br />
31%<br />
CVS Walgreens Costco Sam’s<br />
Club<br />
35%<br />
18%<br />
Weekly Monthly Less than once a month<br />
29% 31%<br />
22%<br />
22%<br />
31%<br />
22%<br />
33%<br />
14%<br />
16%<br />
55%<br />
Kroger Macy’s Kohl’s Nordstrom* Toys “R”<br />
Us
Despite the relative newness of Amazon Mom and<br />
Subscribe & Save, both programs are gaining traction,<br />
especially among key demographic groups<br />
(Figure 8). Membership in these programs has the<br />
potential to dramatically change the nature of trips to<br />
mass and grocery retailers, as shoppers satisfy some<br />
of their core baby and household essentials needs via<br />
Amazon.<br />
Overall, about 5% of shoppers are members of<br />
Amazon Mom and/or Subscribe & Save. Monthly<br />
Amazon.com shoppers are significantly more<br />
likely than average to be members of each of those<br />
programs.<br />
© 2012 <strong>Kantar</strong> <strong>Retail</strong><br />
Amazon.com Continues Move Toward Being a Mainstream Shopping Destination<br />
- 23 -<br />
Monthly Target shoppers are significantly more likely<br />
than the average shopper to be members of Amazon<br />
Mom, which might drastically affect the way those<br />
moms shop Target on a typical trip.<br />
Membership in both of the Amazon programs is<br />
especially high among two key demographic groups:<br />
Gen Y moms (who are just starting their household<br />
formation and accumulation years) and affluent Gen<br />
X-ers (who have substantial shopping lists requiring<br />
a wide variety of goods to fill and high spending<br />
potential). Participation in Amazon Mom and<br />
Subscribe & Save helps to ingrain Amazon into those<br />
shoppers’ shopping routines, and will shape their<br />
shopping habits and retail expectations going forward.<br />
Figure 8: Membership in Amazon Programs, among Monthly Shoppers of Key <strong>Retail</strong>ers and Key Demographic Groups<br />
All<br />
Shoppers Amazon.com<br />
Shopped Monthly at <strong>Retail</strong>er<br />
Target/<br />
SuperTarget<br />
Note: Bolding/highlighting indicates significantly greater than all shoppers (95% confidence level)<br />
Source: <strong>Kantar</strong> <strong>Retail</strong> ShopperScape ® , July 2011<br />
Walmart/<br />
Walmart<br />
Supercenter<br />
Gen Y<br />
Moms<br />
Affluent Gen<br />
X (Annual HH<br />
Income $85k+)<br />
Sample Size 4061 815 1058 2154 132 429<br />
Amazon Mom 4% 11% 6% 4% 20% 12%<br />
Amazon Subscribe & Save 5% 13% 6% 5% 16% 7%<br />
BOTH Amazon Mom and Subscribe & Save 2% 6% 3% 2% 11% 4%<br />
Neither of these 93% 82% 91% 93% 76% 86%
Online Shopping: The New General Store<br />
It is often assumed that shoppers shop and purchase<br />
online because they tend to be disproportionately<br />
motivated by either saving money or saving time. Despite<br />
this conventional thinking, ShopperScape ® data show that<br />
Source: <strong>Kantar</strong> <strong>Retail</strong> ShopperScape ® , July 2011<br />
© 2012 <strong>Kantar</strong> <strong>Retail</strong><br />
- 24 -<br />
the reasons shoppers give for shopping and purchasing<br />
online reflect a strong orientation toward both value and<br />
convenience (Figure 1). Marketers selling online will need<br />
to meet both requirements.<br />
Figure 1: Reasons for Shopping Online<br />
(Among online shoppers; percentage rating as “very important”)<br />
Free shipping<br />
Lower prices for items I want<br />
Convenience<br />
Can browse at leisure/no pressure from sales people<br />
Can shop any time day or night<br />
Large variety of products means I can get what I want<br />
Free return shipping<br />
Saves time<br />
Tax-free purchases<br />
Availability of good coupons/promotional codes<br />
Availability of customer reviews<br />
Shopping/purchasing online is entertaining/fun<br />
Credit card rewards<br />
Availability of instant replenishment option<br />
Get relevant recommendations based on past purchasing<br />
17%<br />
17%<br />
20%<br />
25%<br />
47%<br />
47%<br />
46%<br />
57%<br />
60%<br />
63%<br />
71%<br />
70%<br />
70%<br />
68%<br />
78%
Value-oriented reasons top the list in terms of the percent<br />
of shoppers who indicate they are “very important”<br />
reasons to shop online: over three-quarters of online<br />
shoppers (78%) cite free shipping, followed by 71% citing<br />
low prices. The next three reasons for shopping and<br />
purchasing online all have to do with ease of shopping:<br />
convenience (70%), the ability to browse at one’s leisure<br />
with no pressure from sales people (70%), and the ability<br />
to shop any time of day or night (68%).<br />
One-quarter (25%) of online shoppers say the<br />
entertainment aspect of online shopping is very important.<br />
Younger shoppers’ evaluation of what is “very important”<br />
to them as online shoppers points to a shopper base that<br />
has differentiated priorities vs. all shoppers (Figure 2).<br />
Shoppers in the Gen Y cohort are significantly more likely<br />
to value the social and fun aspects of shopping online.<br />
© 2012 <strong>Kantar</strong> <strong>Retail</strong><br />
- 25 -<br />
They also are more inclined to seek out discounts, and<br />
the appeal of instant replenishment options (e.g., Amazon<br />
Subscribe & Save) is highest among shoppers in this<br />
group. Consequently, expect shoppers in this generational<br />
cohort to have higher expectations for the online shopping<br />
experience, as well as different demands on their store<br />
shopping experiences as they transition some of their<br />
consumables purchasing to online retailers who can<br />
deliver goods on a pre-determined, scheduled basis.<br />
Gen X shoppers, in a reflection of their life stage—i.e.,<br />
smack in the middle of time-starved and financially<br />
constrained family formation years—are perhaps the<br />
most demanding shoppers. Eight of 15 possible reasons<br />
for shopping online—everything from price and time<br />
savings to selection/variety—are more important to these<br />
shoppers than all shoppers.<br />
Figure 2: Reasons for Shopping Online, by Generational Cohort<br />
(Among online shoppers; percentage rating as “very important”)<br />
Generational Cohort<br />
All Shoppers Gen Y Gen X Boomers Seniors<br />
Sample Size 2639 344 859 976 460<br />
Free shipping 78% 76% 80% 79% 75%<br />
Lower prices for items I want 71% 73% 76% 74% 56%<br />
Convenience 70% 67% 72% 71% 64%<br />
Can browse at leisure/no pressure from sales people 70% 66% 73% 72% 64%<br />
Can shop any time day or night 68% 69% 73% 69% 58%<br />
Large variety of products means I can get what I want 63% 64% 66% 64% 56%<br />
Free return shipping 60% 54% 61% 62% 60%<br />
Saves time 57% 50% 62% 60% 48%<br />
Availability of good coupons/promotional codes 47% 55% 54% 44% 31%<br />
Tax-free purchases 47% 48% 44% 50% 43%<br />
Availability of customer reviews 46% 55% 53% 42% 38%<br />
Shopping/purchasing online is entertaining/fun 25% 42% 31% 20% 13%<br />
Credit card rewards 20% 19% 23% 18% 17%<br />
Get relevant recommendations based on past purchasing 17% 31% 19% 13% 12%<br />
Availability of instant replenishment option 17% 23% 21% 14% 13%<br />
Shading indicates shoppers in generational cohort significantly more likely than all shoppers to rate reason as a “very important” reason to shop online (95%<br />
confidence level)<br />
Boxing indicates shoppers in generational cohort significantly less likely than all shoppers to rate reason as a “very important” reason to shop online (95%<br />
confidence level)<br />
Source: <strong>Kantar</strong> <strong>Retail</strong> ShopperScape ® , July 2011<br />
Online Shopping: The New General Store
Women’s apparel is the most common product shopped<br />
for online (28%), followed by books and women’s shoes.<br />
Fourth on the list is the consumables category with the<br />
largest shopper base—beauty/skin care products (15%).<br />
Otherwise, online grocery shopping remains more the<br />
exception than the norm: fewer than 5% of shoppers<br />
report having shopped for food or non-edible household<br />
essentials online during the past six months (Figure 3).<br />
© 2012 <strong>Kantar</strong> <strong>Retail</strong><br />
- 26 -<br />
The top five categories with the highest shopper bases<br />
also have the largest purchaser bases—plus the e-book<br />
category is a top-five category in terms of the size of its<br />
purchaser base. However, when calculating conversion<br />
rates (i.e., what percent of those who shopped the category<br />
online made an online purchase in the category), two<br />
categories with smaller shopper and purchaser bases end<br />
up on the top five list: prescription drugs and over-thecounter<br />
drugs/vitamins.<br />
Figure 3: Past Six-Month Online Shopping and Purchasing: All Shoppers<br />
Shopped Purchased Conversion*<br />
Women's apparel 28% 18% 62%<br />
Hardcover/paperback books 21% 15% 72%<br />
Women's shoes 19% 9% 46%<br />
Beauty/skin care products 15% 9% 60%<br />
DVD/Blu-ray movies 15% 9% 61%<br />
CE (not computers) 13% 5% 37%<br />
E-books 12% 10% 77%<br />
Laptop/desktop/netbook computer 11% 4% 32%<br />
OTC drugs/vitamins 10% 6% 61%<br />
Men's apparel 10% 6% 56%<br />
Furniture 9% 3% 30%<br />
Video games 9% 5% 55%<br />
Prescription drugs 9% 6% 75%<br />
Pet food/supplies 8% 4% 54%<br />
Toys/dolls/games 8% 4% 55%<br />
Infants/toddlers/kids apparel 8% 4% 54%<br />
School/home office supplies 7% 3% 43%<br />
Small housewares 7% 3% 38%<br />
Personal care products 7% 4% 55%<br />
Men's shoes 7% 3% 40%<br />
Tablet computer 6% 1% 19%<br />
Toddlers/kids shoes 6% 2% 42%<br />
Home textiles 5% 2% 38%<br />
Building products 5% 1% 24%<br />
Baby supplies 5% 3% 56%<br />
Shelf-stable/non-perishable food 4% 2% 55%<br />
HH cleaning products 4% 2% 46%<br />
Hand/power tools 4% 1% 33%<br />
Fresh food 4% 1% 39%<br />
HH paper products 3% 2% 51%<br />
Note: Top 5 categories are outlined in each column.<br />
* Calcluated as % purchased/% shopped<br />
Source: <strong>Kantar</strong> <strong>Retail</strong> ShopperScape ® , July 2011<br />
Online Shopping: The New General Store
Mapping the categories by shopper base and conversion<br />
rate shows that just a handful of categories have created<br />
a regular, sizable online purchaser base (Figure 4).<br />
Categories in the upper-right quadrant (women’s apparel/<br />
shoes, HBC, hard copy and e-books, DVD/Blu-ray movies,<br />
and men’s apparel) are “high shop, high purchase”<br />
categories: a higher-than-average percentage of shoppers<br />
shop for these products online, and a higher-than-average<br />
percentage of shoppers ultimately purchase those<br />
products online.<br />
Consumer electronics appear to be the most<br />
“browsed for” product online (among those tracked in<br />
ShopperScape ® ). About 13% of shoppers have shopped for<br />
the category online in the past six months, but only about<br />
Percentage of Online Shoppers Who Purchased Online<br />
© 2012 <strong>Kantar</strong> <strong>Retail</strong><br />
75%<br />
65%<br />
55%<br />
45%<br />
35%<br />
25%<br />
15%<br />
Figure 4: Online Shopping and Purchasing by Category<br />
Video games<br />
DVDs/Blu-ray movies<br />
Baby supplies<br />
Men's apparel/shoes<br />
Non-food grocery items<br />
Toys/dolls/games<br />
Infants/toddlers/kids apparel<br />
Food grocery items<br />
School/home office supplies<br />
Tablet computer<br />
Prescription drugs<br />
Homegoods<br />
Furniture<br />
E-books<br />
Consumer electronics<br />
- 27 -<br />
5% of shoppers actually made a consumer electronics<br />
purchase online, for a “conversion rate” of 37%. Of<br />
course, given the often long research cycle associated<br />
with these purchases, many of the recent category<br />
shoppers may ultimately end up purchasing online. <strong>Kantar</strong><br />
<strong>Retail</strong> forecasts that 25% of all sales in the category will<br />
come through online channels in 2017.<br />
Categories in the upper-left quadrant—prescription<br />
drugs in particular—are those for which a relatively small<br />
number of shoppers shop online, but a high percentage<br />
of those shoppers make a purchase online. Conversion<br />
is high because these categories lend themselves to very<br />
focused, mission-oriented shopping trips.<br />
Laptop/desktop/netbook computer<br />
Hardcover/paperback books<br />
0% 5% 10% 15% 20% 25% 30% 35%<br />
Source: <strong>Kantar</strong> <strong>Retail</strong> ShopperScape ® , July 2011<br />
HBC<br />
Percentage Shopped for Product Online in Past 6 Months<br />
Online Shopping: The New General Store<br />
Women's apparel/shoes
<strong>Kantar</strong><strong>Retail</strong><strong>iQ</strong>.com / <strong>Kantar</strong><strong>Retail</strong><strong>iQ</strong>.eu / <strong>Kantar</strong><strong>Retail</strong><strong>iQ</strong>.cn<br />
<strong>Kantar</strong><strong>Retail</strong>.com