Batch Gravitational Sedimentation of Slurries
Batch Gravitational Sedimentation of Slurries
Batch Gravitational Sedimentation of Slurries

Create successful ePaper yourself
Turn your PDF publications into a flip-book with our unique Google optimized e-Paper software.
TABLE 1<br />
Model Parameters Obtained in This Work<br />
φ0 φg U0K (φ0) (m/s) Pv (Pa) P0 (Pa) β<br />
0.01 0.089<br />
Kaolin slurries<br />
NA NA 1.60 0.30<br />
0.05 0.094 NA NA 0.80 0.15<br />
0.08 0.067 8.49 × 10⁻⁵ 207 0.50 0.18<br />
0.12 0.070 6.77 × 10⁻⁵ 377 0.50 0.15<br />
0.15 0.100 6.13 × 10⁻⁵ 448 0.90 0.10<br />
UK ball clay slurries<br />
0.02 0.079 NA NA 1.20 0.35<br />
0.05 0.094 NA NA 1.05 0.25<br />
0.08 0.083 1.36 × 10⁻⁴ 96 0.40 0.20<br />
0.12 0.077 1.11 × 10⁻⁴ 324 0.65 0.23<br />
0.15 0.082 1.01 × 10⁻⁴ 432 0.37 0.70<br />
The solid velocity <strong>of</strong> sediment at φ0 by Landman and Russel<br />
(38) is stated as follows:<br />
uS(φ0) =− dy<br />
dt =−U0K(φ0)<br />
<br />
1− ∂PS/∂z<br />
<br />
ρgφ0<br />
<br />
<br />
Py(φ0)<br />
=−U0K(φ0) 1−<br />
, [7]<br />
ρgφ0 (y − L c)<br />
where U0 is the terminal velocity <strong>of</strong> individual particle; K is the<br />
hindered factor; ρ, the density difference between the solids<br />
and the liquid; g, the gravitational acceleration; y, the upper<br />
interfacial height where φ = φ0; and Lc, the height where φ<br />
deviates from φ0 (19). Equation [5] is valid for the consolidating<br />
sediment with φ>φ0. A regime <strong>of</strong> constant φ0 is assumed to<br />
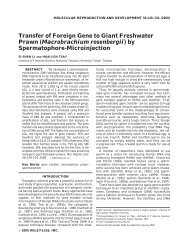
FIG. 8. Plot <strong>of</strong> dy/dt vs 1/(y − Lc) <strong>of</strong> the slurries with φ0 higher than φg.<br />
SEDIMENTATION OF SLURRIES 185<br />
exist in the consolidating sediment over the range <strong>of</strong> z = y,<br />
where PS = 0toz=Lc, where PS = Py(φ0). Hence, the plot<br />
with dy/dt versus 1/(y − Lc) estimates the U0K and Py at φ =<br />
φ0 with linear regression analysis.<br />
The investigated slurries possess a blurred suspension, while<br />
the solid pressure accumulated at yg, where φ = φg. Therefore,<br />
Eq. [5] needs correction as follows:<br />
dy<br />
dt = U0K<br />
<br />
(φ0) 1 − Py(φ0)<br />
<br />
− Pg<br />
, [8]<br />
ρgφ0(y − L c)<br />
where Pg is the accumulated solid pressure at y and could be<br />
approximated as<br />
Pg = PS|z=y ≈ ρg<br />
<br />
yg<br />
y<br />
φ dz. [9]<br />
If Eq. [8] were valid for describing the dynamics <strong>of</strong> the consolidating<br />
sediment, the curves for dy/dt versus 1/(y − Lc) data<br />
should reveal a linear character. Figure 8 shows some dy/dt versus<br />
1/(y − Lc) data sets <strong>of</strong> φ0 >φgtests. Apparently the curves<br />
in Fig. 8 reveal a linear relation during early stage <strong>of</strong> settling. For<br />
instance, for kaolin slurry at φ0 = 8%, Eq. [1] could describe<br />
the consolidation at testing time less than 1000 s. After the initial<br />
stage the settling becomes very slow (very small dy/dt)<br />
while the linear relationship breaks down. This observation corresponds<br />
to the observation by Shen et al. (1994). The yield<br />
stress <strong>of</strong> the investigated slurries could not sustain the integrity<br />
<strong>of</strong> the constant-φ0 regime which deteriorates continuously with<br />
time.<br />
Table 1 lists the best-fit Py(φ0) and U0K (φ0) for the investigated<br />
slurries in their regimes. For both slurries Py increased<br />
and U0K decreased with increasing φ0. At the same φ0 kaolin<br />
slurries have the higher Py but the lower U0K than the ball<br />
clay slurries. Therefore the kaolin slurries are “stiffer” than the<br />
clay slurries. This observation corresponds to the greater β values<br />
for the clay slurries in Table 1 when compared with the<br />
kaolin slurries. This plastic characteristic apparently degrades<br />
in the subsequent settling stage. The dy/dt versus 1/(y − Lc)<br />
data deviate from the linear regime at t > 1000 s.<br />
CONCLUSIONS<br />
This study utilized a CATSCAN to measure the spatiotemporal<br />
distributions <strong>of</strong> solids fraction for kaolin and clay slurries<br />
at various initial solid concentrations, φ0s. The CATSCAN<br />
could not directly measure the null-stress solids fraction (φg)<br />
for the investigated slurries, whose values are estimated using<br />
an averaging technique to all around 0.07–0.08, regardless <strong>of</strong><br />
the φ0.<br />
The experimental range <strong>of</strong> φ0 (0.01–0.15) has covered both<br />
the φ0 φgcases. The basic settling characteristics<br />
are similar for slurries with φ0 >φgand vice versa. A constantφ0<br />
regime is noted for both cases, beneath which a sediment