Batch Gravitational Sedimentation of Slurries
Batch Gravitational Sedimentation of Slurries
Batch Gravitational Sedimentation of Slurries

You also want an ePaper? Increase the reach of your titles
YUMPU automatically turns print PDFs into web optimized ePapers that Google loves.
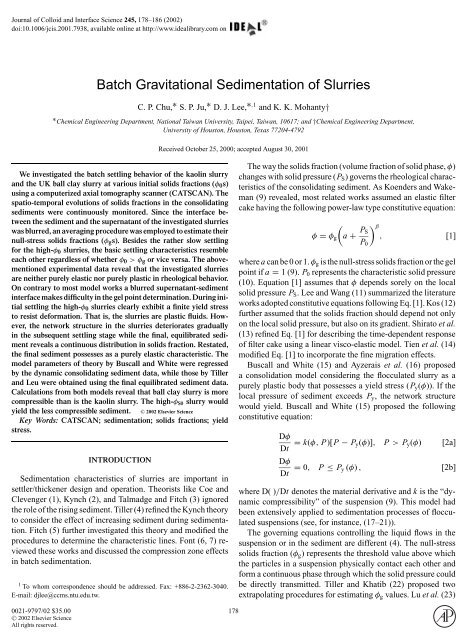
Journal <strong>of</strong> Colloid and Interface Science 245, 178–186 (2002)<br />
doi:10.1006/jcis.2001.7938, available online at http://www.idealibrary.com on<br />
<strong>Batch</strong> <strong>Gravitational</strong> <strong>Sedimentation</strong> <strong>of</strong> <strong>Slurries</strong><br />
C. P. Chu, ∗ S. P. Ju, ∗ D. J. Lee, ∗,1 and K. K. Mohanty†<br />
∗ Chemical Engineering Department, National Taiwan University, Taipei, Taiwan, 10617; and †Chemical Engineering Department,<br />
University <strong>of</strong> Houston, Houston, Texas 77204-4792<br />
We investigated the batch settling behavior <strong>of</strong> the kaolin slurry<br />
and the UK ball clay slurry at various initial solids fractions (φ0s)<br />
using a computerized axial tomography scanner (CATSCAN). The<br />
spatio-temporal evolutions <strong>of</strong> solids fractions in the consolidating<br />
sediments were continuously monitored. Since the interface between<br />
the sediment and the supernatant <strong>of</strong> the investigated slurries<br />
was blurred, an averaging procedure was employed to estimate their<br />
null-stress solids fractions (φgs). Besides the rather slow settling<br />
for the high-φ0 slurries, the basic settling characteristics resemble<br />
each other regardless <strong>of</strong> whether φ0 >φgor vice versa. The abovementioned<br />
experimental data reveal that the investigated slurries<br />
are neither purely elastic nor purely plastic in rheological behavior.<br />
On contrary to most model works a blurred supernatant-sediment<br />
interface makes difficulty in the gel point determination. During initial<br />
settling the high-φ0 slurries clearly exhibit a finite yield stress<br />
to resist deformation. That is, the slurries are plastic fluids. However,<br />
the network structure in the slurries deteriorates gradually<br />
in the subsequent settling stage while the final, equilibrated sediment<br />
reveals a continuous distribution in solids fraction. Restated,<br />
the final sediment possesses as a purely elastic characteristic. The<br />
model parameters <strong>of</strong> theory by Buscall and White were regressed<br />
by the dynamic consolidating sediment data, while those by Tiller<br />
and Leu were obtained using the final equilibrated sediment data.<br />
Calculations from both models reveal that ball clay slurry is more<br />
compressible than is the kaolin slurry. The high-φS0 slurry would<br />
yield the less compressible sediment. C○ 2002 Elsevier Science<br />
Key Words: CATSCAN; sedimentation; solids fractions; yield<br />
stress.<br />
INTRODUCTION<br />
<strong>Sedimentation</strong> characteristics <strong>of</strong> slurries are important in<br />
settler/thickener design and operation. Theorists like Coe and<br />
Clevenger (1), Kynch (2), and Talmadge and Fitch (3) ignored<br />
the role <strong>of</strong> the rising sediment. Tiller (4) refined the Kynch theory<br />
to consider the effect <strong>of</strong> increasing sediment during sedimentation.<br />
Fitch (5) further investigated this theory and modified the<br />
procedures to determine the characteristic lines. Font (6, 7) reviewed<br />
these works and discussed the compression zone effects<br />
in batch sedimentation.<br />
1 To whom correspondence should be addressed. Fax: +886-2-2362-3040.<br />
E-mail: djlee@ccms.ntu.edu.tw.<br />
0021-9797/02 $35.00<br />
C○ 2002 Elsevier Science<br />
All rights reserved.<br />
Received October 25, 2000; accepted August 30, 2001<br />
178<br />
The way the solids fraction (volume fraction <strong>of</strong> solid phase, φ)<br />
changes with solid pressure (PS) governs the rheological characteristics<br />
<strong>of</strong> the consolidating sediment. As Koenders and Wakeman<br />
(9) revealed, most related works assumed an elastic filter<br />
cake having the following power-law type constitutive equation:<br />
φ = φg<br />
<br />
a + PS<br />
β , [1]<br />
P0<br />
where a canbe0or1.φgis the null-stress solids fraction or the gel<br />
point if a = 1 (9). P0 represents the characteristic solid pressure<br />
(10). Equation [1] assumes that φ depends sorely on the local<br />
solid pressure PS. Lee and Wang (11) summarized the literature<br />
works adopted constitutive equations following Eq. [1]. Kos (12)<br />
further assumed that the solids fraction should depend not only<br />
on the local solid pressure, but also on its gradient. Shirato et al.<br />
(13) refined Eq. [1] for describing the time-dependent response<br />
<strong>of</strong> filter cake using a linear visco-elastic model. Tien et al. (14)<br />
modified Eq. [1] to incorporate the fine migration effects.<br />
Buscall and White (15) and Ayzerais et al. (16) proposed<br />
a consolidation model considering the flocculated slurry as a<br />
purely plastic body that possesses a yield stress (Py(φ)). If the<br />
local pressure <strong>of</strong> sediment exceeds Py, the network structure<br />
would yield. Buscall and White (15) proposed the following<br />
constitutive equation:<br />
Dφ<br />
Dt = k(φ, P)[P − Py(φ)], P > Py(φ) [2a]<br />
Dφ<br />
Dt = 0, P ≤ Py (φ) , [2b]<br />
where D( )/Dt denotes the material derivative and k is the “dynamic<br />
compressibility” <strong>of</strong> the suspension (9). This model had<br />
been extensively applied to sedimentation processes <strong>of</strong> flocculated<br />
suspensions (see, for instance, (17–21)).<br />
The governing equations controlling the liquid flows in the<br />
suspension or in the sediment are different (4). The null-stress<br />
solids fraction (φg) represents the threshold value above which<br />
the particles in a suspension physically contact each other and<br />
form a continuous phase through which the solid pressure could<br />
be directly transmitted. Tiller and Khatib (22) proposed two<br />
extrapolating procedures for estimating φg values. Lu et al. (23)
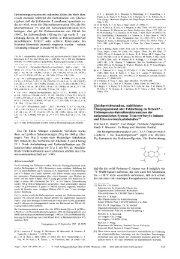
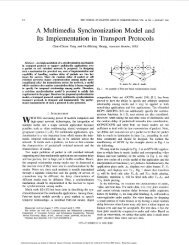
FIG. 1. Schematics <strong>of</strong> slurry settling. (a) Purely elastic sediment; (b) purely<br />
plastic sediment.<br />
adopted low-head filtration test to determine the surface cake<br />
porosity and examine the effects <strong>of</strong> slurry concentration and<br />
operating conditions. Determination <strong>of</strong> φ0 for certain slurries<br />
is extremely difficult since the interface between the sediment<br />
and the suspension could be blurred. The sudden jump in<br />
solids fraction when moving from settling slurry to sediment as<br />
suggested by the idealized theory may not be easily observed<br />
(as discussed later).<br />
Researchers adopted nondestructive techniques to obtain the<br />
relevant variable in the solid/liquid separation processes as a<br />
function <strong>of</strong> space and time, such as the use <strong>of</strong> γ -ray (18, 24),<br />
NMR (25–27), and X-ray (17, 28–33). Buscall (34) reviewed<br />
the pertinent literature before 1990. Shen et al. (19) adopted the<br />
yield-stress model by Buscall and White (15) for interpreting<br />
their settling data, and noted that the model was valid during the<br />
initial phase <strong>of</strong> settling/filtration <strong>of</strong> the “pliant” systems (with<br />
initial solid weight exceeds the corresponding yield stress). For<br />
the “stiff” systems (with initial solid weight being lower than<br />
the yield stress), on the other hand, no consolidation occurred<br />
in the initial stage <strong>of</strong> experiments.<br />
We consider the cases at φ0 >φgwith all particles in the initial<br />
suspension physically contact with each other and form a network<br />
matrix. Figure 1a represents the one-dimensional sedimentation<br />
process with the purely elastic sediment, in which z = 0<br />
denotes the bottom and z = h0 represents the slurry surface.<br />
Since the transmission <strong>of</strong> solid pressure through the network the<br />
sediment would continuously yield at the beginning <strong>of</strong> the test.<br />
Restated, no portion <strong>of</strong> the sediment could be kept at φ0 while no<br />
SEDIMENTATION OF SLURRIES 179<br />
constant-φ0 regime could be noticeable in the sediment. Moreover,<br />
the solids fraction in the final sediment should be <strong>of</strong> a continuously<br />
varying manner with no apparent constant-φ0 regime<br />
(like Fig. 1a). For a purely plastic sediment with a finite yield<br />
stress, on the other hand, even at φ0 >φg the sediment would<br />
not deform if the local solid pressure has not exceeded Py(φ0).<br />
Therefore, a constant-φ0 regime could persist during settling<br />
(Fig. 1b). The final, equilibrated sediment would also possess<br />
the constant-φ0 regime (like Fig. 1b). The batch sedimentation<br />
tests <strong>of</strong> high-φ0 slurries could therefore provide the information<br />
on the validity <strong>of</strong> the above-mentioned model frameworks.<br />
This work employed the computerized axial tomography<br />
scanner (CATSCAN) for investigating the batch-settling behavior<br />
<strong>of</strong> kaolin slurry and UK ball clay slurry, particularly on the<br />
effects <strong>of</strong> φ0. We first demonstrated that, since the two investigated<br />
slurries exhibit a blurred supernatant–sediment interface<br />
due to marked back-diffusion effect, the determination <strong>of</strong> their<br />
φg values were made through an averaging procedure. Then, we<br />
revealed the feasibility <strong>of</strong> using the purely elastic or the purely<br />
plastic constitutive models to interpret the obtained sedimentation<br />
data.<br />
EXPERIMENTAL<br />
Samples<br />
Kaolin slurries and UK ball clay slurries were prepared by<br />
mixing fixed amount <strong>of</strong> powders with 0.1 M NaClO4 solution<br />
in distilled water to provide a high ionic strength to prevent the<br />
interference <strong>of</strong> other ions that might be released from the particle<br />
surfaces. The pH values were fixed at 7.0. The particle<br />
size distribution <strong>of</strong> slurry was determined by a Sedigraph<br />
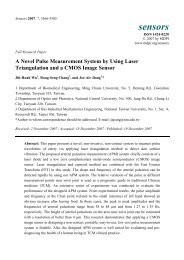
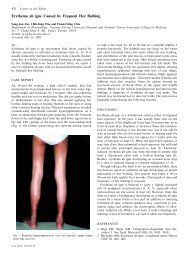
FIG. 2. The relationship between CT number and solids fraction in kaolin<br />
and clay slurries.
180 CHU ET AL.<br />
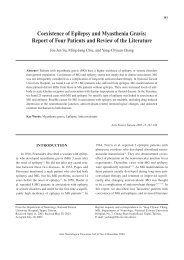
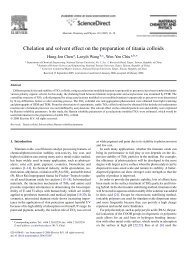
FIG. 3. The time evolutions <strong>of</strong> solids fraction for kaolin slurries. (a) φ0 = 0.01; (b) φ0 = 0.05; (c) φ0 = 0.08; (d) φ0 = 0.12; (e) φ0 = 0.15.<br />
5100 C (Micromeritics), giving a mean diameter <strong>of</strong> 6.3 µm<br />
for kaolin slurry and 2.5 µm for clay slurry. An Accupyc Pycometer<br />
1330 (Micromeritics) measured the true solid density.<br />
The results are 2730 kg/m3 for kaolin powders and<br />
2580 kg/m3 for ball clay powders. The Zetasizer 2000 (MAR-<br />
LVERN) measured the ζ -potentials <strong>of</strong> suspension. The results<br />
are −17.7 mV for kaolin slurry and −22.1 mV for clay slurry.<br />
CATSCAN<br />
<strong>Batch</strong> settling experiments were conducted in a settling cylinder<br />
that had a height <strong>of</strong> 20 cm and a diameter <strong>of</strong> 9.5 cm, and<br />
were continuously monitored with the CATSCAN (DeltaScan<br />
2060; 100 kV, 75 mA). The X-ray attenuations, which are normally<br />
presented as dimensionless scale, the CT number (35),<br />
could be obtained from a horizontal section. Bergstrom (18)<br />
adopted similar procedures using their γ -ray apparatus. Preliminary<br />
tests revealed that the CT number for the 0.1 M NaClO4<br />
solution is essentially zero since the dissolved salts do not absorb<br />
a significant amount <strong>of</strong> X-ray. Furthermore, the correlations between<br />
CT number and the solids fraction are noted for the kaolin<br />
and clay slurries, as demonstrated in Fig. 2. The uncertainties in<br />
axial position measurement and the local solid volume fraction
FIG. 3—Continued<br />
were 2.5 mm and 0.1%, respectively, which are close to those<br />
reported in Auzerais et al. (17).<br />
TIME EVOLUTIONS<br />
Figures 3 and 4 depict the spatio-temporal evolutions <strong>of</strong> crosssectional<br />
average solids fraction measured for kaolin and clay<br />
slurries during the first 6000 s and those at equilibrium. The<br />
mean solids fraction is interpreted as follows:<br />
φmea =<br />
h0<br />
0<br />
φ dz<br />
, [3]<br />
where h0 is 20 cm, the height <strong>of</strong> the slurry. The calculated φmea<br />
data all range from 0.98 to 1.03φ0, which partially support the<br />
accuracy <strong>of</strong> the solids fraction distributions presented in Figs. 3<br />
and 4.<br />
For both slurries, the settling rates decrease substantially with<br />
increasing φ0, while the effects are more significant for the<br />
clay slurries than for the kaolin slurries. For all slurries initially<br />
at φ0, a sediment layer appears at the tube bottom during<br />
settling, while a constant-concentration regime at φ0 retains<br />
above this layer regardless <strong>of</strong> the range <strong>of</strong> φ0. The basic characteristics<br />
<strong>of</strong> settling are similar for slurries at φ0 >φgto those<br />
at φ0 0.08, the particles in the present slurries<br />
would physically contact each other and the whole slurry<br />
should be regarded as the sediment body at the start <strong>of</strong> the<br />
test.<br />
The experimental range (0.01–0.15) has covered both the<br />
φ0 φg cases. Hence, the existence <strong>of</strong> the<br />
constant-φ0 regime in Figs. 3 and 4 represents the yield stress<br />
l0
182 CHU ET AL.<br />
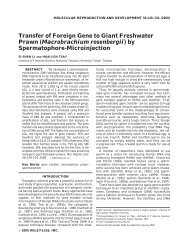
FIG. 4. The time evolutions <strong>of</strong> solids fraction for clay slurries. (a) φ0 = 0.02; (b) φ0 = 0.05; (c) φ0 = 0.08; (d) φ0 = 0.12; (e) φ0 = 0.15.<br />
<strong>of</strong> the settling sediment, thereby supporting the purely plastic<br />
model by Buscall and White (15). As settling proceeds, the<br />
constant-φ0 regime in Figs. 3 and 4 gradually shrinks, accompanied<br />
by the expansion <strong>of</strong> the supernatant and sediment zones.<br />
Equilibrium could be reached at settling time ranging from 48 h<br />
to 1 week, depending on the slurry species and the φ0. Itisnoticeable<br />
that the final sediment exhibits no constant-φ0 regime.<br />
This observation, on the other hand, favors the purely elastic<br />
model by Tiller and Leu (10). Shen et al. (19) also questioned<br />
the existence <strong>of</strong> the yield stress. Apparently neither the<br />
purely elastic nor the purely plastic constitutive equations could<br />
satisfactorily interpret the whole range <strong>of</strong> sedimentation process.<br />
At the start <strong>of</strong> the high-φ0 tests a network <strong>of</strong> finite yield<br />
stress apparently exists. However, this structure seems degraded<br />
continuously at the bottom <strong>of</strong> the constant-φ0 regime, evidenced<br />
by the increasing Lc values in Figs. 3 and 4.<br />
FINAL SEDIMENT<br />
As Fig. 3 demonstrates, the equilibrated solids fractions for<br />
kaolin slurries at bottom are all around 0.2 regardless <strong>of</strong> their φ0<br />
values, indicating that the kaolin slurry is not very compressible
FIG. 4—Continued<br />
to the applied compressive pressure. On the other hand, clay<br />
slurries could be compacted more readily to form the sediment<br />
<strong>of</strong> higher solids fraction when φ0 increases (for instance, as<br />
depicted in Figs. 4a– 4e, at 6000 s φ = 0.28 and 0.34 for φ0 =<br />
0.02 and 0.15, respectively). Restated, the clay sediment is more<br />
compressible than is the kaolin sediment.<br />
Quantitative evaluation <strong>of</strong> sediment compressibility requires<br />
the local solid pressure data for the slurries. At equilibrium, the<br />
solid pressure gradient could be stated as follows:<br />
∂ PS<br />
=−ρgφ, [5]<br />
∂t<br />
where ρ is the density difference between the solid and liquid.<br />
Hence, the local solid pressure at height z is expressed as follows:<br />
PS = ρg<br />
0<br />
The solid pressure at bottom (PS|z=0) could be estimated<br />
based on the solids fraction data in Fig. 5 and Eq. [6] with<br />
z = 0. Figures 6a and 6b also represent the estimated PS|z=0<br />
data as functions <strong>of</strong> φ0. All PS|z=0 data at equilibrium are proportional<br />
to φ0, or are equal to the buoyant weight <strong>of</strong> the solid<br />
particles. This also confirms the accuracy <strong>of</strong> the present experimental<br />
measurement.<br />
Local solid pressure data could be evaluated based on Eq. [6].<br />
Figures 7a and 7b illustrate the φ versus PS curves in the final<br />
sediment. Despite certain data scattering, the local solids fraction<br />
decreases continuously with increasing φ0 at some fixed<br />
effective pressure. Comparisons between clay and kaolin slurries<br />
reveal that the former exhibits a more compressible structure<br />
than is the latter.<br />
z<br />
SEDIMENTATION OF SLURRIES 183<br />
φ dz. [6]<br />
The local structure in the sediment would be degraded owing<br />
to gravity consolidation to a level counterbalancing the corresponding<br />
yield stress. Therefore, the φ − PS curves in Fig. 7<br />
represent the φ – Py(φ) correlations. As Fig. 7 reveals, the sediment<br />
yields more readily at the low solids fraction regime than<br />
the high regime. The sediment was consolidated from the gel<br />
point to around 12–15% at a pressure less than 1–2 Pa. At a<br />
higher pressure, the sediment yields more slowly with the applied<br />
pressure. For instance, for kaolin slurry at φ0 = 15% the<br />
solids fraction increases from 15 to 20% over a pressure up to<br />
FIG. 5. The solids fraction distributions in equilibrated sediments.<br />
(a) Kaolin slurry, and (b) clay slurry. Black circles denote the corresponding<br />
null-stress solid fractions.
184 CHU ET AL.<br />
400 Pa. In fact, the structure <strong>of</strong> the final sediment at high φ0<br />
would depend only weakly on the applied pressure.<br />
Empirical equations could correlate the φ − PS curves in<br />
Fig. 7. Here we employ Eq. [1] in sample calculations since<br />
the fitting could be achieved using graphical method proposed<br />
by (10). The obtained parameters according to the graphical<br />
method were adopted as the initial guess to nonlinear regression<br />
<strong>of</strong> Eq. [1] with the experimental data. Table 1 lists the obtained<br />
results. The parameter P0 is rather low, generally around or less<br />
than 1 Pa, indicating that these slurries would largely deform at<br />
the low-pressure regime. Also, the β values are lesser for clay<br />
slurries than those for the kaolin slurries, stating that the former<br />
is more compressible than the latter. Finally, the higher φ0 would<br />
yield the lower P0 and β. Restated, the slurry with a high initial<br />
FIG. 6. The null-stress solids fraction φg, average solids fraction φav in<br />
sediment, and solid pressure at bottom PS|z=0 at different φ0; (a) kaolin slurry<br />
and (b) clay slurry.<br />
FIG. 7. The solids fraction distributions in sediment versus solid pressure<br />
at different φ0: (a) kaolin slurry, and (b) clay slurry.<br />
solid concentration would deform quickly at the low solid pressure,<br />
but would resist more readily the external applied pressure<br />
at a greater solid pressure. Therefore, in the practical regime the<br />
high-φ0 systems would pack more readily when initially form,<br />
but become rather “stiff” owing to the associated large yield<br />
stress.<br />
CONSOLIDATING SEDIMENT<br />
For demonstrating the sediment compaction effects, only the<br />
portion <strong>of</strong> sediment with φ>φgwould be herein considered.
TABLE 1<br />
Model Parameters Obtained in This Work<br />
φ0 φg U0K (φ0) (m/s) Pv (Pa) P0 (Pa) β<br />
0.01 0.089<br />
Kaolin slurries<br />
NA NA 1.60 0.30<br />
0.05 0.094 NA NA 0.80 0.15<br />
0.08 0.067 8.49 × 10⁻⁵ 207 0.50 0.18<br />
0.12 0.070 6.77 × 10⁻⁵ 377 0.50 0.15<br />
0.15 0.100 6.13 × 10⁻⁵ 448 0.90 0.10<br />
UK ball clay slurries<br />
0.02 0.079 NA NA 1.20 0.35<br />
0.05 0.094 NA NA 1.05 0.25<br />
0.08 0.083 1.36 × 10⁻⁴ 96 0.40 0.20<br />
0.12 0.077 1.11 × 10⁻⁴ 324 0.65 0.23<br />
0.15 0.082 1.01 × 10⁻⁴ 432 0.37 0.70<br />
The solid velocity <strong>of</strong> sediment at φ0 by Landman and Russel<br />
(38) is stated as follows:<br />
uS(φ0) =− dy<br />
dt =−U0K(φ0)<br />
<br />
1− ∂PS/∂z<br />
<br />
ρgφ0<br />
<br />
<br />
Py(φ0)<br />
=−U0K(φ0) 1−<br />
, [7]<br />
ρgφ0 (y − L c)<br />
where U0 is the terminal velocity <strong>of</strong> individual particle; K is the<br />
hindered factor; ρ, the density difference between the solids<br />
and the liquid; g, the gravitational acceleration; y, the upper<br />
interfacial height where φ = φ0; and Lc, the height where φ<br />
deviates from φ0 (19). Equation [5] is valid for the consolidating<br />
sediment with φ>φ0. A regime <strong>of</strong> constant φ0 is assumed to<br />
FIG. 8. Plot <strong>of</strong> dy/dt vs 1/(y − Lc) <strong>of</strong> the slurries with φ0 higher than φg.<br />
SEDIMENTATION OF SLURRIES 185<br />
exist in the consolidating sediment over the range <strong>of</strong> z = y,<br />
where PS = 0toz=Lc, where PS = Py(φ0). Hence, the plot<br />
with dy/dt versus 1/(y − Lc) estimates the U0K and Py at φ =<br />
φ0 with linear regression analysis.<br />
The investigated slurries possess a blurred suspension, while<br />
the solid pressure accumulated at yg, where φ = φg. Therefore,<br />
Eq. [5] needs correction as follows:<br />
dy<br />
dt = U0K<br />
<br />
(φ0) 1 − Py(φ0)<br />
<br />
− Pg<br />
, [8]<br />
ρgφ0(y − L c)<br />
where Pg is the accumulated solid pressure at y and could be<br />
approximated as<br />
Pg = PS|z=y ≈ ρg<br />
<br />
yg<br />
y<br />
φ dz. [9]<br />
If Eq. [8] were valid for describing the dynamics <strong>of</strong> the consolidating<br />
sediment, the curves for dy/dt versus 1/(y − Lc) data<br />
should reveal a linear character. Figure 8 shows some dy/dt versus<br />
1/(y − Lc) data sets <strong>of</strong> φ0 >φgtests. Apparently the curves<br />
in Fig. 8 reveal a linear relation during early stage <strong>of</strong> settling. For<br />
instance, for kaolin slurry at φ0 = 8%, Eq. [1] could describe<br />
the consolidation at testing time less than 1000 s. After the initial<br />
stage the settling becomes very slow (very small dy/dt)<br />
while the linear relationship breaks down. This observation corresponds<br />
to the observation by Shen et al. (1994). The yield<br />
stress <strong>of</strong> the investigated slurries could not sustain the integrity<br />
<strong>of</strong> the constant-φ0 regime which deteriorates continuously with<br />
time.<br />
Table 1 lists the best-fit Py(φ0) and U0K (φ0) for the investigated<br />
slurries in their regimes. For both slurries Py increased<br />
and U0K decreased with increasing φ0. At the same φ0 kaolin<br />
slurries have the higher Py but the lower U0K than the ball<br />
clay slurries. Therefore the kaolin slurries are “stiffer” than the<br />
clay slurries. This observation corresponds to the greater β values<br />
for the clay slurries in Table 1 when compared with the<br />
kaolin slurries. This plastic characteristic apparently degrades<br />
in the subsequent settling stage. The dy/dt versus 1/(y − Lc)<br />
data deviate from the linear regime at t > 1000 s.<br />
CONCLUSIONS<br />
This study utilized a CATSCAN to measure the spatiotemporal<br />
distributions <strong>of</strong> solids fraction for kaolin and clay slurries<br />
at various initial solid concentrations, φ0s. The CATSCAN<br />
could not directly measure the null-stress solids fraction (φg)<br />
for the investigated slurries, whose values are estimated using<br />
an averaging technique to all around 0.07–0.08, regardless <strong>of</strong><br />
the φ0.<br />
The experimental range <strong>of</strong> φ0 (0.01–0.15) has covered both<br />
the φ0 φgcases. The basic settling characteristics<br />
are similar for slurries with φ0 >φgand vice versa. A constantφ0<br />
regime is noted for both cases, beneath which a sediment
186 CHU ET AL.<br />
layer forms. There existed a finite yield stress <strong>of</strong> the settling<br />
sediment indicating that the investigated sediments are plastic<br />
fluids. However, the final sediment equilibrated with gravity exhibited<br />
no constant-φ0 regime, which indicated purely elastic<br />
sediment. The network structure in the slurries degrades gradually<br />
in the settling process.<br />
The model parameters <strong>of</strong> the theory by Buscall and White<br />
were regressed from the consolidating sediment data, while<br />
those by Tiller and Leu were obtained using the final sediment<br />
data. Both results indicate that the clay slurries are more compressible<br />
than the kaolin slurries. The higher initial solids fraction<br />
would also yield a “stiffer” sediment.<br />
ACKNOWLEDGMENTS<br />
The authors acknowledge support for this work from National Science Council,<br />
ROC. The assistance from Pr<strong>of</strong>. F. M. Tiller and Dr. Wenping Li <strong>of</strong> University<br />
<strong>of</strong> Houston to CATSCAN experiments is highly appreciated.<br />
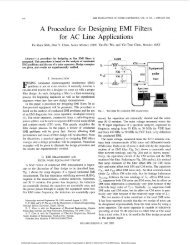
REFERENCES<br />
1. Coe, H. S., and Clevenger, G. H., Trans. Am. Inst. Min. Eng. 55, 356 (1916).<br />
2. Kynch, G. J., Trans. Faraday Soc. 44, 166 (1952).<br />
3. Talmadge, W. P., and Fitch, E. B., Ind. Eng. Chem. 47, 38 (1955).<br />
4. Tiller, F. M., AIChE J. 27, 823 (1981).<br />
5. Fitch, B., AIChE J. 29, 940 (1983).<br />
6. Font, R., AIChE J. 34, 229 (1988).<br />
7. Font, R., Chem. Eng. Sci. 46, 2473 (1991).<br />
8. Koenders, M. A., and Wakeman, R. J., Chem. Eng. Sci. 51, 3897 (1996).<br />
9. Landman, K. A., Buscall, R., and White, L. R., AIChE J. 34, 239<br />
(1988).<br />
10. Tiller, F. M., and Leu, W. F., J. Chin. Inst. Chem. Eng. 11, 61 (1980).<br />
11. Lee, D. J., and Wang, C. H., Water Res. 34, 1 (2000).<br />
12. Kos, P., Chem. Eng. Prog. 73, 99 (1997).<br />
13. Shirato, M., Murase, T., Tokunaga, A., and Yamada, O., J. Chem. Eng. Jpn.<br />
7, 229 (1974).<br />
14. Tien, C., Bai, R., and Ramarao, B. V., AIChE J. 43, 33 (1997).<br />
15. Buscall, R., and White, L. R., J. Chem. Soc., Faraday Trans. 83, 873 (1987).<br />
16. Auzerais, F. M., Jackson, R., and Russel, W. B., J. Fluid Mech. 195, 437<br />
(1988).<br />
17. Auzerais, F. M., Jackson, R., Russel, W. B., and Murphy, W. F., J. Fluid<br />
Mech. 221, 613 (1990).<br />
18. Bergstrom, L., J. Chem Soc., Faraday Trans. 88, 3201 (1992).<br />
19. Shen, C., Russel, W. B., and Auzerais, F. M., AIChE J. 40, 1876 (1994).<br />
20. Johnson, S. B., Scales, P. J., Dixon, D. R., and Pascoe, M., Water Res. 34,<br />
288 (2000).<br />
21. Aziz, A. A. A., de Kretser, R. G., Dixon, D. R., and Scales, P. J., Water Sci.<br />
Technol. 41, 9 (2000).<br />
22. Tiller, F. M., and Khatib, Z., J. Colloid Interface Sci. 100, 55 (1984).<br />
23. Lu, W. M., Huang, Y. P., and Hwang, K. J., Sep. Purif. Technol. 13, 9 (1998).<br />
24. Shin, B. S., and Dick, R. I., J. Environ. Eng. ASCE 106, 505 (1980).<br />
25. La Heij, E. J., Kerkh<strong>of</strong>, P. J. A. M., Kopinga, K., and Pel, K., AIChE J. 42,<br />
953 (1996).<br />
26. Chang, D., Lee, T., Jang, Y., Kim, M., and Lee, S., Powder Technol. 92, 81<br />
(1997).<br />
27. Friedmann, T., and Windhab, E. J., Sep. Sci. Technol. 33, 2221 (1998).<br />
28. Bierck, B. R., Wells, S. A., and Dick, R. I., J. Water Pollut. Control Fed.<br />
60, 645 (1988).<br />
29. David, K. E., Russel, W. B., and Glantschnig, W. J., Science 245, 507 (1989).<br />
30. Bierck, B. R., and Dick, R. I., Water Sci. Technol. 22, 125 (1990).<br />
31. Bierck, B. R., and Dick, R. I., J. Environ. Eng. ASCE 116, 663 (1990).<br />
32. Tiller, F. M., and Yeh, C. S., Sep. Filtr. 27, 123 (1990).<br />
33. Tiller, F. M., Hsung, N. B., and Cong, D. Z., AIChE J. 41, 1153 (1995).<br />
34. Buscall, R., Colloids Surf. 43, 33 (1990).<br />
35. Hounsfield, G. N., British Patent 1,283,915, London, UK (1972).<br />
36. Michaels, A. A., and Bolger, J. C., Ind. Eng. Chem. Fundam. 1, 24<br />
(1962).<br />
37. David, K. E., and Russel, W. B., Phys. Fluids A 1, 82 (1989).<br />
38. Landman, K. A., and Rusel, W. B., Phys. Fluids A 5, 550 (1993).