Shark aggregation in coastal waters of British Columbia.
Shark aggregation in coastal waters of British Columbia.
Shark aggregation in coastal waters of British Columbia.

You also want an ePaper? Increase the reach of your titles
YUMPU automatically turns print PDFs into web optimized ePapers that Google loves.
Vol. 414: 249–256, 2010<br />
doi: 10.3354/meps08718<br />
INTRODUCTION<br />
<strong>Shark</strong> populations <strong>in</strong> Canada’s Pacific <strong>waters</strong> are<br />
poorly understood, and <strong>in</strong>formation on their population<br />
size and status is required to understand the role <strong>of</strong> top<br />
predators <strong>in</strong> mar<strong>in</strong>e ecosystems and to <strong>in</strong>form conservation<br />
and management efforts. Status assessments<br />
have not been pursued <strong>in</strong> Canada for many species due<br />
to <strong>in</strong>sufficient <strong>in</strong>formation. On a global scale, salmon<br />
sharks Lamna ditropis are considered ‘data deficient’<br />
by the International Union for Conservation <strong>of</strong> Nature<br />
(IUCN), and blue sharks Prionace glauca are currently<br />
listed as ‘near threatened’ due to large numbers be<strong>in</strong>g<br />
*Email: r.williams@fisheries.ubc.ca<br />
MARINE ECOLOGY PROGRESS SERIES<br />
Mar Ecol Prog Ser<br />
<strong>Shark</strong> <strong>aggregation</strong> <strong>in</strong> <strong>coastal</strong> <strong>waters</strong> <strong>of</strong><br />
<strong>British</strong> <strong>Columbia</strong><br />
Published September 13<br />
Rob Williams 1, 2, *, Thomas A. Okey 3, 4 , S. Scott Wallace 5 , V<strong>in</strong>cent F. Gallucci 6<br />
1Mar<strong>in</strong>e Mammal Research Unit, Room 247, AERL, 2202 Ma<strong>in</strong> Mall, University <strong>of</strong> <strong>British</strong> <strong>Columbia</strong>, Vancouver,<br />
<strong>British</strong> <strong>Columbia</strong> V6T 1Z4, Canada<br />
2The Henry M. Jackson School <strong>of</strong> International Studies, University <strong>of</strong> Wash<strong>in</strong>gton, Box 353650, Seattle, Wash<strong>in</strong>gton 98195-3650, USA<br />
3School <strong>of</strong> Environmental Studies, University <strong>of</strong> Victoria, PO Box 3060 STN CSC, Victoria, <strong>British</strong> <strong>Columbia</strong> V8W 3R4, Canada<br />
4West Coast Aquatic, #3 4310 10th Avenue, Port Alberni, <strong>British</strong> <strong>Columbia</strong> V9Y 4X4, Canada<br />
5David Suzuki Foundation, 2211 West 4th Avenue, Vancouver, <strong>British</strong> <strong>Columbia</strong> V6K 4S2, Canada<br />
6School <strong>of</strong> Aquatic and Fishery Sciences, University <strong>of</strong> Wash<strong>in</strong>gton, Box 355020, Seattle, Wash<strong>in</strong>gton 98195-5020, USA<br />
ABSTRACT: A concentration <strong>of</strong> pelagic sharks was observed <strong>in</strong> an area <strong>of</strong> western Queen Charlotte<br />
Sound, <strong>British</strong> <strong>Columbia</strong>, dur<strong>in</strong>g systematic shipboard l<strong>in</strong>e-transect surveys conducted (2004 to 2006)<br />
for mar<strong>in</strong>e mammals throughout <strong>coastal</strong> <strong>waters</strong> <strong>of</strong> <strong>British</strong> <strong>Columbia</strong>. Surveys allowed only brief<br />
observations <strong>of</strong> sharks at the surface, provid<strong>in</strong>g limited opportunity to confirm species identity.<br />
Observers agreed, however, that salmon sharks Lamna ditropis (Lamnidae) were most common, followed<br />
by blue sharks Prionace glauca (Carcharh<strong>in</strong>idae). Both conventional and model-based distance<br />
sampl<strong>in</strong>g statistical methods produced large abundance estimates (~20 000 sharks <strong>of</strong> all species<br />
comb<strong>in</strong>ed) concentrated with<strong>in</strong> a hotspot encompass<strong>in</strong>g ~10% <strong>of</strong> the survey region. Neither statistical<br />
method accounted for submerged animals, thereby underestimat<strong>in</strong>g abundance. Sight<strong>in</strong>gs were<br />
made <strong>in</strong> summer, correspond<strong>in</strong>g with southern movement <strong>of</strong> pregnant salmon sharks from Alaska.<br />
The previously undocumented high density <strong>of</strong> these pelagic sharks <strong>in</strong> this location has implications<br />
for understand<strong>in</strong>g at-sea mortality <strong>of</strong> return<strong>in</strong>g Pacific salmon Oncorhynchus spp. (Salmonidae) and<br />
for assess<strong>in</strong>g conservation status <strong>of</strong> sharks <strong>in</strong> Canada and beyond. We recommend that a dedicated<br />
Canada-US sight<strong>in</strong>gs and biological sampl<strong>in</strong>g programme be considered, perhaps under the UN<br />
Transboundary Species Fishery programme.<br />
KEY WORDS: Abundance · Density · Distance sampl<strong>in</strong>g · Distribution · Elasmobranch · L<strong>in</strong>e transect ·<br />
Salmon mortality · <strong>Shark</strong> · Spatial model<br />
Resale or republication not permitted without written consent <strong>of</strong> the publisher<br />
caught <strong>in</strong> unmanaged global fisheries (Stevens 2005).<br />
As a generalisation, stock assessments <strong>of</strong> shark populations<br />
are usually not practical except for those few species<br />
for which catch-effort data exist. Risk analyses may<br />
nevertheless be possible (Aires-da-Silva & Gallucci<br />
2007) as a substitute to estimate the probability <strong>of</strong> population<br />
decl<strong>in</strong>es below e.g. 50% <strong>of</strong> pre-exploitation levels<br />
or the estimation <strong>of</strong> a reference po<strong>in</strong>t <strong>of</strong> <strong>in</strong>terest. Estimates<br />
<strong>of</strong> abundance are especially difficult to obta<strong>in</strong><br />
and any <strong>in</strong>formation towards this end is valuable.<br />
Salmon sharks are distributed throughout the subarctic<br />
North Pacific Ocean and north temperate Pacific<br />
Ocean <strong>waters</strong>. They <strong>in</strong>habit the Gulf <strong>of</strong> Alaska and<br />
© Inter-Research 2010 · www.<strong>in</strong>t-res.com
250<br />
even parts <strong>of</strong> the Ber<strong>in</strong>g Sea at least dur<strong>in</strong>g summer<br />
and autumn (Hulbert et al. 2005, Weng et al. 2005,<br />
2008, Okey et al. 2007, Gallucci et al. 2008). Individuals<br />
tagged <strong>in</strong> Alaska dur<strong>in</strong>g July and August migrated<br />
from summer <strong>coastal</strong> habitat (about 60° N latitude)<br />
southward throughout the northeast Pacific Ocean to<br />
about 28° N latitude and as far south as 22° N latitude<br />
near Hawai’i (Hulbert et al. 2005, Weng et al. 2005,<br />
2008), though migration tim<strong>in</strong>g and routes varied considerably.<br />
Northward return apparently occurs dur<strong>in</strong>g<br />
spr<strong>in</strong>g through autumn along the North American<br />
coast via <strong>British</strong> <strong>Columbia</strong> (BC). Tagged migrants were<br />
all female and likely to pup <strong>in</strong> productive <strong>waters</strong> south<br />
<strong>of</strong> the oceanic transition zone (Goldman 2003, Hulbert<br />
et al. 2005, Gallucci et al. 2008), <strong>in</strong>clud<strong>in</strong>g California<br />
<strong>coastal</strong> areas and <strong>of</strong>fshore areas. In California <strong>waters</strong>,<br />
neonates apparently feed and grow for 1 or 2 yr, after<br />
which they beg<strong>in</strong> to travel northward towards <strong>coastal</strong><br />
BC and Alaska. Little is known about this stage <strong>of</strong> the<br />
life cycle or the true distribution <strong>of</strong> pupp<strong>in</strong>g. It is possible<br />
that salmon shark populations have <strong>in</strong>creased <strong>in</strong><br />
recent decades <strong>in</strong> the North Pacific, at least <strong>in</strong> particular<br />
areas (Okey et al. 2007), and they have the potential<br />
to consume large numbers <strong>of</strong> return<strong>in</strong>g Pacific salmon<br />
(Nagasawa 1998, Hulbert & Rice 2002, Hulbert et al.<br />
2005, DeMaddalena et al. 2007, Okey et al. 2007).<br />
Despite the recent open<strong>in</strong>g <strong>of</strong> a recreational salmon<br />
shark fishery <strong>in</strong> Alaska, basic demographic and related<br />
<strong>in</strong>formation about the species is unknown, some <strong>of</strong><br />
which may be more easily or cost-effectively collected<br />
<strong>in</strong> areas <strong>in</strong> which sharks are found reliably <strong>in</strong> high<br />
numbers.<br />
Some BC Coho and Ch<strong>in</strong>ook salmon stocks (Oncorhynchus<br />
kisutch and O. tshawytscha, respectively)<br />
appear to have decl<strong>in</strong>ed relatively suddenly (i.e. s<strong>in</strong>ce<br />
the early 1990s), while stocks <strong>of</strong> these species <strong>in</strong> Wash<strong>in</strong>gton,<br />
Oregon and California have decl<strong>in</strong>ed gradually<br />
(i.e. over an 83 yr time period) (based on catch data <strong>in</strong><br />
Eggers et al. 2005). Sockeye salmon O. nerka have also<br />
recently exhibited signs <strong>of</strong> distress <strong>in</strong> BC; e.g. the sockeye<br />
returns <strong>in</strong> the Fraser River were unexpectedly low<br />
<strong>in</strong> 2009. Explanations for decl<strong>in</strong>es <strong>in</strong> BC salmon stocks<br />
<strong>in</strong>clude changes <strong>in</strong> climate and oceanography (e.g.<br />
BCMWALP 2002, Brodeur et al. 2006, Batt<strong>in</strong> et al.<br />
2007, BCME 2007, Crozier et al. 2008), <strong>in</strong>creased<br />
hatchery production (e.g. Hilborn 1992, NRC 1996,<br />
Waples 1999), <strong>in</strong>creased open-net farm<strong>in</strong>g <strong>of</strong> Atlantic<br />
salmon <strong>in</strong> <strong>coastal</strong> BC and the associated transmission<br />
<strong>of</strong> parasitic salmon lice (e.g. Lepeophtheirus salmonis,<br />
Caligidae) (e.g. Krkosek et al. 2006, 2007), degradation<br />
<strong>of</strong> spawn<strong>in</strong>g habitat, poorly managed fisheries, and <strong>in</strong>creased<br />
predation. A better understand<strong>in</strong>g <strong>of</strong> factors<br />
<strong>in</strong>fluenc<strong>in</strong>g at-sea survival <strong>of</strong> salmon is needed; this is<br />
the central question <strong>of</strong> the ongo<strong>in</strong>g Pacific Ocean Shelf<br />
Track<strong>in</strong>g Project. At-sea predators <strong>of</strong> salmon <strong>in</strong>clude<br />
Mar Ecol Prog Ser 414: 249–256, 2010<br />
mar<strong>in</strong>e mammals and sharks, but predation effects<br />
have received relatively little attention due to the<br />
challenges <strong>in</strong> study<strong>in</strong>g them (Groot & Margolis 1991).<br />
A systematic, shipboard, sight<strong>in</strong>gs survey was<br />
designed (Thomas et al. 2007) and conducted<br />
(Williams & Thomas 2007) to estimate summertime<br />
abundance and distribution <strong>of</strong> mar<strong>in</strong>e mammals <strong>in</strong><br />
<strong>coastal</strong> <strong>waters</strong> <strong>of</strong> <strong>British</strong> <strong>Columbia</strong>. L<strong>in</strong>e-transect surveys<br />
are widely used to estimate abundance <strong>of</strong> wildlife<br />
(Buckland et al. 2001), and have been used recently to<br />
estimate abundance <strong>of</strong> bask<strong>in</strong>g sharks Cetorh<strong>in</strong>us<br />
maximus <strong>of</strong>f Canada’s Atlantic coast to <strong>in</strong>form a conservation<br />
status assessment for the species (Campana<br />
et al. 2008). Sight<strong>in</strong>gs <strong>of</strong> sharks were recorded <strong>in</strong> the<br />
BC mar<strong>in</strong>e mammal survey (Williams & Thomas 2007,<br />
2009), but have not been reported previously. Here we<br />
describe an area <strong>of</strong> high shark density identified from<br />
that survey. We present 2 methods for generat<strong>in</strong>g tentative<br />
abundance estimates for sharks from the effort<br />
and sight<strong>in</strong>gs data, and consider hypotheses for this<br />
observed <strong>aggregation</strong> <strong>in</strong>clud<strong>in</strong>g rest<strong>in</strong>g, reproductive<br />
activity and feed<strong>in</strong>g. Improv<strong>in</strong>g our understand<strong>in</strong>g <strong>of</strong><br />
abundance and diet <strong>of</strong> mar<strong>in</strong>e predators, <strong>in</strong>clud<strong>in</strong>g<br />
sharks, is fundamental for conservation and ecosystem-based<br />
management <strong>of</strong> Pacific mar<strong>in</strong>e ecosystems.<br />
MATERIALS AND METHODS<br />
Study design and field methods. Shipboard surveys<br />
for mar<strong>in</strong>e mammals for <strong>coastal</strong> <strong>waters</strong> <strong>of</strong> <strong>British</strong> <strong>Columbia</strong><br />
were conducted dur<strong>in</strong>g the summers <strong>of</strong> 2004 to<br />
2006 and spr<strong>in</strong>g 2007. Field protocols required observers<br />
to record all sight<strong>in</strong>gs <strong>of</strong> sharks. The survey followed<br />
a systematic design, which has been described<br />
previously (Thomas et al. 2007), and observers followed<br />
standard l<strong>in</strong>e-transect survey field protocols (Williams<br />
& Thomas 2007). Unlike mark-recapture methods, distance<br />
sampl<strong>in</strong>g methods make no assumption about the<br />
identity <strong>of</strong> <strong>in</strong>dividuals, but rather estimate the average<br />
number <strong>of</strong> animals <strong>in</strong> the study area at the time the survey<br />
was be<strong>in</strong>g conducted. In the unlikely event that a<br />
shark was seen on 2 transects, it is assumed that there is<br />
an equal probability <strong>of</strong> another shark be<strong>in</strong>g missed on<br />
both transects (Buckland et al. 2001, p. 253; Thomas et<br />
al. 2010).<br />
The survey was completed as planned <strong>in</strong> the summers<br />
<strong>of</strong> 2004 and 2005, but not <strong>in</strong> 2006 due to fund<strong>in</strong>g<br />
constra<strong>in</strong>ts. The survey was also completed <strong>in</strong> May and<br />
June 2007, but no sharks were seen dur<strong>in</strong>g the spr<strong>in</strong>g<br />
survey, and so that season’s effort was excluded from<br />
the analysis. Consequently, the field effort resulted <strong>in</strong> a<br />
‘design-unbiased’ (Buckland et al. 2001) sample for<br />
2004 and 2005, but an unrepresentative sampl<strong>in</strong>g design<br />
for 2006. Consequently, (1) a conventional distance
sampl<strong>in</strong>g (Buckland et al. 2001) estimate is reported for<br />
the summers <strong>of</strong> 2004 and 2005, while (2) a model-based<br />
abundance estimator us<strong>in</strong>g generalised additive models<br />
(GAMs; Williams et al. 2006) was used to estimate<br />
mean abundance dur<strong>in</strong>g the summers <strong>of</strong> 2004 to 2006<br />
<strong>in</strong>clusive. These 2 statistical approaches are referred to<br />
subsequently as ‘conventional’ and ‘model-based’<br />
abundance estimators. Search effort (trackl<strong>in</strong>e covered)<br />
and sight<strong>in</strong>g locations used <strong>in</strong> the analyses (i.e. those<br />
from the summers <strong>of</strong> 2004 to 2006) are shown <strong>in</strong> Fig. 1.<br />
Note that the term ‘Queen Charlotte Bas<strong>in</strong>’ refers to the<br />
broad region from northern Vancouver Island to the<br />
northern extent <strong>of</strong> our study area and is based on<br />
shared geological features, but also refers to the stratum<br />
<strong>of</strong> the same name <strong>in</strong> the orig<strong>in</strong>al survey design<br />
(Thomas et al. 2007). With<strong>in</strong> the wider Queen Charlotte<br />
Bas<strong>in</strong>, there is an open body <strong>of</strong> water called Queen<br />
Charlotte Sound, between northern Vancouver Island<br />
and southern Haida Gwaii (see Fig. 1).<br />
The observation team consisted <strong>of</strong> 2 observers stand<strong>in</strong>g<br />
on a ship with b<strong>in</strong>oculars scann<strong>in</strong>g at 90° on either<br />
side <strong>of</strong> the ship’s bow and a data recorder. When a sight<strong>in</strong>g<br />
was made, the observer and data recorder noted<br />
radial distance, radial angle (measured us<strong>in</strong>g angle<br />
boards), time, location, species or detailed comments<br />
about dist<strong>in</strong>guish<strong>in</strong>g features, and number <strong>of</strong> sharks. Radial<br />
distance estimates were corrected us<strong>in</strong>g correction<br />
factors calculated from observer-specific distance estimation<br />
experiments, <strong>in</strong> which observers’ judged distances<br />
were regressed on true distances (Williams &<br />
Thomas 2007, Williams et al. 2007).<br />
Analysis <strong>of</strong> l<strong>in</strong>e-transect survey data. Distance sampl<strong>in</strong>g<br />
methods estimate density <strong>of</strong> animals through<br />
estimation <strong>of</strong> the strip width covered along a transect<br />
l<strong>in</strong>e (Buckland et al. 2001). Perpendicular distance<br />
data were right-truncated by 5 to 10%, and 2 standard<br />
detection function models (Buckland et al. 2001) were<br />
fitted to the data us<strong>in</strong>g the s<strong>of</strong>tware Distance 6.0<br />
(Thomas et al. 2010). Animal density ( ˆD , the number <strong>of</strong><br />
animals per unit area) was estimated by<br />
^<br />
(1)<br />
where: n is the number <strong>of</strong> schools observed with<strong>in</strong><br />
truncation distance <strong>of</strong> the trackl<strong>in</strong>e; ƒ ^ ˆ n ⋅ ƒ( 0)<br />
⋅Eˆ<br />
() s<br />
D =<br />
2L<br />
(0) is the estimated<br />
probability density function <strong>of</strong> perpendicular<br />
distances, evaluated at zero distance (and is the reciprocal<br />
<strong>of</strong> the effective strip half-width); Ê(s) is the estimated<br />
mean school size; and L is the total length <strong>of</strong><br />
trackl<strong>in</strong>e.<br />
The 2 candidate models for the detection function<br />
were the half-normal and hazard-rate models (Buckland<br />
et al. 2001). The half-normal function (Eq. 2) models<br />
the probability <strong>of</strong> detect<strong>in</strong>g an animal (or school) at<br />
perpendicular distance x as:<br />
Williams et al.: Summertime shark <strong>aggregation</strong> <strong>in</strong> BC <strong>waters</strong><br />
251<br />
(2)<br />
where σ2 is a parameter to be estimated. The hazard<br />
rate function (Eq. 3) models the probability <strong>of</strong> detect<strong>in</strong>g<br />
an animal at perpendicular distance x as:<br />
(3)<br />
where θ1 and θ2 are parameters to be estimated.<br />
In the conventional distance-sampl<strong>in</strong>g analysis,<br />
survey design <strong>in</strong> 2004 and 2005 ensured that shark<br />
density measured along a grid <strong>of</strong> transects was representative<br />
<strong>of</strong> that <strong>in</strong> the study area as a whole. For completeness<br />
and for comparison with density estimates<br />
for other taxa (Williams & Thomas 2007), density was<br />
calculated both <strong>in</strong> Queen Charlotte Bas<strong>in</strong> (the stratum<br />
<strong>in</strong> which all shark sight<strong>in</strong>gs were made), and <strong>in</strong> the<br />
south coast and ma<strong>in</strong>land <strong>in</strong>let <strong>waters</strong>, which were surveyed<br />
but did not yield any sight<strong>in</strong>gs.<br />
In the model-based analysis, a spatially explicit<br />
model was used to account for the non-systematic<br />
placement <strong>of</strong> trackl<strong>in</strong>es surveyed <strong>in</strong> 2006 us<strong>in</strong>g methods<br />
described previously (Hedley et al. 1999, Williams<br />
et al. 2006). A descriptive GAM was constructed from<br />
effort and sight<strong>in</strong>gs data; the model was used to predict<br />
shark density at each spatial location <strong>in</strong> the survey<br />
region, and numerical <strong>in</strong>tegration <strong>of</strong> the density estimates<br />
provided an estimate <strong>of</strong> total shark abundance.<br />
Effort and sight<strong>in</strong>gs data were modelled us<strong>in</strong>g the<br />
‘count’ method for <strong>in</strong>terpolat<strong>in</strong>g density between<br />
trackl<strong>in</strong>es (Hedley et al. 1999), <strong>in</strong> which probability <strong>of</strong><br />
encounter<strong>in</strong>g a shark along a 1 nautical mile (nmi) segment<br />
<strong>of</strong> trackl<strong>in</strong>e was modelled as a 2-dimensional<br />
tensor product smooth function <strong>of</strong> latitude and longitude<br />
(Wood 2006), a 1-dimensional smooth spl<strong>in</strong>e <strong>of</strong><br />
water depth, and an <strong>of</strong>fset term for the area effectively<br />
searched <strong>in</strong> each segment. GAMs were fitted us<strong>in</strong>g the<br />
Density Surface Modell<strong>in</strong>g eng<strong>in</strong>e packaged <strong>in</strong> the<br />
program Distance 6.0 (Thomas et al. 2010). The model<br />
framework was <strong>of</strong> the form:<br />
(4)<br />
where: ni is the number <strong>of</strong> detected schools <strong>in</strong> the ith<br />
segment; li is the length <strong>of</strong> the ith segment; wi is the<br />
truncation distance <strong>of</strong> the ith segment; is the estimated<br />
probability <strong>of</strong> detection <strong>of</strong> a school <strong>in</strong> the ith<br />
segment; β0 is a parameter to be estimated; and zik represents<br />
the value <strong>of</strong> the kth explanatory spatial variable<br />
<strong>in</strong> the ith segment, which is a smooth function, ƒk, <strong>of</strong> the explanatory variable.<br />
After fitt<strong>in</strong>g a descriptive model, a gridded (4 nmi2 or<br />
13.7 km2 2 x<br />
px ( ) = exp<br />
⎡ − ⎤<br />
2 ⎣⎢ 2σ ⎦⎥<br />
2 −θ2<br />
⎡ x ⎤<br />
px ( ) = 1−exp⎢−(<br />
) ⎣ θ ⎥<br />
1 ⎦<br />
⎡<br />
E( n ) exp ln l w pˆ i = ( i i i)+ + ƒk<br />
( zik)<br />
⎤<br />
2 β0<br />
∑<br />
⎣⎢<br />
k ⎦⎥<br />
ˆp i<br />
) data set was passed to the descriptive model.<br />
The output <strong>of</strong> the model was a predicted density <strong>of</strong>
252<br />
sharks <strong>in</strong> each grid cell. A nonparametric bootstrap<br />
was performed to comb<strong>in</strong>e the detection function fitt<strong>in</strong>g,<br />
size bias regression, spatial modell<strong>in</strong>g, model<br />
prediction and abundance estimation steps outl<strong>in</strong>ed<br />
above. For the bootstrap analysis, 499 bootstrap resample<br />
data sets were generated by sampl<strong>in</strong>g transect<br />
l<strong>in</strong>es with replacement.<br />
Species identification. After the survey was<br />
completed, 3 observers compared <strong>in</strong>dependently<br />
the descriptions <strong>of</strong> each sight<strong>in</strong>g<br />
recorded <strong>in</strong> the field notes to a published field<br />
guide <strong>of</strong> sharks likely to be found <strong>in</strong> the<br />
region (DeMaddalena et al. 2007). Observers<br />
were <strong>in</strong>structed to pay particular attention to<br />
body size, shape and colour; and at a m<strong>in</strong>imum<br />
to record number, shape and position <strong>of</strong><br />
f<strong>in</strong>s visible at the surface. The dorsal f<strong>in</strong>s <strong>of</strong><br />
the 2 species (salmon shark and blue shark)<br />
are similar <strong>in</strong> size but the salmon shark’s is<br />
bulkier <strong>in</strong> appearance, with a more rounded<br />
high po<strong>in</strong>t, and set forward (more anterior),<br />
closer to the head. The blue shark’s dorsal f<strong>in</strong><br />
is more po<strong>in</strong>ted at the high po<strong>in</strong>t, and set<br />
more over the middle, over the length, closer<br />
to the caudal f<strong>in</strong>. The caudal f<strong>in</strong> <strong>of</strong>ten projects<br />
above the water beh<strong>in</strong>d the dorsal f<strong>in</strong>. Each<br />
sight<strong>in</strong>g was assigned a tentative species<br />
identity. Salmon shark abundance <strong>in</strong> the population<br />
(i.e. study area) was assumed to comprise<br />
the same proportion <strong>of</strong> overall abundance<br />
as its proportion <strong>of</strong> the sample (i.e.<br />
sight<strong>in</strong>g records).<br />
RESULTS<br />
A total <strong>of</strong> 3377 nmi (6254 km) <strong>of</strong> trackl<strong>in</strong>e<br />
was surveyed. Field effort <strong>in</strong>cluded data<br />
collected from: 6 to 21 June and 4 July to<br />
15 August 2004, 1 to 29 August 2005, and 2 to<br />
19 August and 24 to 29 September 2006. A<br />
total <strong>of</strong> 104 shark sight<strong>in</strong>gs were recorded<br />
dur<strong>in</strong>g the survey, which is well above the<br />
60 to 80 sight<strong>in</strong>gs typically recommended for<br />
fitt<strong>in</strong>g a detection function (Buckland et al.<br />
2001). A truncation distance <strong>of</strong> 80 m was<br />
chosen, and AIC (Akaike’s <strong>in</strong>formation criterion)<br />
favoured the hazard rate model (ΔAIC<br />
3.73). Most sight<strong>in</strong>gs were <strong>of</strong> lone animals,<br />
but occasional sight<strong>in</strong>gs <strong>of</strong> 2 animals brought<br />
the mean group size to 1.01 <strong>in</strong>dividuals.<br />
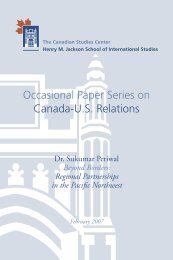
The observed concentration <strong>of</strong> sharks<br />
(Fig. 1) was located at the shelf break over the<br />
heads <strong>of</strong> submar<strong>in</strong>e canyons, such as Moresby<br />
Trough, over adjacent banks <strong>of</strong> western<br />
Mar Ecol Prog Ser 414: 249–256, 2010<br />
Queen Charlotte Sound (i.e. the open-water section <strong>of</strong><br />
the broader Queen Charlotte Bas<strong>in</strong>, between southern<br />
Haida Gwaii and northern Vancouver Island), such as<br />
Goose Banks, and extend<strong>in</strong>g eastward about halfway<br />
across the cont<strong>in</strong>ental shelf towards the numerous<br />
<strong>coastal</strong> fjords surround<strong>in</strong>g Campbell Island and Bella<br />
Bella communities. Two smaller <strong>aggregation</strong>s were<br />
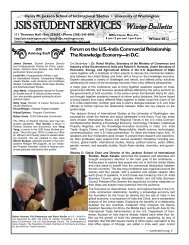
Fig. 1. (a) Search effort (black l<strong>in</strong>e) and shark sight<strong>in</strong>gs (filled grey circles)<br />
dur<strong>in</strong>g 2004 to 2006 surveys. The survey was also repeated <strong>in</strong><br />
spr<strong>in</strong>g 2007, but no sharks were seen. (b) <strong>Shark</strong> density (<strong>in</strong>d. per square<br />
nautical mile) <strong>in</strong> each cell <strong>in</strong> a grid overlaid across the study area, as<br />
predicted from the generalised additive model. Note the highest-density<br />
region (the ‘hotspot’) predicted at the western edge <strong>of</strong> Queen Charlotte<br />
Sound, centred on Moresby Trough
located closer to the <strong>in</strong>ner coastl<strong>in</strong>e <strong>of</strong> central BC<br />
(Fig. 1). The seaward extent <strong>of</strong> this <strong>aggregation</strong> is<br />
unknown, as the survey area did not extend seaward<br />
<strong>of</strong>f the cont<strong>in</strong>ental shelf break.<br />
Abundance estimates <strong>of</strong> sharks <strong>in</strong> the study area are<br />
shown <strong>in</strong> Table 1. The conventional distance-sampl<strong>in</strong>g<br />
method produced an estimate <strong>of</strong> 31 200 sharks at the<br />
surface <strong>in</strong> the entire study area on average dur<strong>in</strong>g the<br />
summer surveys (95% CI: 15 900 to 61 300). The<br />
model-based abundance estimate predicted from the<br />
selected model was 26 900 sharks (95% CI: 19 600 to<br />
37 000). In both cases, the number <strong>of</strong> animals at depth<br />
is not known, as this concentration <strong>of</strong> sharks was <strong>in</strong>dicated<br />
only by surface observations, and consequently<br />
represents a m<strong>in</strong>imum estimate <strong>of</strong> abundance <strong>of</strong> all<br />
surface-oriented sharks <strong>in</strong> the area at the time <strong>of</strong> the<br />
survey. The high-density region (the ‘<strong>aggregation</strong>’)<br />
shown <strong>in</strong> Fig. 1b spanned an area approximately 2500<br />
nmi 2 , thereby cover<strong>in</strong>g approximately 10% <strong>of</strong> the<br />
24 664 nmi 2 survey region.<br />
Approximately 70% <strong>of</strong> sight<strong>in</strong>gs were given a tentative<br />
species identification. Of these, salmon sharks were<br />
the most commonly observed species (63% <strong>of</strong> those<br />
sight<strong>in</strong>gs identified to species), followed by blue sharks<br />
(15% <strong>of</strong> those identified to species). A sight<strong>in</strong>g was typically<br />
scored as a salmon shark when observers recorded<br />
a relatively large dorsal f<strong>in</strong>, or a dark grey dorsal surface<br />
with light ventral surface, or both. Blue sharks were<br />
identified from records not<strong>in</strong>g a dark blue colour and<br />
slender body. The rema<strong>in</strong><strong>in</strong>g observations could not be<br />
identified to species. While there was considerable disagreement<br />
among observers about the identity <strong>of</strong> some<br />
observations, there was broad agreement across observers<br />
that salmon sharks were the dom<strong>in</strong>ant species<br />
sighted, with estimates <strong>of</strong> 50, 68 and 70% <strong>of</strong> sight<strong>in</strong>gs<br />
be<strong>in</strong>g scored as salmon sharks by the 3 observers. Our<br />
best estimate is that 44% <strong>of</strong> the surface-oriented sharks<br />
<strong>in</strong> the study area (i.e. 63% <strong>of</strong> 70%) were salmon sharks,<br />
but the true proportion could be much higher.<br />
Williams et al.: Summertime shark <strong>aggregation</strong> <strong>in</strong> BC <strong>waters</strong><br />
Table 1. Summary <strong>of</strong> density and abundance estimates from conventional and<br />
model-based (generalised additive model) distance-sampl<strong>in</strong>g abundance estimators.<br />
The Queen Charlotte Bas<strong>in</strong> stratum (Fig. 1) is the region common to all<br />
4 surveys (summers <strong>of</strong> 2004 to 2006 and spr<strong>in</strong>g 2007), while the entire survey region<br />
<strong>in</strong>cludes adjacent fjords and south coast <strong>waters</strong> <strong>in</strong> which no sharks were seen.<br />
nmi: nautical miles<br />
Density Abundance 95% CI<br />
(n nmi –2 ) (n) Mean<br />
Conventional distance-sampl<strong>in</strong>g estimate<br />
Queen Charlotte Bas<strong>in</strong>, 2004 0.854 15800 6300–39000<br />
Queen Charlotte Bas<strong>in</strong>, 2005 2.592 47600 22100–102000<br />
Queen Charlotte Bas<strong>in</strong>, 2004–2005 1.701 31200 15900–61200<br />
Survey region, 2004–2005 1.283 31200 15900–61300<br />
Model-based abundance estimate<br />
Survey region, 2004–2006 1.091 26900 19600–37000<br />
DISCUSSION<br />
253<br />
Our data <strong>in</strong>dicate that at least 10 000 pelagic sharks<br />
were concentrated <strong>in</strong> an approximately 2500 nmi 2 section<br />
<strong>of</strong> the Queen Charlotte Bas<strong>in</strong> dur<strong>in</strong>g the summers<br />
<strong>of</strong> 2004 to 2006. Approximately half <strong>of</strong> these were<br />
likely to be salmon sharks, but future dedicated shark<br />
surveys need to be designed specifically to focus on<br />
species identification. In the present survey, which was<br />
designed for mar<strong>in</strong>e mammals, (1) there was strong<br />
<strong>in</strong>ter-observer agreement that salmon sharks were the<br />
most commonly identified shark species, (2) few other<br />
species <strong>of</strong> large pelagic sharks occur <strong>in</strong> the region <strong>in</strong><br />
this way, and (3) those that do are unlikely to be confused<br />
with salmon sharks (DeMaddalena et al. 2007). It<br />
is important to place this new <strong>in</strong>formation <strong>in</strong> the context<br />
<strong>of</strong> the present paper’s primary aim, which is to provide<br />
an estimate <strong>of</strong> the right order <strong>of</strong> magnitude for a<br />
guild <strong>of</strong> predators that has received little scientific<br />
attention <strong>in</strong> this region previously. The distribution<br />
data are as important a f<strong>in</strong>d<strong>in</strong>g as the abundance data.<br />
The abundance estimates are necessarily coarse and<br />
tentative, and are <strong>in</strong>tended only as a start<strong>in</strong>g po<strong>in</strong>t for<br />
sett<strong>in</strong>g priorities for future research efforts. No attempt<br />
was made to correct the abundance estimates for the<br />
proportion <strong>of</strong> time that sharks spend at the surface (cf.<br />
Campana et al. 2008). The number <strong>of</strong> sight<strong>in</strong>gs is<br />
appropriate for generat<strong>in</strong>g an abundance estimate<br />
from l<strong>in</strong>e-transect survey data (Buckland et al. 2001),<br />
but improvement is needed <strong>in</strong> terms <strong>of</strong> apportion<strong>in</strong>g<br />
total abundance by species, and evaluat<strong>in</strong>g how abundance<br />
and distribution change seasonally and annually.<br />
In the meantime, these <strong>in</strong>itial estimates are<br />
reported with some strong caveats about their limitations<br />
and large associated confidence <strong>in</strong>tervals.<br />
Our observations and estimates are <strong>in</strong> l<strong>in</strong>e with other<br />
research results concern<strong>in</strong>g salmon sharks, their<br />
Atlantic congener, the porbeagle shark Lamna nasus,<br />
the Atlantic blue shark Prionaca glauca, and the same<br />
species observed elsewhere <strong>in</strong> the<br />
eastern Pacific. The porbeagle<br />
migration pattern across the North<br />
Atlantic <strong>in</strong>volves ma<strong>in</strong> nursery areas<br />
<strong>in</strong> the eastern North Atlantic, forag<strong>in</strong>g<br />
areas <strong>in</strong> the western North<br />
Atlantic, and movement between<br />
them (Aires-da-Silva & Gallucci<br />
2007). The porbeagle pattern <strong>in</strong> the<br />
western North Atlantic <strong>in</strong>cludes<br />
spr<strong>in</strong>g migration to Georges Bank<br />
and the Gulf <strong>of</strong> Ma<strong>in</strong>e <strong>in</strong> January<br />
and February and movement <strong>in</strong> the<br />
spr<strong>in</strong>g to south Newfoundland<br />
and the Gulf <strong>of</strong> St. Lawrence <strong>in</strong><br />
the autumn. Mat<strong>in</strong>g occurs <strong>in</strong> the
254<br />
autumn and parturition <strong>in</strong> the spr<strong>in</strong>g (Gibson & Campana<br />
2005, Pade et al. 2009). These patterns are consistent<br />
with tagg<strong>in</strong>g data for migratory sharks (Hulbert &<br />
Rice 2002, Hulbert et al. 2005, Weng et al. 2005, 2008,<br />
Okey et al. 2007). No sharks were seen when the survey<br />
was conducted <strong>in</strong> spr<strong>in</strong>g 2007, which lends support<br />
to the notion that this <strong>aggregation</strong> peaks seasonally.<br />
We have no other evidence to <strong>in</strong>dicate that this shark<br />
concentration is present dur<strong>in</strong>g seasons other than<br />
summer and early autumn.<br />
Explanations for this concentration <strong>of</strong> sharks <strong>in</strong>clude<br />
forag<strong>in</strong>g, rest<strong>in</strong>g and reproduction. These sharks may<br />
concentrate <strong>in</strong> this area dur<strong>in</strong>g July and August to<br />
<strong>in</strong>tercept adult salmon on their return migration from<br />
the North Pacific Ocean to natal streams <strong>in</strong> the region.<br />
For <strong>in</strong>stance, salmon return<strong>in</strong>g to the Fraser River—the<br />
largest <strong>of</strong> Canadian salmon runs—use this more<br />
northerly route through Queen Charlotte Sound and<br />
Johnstone Strait dur<strong>in</strong>g times <strong>of</strong> higher-than-normal<br />
sea temperatures (Thomson et al. 1994, Healey 1998),<br />
and they use the more southern route through the<br />
Strait <strong>of</strong> Juan de Fuca when sea temperatures are<br />
colder. Sea temperatures at nearby Stn P have been<br />
<strong>in</strong>creas<strong>in</strong>g s<strong>in</strong>ce the late 1950s (Whitney & Robert<br />
2007), thus mak<strong>in</strong>g it <strong>in</strong>creas<strong>in</strong>gly likely that return<strong>in</strong>g<br />
salmon return consistently through Queen Charlotte<br />
Sound. The position <strong>of</strong> the observed shark concentration<br />
<strong>in</strong> the western Queen Charlotte Sound would<br />
<strong>in</strong>deed be the expected position for <strong>in</strong>tercept<strong>in</strong>g<br />
Pacific salmon as they come onto the cont<strong>in</strong>ental shelf<br />
dur<strong>in</strong>g warm-water regimes. If salmon sharks have<br />
been <strong>in</strong>creas<strong>in</strong>g or concentrat<strong>in</strong>g more <strong>in</strong> the North<br />
Pacific for any one <strong>of</strong> a variety <strong>of</strong> reasons (Okey et al.<br />
2007), and especially dur<strong>in</strong>g the most recent part <strong>of</strong><br />
this overall warm<strong>in</strong>g temperature trend, then it follows<br />
that salmon shark predation may be an <strong>in</strong>creas<strong>in</strong>gly<br />
important source <strong>of</strong> mortality for return<strong>in</strong>g BC salmon<br />
stocks, especially if return routes are consistent and<br />
predictable.<br />
The shark concentration could also be expla<strong>in</strong>ed by<br />
factors that have little to do with salmon, namely the<br />
notion that this area is more productive <strong>in</strong> general than<br />
the adjacent areas surveyed. For example, northern<br />
elephant seals Mirounga angustirostris (Phocidae),<br />
Pacific white-sided dolph<strong>in</strong> Lagenorhynchus obliquidens<br />
(Delph<strong>in</strong>idae) and ocean sunfish Mola mola<br />
(Molidae) were also mostly concentrated <strong>in</strong> this same<br />
general hotspot area, and f<strong>in</strong> whales Balaenoptera<br />
physalus (Balaenopteridae) and humpback whales<br />
Megaptera novaeangliae (Balaenopteridae) were<br />
found <strong>in</strong> high numbers <strong>in</strong> this area as well as at a site<br />
just slightly to the north <strong>of</strong> this area (Williams &<br />
Thomas 2007, R. Williams pers. obs.). The density we<br />
report for sharks <strong>in</strong> the Queen Charlotte Bas<strong>in</strong> is comparable<br />
to that reported previously for Pacific white-<br />
Mar Ecol Prog Ser 414: 249–256, 2010<br />
sided dolph<strong>in</strong>s <strong>in</strong> the area, and for harbour seals Phoca<br />
vitul<strong>in</strong>a <strong>in</strong> BC’s southern Strait <strong>of</strong> Georgia (Williams &<br />
Thomas 2007). Similarly, the density and abundance<br />
estimates presented here are plausible, given those<br />
reported for salmon sharks elsewhere: densities <strong>of</strong> >10<br />
salmon sharks km –2 have been observed <strong>in</strong> Pr<strong>in</strong>ce<br />
William Sound <strong>in</strong> July and August (Hulbert et al. 2005,<br />
V. F. Gallucci pers. obs.) as salmonids return to spawn<strong>in</strong>g<br />
streams. Us<strong>in</strong>g catch per unit effort methods,<br />
Nagasawa (1998) estimated that there were 2 000 000<br />
salmon sharks <strong>in</strong> the entire North Pacific, <strong>in</strong>clud<strong>in</strong>g<br />
94 000 <strong>in</strong> the Gulf <strong>of</strong> Anadyr, 122 000 <strong>in</strong> the western<br />
Ber<strong>in</strong>g Sea and 153 000 <strong>in</strong> southern Okhotsk Sea.<br />
There are a number <strong>of</strong> geographic, hydrographic and<br />
oceanographic <strong>in</strong>terfaces and other features <strong>in</strong> this<br />
area that make it particularly productive and ecologically<br />
unique, and that may support locally high densities<br />
<strong>of</strong> salmon sharks. We consider heightened overall<br />
productivity to be a reasonable alternative to the<br />
salmon-<strong>in</strong>terception explanation for the observed<br />
shark concentration. This productivity explanation still<br />
implies a feed<strong>in</strong>g function <strong>of</strong> this shark <strong>aggregation</strong>,<br />
which has implications for the preferred late summer<br />
prey <strong>of</strong> salmon sharks <strong>in</strong> such <strong>coastal</strong> sett<strong>in</strong>gs, the bulk<br />
<strong>of</strong> which is Pacific salmon species <strong>in</strong> rough proportion<br />
to their local occurrence (Nagasawa 1998, Brodeur et<br />
al. 1999, Hulbert et al. 2005). But salmon sharks also<br />
consume sablefish Anoplopoma fimbria (Anoplopomatidae),<br />
squid (Teuthoidea), rockfishes (Sebastes<br />
spp., Sebastidae), Pacific herr<strong>in</strong>g Clupea pallasii pallasii<br />
(Clupeidae), and other prey (Hulbert et al. 2005),<br />
all <strong>of</strong> which are available <strong>in</strong> the area.<br />
The idea that this location <strong>of</strong> shark concentration represents<br />
a summertime rest<strong>in</strong>g area for migrat<strong>in</strong>g sharks<br />
<strong>of</strong> the northeast Pacific is also consistent with available<br />
evidence (Weng et al. 2005, their Fig. S1B), but it is<br />
known that these sharks actively feed on salmon <strong>in</strong> this<br />
and other northeast Pacific sett<strong>in</strong>gs <strong>in</strong> summer. This<br />
concentration could serve both functions (i.e. rest<strong>in</strong>g<br />
and feed<strong>in</strong>g) if these sharks can reduce their energy expenditure<br />
while prey<strong>in</strong>g upon migrat<strong>in</strong>g salmon. It is<br />
also possible that the observed shark concentration<br />
serves as a mat<strong>in</strong>g <strong>aggregation</strong>, but we know <strong>of</strong> no specific<br />
evidence relat<strong>in</strong>g to this explanation for this area.<br />
Some evidence for recent <strong>in</strong>creases <strong>in</strong> salmon shark<br />
populations <strong>in</strong> the northeast Pacific Ocean were<br />
recently presented with some alternative explanations<br />
for these observed patterns (Okey et al. 2007), <strong>in</strong>clud<strong>in</strong>g<br />
northern distributional shifts due to <strong>in</strong>creases <strong>in</strong><br />
ocean temperatures, population rebound s<strong>in</strong>ce the<br />
1992 bann<strong>in</strong>g <strong>of</strong> high-seas drift gillnets, and <strong>in</strong>direct<br />
effects <strong>of</strong> fisheries on compet<strong>in</strong>g pelagic predators.<br />
These explanations could expla<strong>in</strong> the shark concentration<br />
documented here<strong>in</strong>, but this observed concentration<br />
might not be new. Although local sport-fish<strong>in</strong>g
guides <strong>in</strong>dicate a sudden appearance <strong>of</strong> abundant<br />
salmon sharks, it is possible that it has been a persistent<br />
but unreported feature <strong>of</strong> this area that has gone<br />
undetected.<br />
If this shark concentration is new, it may be an <strong>in</strong>dicator<br />
<strong>of</strong> <strong>in</strong>direct ecological impacts <strong>of</strong> climate variability<br />
or change. A warm<strong>in</strong>g ocean could enable the<br />
development <strong>of</strong> an effective ‘feed<strong>in</strong>g gauntlet’ at the<br />
northern return route for Fraser River salmon, if <strong>in</strong>deed<br />
a warm<strong>in</strong>g ocean climate regime favours the exclusive<br />
use <strong>of</strong> that northern route (e.g. Thomson et al. 1994,<br />
Healey 1998).<br />
<strong>Shark</strong> species are highly diverse and the majority are<br />
considered highly vulnerable to overexploitation (i.e.<br />
by directed fisheries or bycatch) due to their slow<br />
growth, slow reproduction, low fecundity, and other<br />
life-history characteristics (e.g. Bonfil 1994, Fowler et<br />
al. 2002, Dulvy et al. 2008). Salmon sharks are already<br />
a management issue <strong>in</strong> the region, as they are regularly<br />
captured as bycatch <strong>in</strong> BC’s groundfish fisheries,<br />
and our results contribute useful data to assess the relative<br />
risk <strong>of</strong> fish<strong>in</strong>g mortality on this shark species. For<br />
<strong>in</strong>stance, research that identifies and subsequently targets<br />
hotspots <strong>of</strong> such important biological features will<br />
make future studies more cost-effective, efficient and<br />
able to produce more precise abundance estimates<br />
than s<strong>in</strong>gle-stratum surveys (Buckland et al. 2001).<br />
However, considerably more <strong>in</strong>formation is needed on<br />
this and other shark species <strong>in</strong> order to understand the<br />
role <strong>of</strong> such potentially important predators on Pacific<br />
salmon stocks and other components <strong>of</strong> the biological<br />
community, and to ensure the conservation, susta<strong>in</strong>ability<br />
and <strong>in</strong>tegrity <strong>of</strong> function<strong>in</strong>g and resilient Pacific<br />
mar<strong>in</strong>e ecosystems. The ecological importance <strong>of</strong> top<br />
predators <strong>in</strong> mar<strong>in</strong>e ecosystems, from mar<strong>in</strong>e mammals<br />
to sharks, is naturally coupled with the importance<br />
<strong>of</strong> salmon <strong>in</strong> these ecosystems, which is <strong>in</strong> turn<br />
coupled with both the cultures and economies <strong>of</strong> the<br />
Pacific Northwest. It is therefore surpris<strong>in</strong>g that more is<br />
not known about sharks <strong>in</strong> the region. At-sea predation<br />
on salmon generally as well the specific role <strong>of</strong><br />
salmon sharks are both <strong>in</strong> need <strong>of</strong> further study. The<br />
direction <strong>of</strong> the literature is towards fill<strong>in</strong>g this void,<br />
because more papers on these sharks have been published<br />
s<strong>in</strong>ce 2000 than <strong>in</strong> the previous 50 yr. The present<br />
paper is <strong>in</strong>tended as a contribution to the literature<br />
<strong>of</strong> unravell<strong>in</strong>g these <strong>in</strong>teractions, and a<br />
priority-sett<strong>in</strong>g exercise to guide much-needed future<br />
research.<br />
Acknowledgements. Data on shark abundance and distribution<br />
were collected dur<strong>in</strong>g a mar<strong>in</strong>e mammal survey conducted<br />
by R.W. <strong>in</strong> partnership with Ra<strong>in</strong>coast Conservation.<br />
We thank the field observers, crew and funders for assistance<br />
with data collection. We thank L. Thomas for assistance with<br />
Williams et al.: Summertime shark <strong>aggregation</strong> <strong>in</strong> BC <strong>waters</strong><br />
survey design and data analysis. Species identification was<br />
conducted by R.W., T.A.O. and O. Andrews, with additional<br />
<strong>in</strong>put from E. Ashe, A. De Maddalena, S. He<strong>in</strong>rich, M. Mac-<br />
Duffee, I. McAllister and R. Stewart. R.W.’s contribution at the<br />
writ<strong>in</strong>g stage was supported by a Canada-US Fulbright Visit<strong>in</strong>g<br />
Research Chair at the University <strong>of</strong> Wash<strong>in</strong>gton. T.A.O.’s<br />
contributions were supported by a Pew Fellowship <strong>in</strong> Mar<strong>in</strong>e<br />
Conservation, a programme <strong>of</strong> the Pew Environment Group<br />
<strong>of</strong> the Pew Charitable Trusts, and by the Conservation Science<br />
Institute. B. Wright provided advice on salmon shark<br />
behaviour at early stages <strong>of</strong> manuscript development. We<br />
thank the anonymous reviewers and the editor, Pr<strong>of</strong>essor<br />
Rory Wilson, for valuable feedback on earlier versions <strong>of</strong> the<br />
manuscript.<br />
LITERATURE CITED<br />
255<br />
Aires-da-Silva A, Gallucci V (2007) Demographic and risk<br />
analyses applied to management and conservation <strong>of</strong> the<br />
blue shark (Prionace glauca) <strong>in</strong> the North Atlantic Ocean.<br />
Mar Freshw Res 58:570–580<br />
Batt<strong>in</strong> J, Wiley MW, Ruckelshaus MH, Palmer RN, Korb E,<br />
Bartz KK, Imaki H (2007) Projected impacts <strong>of</strong> climate<br />
change on salmon habitat restoration. Proc Natl Acad Sci<br />
USA 104:6720–6725<br />
BCME (BC M<strong>in</strong>istry <strong>of</strong> Environment) (2007) Environmental<br />
trends <strong>in</strong> <strong>British</strong> <strong>Columbia</strong>: 2007. BC M<strong>in</strong>istry <strong>of</strong> Environment,<br />
Victoria (available at www.env.gov.bc.ca/soe/et07/)<br />
BCMWALP (BC M<strong>in</strong>istry <strong>of</strong> Water, Land and Air Protection)<br />
(2002) Indicators <strong>of</strong> climate change for <strong>British</strong> <strong>Columbia</strong>,<br />
2002. Water, Air and Climate Change Branch, BC M<strong>in</strong>istry<br />
<strong>of</strong> Water, Land and Air Protection, Victoria<br />
Bonfil R (1994) Overview <strong>of</strong> world elasmobranch fisheries.<br />
FAO Fish Tech Pap No. 341. FAO, Rome<br />
Brodeur R, McK<strong>in</strong>nell S, Nagasawa K, Pearcy W, Radchenko<br />
V, Takagi S (1999) Epipelagic nekton <strong>of</strong> the North Pacific<br />
subarctic and transition zones. Prog Oceanogr 43:365–397<br />
Brodeur RD, Ralston S, Emmett RL, Trudel M, Auth TD,<br />
Phillips AJ (2006) Anomalous pelagic nekton abundance,<br />
distribution, and apparent recruitment <strong>in</strong> the northern<br />
California Current <strong>in</strong> 2004 and 2005. Geophys Res Lett,<br />
33, L22S08, doi:10.1029/2006GL026614<br />
Buckland ST, Anderson DR, Burnham KP, Laake JL, Borchers<br />
DL, Thomas L (2001) Introduction to distance sampl<strong>in</strong>g:<br />
estimat<strong>in</strong>g abundance <strong>of</strong> biological populations. Oxford<br />
University Press, New York, NY<br />
Campana SE, Brazner J, Marks L, Joyce W and others (2008)<br />
Status <strong>of</strong> bask<strong>in</strong>g sharks <strong>in</strong> Atlantic Canada. Canadian<br />
Science Advisory Secretariat (CSAS) Res Doc 2008/004,<br />
CSAS, Dartmouth, NS<br />
Crozier LG, Zabel RW, Hamlett AF (2008) Predict<strong>in</strong>g differential<br />
effects <strong>of</strong> climate change at the population level with<br />
life-cycle models <strong>of</strong> spr<strong>in</strong>g Ch<strong>in</strong>ook salmon. Glob Change<br />
Biol 14:236–249<br />
DeMaddalena A, Preti A, Polansky T (2007) <strong>Shark</strong>s <strong>of</strong> the<br />
Pacific Northwest: <strong>in</strong>clud<strong>in</strong>g Oregon, Wash<strong>in</strong>gton, <strong>British</strong><br />
<strong>Columbia</strong> and Alaska. Harbour Publish<strong>in</strong>g, Madeira Park,<br />
BC<br />
Dulvy NK, Baum JK, Clarke S, Compagno LJV and others<br />
(2008) You can swim but you can’t hide: the global status<br />
and conservation <strong>of</strong> oceanic pelagic sharks and rays.<br />
Aquat Conserv Mar Freshw Ecosyst 18:459–482<br />
Eggers DM, Irv<strong>in</strong>e JR, Fukuwaka M, Karpenko VI (2005)<br />
Catch trends and status <strong>of</strong> North Pacific salmon. North<br />
Pacific Anadromous Fish Commission (NPAFC) Doc. No.<br />
723, Rev. 3, NPAFC, Vancouver, BC
256<br />
Fowler SL, Reed TM, Dipper F (eds) (2002) Elasmobranch Biodiversity,<br />
Conservation and Management: Proc Int Sem<strong>in</strong>ar<br />
and Workshop, Sabah, Malaysia, July 1997. The World<br />
Conservation Union (IUCN), Gland<br />
Gallucci VF, Foy RJ, O’Brien SM, Aires-Da-Silva A and others<br />
(2008) Information from a pregnant salmon shark Lamna<br />
ditropis <strong>in</strong> the eastern North Pacific with observations on<br />
oophagous reproduction. J Fish Biol 73:732–739<br />
Gibson AJF, Campana SE (2005) Status and recovery potential<br />
<strong>of</strong> porbeagle shark <strong>in</strong> the Northwest Atlantic.<br />
Canadian Science Advisory Secretariat (CSAS) Res Doc<br />
2005/53, CSAS, Dartmouth, NS<br />
Goldman KJ (2003) Aspects <strong>of</strong> age, growth, demographics<br />
and thermal biology <strong>of</strong> two Lamniform shark species.<br />
PhD dissertation, Virg<strong>in</strong>ia Institute <strong>of</strong> Mar<strong>in</strong>e Science,<br />
Williamsburg, VA<br />
Groot C, Margolis L (1991) Pacific salmon life histories. UBC<br />
Press, Vancouver, BC<br />
Healey CG (1998) On the use <strong>of</strong> perceptual cues and data<br />
m<strong>in</strong><strong>in</strong>g for effective visualization <strong>of</strong> scientific datasets. In:<br />
Davis WA, Booth KS, Fournier A (eds) Proc Graphics Interface<br />
1998 Conf, Jun 18–20 1998, Vancouver. Canadian<br />
Human-Computer Communications Society, p 177–184<br />
Hedley SL, Buckland ST, Borchers DL (1999) Spatial modell<strong>in</strong>g<br />
from l<strong>in</strong>e transect data. J Cetacean Res Manag 1:<br />
255–264<br />
Hilborn R (1992) Hatcheries and the future <strong>of</strong> salmon <strong>in</strong> the<br />
northwest. Fisheries 17:5–8<br />
Hulbert LB, Rice SD (2002) Salmon shark, Lamna ditropis,<br />
movements, diet, and abundance <strong>in</strong> the eastern North<br />
Pacific Ocean and Pr<strong>in</strong>ce William Sound, Alaska. Report<br />
No. 02396, Exxon Valdez Oil Spill Restoration Project<br />
02396 F<strong>in</strong>al Report, NOAA Fisheries Auke Bay Laboratory,<br />
Juneau, AK<br />
Hulbert LB, Aires-Da-Silva AM, Gallucci VF, Rice JS (2005)<br />
Seasonal forag<strong>in</strong>g movements and migratory patterns <strong>of</strong><br />
female Lamna ditropis tagged <strong>in</strong> Pr<strong>in</strong>ce William Sound,<br />
Alaska. J Fish Biol 67:490–509<br />
Krkosek M, Lewis MA, Morton A, Frazer LN, Volpe JP (2006)<br />
Epizootics <strong>of</strong> wild fish <strong>in</strong>duced by farm fish. Proc Natl<br />
Acad Sci USA 103:15506–15510<br />
Krkosek M, Ford JS, Morton A, Lele S, Myers RA, Lewis MA<br />
(2007) Decl<strong>in</strong><strong>in</strong>g wild salmon populations <strong>in</strong> relation to<br />
parasites from farm salmon. Science 318:1772–1775<br />
Nagasawa K (1998) Predation by salmon sharks (Lamna ditropus)<br />
on Pacific salmon (Oncorhynchus spp.) <strong>in</strong> the North<br />
Pacific Ocean. North Pac Anadromous Fish Comm Bull<br />
1:419–433<br />
NRC (National Research Council) (1996) Upstream: salmon<br />
and society <strong>in</strong> the Pacific Northwest. National Academy<br />
Press, Wash<strong>in</strong>gton, DC<br />
Okey TA, Wright BA, Brubaker MY (2007) Salmon shark con-<br />
Editorial responsibility: Rory Wilson,<br />
Swansea, UK<br />
Mar Ecol Prog Ser 414: 249–256, 2010<br />
nections: North Pacific climate change, <strong>in</strong>direct fisheries<br />
effects, or just variability? Fish Fish 8:359–366<br />
Pade N, Queiroz N, Hunphries N, Will M, Jones C, Noble L,<br />
Sims DW (2009) First results from satellite-l<strong>in</strong>ked archival<br />
tagg<strong>in</strong>g <strong>of</strong> porbeagle shark: area fidelity, wider scale<br />
movements and plasticity <strong>in</strong> diel depth-changes. J Exp<br />
Mar Biol Ecol 370:64–74<br />
Stevens J (2005) Prionace glauca. In: IUCN red list <strong>of</strong> threatened<br />
species, Version 2010.1 (available at www.iucnred<br />
list.org, accessed 22 April 2010)<br />
Thomas L, Williams R, Sandilands D (2007) Design<strong>in</strong>g l<strong>in</strong>e<br />
transect surveys for complex survey regions. J Cetacean<br />
Res Manag 9:1–13<br />
Thomas L, Buckland ST, Rexstad EA, Laake JL and others<br />
(2010) Distance s<strong>of</strong>tware: design and analysis <strong>of</strong> distance<br />
sampl<strong>in</strong>g surveys for estimat<strong>in</strong>g population size. J Appl<br />
Ecol 47:5–14<br />
Thomson KA, Ingraham WJ, Healey MC, Leblond PH, Groot<br />
C, Healey CG (1994) Computer simulations <strong>of</strong> the <strong>in</strong>fluence<br />
<strong>of</strong> ocean currents on Fraser River sockeye salmon<br />
(Oncorhynchus nerka) return times. Can J Fish Aquat Sci<br />
51:441–449<br />
Waples RS (1999) Dispell<strong>in</strong>g some myths about hatcheries.<br />
Fisheries 24:12–21<br />
Weng KC, Castilho PC, Morrissette JM, Landeira-Fernandez<br />
AM and others (2005) Satellite tagg<strong>in</strong>g and cardiac physiology<br />
reveal niche expansion <strong>in</strong> salmon sharks. Science<br />
310:104–106<br />
Weng KC, Foley DG, Ganong JE, Perle C, Shill<strong>in</strong>ger GL,<br />
Block BA (2008) Migration <strong>of</strong> an upper trophic level<br />
predator, the salmon shark Lamna ditropis, between<br />
distant ecoregions. Mar Ecol Prog Ser 372:253–264<br />
Whitney F, Robert M (2007) Ocean observations from L<strong>in</strong>e P<br />
and Skaugran surveys. In: State <strong>of</strong> the Pacific Ocean 2006.<br />
DFO Canadian Science Advisory Secretariat (CSAS) Sci<br />
Advis Rep 2007/019, Vancouver, BC, p 29–30<br />
Williams R, Thomas L (2007) Distribution and abundance <strong>of</strong><br />
mar<strong>in</strong>e mammals <strong>in</strong> the <strong>coastal</strong> <strong>waters</strong> <strong>of</strong> <strong>British</strong> <strong>Columbia</strong>,<br />
Canada. J Cetacean Res Manag 9:15–28<br />
Williams R, Thomas L (2009) Cost-effective abundance estimation<br />
<strong>of</strong> rare animals: test<strong>in</strong>g performance <strong>of</strong> small-boat<br />
surveys for killer whales <strong>in</strong> <strong>British</strong> <strong>Columbia</strong>. Biol Conserv<br />
142:1542–1547<br />
Williams R, Hedley SL, Hammond PS (2006) Model<strong>in</strong>g distribution<br />
and abundance <strong>of</strong> Antarctic baleen whales us<strong>in</strong>g<br />
ships <strong>of</strong> opportunity. Ecol Soc 11:1 (available at www.ecologyandsociety.org/vol11/iss1/art1/)<br />
Williams R, Leaper R, Zerb<strong>in</strong>i AN, Hammond PS (2007) Methods<br />
for <strong>in</strong>vestigat<strong>in</strong>g measurement error <strong>in</strong> cetacean l<strong>in</strong>etransect<br />
surveys. J Mar Biol Assoc UK 87:313–320<br />
Wood SN (2006) Generalized Additive Models: an <strong>in</strong>troduction<br />
with R. Chapman & Hall/CRC<br />
Submitted: December 11, 2008; Accepted: June 29, 2010<br />
Pro<strong>of</strong>s received from author(s): August 19, 2010