JAEA-Review-2010-065.pdf:15.99MB - 日本原子力研究開発機構
JAEA-Review-2010-065.pdf:15.99MB - 日本原子力研究開発機構
JAEA-Review-2010-065.pdf:15.99MB - 日本原子力研究開発機構

Create successful ePaper yourself
Turn your PDF publications into a flip-book with our unique Google optimized e-Paper software.
4-19<br />
Radiation-Induced Electrical Degradation in CeO2<br />
Ceramics Irradiated with 10 MeV Ni<br />
N. Ishikawa and K. Takegahara<br />
Division of Fuels and Materials Engineering, NSED, <strong>JAEA</strong><br />
Radiation damage is one of the important causes of<br />
degradation of thermal conductivity and serious swelling in<br />
nuclear ceramic fuels. Understanding of radiation damage<br />
in nuclear fuel is important for controlling fuel properties<br />
during burn up. One of main objectives of this study is to<br />
elucidate the irradiation parameter dominating the radiation<br />
damage of ceramics by means of accelerator experiments,<br />
and to develop the characterization method of the radiation<br />
damages. Especially for simulating the process of<br />
radiation damage by elastic displacements, low-energy<br />
particle (10 MeV Ni) irradiation experiment has been<br />
performed. The oxide ceramics target, CeO 2, which has<br />
the same crystal structure (fluorite structure) with a UO 2<br />
nuclear fuel is adopted. In the present study, the radiation<br />
damage behavior is characterized not only by the X-ray<br />
diffraction method but also by the electrical conductivity<br />
measurement method.<br />
Thin films of CeO 2 were prepared on Al 2O 3 single<br />
crystal substrates, and were irradiated with 10 MeV Ni ions<br />
at room temperature. After the irradiation, fluence<br />
dependence of change of X-ray diffraction (XRD) pattern was<br />
measured in the wide fluence range up to 1.0 × 10 16 ions/cm 2 ,<br />
and also the electrical conductivity was measured up to about<br />
1 × 10 16 ions/cm 2 . The film thickness was fixed to be about<br />
0.3 μm which is thin enough to rule out the possibility of<br />
unwanted implantation effects.<br />
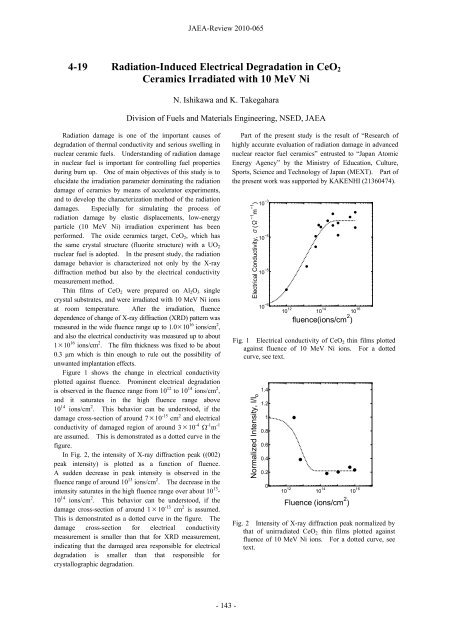
Figure 1 shows the change in electrical conductivity<br />
plotted against fluence. Prominent electrical degradation<br />
is observed in the fluence range from 10 12 to 10 14 ions/cm 2 ,<br />
and it saturates in the high fluence range above<br />
10 14 ions/cm 2 . This behavior can be understood, if the<br />
damage cross-section of around 7 × 10 -15 cm 2 and electrical<br />
conductivity of damaged region of around 3 × 10 -4 -1 m -1<br />
are assumed. This is demonstrated as a dotted curve in the<br />
figure.<br />
In Fig. 2, the intensity of X-ray diffraction peak ((002)<br />
peak intensity) is plotted as a function of fluence.<br />
A sudden decrease in peak intensity is observed in the<br />
fluence range of around 10 13 ions/cm 2 . The decrease in the<br />
intensity saturates in the high fluence range over about 10 13 -<br />
10 14 ions/cm 2 . This behavior can be understood, if the<br />
damage cross-section of around 1 × 10 -13 cm 2 is assumed.<br />
This is demonstrated as a dotted curve in the figure. The<br />
damage cross-section for electrical conductivity<br />
measurement is smaller than that for XRD measurement,<br />
indicating that the damaged area responsible for electrical<br />
degradation is smaller than that responsible for<br />
crystallographic degradation.<br />
<strong>JAEA</strong>-<strong>Review</strong> <strong>2010</strong>-065<br />
- 143 -<br />
Part of the present study is the result of “Research of<br />
highly accurate evaluation of radiation damage in advanced<br />
nuclear reactor fuel ceramics” entrusted to “Japan Atomic<br />
Energy Agency” by the Ministry of Education, Culture,<br />
Sports, Science and Technology of Japan (MEXT). Part of<br />
the present work was supported by KAKENHI (21360474).<br />
Electrical Conductivity, σ(Ω −1 m −1 )<br />
10 −3<br />
10 −4<br />
10 −5<br />
10 −6<br />
10 12<br />
10 14<br />
fluence(ions/cm 2 )<br />
10 16<br />
Fig. 1 Electrical conductivity of CeO2 thin films plotted<br />
against fluence of 10 MeV Ni ions. For a dotted<br />
curve, see text.<br />
Normalized Intensity, I/I o<br />
1.4<br />
1.2<br />
1<br />
0.8<br />
0.6<br />
0.4<br />
0.2<br />
0<br />
10 12<br />
10 14<br />
Fluence (ions/cm 2 )<br />
10 16<br />
Fig. 2 Intensity of X-ray diffraction peak normalized by<br />
that of unirradiated CeO 2 thin films plotted against<br />
fluence of 10 MeV Ni ions. For a dotted curve, see<br />
text.