JAEA-Review-2010-065.pdf:15.99MB - 日本原子力研究開発機構
JAEA-Review-2010-065.pdf:15.99MB - 日本原子力研究開発機構
JAEA-Review-2010-065.pdf:15.99MB - 日本原子力研究開発機構

You also want an ePaper? Increase the reach of your titles
YUMPU automatically turns print PDFs into web optimized ePapers that Google loves.
3-45<br />
Carbon Translocation in a Whole Plant Body by Using<br />
Positron Emitting Tracer Imaging System (PETIS) and<br />
Carbon-11-labeled Carbon Dioxide ( 11 CO2)<br />
N. Kawachi a) , N. Suzui a) , S. Ishii a) , S. Ito a) , N. S. Ishioka a) ,<br />
H. Yamazaki a, b) c, d) c, d) a)<br />
, A. Iwasaki , K. Ogawa and S. Fujimaki<br />
a) Radiation-Applied Biology Division, QuBS, <strong>JAEA</strong>, b) Faculty of Science and Technology,<br />
Tokyo University of Science, c) Plant Redox Regulation Research Group, Research Institute for<br />
Biological Sciences Okayama, d) Core Research for Evolutional Science and Technology, JST<br />
Elucidation of carbon kinetics in a plant is important<br />
from viewpoint of environmental reduction in the amounts<br />
of atmospheric carbon dioxide (CO 2) and from an<br />
agricultural viewpoint in terms of the growth and<br />
development of the plant body. In particular<br />
photosynthetic CO 2 fixation and photoassimilate<br />
translocation are important topics for understanding the<br />
mechanisms underlying carbon kinetics. In this study, we<br />
have developed a new method to investigate the carbon<br />
kinetics in a whole body by using one of the most powerful<br />
radionuclide-based imaging techniques for plant study, that<br />
is, the positron emitting tracer imaging system (PETIS).<br />
Carbon-11-labeled carbon dioxide ( 11 CO 2) and PETIS<br />
enable video imaging of tracer dynamics of carbon fixation,<br />
photosynthesis, and translocation 1, 2) . Because of a large<br />
field of view (FOV; 120.8 mm width, 186.8 mm height)<br />
provided by the PETIS and the sufficiently small size of<br />
soybeans (G. max cv. Jack) that fit in the FOV, dynamic<br />
quantitative PETIS data of gradual changing in 11 C activity<br />
and 11 C distribution throughout the entire intact plant body<br />
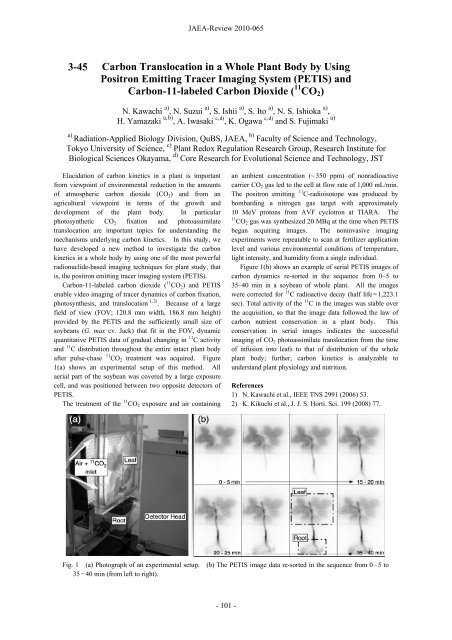
after pulse-chase 11 CO 2 treatment was acquired. Figure<br />
1(a) shows an experimental setup of this method. All<br />
aerial part of the soybean was covered by a large exposure<br />
cell, and was positioned between two opposite detectors of<br />
PETIS.<br />
The treatment of the 11 CO 2 exposure and air containing<br />
<strong>JAEA</strong>-<strong>Review</strong> <strong>2010</strong>-065<br />
an ambient concentration (~ 350 ppm) of nonradioactive<br />
carrier CO 2 gas led to the cell at flow rate of 1,000 mL/min.<br />
The positron emitting 11 C-radioisotope was produced by<br />
bombarding a nitrogen gas target with approximately<br />
10 MeV protons from AVF cyclotron at TIARA. The<br />
11 CO2 gas was synthesized 20 MBq at the time when PETIS<br />
began acquiring images. The noninvasive imaging<br />
experiments were repeatable to scan at fertilizer application<br />
level and various environmental conditions of temperature,<br />
light intensity, and humidity from a single individual.<br />
Figure 1(b) shows an example of serial PETIS images of<br />
carbon dynamics re-sorted in the sequence from 0–5 to<br />
35–40 min in a soybean of whole plant. All the images<br />
were corrected for 11 C radioactive decay (half life = 1,223.1<br />
sec). Total activity of the 11 C in the images was stable over<br />
the acquisition, so that the image data followed the law of<br />
carbon nutrient conservation in a plant body. This<br />
conservation in serial images indicates the successful<br />
imaging of CO 2 photoassimilate translocation from the time<br />
of infusion into leafs to that of distribution of the whole<br />
plant body; further, carbon kinetics is analyzable to<br />
understand plant physiology and nutrition.<br />
References<br />
1) N. Kawachi et al., IEEE TNS 2991 (2006) 53.<br />
2) K. Kikuchi et al., J. J. S. Horti. Sci. 199 (2008) 77.<br />
Fig. 1 (a) Photograph of an experimental setup. (b) The PETIS image data re-sorted in the sequence from 0 – 5 to<br />
35 − 40 min (from left to right).<br />
- 101 -