Atmospheric Air Pollutant Dispersion
Atmospheric Air Pollutant Dispersion
Atmospheric Air Pollutant Dispersion

Create successful ePaper yourself
Turn your PDF publications into a flip-book with our unique Google optimized e-Paper software.
<strong>Atmospheric</strong> <strong>Air</strong> <strong>Pollutant</strong><br />
• <strong>Atmospheric</strong> Stability<br />
<strong>Dispersion</strong><br />
Estimate air pollutant concentrations<br />
downwind of emission point sources.<br />
Downwind <strong>Air</strong> Pollution Concentrations<br />
Are a function of:<br />
• <strong>Air</strong> Temperature Lapse Rates<br />
• <strong>Atmospheric</strong> <strong>Air</strong> Inversions<br />
• <strong>Atmospheric</strong> Mixing Height<br />
• <strong>Dispersion</strong> from Point Emission Sources<br />
• <strong>Dispersion</strong> Coefficients<br />
In CEE490/ENVH 461 class we will<br />
Primarily use EPA SCREEN software
<strong>Atmospheric</strong> <strong>Air</strong> Vertical Stability<br />
Dry Adiabatic<br />
=<br />
Lapse Rate<br />
ΔTemp<br />
ΔAltitude<br />
ΔT<br />
ΔZ<br />
• Adiabatic vertical air movement causes a<br />
change in pressure and temperature:<br />
– dT/dz = g/C p = γ d (dry adiabatic lapse rate)<br />
γ d = 9.8 K/km<br />
--Stable lapse rate: γ < γ d<br />
– Unstable lapse rate: γ > γ d<br />
=<br />
o<br />
9.76K<br />
=<br />
=<br />
1000meters<br />
o<br />
5.4F<br />
1000ft
<strong>Atmospheric</strong> Stability<br />
Characterized by vertical temperature<br />
gradients (Lapse Rates)<br />
– Dry adiabatic lapse rate (Γ) = 0.976 o C/100 m ~<br />
1 o C/100 m<br />
– International standard lapse rate = 0.0066 o C/m<br />
Does the air temperature lapse rate have anything to<br />
do with air quality?<br />
Yes, because it is related to amount of vertical mixing<br />
of emitted air pollutants.
• First Law of Thermodynamics<br />
= 0 for adiabatic expansion<br />
dq = dh −υdP<br />
= C pdT<br />
• Barometric Equation<br />
dP<br />
= −ρg<br />
dZ<br />
1<br />
⇒ C pdT<br />
= dP = −gdZ<br />
ρ<br />
⇒<br />
dT<br />
dZ<br />
=<br />
−<br />
g<br />
C<br />
p<br />
−<br />
Lapse Rate<br />
1<br />
dP<br />
ρ
100 m<br />
Elevation<br />
(m)<br />
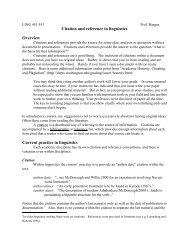
<strong>Air</strong> Temperature Lapse Rates<br />
Superadiabatic<br />
Superadiabatic<br />
Dry Adiabatic Lapse Rate<br />
Subadiabatic<br />
Subadiabatic<br />
T<br />
Temperature ( oC) Inversion Inversion
Stability Conditions<br />
Adiabatic lapse rate<br />
Actual <strong>Air</strong> Temperature lapse rate
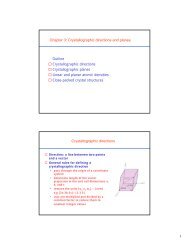
z<br />
1 km<br />
Mixing<br />
depth<br />
0<br />
NIGHT<br />
Diurnal Cycle of Surface<br />
MIDDAY<br />
Heating /Cooling<br />
Subsidence<br />
inversion<br />
MORNING<br />
T<br />
NIGHT MORNING AFTERNOON
Actual Temperature Sounding
Superadiabatic Lapse Rates (Unstable air)<br />
• Temperature decreases are greater than -10 o C/1000 meters<br />
• Occur on sunny days<br />
• Characterized by intense vertical mixing<br />
• Excellent dispersion conditions
<strong>Atmospheric</strong> Stability<br />
Superadiabatic – Strong Lapse Rate<br />
Unstable Conditions
Neutral <strong>Air</strong> Temp Lapse Rates<br />
• Temperature decrease with altitude is similar to the adiabatic lapse rate<br />
• Results from:<br />
– Cloudy conditions<br />
– Elevated wind speeds<br />
– Day/night transitions<br />
• Describes OK dispersion conditions<br />
Isothermal Lapse Rates (Weakly Stable)<br />
• Characterized by no temperature change with height<br />
• Atmosphere is somewhat stable<br />
• <strong>Dispersion</strong> conditions are moderate
<strong>Atmospheric</strong> Stability<br />
Subadiabatic – Weak Lapse Rate<br />
Stable Conditions
• 2 major types of inversion:<br />
Subsidence: descent of a layer of air within a high pressure<br />
air mass (descending air increases pressure & temp.)<br />
Radiation: thermal radiation at night from the earth’s<br />
surface into the clear night sky<br />
Radiation<br />
Inversion
Inverted <strong>Air</strong> Temp Lapse Rates (Strongly Stable)<br />
Characterized by increasing air temperature with height<br />
Does it occur during the day or at night? (Both)<br />
Is it associated with high or low air pressure systems? (High)<br />
Does it improve or deteriorate air quality? (deteriorate)<br />
www.ew.govt.nz/enviroinfo/air/weather.htm<br />
Inversion<br />
www.co.mendocino.ca.us/aqmd/Inversions.htm
• Inversion: <strong>Air</strong> Temperature increases with altitude
http://www.co.mendocino.ca.us/aqmd/pages/Inversion-Art-(web).jpg
Radiation Inversions<br />
• Result from radiational cooling of the ground<br />
• Occur on cloudless nights and clear sky – nocturnal<br />
• Are intensified in valleys (heavier cooled air descends to valley floor)<br />
• Cause air pollutants to be “trapped” (poor vertical transport)<br />
www.co.mendocino.ca.us/aqmd<br />
/Inversions.htm<br />
What happens to inversion when sun rises?
Radiation Inversions<br />
• Inversion Breaks up after sunrise<br />
• Breakup results in elevated ground level concentrations<br />
• Breakup described as a fumigation<br />
Red Line is <strong>Air</strong> Temperature<br />
Blue Line is adiabatic air temp lapse
Radiation Inversions<br />
• Elevated inversions are formed over urban areas<br />
– Due to heat island effect
Subsidence Inversion<br />
• Associated with atmospheric high-pressure systems<br />
• Inversion layer is formed aloft due to subsiding air<br />
• Persists for days
Subsidence Inversion<br />
• Migrating high-pressure systems: contribute to the hazy<br />
summer conditions<br />
• Semi-permanent marine high-pressure systems<br />
– Results in a large<br />
number of sunny calm<br />
days<br />
– Inversion layer closest to<br />
the ground on<br />
continental side<br />
– Responsible for air<br />
stagnation over<br />
Southern California<br />
www.oceansatlas.org/.../datard.htm
• Advective - warm air flows over a cold surface
• Mixing Height = Height of air that is mixed and where dispersion occurs<br />
What is the Mixing Height in a radiational inversion?<br />
When does the max MH occur during a day? Min MH?<br />
Which season has the max MH? Min MH?<br />
Why does Phoenix have a larger MH than New Orleans?<br />
Why is agricultural burning allowed only during daytime?
<strong>Air</strong> <strong>Pollutant</strong> <strong>Dispersion</strong> from Point Sources<br />
• Plume rise affects dispersion and transport<br />
– Affects maximum ground level concentrations<br />
– Affects distance to maximum ground level conc.
Lapse Rates and <strong>Atmospheric</strong> Stability<br />
Weak Lapse Condition (Coning)<br />
Wind<br />
Z = altitude<br />
T = Temp<br />
Γ = adiabatic lapse rate
Stack Plume: Coning<br />
Strong wind, no turbulence<br />
What is the stability class? (dashed line is adiabatic<br />
lapse rate) C<br />
Is there good vertical mixing? OK<br />
On sunny or cloudy days? Partly cloudy<br />
Good for dispersing pollutants? OK
Lapse Rates and <strong>Atmospheric</strong> Stability<br />
Inversion Condition (Fanning)<br />
Wind
Stack Plume: Fanning<br />
What is the stability class? (solid line is actual air<br />
temperature with altitude air temp lapse rate)<br />
What is the top view of the plume?<br />
http://www.med.usf.edu/~npoor/4
Stack Plume: Fumigation<br />
Why can’t the pollutants be dispersed upward?<br />
Plume trapped by inversion above stack height.<br />
Does it happen during the day or night? Morning
Lapse Rates and <strong>Atmospheric</strong> Stability<br />
Inversion Below, Lapse Aloft (Lofting)<br />
Wind
Stack Plume: Lofting<br />
Why can’t the pollutants be dispersed downward?<br />
What time of the day or night does this happen?<br />
Evening – night as radiation inversion forms
Lapse Rates and <strong>Atmospheric</strong> Stability<br />
Weak Lapse Below, Inversion Aloft (Trapping)<br />
Wind
Stack Plume: Trapping<br />
What weather conditions cause plume trapping?<br />
Radiation inversion at ground level, subsidence<br />
inversion at higher altitude (evening – night)
Stack Plume: Looping<br />
Strong turbulence<br />
http://www.med.usf.edu/~npoor/3<br />
Is it at stable or unstable condition? Unstable<br />
High or low wind speed? Low wind speed.<br />
Does it happen during the day or night? Day<br />
Is it good for dispersing pollutants? Yes
Dilution of <strong>Pollutant</strong>s in the Atmosphere<br />
• <strong>Air</strong> movement can dilute and remove<br />
pollutants (removal by absorption and<br />
deposition by snow, rain, & to surfaces)<br />
• <strong>Pollutant</strong> dilution is variable, from quite<br />
good to quite poor, according to the wind<br />
velocity and the air stability (lapse rate).
Characteristics of <strong>Dispersion</strong> Models<br />
• The accuracy of air pollutant dispersion models<br />
varies according to the complexity of the<br />
terrain and the availability of historic<br />
meteorological data.<br />
• The acceptability of the results of dispersion<br />
models varies with the experience and<br />
viewpoint of the modeler, the regulator and the<br />
intervener.
<strong>Air</strong> Quality Modeling<br />
Gaussian <strong>Dispersion</strong> Model<br />
EPA <strong>Air</strong> Quality Models (SCREEN TSCREEN,ISC, AERMOD, etc.)<br />
are computer software with equation parameters that include<br />
pollutant emission rate Q (gms/sec), stack height (meters), stack<br />
inside diameter at exit, stack gas temp, stack gas exit velocity<br />
(m/s) ambient air temp, receptor height (m), topography, etc.<br />
and calculate the downwind air pollutant concentrations.<br />
The EPA dispersion software models are used to:<br />
1. Evaluate compliance with NAAQS & prevention of<br />
significant air quality deterioration (PSD required for permit<br />
to construct)<br />
2. Find pollutant emission reductions required.<br />
3. Review permit to construct applications.
Is the <strong>Air</strong> Quality OK?<br />
What is the level of my exposure to these emissions?<br />
Is my family safe?<br />
Where is a safe location with regards to air quality?<br />
How about the adverse impact on the environment<br />
(plants, animals, buildings)?<br />
How to predict the impact of air pollutant emissions<br />
resulting from population growth?<br />
Where is the cleanest air; in city center, in rural area?<br />
Note: Children health (respiratory effects) has been<br />
correlated to the distance from their home to nearest<br />
highway or busy street (diesel engine emissions)
When are model applications required for regulatory<br />
purposes?<br />
• SCREEN3, TSCREEN,<br />
• ISC (Industrial Source Complex),<br />
• AERMOD<br />
AERMOD stands for American merican Meteorological Society<br />
Environmental nvironmental Protection Agency Regulatory egulatory Model Model<br />
Formally Proposed as replacement for ISC in 2000<br />
Adopted as Preferred Model November 9, 2005
Regulatory Application of Models<br />
• PSD: Prevention of Significant Deterioration of <strong>Air</strong> Quality<br />
in relatively clean areas (e.g. National Parks, Wilderness<br />
Areas, Indian Reservations)<br />
• SIP: State Implementation Plan revisions for existing<br />
sources and for New Source Reviews (NSR)
Classifications of <strong>Air</strong> Quality Models<br />
• Developed for a number of air pollutant types and<br />
time periods<br />
– Short-term models – for a few hours to a few<br />
days; worst case episode conditions<br />
– Long-term models – to predict seasonal or<br />
annual average concentrations; health effects<br />
due to exposure<br />
• Classified by<br />
– Non-reactive models – pollutants such as SO 2 and CO<br />
– Reactive models – pollutants such as O 3 , NO 2 , etc.
<strong>Air</strong> Quality Models<br />
• Classified by coordinate system used<br />
– Grid-based<br />
• Region divided into an array of cells<br />
• Used to determine compliance with NAAQS<br />
– Trajectory<br />
• Follow plume as it moves downwind<br />
• Classified by sophistication level<br />
– Screening: simple estimation use preset, worstcase<br />
meteorological conditions to provide<br />
conservative estimates.<br />
– Refined: more detailed treatment of physical and<br />
chemical atmospheric processes; require more<br />
detailed and precise meteorological and<br />
topographical input data.<br />
http://www.epa.gov/scram001/i<br />
mages/smokestacks.jpg
US EPA <strong>Air</strong> Quality Models<br />
• Screening models available at:<br />
www.epa.gov/scram001/tt22.htm#screen<br />
• Preferred models available at:<br />
http://www.epa.gov/scram001/tt22.htm#rec<br />
– A single model found to outperform others<br />
• Selected on the basis of other factors such as past use,<br />
public familiarity, cost or resource requirements and<br />
availability<br />
• No further evaluation of a preferred model is required
Gaussian <strong>Dispersion</strong> Models<br />
• Most widely used<br />
• Based on the assumption<br />
– plume spread results primarily by diffusion<br />
– horizontal & vertical pollutant concentrations in<br />
the plume have double Gaussian distribution)<br />
Q<br />
u<br />
H<br />
z<br />
x<br />
y
Gaussian Model Assumptions<br />
• Gaussian dispersion modeling based on a number of<br />
assumptions including<br />
– Source pollutant emission rate = constant (Steady-state)<br />
– Constant Wind speed, wind direction, and atmospheric<br />
stability class<br />
– <strong>Pollutant</strong> Mass transfer primarily due to bulk air<br />
motion in the x-direction<br />
– No pollutant chemical transformations occur<br />
– Wind speeds are >1 m/sec.<br />
– Limited to predicting concentrations > 50 m downwind
Gaussian <strong>Dispersion</strong> Model
Characteristics of <strong>Pollutant</strong> Plume<br />
Horizontal (y) and vertical (z) dispersion, is<br />
caused by eddies and random shifts of wind<br />
direction.<br />
• Key parameters are:<br />
– Physical stack height (h) – Plume rise (Δh)<br />
– Effective stack height (H) – Wind speed (ux )
Plume <strong>Dispersion</strong> Coordinate System
The Gaussian Model<br />
• C = C(x, y, z, stability)<br />
C<br />
⎛ 2 ⎞<br />
2<br />
Q<br />
⎧ ⎛ ⎞ ⎛<br />
⎜<br />
1 y<br />
⎟<br />
1 ( z − H ) 1 ( z + H )<br />
exp − ⎨exp<br />
⎜<br />
⎜−<br />
⎟ + exp ⎜<br />
⎜−<br />
⎜ 2 ⎟<br />
2<br />
2πσ yσ<br />
z ⎝ 2 σ y ⎠⎩<br />
⎝ 2 σ z ⎠ ⎝ 2 σ z<br />
= 2<br />
• σ y and σ z depend on the atmospheric conditions<br />
• <strong>Atmospheric</strong> stability classifications are defined<br />
in terms of surface wind speed, incoming solar<br />
radiation and cloud cover<br />
2<br />
⎞⎫<br />
⎟<br />
⎟⎬<br />
⎠⎭
C<br />
Gaussian <strong>Dispersion</strong> Equation<br />
( x,<br />
y,<br />
z)<br />
⎡ ⎛ 2<br />
Q 1<br />
⎢ ⎜<br />
y<br />
= exp − +<br />
πσ σ ⎢<br />
⎜ 2<br />
2<br />
2 y zu<br />
⎣<br />
2 ⎝ σ y σ z<br />
( z − H )<br />
σ y & σ z = f(downwind distance x & atmos stability)<br />
• Q = pollutant emission rate (grams/sec)<br />
• H = effective stack height (meters) = stack height + plume rise<br />
• u = wind speed (m/sec)<br />
σ y = horizontal crosswind dispersion coefficient (meters)<br />
σ z= vertical dispersion coefficient (meters)<br />
2<br />
⎞⎤<br />
⎟<br />
⎥<br />
⎠⎥⎦
Plume <strong>Dispersion</strong> Equations<br />
General Equation – Plume with Reflection for Plume Height H<br />
2<br />
( z H ) ⎞ ⎛ ( z + H )<br />
2<br />
Q ⎡ ⎛ y ⎞ ⎧ ⎛<br />
C(<br />
x,<br />
y,<br />
z;<br />
H ) = • ⎢exp⎜<br />
⎟<br />
⎜<br />
− • ⎨ ⎜<br />
⎟<br />
exp −<br />
2<br />
2πuσ σ ⎢⎣<br />
⎝ 2σ<br />
y z<br />
y ⎠ ⎩ ⎝<br />
−<br />
2<br />
2σ<br />
z<br />
⎟ + exp ⎜<br />
⎜−<br />
⎠ ⎝<br />
2<br />
2σ<br />
z<br />
Ground Level Concentration – Plume at Height H<br />
C(<br />
x,<br />
y,<br />
0;<br />
H )<br />
2<br />
2<br />
Q ⎡ ⎛ ⎞ ⎛ ⎞⎤<br />
⎢ ⎜<br />
y H<br />
• exp ⎟<br />
⎜<br />
−<br />
⎟<br />
• exp⎜<br />
− ⎟⎥<br />
πuσ<br />
σ ⎣⎢<br />
⎝ 2σ<br />
⎠ ⎝ 2σ<br />
y z<br />
y<br />
z ⎠⎥⎦<br />
= 2<br />
2<br />
Ground Level Center Line Conc (y = 0) – Plume Height H<br />
C(<br />
x,<br />
0,<br />
0;<br />
H )<br />
2<br />
Q ⎡ ⎛ H ⎞⎤<br />
• ⎢exp⎜<br />
− ⎟⎥<br />
πuσ<br />
σ ⎣ ⎝ 2σ<br />
y z<br />
z ⎠⎦<br />
= 2<br />
Ground Level Center Line – Ground Point Source (y = 0, H = 0)<br />
Q<br />
C(<br />
x,<br />
0,<br />
0;<br />
0)<br />
=<br />
πuσ<br />
σ<br />
y<br />
z<br />
2<br />
⎞⎫⎤<br />
⎟<br />
⎟⎬⎥<br />
⎠⎭⎥⎦
Gaussian <strong>Dispersion</strong> Equation<br />
If the emission source is at ground level with no<br />
effective plume rise then<br />
C<br />
( x,<br />
y,<br />
z)<br />
⎡ ⎛ 2 2<br />
Q 1<br />
⎢ ⎜<br />
y z<br />
= exp − +<br />
πσ σ ⎢<br />
⎜ 2 2<br />
y zu<br />
⎣<br />
2 ⎝ σ y σ z<br />
Plume Rise<br />
• H is the sum of the physical stack height and plume rise.<br />
H<br />
=<br />
Δh<br />
plume rise<br />
+<br />
h<br />
actual<br />
stack<br />
⎞⎤<br />
⎟<br />
⎥<br />
⎠⎥⎦
Key to Stability Categories
<strong>Atmospheric</strong> Stability Classes
Horizontal <strong>Dispersion</strong> Coefficient σ y
Vertical <strong>Dispersion</strong> Coefficient σ z
Maximum Downwind Ground-Level<br />
Concentration (C max )<br />
• <strong>Pollutant</strong>s require time (and distance) to reach the<br />
ground.<br />
• C max decreases as effective plume height H<br />
increases.<br />
• Distance to C max increases as H increases.
Maximum Concentration (C max ) and Distance to<br />
C max (x max )
Maximum Ground Level Concentration<br />
Under moderately stable to near neutral conditions,<br />
σ y = 1<br />
k σ<br />
z<br />
The ground level concentration at the center line is<br />
2<br />
Q ⎡ H ⎤<br />
C x,<br />
0,<br />
0 = exp⎢−<br />
2<br />
2<br />
πk1σ<br />
z u ⎣ 2σ<br />
z<br />
( ) ⎥ ⎦<br />
The maximum occurs at<br />
dC / dσz<br />
= 0 ⇒ σz<br />
=<br />
H<br />
2<br />
Once σ z is determined, x can be known and subsequently C.<br />
C<br />
Q<br />
= = 0.<br />
1171<br />
πσ σ u<br />
σ<br />
( x,<br />
0,<br />
0)<br />
exp[<br />
−1]<br />
y<br />
z<br />
Q<br />
σ<br />
y<br />
z<br />
u
Plume Rise<br />
• H is the sum of the physical stack height and plume rise.<br />
H<br />
=<br />
Δh<br />
plumerise<br />
+<br />
h<br />
actualstack
<strong>Pollutant</strong> Plume Rise<br />
Plume rises from stack exit.
Plume Rise<br />
Buoyant plume: Initial buoyancy >> initial momentum<br />
Forced plume: Initial buoyancy ~ initial momentum<br />
Jet: Initial buoyancy 55 m / s )<br />
where buoyancy flux is<br />
2<br />
F = gV d ( T −T<br />
) / 4T<br />
s<br />
u<br />
a<br />
S<br />
)<br />
V s: Stack exit velocity, m/s<br />
d: top inside stack diameter, m<br />
T s: stack gas temperature, K<br />
T a: ambient temperature, K<br />
g: gravity, 9.8 m/s 2
Carson and Moses: vertical momentum & thermal<br />
buoyancy, based on 615 observations involving 26 stacks.<br />
Δh<br />
Δh<br />
Δh<br />
plume rise<br />
plume rise<br />
plume rise<br />
=<br />
=<br />
3.<br />
47<br />
0.<br />
35<br />
Vsd<br />
u<br />
Vsd<br />
u<br />
Vsd<br />
= −1.<br />
04<br />
u<br />
( T T )<br />
Q = m&<br />
C −<br />
h<br />
m&<br />
=<br />
πd<br />
4<br />
2<br />
p<br />
s<br />
P<br />
Vs<br />
RT<br />
s<br />
a<br />
+<br />
+<br />
5.<br />
15<br />
2.<br />
64<br />
+<br />
2.<br />
24<br />
Q<br />
u<br />
Q<br />
u<br />
h<br />
h<br />
Q<br />
u<br />
h<br />
(unstable)<br />
(neutral)<br />
(stable)<br />
(heat emission rate, kJ/s)<br />
(stack gas mass flow rate. kg/s)
C<br />
( x,<br />
y,<br />
z)<br />
Q<br />
2πσ<br />
σ<br />
⎡ y<br />
exp⎢−<br />
⎢⎣<br />
2σ<br />
2<br />
Wark & Warner, “<strong>Air</strong> Pollution: Its Origin & Control”<br />
⎤⎪⎧<br />
⎡<br />
⎥⎨exp⎢−<br />
⎥⎦<br />
⎪⎩ ⎣<br />
2 ( z − H ) ⎤ ⎡ ( z + H )<br />
= 2<br />
2<br />
2<br />
y zu<br />
y 2σz<br />
2σz<br />
⎥ + exp⎢−<br />
⎦ ⎣<br />
Plume is Reflected when it touches ground surface.<br />
2<br />
⎤⎪⎫<br />
⎥⎬<br />
⎦⎪⎭
Ground level concentration<br />
C<br />
Q<br />
πσ σ<br />
⎡<br />
exp⎢−<br />
⎢⎣<br />
y<br />
2σ<br />
⎤ ⎡<br />
⎥ exp⎢−<br />
⎥⎦<br />
⎣<br />
H<br />
2σ<br />
= 2<br />
2<br />
y zu<br />
y<br />
z<br />
2<br />
2<br />
⎤<br />
⎥<br />
⎦
<strong>Dispersion</strong> of SO 2 from Stack<br />
• An industrial boiler is burning at 12 tons of 2.5% sulfur coal/hr<br />
with an emission rate of 151 g/s. The following exist : H = 120<br />
m, u = 2 m/s, y = 0. It is one hour before sunrise, and the sky<br />
is clear. Find the downwind ground level SO2 concentration at<br />
x =2 km, y = 0, and z = 0.<br />
Stability class =<br />
σy =<br />
σz =<br />
C(x=2 km, y=0, z=0) =<br />
C<br />
Q<br />
πσ σ<br />
⎡ 2<br />
y<br />
exp⎢−<br />
⎢⎣<br />
2σ<br />
⎤ ⎡ H<br />
⎥exp⎢−<br />
⎥⎦<br />
⎣ 2σ<br />
= 2<br />
2<br />
y zu<br />
y<br />
z<br />
2<br />
⎤<br />
⎥<br />
⎦
<strong>Dispersion</strong> of Ground Level <strong>Air</strong> <strong>Pollutant</strong> Emissions<br />
• <strong>Air</strong> pollutant emissions are from a ground level source<br />
with H = 0, u = 4 m/s, Q = 100 g/s, and the stability class<br />
= B, what is downwind concentration at x = 200 m, y = 0,<br />
and z = 0?<br />
At 200 m:<br />
σ y =<br />
σ z =<br />
C(x=200 m, y=0, z=0) =
• Calculate H using plume rise equations for an 80 m high stack (h) with a stack<br />
diameter = 4 m, stack gas velocity = 14 m/s, stack gas temperature = 90o C (363<br />
K), ambient temperature = 25 oC (298 K), 10 meter high wind speed u at 10 m<br />
= 4m/s, and stability class = B. Find the Max Ground Level air pollutant<br />
concentration & its (location downwind distance x).<br />
F =<br />
Δh plume rise =<br />
H =<br />
σz =<br />
σy =<br />
Cmax =<br />
Plume Rise and Max Conc<br />
Residents around the Rock Cement Plant are complaining that its emission<br />
are in violation and the ground level concentrations exceed the air quality<br />
standards. The plant has its facility within 0.2 km diameter fence. Its<br />
effective stack height is 50 m. You are a government agency environmental<br />
engineer. Where are you going to locate your air quality monitors? Why?
Complex Horizontal, Vertical, and Temporal Wind Structure<br />
Winds aloft have no continuous measurements
Meteorology
In most of cases terrain is not flat terrain – topographic complexity<br />
Complex horizontal, vertical, and temporal dispersion
Plume <strong>Air</strong> <strong>Pollutant</strong> Building Downwash
Building Downwash
Building Downwash
Building Downwash – Short Stack
Building Downwash – Taller Stack (Not GEP)
Building Downwash – Tallest Stack<br />
H GEP = 2.5 H Bldg Prior to 1979 H GEP = H Bldg + 1.5 L
Cavity and Wakes
Cavity and Far Wake<br />
Cavity
Building Downwash for 2 Identical Stack Emissions at Different Locations<br />
Building<br />
Cavity<br />
The stack on the left is located on top of a building and this structure affects the<br />
wind-flow which, in turn, affects the plume trajectory, pulling it down into the<br />
cavity zone (near wake) behind the building. The stack on the right is located far<br />
enough downwind of the building to be unaffected by the cavity (near wake)<br />
effects and is only affected by the air flow in the far wake.
Building Downwash<br />
Cavity
Z R<br />
Cavity<br />
X R<br />
2Y R<br />
Cavity and Wakes<br />
Z R<br />
2Y R
Aerodynamic Wake<br />
• Region where local air velocities are different from<br />
the free stream values<br />
• Streamline Separation – at an object<br />
– Eddy Recirculation (generally lower velocity region)<br />
– Turbulent Shear Region (generally higher velocity)<br />
• Reattachment of Streamlines<br />
• Near Wake (Cavity)<br />
– Usually on the ‘lee’ side of the object.<br />
• Far Wake<br />
– Effect of another object on the separated streamlines<br />
• Estimation of Wake/Cavity Boundary<br />
– Effect of Building geometry
Two Points of Concern<br />
• <strong>Dispersion</strong> of <strong>Air</strong> <strong>Pollutant</strong> Plume in the presence<br />
of Buildings<br />
– What happens to the plume from an existing stack and<br />
existing buildings?<br />
• Design of Stacks in the Presence of Building<br />
– What are the design guidelines if a new emission source<br />
is being proposed in an area full of buildings?
Good Engineering Practice GEP Analysis<br />
• H GEP = good engineering practice height<br />
• H GEP = H + 1.5 L<br />
– H = height of adjacent or nearby structure<br />
– L = lesser dimension height or proj. width<br />
– 5L = region of influence<br />
• The structure with the greatest influence<br />
is then used in the model to evaluate<br />
wake effects and downwash.
Good Engineering Practice Stack Height<br />
1985 Regulations -<br />
GEP Stack height – greater of the following<br />
- a) 65 m from the base of the stack<br />
-b) H GEP = 2.5 H<br />
for stacks in existence before Jan, 1979.<br />
For All Other Stacks:<br />
H GEP = H + 1.5 L<br />
Where H is the height of the nearest building and<br />
L = lesser dimension height or projected building width
GEP stack height<br />
• Building downwash can occur when<br />
H Stack = H S < H b + 1.5L<br />
H Stack = Height of Stack<br />
H b = Height of Building<br />
L = lesser of H b or PBW<br />
PBW = Maximum Projected Building Width<br />
Screen models will do this calculation when the<br />
building downwash option is used. If HS > Hb +<br />
1.5L, then building downwash will not be shown in<br />
SCREEN results
Getting Started – Screen 3<br />
• Convert all lengths and distances to meters<br />
• Convert temperatures to degrees Kelvin<br />
• Identify building contributions to air<br />
dispersion (stack emissions)<br />
• Screen 3 should be run in regulatory<br />
default mode<br />
• Note that SCREEN3 differs from TSCREEN (SCREEN3<br />
can select atmospheric stability classes or run Full<br />
Meteorology, will not calculate concentrations at other<br />
averaging times, etc.)
Information Required to run<br />
Screen Models for Point Source<br />
• Emission rate (g/s)<br />
• Stack Height (m)<br />
• Shortest distance to property line<br />
• Stack velocity (or volumetric airflow SCREEN3)<br />
• Stack gas temperature ( o K)<br />
• Stack Inside Diameter<br />
• Building Height, Length, Width
SCREEN Example – Stack emissions<br />
• Emission rate (g/s) .01 g/s<br />
• Stack Height 15.24m<br />
• Building Height 6.096m<br />
• Shortest Distance to property line 91.44m<br />
• Stack airflow in acfm 20,000 acfm<br />
• Stack gas temperature 294.3° K<br />
• Stack inside diameter 1.143m<br />
• Building dimensions 30.48m L, 30.48m W, 10.67m H
SCREEN Example – Stack emissions<br />
Note that this is the output from SCREEN3 software (not TSCREEN)
SCREEN Example – Stack emissions
SCREEN Example – Stack emissions
SCREEN Example – Stack emissions
SCREEN Example – Stack emissions
SCREEN Example – Stack emissions
SCREEN Example – Stack emissions<br />
The most conservative scenario gives a maximum 1-hr 1 hr<br />
concentration of 2.595 ug/m 3 at a distance of 91 meters
Flare Emissions Elevated point source
Screen Model for Flare Source<br />
• Emission Rate<br />
• Flare Stack Height<br />
• Total Heat Release Rate<br />
• Shortest Distance to property line<br />
• Influential Building Dimensions
SCREEN Example – Flare emissions
SCREEN Example – Flare emissions
SCREEN Example – Flare emissions
SCREEN Example – Flare emissions
Screen Model for Area Source<br />
• Emission Rate<br />
• Source Release Height<br />
• Larger Side Length of Rectangular Area<br />
• Smaller Side Length of Rectangular Area<br />
• Shortest Distance to property line
SCREEN Example – Area Source
SCREEN Example – Flare emissions
Screen Model for Volume Source<br />
• Emission Rate<br />
• Source Release Height<br />
• Initial Lateral Dimension<br />
• Initial Vertical Dimension<br />
• Shortest Distance to Property Line
Volume Source<br />
• Source Release Height is the center of the<br />
Volume Source:<br />
If the Source is from a building, the release<br />
height is set equal to one half of the building<br />
height.<br />
• Volume sources are modeled as a square in<br />
Screen3. If the source is not square, the width<br />
should be set to the minimum length.
Volume Source<br />
Initial Lateral Dimension (σ y0 )<br />
Single Volume Source<br />
σ y0 = length of side divided by 4.3<br />
Line Source composed of several volume sources<br />
σ y0 = length of side divided by 2.15<br />
Line Source composed of separated volume sources<br />
σ y0 = center to center distance divided by 2.15
Volume Source<br />
Initial Vertical Dimension (σ z0 )<br />
Surface-Based Source<br />
σ z0 = vertical dimension of source divided by 2.15<br />
Elevated Source on or adjacent to a building<br />
σ z0 = building height divided by 2.15<br />
Elevated Source not on or adjacent to a building<br />
σ z0 = vertical dimension of source divided by 4.3
Vertical Dimension is<br />
height of building<br />
divided by 2.15<br />
Example – Volume Source<br />
Volume Source from a Building<br />
Lateral Dimension is<br />
minimum length of<br />
building divided by 4.3<br />
Release Height is ½ of<br />
Building Height
SCREEN Example – Volume Source
SCREEN Example – Volume Source<br />
Initial Lateral Dimension obtained by taking<br />
building length of 30.48m divided by 4.3<br />
Using a building as the volume source, so the<br />
initial vertical dimension is the height of the<br />
building divided by 2.15
SCREEN Example – Volume Source
SCREEN Example – Volume Source
Screen model results<br />
• Screen model results are all<br />
maximum 1-hr concentrations (except<br />
for complex terrain and if SCREEN is<br />
run inside of TSCREEN can obtain<br />
concentrations in other averaging<br />
times).