PDF Version - Chandra X-Ray Observatory (CXC)
PDF Version - Chandra X-Ray Observatory (CXC)
PDF Version - Chandra X-Ray Observatory (CXC)

You also want an ePaper? Increase the reach of your titles
YUMPU automatically turns print PDFs into web optimized ePapers that Google loves.
<strong>Chandra</strong> NewsSpring<br />
2012<br />
Published by the <strong>Chandra</strong> X-ray Center (<strong>CXC</strong>)<br />
A Close Nuclear Black Hole Pair in<br />
the Spiral Galaxy NGC 3393<br />
G. Fabbiano<br />
X-RAY & OPTICAL<br />
Credit: X-ray: NASA/<strong>CXC</strong>/SAO/G.Fabbiano et al, Optical: NASA/STScI<br />
Scale: Image is 12.5 arcsec across (about 9,800 light years)<br />
Inset: Image is 1.6 arcsec across (1260 light years)<br />
Issue 19<br />
X-RAY CLOSE-UP
3<br />
7<br />
7<br />
9<br />
9<br />
10<br />
11<br />
13<br />
16<br />
17<br />
18<br />
A Close Nuclear Black Hole Pair in the<br />
Spiral Galaxy NGC 3393<br />
G. Fabbiano<br />
Project Scientist’s Report<br />
Martin Weisskopf<br />
Project Manager’s Report<br />
Roger Brissenden<br />
<strong>Chandra</strong> Important Dates<br />
INSTRUMENTS: ACIS<br />
Paul Plucinsky, Royce Buehler, Nancy<br />
Adams-Wolk, & Gregg Germain<br />
INSTRUMENTS: HRC<br />
Ralph Kraft & Almus Kenter<br />
INSTRUMENTS: HETG<br />
Herman Marshall<br />
INSTRUMENTS: LETG<br />
Jeremy Drake<br />
<strong>Chandra</strong> Related Meetings<br />
X-ray Binaries: Celebrating 50 Years<br />
Since the Discovery of Sco X-1<br />
<strong>Chandra</strong> Calibration<br />
Larry David<br />
Contents<br />
18<br />
19<br />
21<br />
Useful Web Addresses<br />
CIAO 4.4<br />
Antonella Fruscione<br />
Cycle 13 Peer Review Results<br />
Belinda Wilkes<br />
Einstein Postdoctoral Fellowship<br />
Program<br />
Andrea Prestwich<br />
Got Data—Will Publish!<br />
Arnold Rots, Sherry Winkelman, Glenn<br />
Becker<br />
<strong>Chandra</strong> User’s Committee<br />
Membership List<br />
<strong>CXC</strong> 2011 Science Press Releases<br />
Megan Watzke<br />
STOP for Science Program<br />
Pat Slane and Kim Arcand<br />
Year of the Solar System<br />
Kim Arcand<br />
The X-ray Astronomy School<br />
Aneta Siemiginowska<br />
Listening to X-ray Data<br />
Wanda Diaz Merced<br />
The <strong>Chandra</strong> Newsletter appears once a year and is edited by Paul J. Green, with editorial assistance<br />
and layout by Evan Tingle. We welcome contributions from readers.<br />
Comments on the newsletter, or corrections and additions to the hardcopy mailing list should<br />
be sent to: chandranews@head.cfa.harvard.edu.<br />
25<br />
26<br />
27<br />
28<br />
29<br />
29<br />
30<br />
31
Spring, 2012<br />
A Close Nuclear Black Hole Pair<br />
in the Spiral Galaxy NGC3393<br />
Exploring the inner regions of active galaxies<br />
with the highest <strong>Chandra</strong> resolution<br />
G. Fabbiano<br />
The discovery of the M-sigma relation 1 , the correlation<br />
between the masses of galaxy bulges and those of nuclear<br />
massive black holes (MBHs), has suggested that the evolution<br />
of galaxies and their MBHs are linked. Both are thought<br />
to grow and evolve by merging of smaller galaxy/MBH units<br />
pulled together by gravity (see review 2 ). During this process,<br />
MBHs may also accrete stars and interstellar medium (ISM)<br />
from the surrounding merger galaxy, causing the MBH to<br />
grow and to “shine” as an active galactic nucleus (AGN). Radiation<br />
and winds from the active MBH—AGN feedback—<br />
may in turn provide a crucial regulatory mechanism for both<br />
galaxy and MBH/AGN growth 3 .<br />
The above scenario is consistent with the growing<br />
body of multi-wavelength observations, and has been<br />
validated by increasingly sophisticated theoretical simulations<br />
4,5 . However, it includes also a big pinch of guesswork.<br />
Two open questions stand out: (1) What are the physical parameters<br />
of AGN feedback? (2) Can we set strong observational<br />
constraints on MBH merger evolution?<br />
Since AGNs are easily detected in X-rays, <strong>Chandra</strong><br />
can play an important role in pursuing these questions at the<br />
heart of galaxy evolution.<br />
In this report I will discuss how our project to set observational<br />
constraints on AGN feedback with <strong>Chandra</strong> has<br />
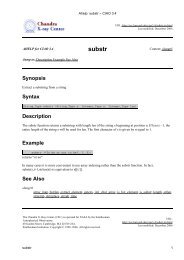
Fig. 1- Deconvolved<br />
HRC image 9 , compared<br />
with [OIII]<br />
contours from the<br />
HST/FOC (white<br />
contours). The letters<br />
in the image<br />
refer to the regions<br />
labeled in the subpixel<br />
ACIS image<br />
shown in Fig. 2.<br />
Pushing <strong>Chandra</strong>’s Resolution to its Limit: NGC4151<br />
also led to the discovery of a merging pair of active MBHs,<br />
providing a direct observation of later merger evolution.<br />
<strong>Chandra</strong> observations have shown the entire gamut<br />
of nuclear activity from luminous quasars to “silent” or<br />
quasi-silent nuclear MBHs 6 . The effect of past AGN activity<br />
on the surrounding hot gaseous medium is evident in the<br />
large-scale (several to 100s kpc) loops and rings discovered<br />
in <strong>Chandra</strong> images of giant elliptical galaxies and clusters 7 .<br />
Merger-triggered MBH activity was first imaged with <strong>Chandra</strong><br />
in NGC6240, where a ~2 kpc separation double AGN<br />
was discovered, both sources with prominent Fe-Kα lines 8 in<br />
their X-ray spectra.<br />
Until recently, these studies were missing the inner<br />
(≤100 pc scale) regions of nearby galaxies hosting luminous<br />
AGNs, because of the instrumental constraints of ACIS, the<br />
most commonly used <strong>Chandra</strong> detector: the imaging resolution<br />
limits imposed by the ½ arcsec instrument pixel and<br />
the relatively slow ACIS readout resulting in ‘pileup’ of the<br />
strong point-like sources associated with luminous nearby<br />
AGNs. However, these inner regions are where we would<br />
have the best chance of setting direct observational constraints<br />
on the physical parameters of AGN feedback from<br />
currently active MBHs, as well as observing active MBHs in<br />
a later stage of merging.<br />
In the attempt to investigate the inner circum-nuclear<br />
regions of AGNs, post-doc Junfeng Wang, Martin Elvis,<br />
Guido Risaliti and I have observed some of these nuclei<br />
with the HRC, which although less sensitive and without<br />
the energy resolution of ACIS, samples adequately the mirror<br />
PSF and is not affected by pileup. We have also acquired<br />
deep ACIS data and imaged it with sub-pixel binning (see<br />
insert).<br />
3<br />
Our pilot target was NGC4151 (at a distance<br />
of 13.3 Mpc). We obtained new deep HRC<br />
and ACIS data, which we analyzed in conjunction<br />
to the data already available in the <strong>Chandra</strong><br />
archive. The HRC data allows a clean view of the<br />
innermost circum-nuclear region (1”~65 pc),<br />
which in ACIS is affected by pileup. The HRC<br />
instrumental pixel also oversamples the <strong>Chandra</strong><br />
telescope (HRMA) PSF, and therefore the HRC<br />
images, although devoid of spectral information,<br />
are of a resolution comparable to the limits of<br />
the <strong>Chandra</strong> mirrors. The HRC+mirror PSF is<br />
well calibrated, allowing image deconvolution to<br />
minimize the effect of the PSF wings of the strong<br />
nuclear source on the extended circum-nuclear<br />
emission 9 . Fig. 1 shows how several features of<br />
the deconvolved HRC image of NGC4151 closely
4<br />
<strong>CXC</strong> Newsletter<br />
follow features observed in the Hubble [OIII] image.<br />
The HRMA’s PSF (half-power diameter HPD = 0.6” at E ∼ 1.5 keV; see the <strong>Chandra</strong> POG) is under-sampled by<br />
the ACIS CCD pixels (0.492” × 0.492”); the ACIS native pixel image of the central region of NGC4151 in the soft energy<br />
interval relatively less affected by nuclear pileup, is shown in Fig. 2a. However, the real sampling of the PSF is better than<br />
that provided by the ACIS detector pixel, because of the dithering pattern of the <strong>Chandra</strong> telescope. We took advantage<br />
of this telescope dithering by using a finer pixel size (0.0625”, ~1/8 of the native ACIS pixel size) when extracting the images<br />
(see full explanation 10 ). This sub-pixel binning approach has been adopted previously in imaging studies of X-ray jets<br />
pushing for the highest spatial resolution 11 . The ACIS images with sub-pixel binning (see Fig. 2b) reveal curvy extensions<br />
2” away from the nucleus (labeled as “C” and “D”), which are not discernible in the native pixel soft ACIS image, but are<br />
present in both [OIII] and the HRC image.<br />
Fig. 2 - a) ACIS image<br />
using the native ACIS<br />
pixel; b) Same data, subpixel<br />
binned (1/8 of ACIS<br />
pixel), and smoothed<br />
with an FWHM = 0”.25<br />
Gaussian kernel for better<br />
visualization of faint<br />
extended features.<br />
By comparing the HRC data with the ACIS sub-pixel image, we demonstrated that we could recover the full<br />
resolution of the <strong>Chandra</strong> mirror even in the spatially under-sampled ACIS data. Sub-pixel imaging allows us to expand<br />
ultimate high-resolution studies to other active galaxies.<br />
Starting with our pilot study of NGC4151 (PI:<br />
Fabbiano), we are now pursuing a program of deep subarc-second<br />
resolution spatial/spectral studies of the circum-nuclear<br />
regions of a sample of nearby AGNs with<br />
extended optical emission line regions (CHEERS, PI: J.<br />
Wang). We can study details of the circum-nuclear regions<br />
down to ~100 pc, spatial scales commensurable<br />
with those reached by high-resolution optical and radio<br />
telescopes. One of these galaxies is NGC3393, a prominent<br />
bulge spiral at a distance of ~50 Mpc, with a highly<br />
absorbed (Compton thick 12 ) AGN and an extended, spiral<br />
like circum-nuclear narrow emission line region (Fig. 3).<br />
NGC3393 had been previously observed with<br />
<strong>Chandra</strong> for 30 ks with ACIS 13 to study the Compton thick<br />
AGN. This work had reported a nuclear source X-ray spectrum<br />
with a featureless continuum and a prominent 6.4<br />
keV Fe-K line. We observed NGC3393 for an additional<br />
70 ks as part of CHEERS. The extended X-ray emission,<br />
associated with the optical line emission, is clearly seen<br />
in the image (see blue insert in Fig. 3, showing the total<br />
screened combined exposure of ~90 ks.) We detected a total<br />
of 279±16 counts (3–8 keV) from the nuclear source<br />
in the combined exposure, with an ACIS spectrum—also<br />
shown in Fig. 3—consistent with that previously reported<br />
13 .<br />
Junfeng and I were looking at the combined deep<br />
X-ray image using DS9, zooming in to look at the central<br />
AGN, when we had a surprise: the hard-band emission<br />
(3–8 keV), which should not be affected by softer photo-<br />
or shock-ionized circum-nuclear components, did not<br />
look point-like. Its spectrum, however, was typical of a<br />
Compton-thick AGN (see Fig. 3). The X-ray image, with<br />
¼ pixel binning, is shown in Fig. 4. The X-ray centroid<br />
agrees with the emission line central source position (diamond),<br />
but the radio position is displaced to the SW, towards<br />
the elongation of the X-ray source.<br />
This spatial extension of the hard nuclear emission<br />
was puzzling enough to warrant further experimen-
Spring, 2012<br />
Fig. 3 - HST/WFPC2 F606W image of NGC3393 (gray, background)14 showing the inner ~40” spiral arms, which are<br />
also prominent in the [OIII] line, compared with a similar scale ACIS image of the soft X-ray emission (0.3–2 keV),<br />
including a total of 90 ks exposure time. The ACIS image is sub-pixel binned (1/4 of the native ACIS pixel, ~0.125”)<br />
and adaptively smoothed (Wang, J. et al. 2012 in preparation). The nucleus is seen at the center of the X-ray image; the<br />
spectrum of the nuclear source shows featureless continuum emission and a prominent Fe-Kα 6.4 keV emission line.<br />
tation. Mindful of the double AGN of NGC6240 8 , both<br />
with prominent Fe-Kα lines, we decided to derive separate<br />
images in the hard continuum (3–6 keV) and in the<br />
Fe-K line regions of the spectrum. As can be seen in Fig.<br />
5, a single source, coincident with the optical emission<br />
line nucleus, dominates the continuum, while two sources<br />
appear in the Fe-K band: one coincident with the optical<br />
nucleus, the other closer to the radio position. The two<br />
sources are separated by 0.6” in the plane of the sky, corresponding<br />
to 150 pc at the distance of NGC3393.<br />
The ACIS spectra of the two sources are shown<br />
in Fig. 5; both spectra sport the prominent Fe-Kα lines<br />
of Compton-thick AGNs, and each source has X-ray luminosity<br />
of a few 10 42 erg s -1 . It appears that NGC3393<br />
contains not one, but two Compton thick obscured active<br />
MBHs.<br />
This result is reported in detail in a letter to Nature<br />
15 (<strong>Chandra</strong> press release http://chandra/photo/2011/<br />
n3393/) and, as discussed there, has clear implications for<br />
the galaxy/MBH merger evolution scenario.<br />
The idea of merger evolution was first modeled for<br />
the Antennae galaxies and other nearby ‘disturbed’ galaxies<br />
16 ; François Schweizer originally (and controversially)<br />
advocated merging of spiral galaxies as a general major<br />
formation path for elliptical galaxies 17 .<br />
In more recent times, increasingly sophisticated<br />
simulations have explored the evolution of galaxies (stars<br />
and gaseous components) and their MBH for a range of<br />
merging parameters, including major collisions and mergers<br />
of similar mass galaxies, minor mergers of different<br />
Fig. 4 - 3–8 keV image of the NGC 3393 nuclear region with ¼<br />
subpixel binning, smoothed with a Gaussian of FWHM=0.25”.<br />
Contours of HST F664N Hα and VLA 8.4 GHz emission are<br />
shown in gray and green, respectively (see Fabbiano et al<br />
2011 15 for details and references.)<br />
5
6<br />
Fig. 5 - b) Continuum<br />
image (3–6 keV), with<br />
the same processing as<br />
in Fig. 4; c) 6–7 keV<br />
image, dominated by<br />
Fe Kα line emission.<br />
The ACIS spectra of the<br />
two sources are shown<br />
as indicated.<br />
mass galaxies, and looser tidal interactions. While the<br />
galaxies interact and merge, the nuclear MBHs are carried<br />
along until they are directly interacting with each<br />
other. Gravitation drag from stars and even more from gas<br />
causes the MBHs to form a close binary, which eventually<br />
collapses with emission of gravitational waves 4 .<br />
The observational evidence of MBH merging evolution<br />
is still rather sparse. Most reported double MBHs<br />
are quasar pairs with separation 10 to 100 kpc 18 , therefore<br />
in the initial stage of their merging interaction. The<br />
last stage, with sub-parsec separation leading to MBH<br />
collapse and emission of gravitational waves, has been<br />
inferred from the spectra and variability of two more<br />
quasars 19, 20 . Direct imaging of active MBH pairs in spiral<br />
galaxies undergoing a major merger is exemplified by the<br />
double AGN of NGC6240 8 with a separation of ~2 kpc,<br />
while the double radio nucleus with 7.3 pc separation of<br />
the elliptical galaxy 0402+37921 suggests the late evolution<br />
of a major merger.<br />
With a separation of 150 pc between the two active<br />
MHBs, NGC3393 provides an important and so far<br />
unique observational point. The galaxy is a barred spiral,<br />
with prominent bulge and grand design arms. Although<br />
images show tidal features in the outer region, consistent<br />
with gravitational interactions, the morphology is basically<br />
regular, suggesting either the later stages of a major<br />
merger or a minor merger. The stellar population of the<br />
inner bulge does not show any sign of the rejuvenation<br />
expected in the case of a major merger for the observed<br />
MBH separation, thus arguing for a minor merger. More-<br />
<strong>CXC</strong> Newsletter<br />
over, in a major merger of similar mass MBHs, the time<br />
scale to final collapse at the observed separation of 150 pc<br />
would be rather short ~1 Myr, while in the merger of unequal<br />
mass galaxies (and MBHs), longer timescales up to<br />
1 Gyr are expected, making the detection of such a system<br />
more likely 5 .<br />
NGC3393 is the first reported double AGN with<br />
~100 pc scale separation in a spiral galaxy. Simulations<br />
suggest that the detection of such a close AGN pair<br />
should be a relatively rare event 22, 23 , so we may have just<br />
been lucky. However, I believe it’s healthy as an observer<br />
to keep an open mind, and not to be unduly influenced<br />
by theory. The observational constraints are still rather<br />
loose: NGC3393 is only one observational point. Even another<br />
detection in a well-defined sample would provide<br />
important information. One thing we have learnt from<br />
NGC3393 is that normal looking large bulge galaxies, not<br />
just clearly disturbed mergers, may be a good hunting<br />
ground for closely interacting merging active MBHs. We<br />
intend to continue pursuing this hunt with <strong>Chandra</strong> in the<br />
future.<br />
References<br />
[1]Magorrian, J., Tremaine, S., Richstone, D., Bender, R.,<br />
Bower, G., Dressler, A., Faber, S. M., Gebhardt, K., Green, R.,<br />
Grillmair, C., Kormendy, J., & Lauer, T. (1998). AJ 115:2285-<br />
2305.<br />
[2]Colpi, M. & Dotti, M. (2009). ArXiv:0906.4339.<br />
[3]Di Matteo, T., Springel, V., & Hernquist, L. (2005). Nature
Spring, 2012<br />
433:604-607.<br />
[4]Mayer, L., Kazantzidis, S., Madau, P., Colpi, M., Quinn, T. &<br />
Wadsley, J. (2007). Science 316:1874-1877.<br />
[5]Callegari, S., Kazantzidis, S., Mayer, L., Colpi, M., Bellovary,<br />
J. M., Quinn, T. & Wadsley, J. (2011). ApJ 729:85.<br />
[6]Pellegrini, S. (2005). ApJ 624:155-161.<br />
[7]Fabian, A. C., et al. (2011). MNRAS, 418, 2154-2164 .<br />
[8]Komossa, S., Burwitz, V., Hasinger, G., Predehl, P., Kaastra,<br />
J. S. & Ikebe, Y. (2003). ApJ 582:L15-L19.<br />
[9]Wang, J., Fabbiano, G., Karovska, M., Elvis, M., Risaliti, G.,<br />
Zezas, A. & Mundell, C. G. (2009). ApJ 704:1195.<br />
[10]Wang, J., Fabbiano, G., Risaliti, G., Elvis, M., Karovska, M.,<br />
Zezas, A., Mundell, C. G., Dumas, G. & Schinnerer, E. (2011).<br />
ApJ 729:75.<br />
[11]Harris, D. E., Mossman, A. E., & Walker, R. C. (2004). ApJ<br />
615:161.<br />
[12]Maiolino, R., Salvati, M., Bassani, L., Dadina, M., della<br />
Ceca, R., Matt, G., Risaliti, G. & Zamorani, G. (1998). A&A<br />
338:781-794.<br />
[13]Levenson, N. A., Heckman, T. M., Krolik, J. H., Weaver, K.<br />
A. & Życki, P. T. (2006). ApJ 648:111-127.<br />
[14]Malkan, M. A., Gorjian, V. &Tam, R. (1998). ApJ 117:25.<br />
[15]Fabbiano, G., Wang, J., Elvis, M. & Risaliti, G. (2011).<br />
Nature 477:431.<br />
[16]Toomre, A. & Toomre, J. (1972). ApJ 178:623-666.<br />
[17]Schweizer, F. (1982). ApJ 252:455-460.<br />
[18]Green, P. J., Myers, Adam D., Barkhouse, W. A., Mulchaey,<br />
J. S., Bennert, V. N., Cox, T. J. & Aldcroft, T. L. (2010). ApJ 710:<br />
1578-1588.<br />
[19]Boroson, T. A. & Lauer, T. R. (2009). Nature, 458:53-55.<br />
[20]Valtonen, M. J., Lehto, H. J., Nilsson, K., Heidt, J., Takalo,<br />
L. O., Sillanpää, A., Villforth, C., Kidger, M., Poyner, G., Pursimo,<br />
T., et al. (2008). Nature 452:851-853.<br />
[21] Rodriguez, C., Taylor, G. B., Zavala, R. T., Peck, A. B., Pollack,<br />
L. K. & Romani, R. W. (2006). ApJ 646: 49-60.<br />
[22]Blecha, L., Loeb A. & Narayan, R. (2012). ArXiv:1201.1904.<br />
[23]Van Wassenhove, S., Volonteri, M., Mayer, L., Dotti, M.,<br />
Bellovary, J., & Callegari, S. (2011). arXiv:1111.0223.<br />
Project Scientist’s Report<br />
Martin Weisskopf<br />
“The marvel of <strong>Chandra</strong> exceeding its nominal operational<br />
life continues.” With these words, we began last<br />
year’s report. We hope to repeat them for many years to<br />
come. The <strong>Observatory</strong> is now in its 13th year of successful<br />
operation, and the call for the Cycle 14 proposals has<br />
been issued.<br />
The <strong>Chandra</strong> Team has submitted its proposals to<br />
the NASA 2012 Senior Review of Operating Missions. The<br />
submission included two proposals: one for the <strong>Chandra</strong><br />
mission and the other for Education and Public Outreach.<br />
Oral presentations to the Senior Review Committee are<br />
scheduled for February 29.<br />
The <strong>Chandra</strong> X-ray <strong>Observatory</strong> is unique in its<br />
capability for sub-arcsecond X-ray imaging, which is essential<br />
to the science goals of many key X-ray and multiwavelength<br />
astrophysical investigations. The <strong>Observatory</strong><br />
continues to operate with only minor incremental changes<br />
in performance, due primarily to the gradual accumulation<br />
of molecular contamination on the ACIS filters and<br />
to slow degradation of the spacecraft’s thermal insulation.<br />
The former affects the detection of low-energy x-rays with<br />
ACIS. The latter impacts observing scheduling and strategies<br />
to ensure continued operation of the <strong>Observatory</strong> in<br />
a safe thermal environment.<br />
In late 2012 January, <strong>Chandra</strong> experienced the<br />
strongest solar proton events since the previous solar<br />
maximum. The consequence of such radiation storms is<br />
that the <strong>Observatory</strong> must suspend science operations<br />
until the high flux of damaging protons has subsided.<br />
In preparation for the impending solar maximum, the<br />
<strong>Chandra</strong> Team has made some innovations to respond<br />
more robustly to solar proton events. These include use<br />
of the HRC anti-coincidence shield rate and of the ACIS<br />
threshold crossings as onboard radiation monitors, as<br />
well as the implementation of a “Science-Only Safing Action”<br />
(SOSA). The SOSA splits the (nominally) weekly<br />
command loads into vehicle and science-observation<br />
commands, which now allows the spacecraft to continue<br />
scheduled maneuvers and other vehicle activities even<br />
when the science load has stopped—e.g., to protect the<br />
instruments from radiation damage.<br />
A major highlight this past year was the introduction<br />
of a new proposal category—X-ray Visionary Projects<br />
(XVP)—to address key astrophysical questions that<br />
require 1–6 Ms of observing time. The last peer review<br />
awarded time for 4 XVPs: “A <strong>Chandra</strong> Legacy Project to<br />
Resolve the Accretion Flow of Gas Captured by a Supermassive<br />
Black Hole” (1 Ms); “Cosmology and Cluster<br />
Evolution from the 80 Most Massive Clusters in 2000 deg 2<br />
from the South Pole Telescope Survey” (2 Ms); “<strong>Chandra</strong><br />
Exploration of the Cosmic Melting Pot in the Virialization<br />
Region of a Rich Galaxy Cluster” (2 Ms); “<strong>Chandra</strong><br />
HETG Ultra-deep Gratings Spectroscopy of Sgr A*” (3<br />
Ms). Overall, the Cycle 13 Peer Review approved 199 of<br />
664 submitted research proposals, which had requested<br />
142 Ms of observing time, a factor-of-5.4 oversubscription<br />
of the available 27 Ms. (See Belinda Wilkes’ article for<br />
details.)<br />
7
8<br />
Project Manager’s Report<br />
Roger Brissenden<br />
<strong>Chandra</strong> marked over twelve years of successful mission<br />
operations with continued excellent operational and<br />
scientific performance. Telescope time remained in high<br />
demand, with significant oversubscription in the Cycle 13<br />
peer review held in June. In the Fall the observing program<br />
transitioned from Cycle 12 to Cycle 13. We released the Call<br />
for Proposals for Cycle 14 in December, and look forward<br />
to the Cycle 14 peer review in June 2012.<br />
The team worked hard to prepare for NASA’s 2012<br />
Senior Review of operating missions. The <strong>CXC</strong> submitted<br />
our proposal in January 2012 (with the Education and Public<br />
Outreach proposal submitted separately in December,<br />
2011), and will participate in an oral presentation to the Senior<br />
Review committee at the end of February 2012.<br />
The <strong>CXC</strong> conducted several workshops and symposia<br />
during 2011. We celebrated <strong>Chandra</strong>’s 12th anniversary<br />
with the symposium “12 Years of Science with <strong>Chandra</strong>,”<br />
part of the American Astronomical Society meeting<br />
held in Boston in May. In July we conducted the workshop<br />
“Structure of Clusters and Groups of Galaxies in the <strong>Chandra</strong><br />
Era,” and in August held the 2011 5-day X-ray Astronomy<br />
School, followed by a workshop for users of the <strong>CXC</strong>’s<br />
CIAO data analysis software system. As part of the <strong>CXC</strong>’s<br />
regular reviews and consultations with outside organizations,<br />
NASA reviewed the <strong>CXC</strong>’s operations in March and<br />
September, and the <strong>Chandra</strong> Users’ Committee met at the<br />
<strong>CXC</strong> in October.<br />
The <strong>CXC</strong> mission planning staff continued to<br />
maximize observing efficiency in spite of temperature constraints<br />
on spacecraft pointing. Competing thermal constraints<br />
continue to require that some longer observations<br />
be split into multiple short duration segments, to allow<br />
the spacecraft to cool at preferred attitudes. The total time<br />
available for observing has been increasing gradually over<br />
the past few years as <strong>Chandra</strong>’s orbit evolves and the spacecraft<br />
spends less time in Earth’s radiation belts. The overall<br />
observing efficiency during 2011 was 75%, compared with<br />
74% in 2010 and an average of 68% over the mission. In the<br />
next several years we expect potential<br />
observing time to increase slightly, but actual observing to<br />
be limited by radiation due to increasing solar activity.<br />
Operational highlights over the past year included<br />
five approved requests to observe targets of opportunity<br />
that required the mission planning and flight teams to interrupt<br />
and revise on-board command loads. After several<br />
years of very low solar radiation, the sun has become more<br />
active, causing the team to interrupt <strong>Chandra</strong> observing<br />
<strong>CXC</strong> Newsletter<br />
three times during the year to protect the instruments from<br />
solar particles. <strong>Chandra</strong> passed through the 2011 summer<br />
and winter eclipse seasons, as well as a brief lunar eclipse in<br />
June, with nominal power and thermal performance.<br />
<strong>Chandra</strong>’s first full safe mode event in over 11<br />
years—ultimately shown to have no hardware cause—occurred<br />
in July. On-board software detected an anomalous<br />
change in the spacecraft’s angular momentum, triggering<br />
an autonomous transition to safe mode and a resulting<br />
swap to redundant hardware. The swap went flawlessly<br />
and all of the redundant systems performed as expected.<br />
The <strong>CXC</strong>’s flight and science staff changed immediately to<br />
24-hour operations and scheduled extra telemetry contacts<br />
with the spacecraft. Analysis of spacecraft data and orbital<br />
dynamics revealed that the safe mode transition resulted<br />
from a complex interaction of gravity-gradient torques,<br />
commanding in the science loads, and flight software timing.<br />
No hardware failures were involved and no harm was<br />
caused to the <strong>Observatory</strong>. The staff returned <strong>Chandra</strong> to<br />
nominal observing five days after the anomaly occurred,<br />
with a loss of 370 ks of observing time. The event demonstrated<br />
the training, effectiveness and seamless cooperation<br />
of all elements of the <strong>Chandra</strong> X-ray <strong>Observatory</strong> team.<br />
In October, the spacecraft transitioned to normal<br />
sun mode when an electronic circuit reset, believed to be<br />
due to a single event upset, in which radiation or ions interrupt<br />
a component in the on-board electronics. The operations<br />
teams returned the spacecraft to normal status within<br />
two days with no adverse consequences, but the loss of 154<br />
ks of observing time.<br />
As part of an on-going risk reduction program, the<br />
<strong>CXC</strong> flight team identified a method to improve <strong>Chandra</strong>’s<br />
response to high radiation as the sun becomes more active.<br />
The new process maintains the science instruments<br />
in a radiation-safe condition while allowing controllers to<br />
continue spacecraft management activities such as eclipse<br />
response, attitude control, and thermal and momentum<br />
management. The new safing approach reduces risk to the<br />
spacecraft and minimizes the time and effort required to<br />
resume observations after a high radiation event. Following<br />
software development and extensive ground testing, the<br />
new method was fully implemented on 1 December 2011<br />
and first came into action during a radiation safing in January,<br />
2012.<br />
Both focal plane instruments, the Advanced CCD<br />
Imaging Spectrometer and the High Resolution Camera,<br />
have continued to operate well and have had no significant<br />
problems. ACIS, along with the overall spacecraft, has continued<br />
to warm gradually.<br />
All systems at the <strong>Chandra</strong> Operations Control<br />
Center continued to perform well in supporting flight operations.
Spring, 2012<br />
<strong>Chandra</strong> data processing and distribution to observers<br />
continued smoothly, with the average time from<br />
observation to delivery of data averaging roughly 30 hours.<br />
The <strong>Chandra</strong> archive holdings grew by 0.5 TB to 8.8 TB<br />
and now contain 32.7 million files. <strong>Chandra</strong> Source Catalog<br />
data products represent 1.8 TB of the archive.<br />
The Data System team released software updates to<br />
support the submission deadline for Cycle 13 observations<br />
proposals (March 2011), the Cycle 13 Peer Review (June)<br />
and the Cycle 14 Call for Proposals (December 2011). Software<br />
upgrades supported the multi-cycle observing proposals<br />
that were solicited beginning in Cycle 13.<br />
In addition, several enhancements to instrument<br />
algorithms have been incorporated into standard data<br />
processing and also released in CIAO 4.4 (December),<br />
including a new ACIS afterglow/hot pixel determination<br />
tool. Work is progressing on a new version of the <strong>Chandra</strong><br />
Source Catalog (CSC) that will increase the number of<br />
detected X-ray sources. The new CSC version will extend<br />
the catalog to fainter limits by combining multiple observations<br />
and by using new algorithms to allow point sources as<br />
faint as ~5 counts to be detected on-axis, resulting in a ~2.5<br />
times increase in the number of X-ray sources included in<br />
the catalog.<br />
The <strong>CXC</strong> Education and Public Outreach (EPO)<br />
group in 2011 created 15 science press releases, a press release<br />
posting and 12 image releases, and produced 22 60<br />
second High Definition podcasts on astrophysics and <strong>Chandra</strong><br />
results. Two of the group’s animated videos earned platinum-level<br />
Pixie awards from the American Pixel Academy.<br />
<strong>CXC</strong> staff created 75 blog entries, and initiated live tweets<br />
from such venues as the AAS meeting, science fairs and the<br />
NASA press conference.<br />
EPO personnel presented 26 workshops at conferences<br />
and clinics sponsored by the National Science Teacher<br />
Association, National Science Olympiad, American Association<br />
of Physics Teachers, and the Astronomy Society<br />
of the Pacific. EPO staff presented an invited talk on public<br />
science at the October conference Communicating Astronomy<br />
with the Public, sponsored by the International Astronomical<br />
Union.<br />
The EPO group was awarded a grant to support<br />
NASA’s Year of the Solar System initiative by developing<br />
the exhibit From Earth to the Solar System, modeled on the<br />
EPO-created exhibit From Earth to the Universe (FETTU).<br />
The Braille panels developed for FETTU were donated to<br />
the National Federation for the Blind for permanent exhibit<br />
at its Jernigan Institute.<br />
We look forward to a new year of continued smooth<br />
operations and exciting science results. Please join us for<br />
the workshop “X-ray Binaries, 50 Years Since the Discovery<br />
of Sco X-1”, to be held in Boston July 10–12, 2012.<br />
Important Dates for<br />
<strong>Chandra</strong><br />
Cycle 14 Peer Review: June 25–29, 2012<br />
Workshop: July 10–12, 2012<br />
50 Years of X-ray Binaries<br />
Cycle 13 Cost Proposals Due: Fall 2012<br />
Users’ Committee Meeting: October, 2012<br />
Einstein Fellows Symposium: Fall 2012<br />
Cycle 14 Start: December, 2012<br />
Cycle 15 Call for Proposals: December, 2012<br />
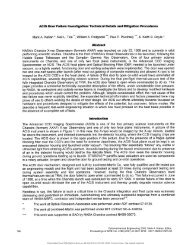
ACIS Update<br />
Paul Plucinsky, Royce Buehler, Nancy<br />
Adams-Wolk, & Gregg Germain<br />
The ACIS instrument continued to perform well over the<br />
past year with no anomalies or unexpected degradations.<br />
The charge-transfer inefficiency (CTI) of the FI and BI<br />
CCDs is increasing at the expected rate. The contamination<br />
layer continues to accumulate on the ACIS optical-blocking<br />
filter. Recent data indicate that the contaminant may<br />
be increasing in thickness faster than the current model<br />
predicts, especially around the edges of the filter which are<br />
colder than the center of the filter. The <strong>CXC</strong> calibration<br />
group is analyzing the data and may produce an updated<br />
contaminant model in the coming year.<br />
The control of the ACIS focal plane (FP) temperature<br />
continues to be a major focus of the ACIS Operations<br />
Team. As the <strong>Chandra</strong> thermal environment continues to<br />
evolve over the mission, some of the components in the<br />
Science Instrument Module (SIM) close to ACIS have been<br />
reaching higher temperatures, making it more difficult to<br />
maintain the desired operating temperature of -119.7° C at<br />
9
10<br />
the focal plane. In previous years, a heater on the ACIS Detector<br />
Housing (DH) and a heater on the SIM were turned<br />
off to provide more margin for the ACIS FP temperature.<br />
At this point in the mission, there are two effects that produce<br />
excursions in the FP temperature, both related to the<br />
attitude of the satellite. First the Earth can be in the FOV of<br />
the ACIS radiator (which provides cooling for the FP and<br />
DH). Second, for pitch angles larger than 130 degrees, the<br />
Sun illuminates the shade for the ACIS radiator and the<br />
rear surfaces of the SIM surrounding the ACIS DH. Reducing<br />
the number of operational CCDs reduces the power<br />
dissipation in the FP, thereby resulting in a lower FP temperature.<br />
Starting in Cycle 13, GOs were encouraged to request<br />
5 CCDs for their observations to keep the FP and the<br />
electronics cooler, if their science objectives could be met<br />
with 5 CCDs. Starting in Cycle 14, GOs will not be allowed<br />
to specify “Y” for 6 CCDs in the RPS forms when they submit<br />
their proposal. If a GO requires 6 CCDs for their observation,<br />
they are to specify 5 CCDs as “Y” and one CCD as<br />
“OPT1” at the time of proposal submission. If the proposal<br />
is selected, the GO may work with their User Uplink Support<br />
Scientist and change the “OPT1” to a “Y” if the sixth<br />
CCD is required. GOs should be aware that requesting 6<br />
CCDs increases the likelihood of a warm FP temperature<br />
and/or may increase the complexity of scheduling the observation.<br />
GOs should review the updated material in the<br />
Proposers’ Guide on selecting CCDs for their observations<br />
and on this web page: http://cxc.cfa.harvard.edu/acis/optional_CCDs/optional_CCDs.html<br />
The control of the ACIS electronics temperatures<br />
has also been a concern for the ACIS Operations Team.<br />
ACIS has three main electronics boxes, the Power Supply<br />
and Mechanisms Controller (PSMC), the Digital Processing<br />
Assembly (DPA), and the Detector Electronics Assembly<br />
(DEA). The PSMC reaches its highest temperatures when<br />
the satellite is in a “forward Sun” configuration, pitch angles<br />
between 45–60 degrees (<strong>Chandra</strong> cannot point within 45<br />
degrees of the Sun). Since 2006, the <strong>Chandra</strong> FOT has been<br />
using the optional CCDs information provided by GOs to<br />
turn off optional CCDs if thermal conditions require. As a<br />
result of the changing thermal environment, the DEA and<br />
DPA are reaching higher temperatures in tail-Sun orientations<br />
(pitch angles larger than 130 degrees). The recommendation<br />
in the previous paragraph to use only 5 CCDs<br />
if the science objectives can be met with 5 CCDs, will also<br />
reduce the temperature of the DEA and DPA in addition to<br />
the temperature of the FP. Starting in Cycle 14, the <strong>Chandra</strong><br />
FOT will be using the optional CCDs information to turn<br />
off optional CCDs if either the DEA or DPA approach their<br />
temperature limits.<br />
HRC Update<br />
Ralph Kraft and Junfeng Wang<br />
<strong>CXC</strong> Newsletter<br />
Another year has passed and the HRC continues to operate<br />
normally. There have been no significant changes or<br />
performance anomalies since the last <strong>Chandra</strong> newsletter.<br />
However, as described in detail in Jeremy Drake’s article on<br />
LETG, the <strong>CXC</strong> calibration team felt that the gain loss, and<br />
therefore quantum efficiency loss (40% or more at some locations),<br />
due to charge extraction in the wing plates of the<br />
HRC-S was sufficiently large that it would start to impact<br />
science observations. This slow decay in instrument gain<br />
and QE is a well-known effect in microchannel plate (MCP)<br />
detectors, and the HRC was designed with the capability to<br />
raise the high voltage to recover the gain.<br />
Accordingly, a plan was developed (principally by<br />
Mike Juda and the <strong>CXC</strong> Calibration team with the support<br />
of the HRC instrument team) to evaluate the effect of a progressive<br />
increase of the high voltage on both the top and<br />
bottom MCPs and determine how much of the lost QE in<br />
the wing plates could be recovered by a small increase to<br />
the HV. This plan was implemented during a realtime contact<br />
on the morning of January 9th, 2012. A Command<br />
Action Procedure was developed in which the HV on the<br />
HRC-S would be raised above the nominal operating voltage<br />
one digital step at a time while observing HZ 43 with<br />
the LETG inserted (30 cts s -1 in the dispersed spectrum in<br />
the wing plates). The voltages were to be raised by 3 steps<br />
on each plate, or roughly 50 volts above the nominal 1250<br />
V operating voltage. Roughly 10 minutes of data would be<br />
taken at each voltage step so that the progressive change<br />
could be evaluated. This would occur during a realtime telemetry<br />
contact so that the instrument team could continuously<br />
monitor the performance and safety of the instrument.<br />
The HV would be returned to its nominal operating<br />
setting at the end of the experiment.<br />
At the time of writing this article, we are just receiving<br />
the processed data from this experiment. Quick<br />
look realtime analysis at the OCC showed that the detector<br />
performed as expected at the higher voltages and that there<br />
were no problems with increased background or hot spots<br />
in the detector during the operation. The HRC was returned<br />
to its default configuration and seen to be operating<br />
normally at the end of experiment. Preliminary analysis of<br />
the processed data from the first few voltage steps shows<br />
that the source rate did increase by roughly 10% per voltage<br />
step. A more careful analysis is underway by both the <strong>CXC</strong><br />
Cal and HRC instrument teams to evaluate the effect on<br />
gain and QE. If the data shows that we recover most or all
Spring, 2012<br />
44.0<br />
45.0<br />
46.0<br />
-0:00:47.0<br />
48.0<br />
49.0<br />
50.0<br />
<strong>Chandra</strong> HRC<br />
1"<br />
72 pc<br />
2:42:41.0 40.9 40.9 40.8 40.8 40.7 40.7 40.6 40.6 40.<br />
Fig. 1. - The ~7” x 7” (500 pc across) HRC image of<br />
NGC 1068 obtained in ObsID 12705.<br />
0.0 0.4 1.2 2.9 6.2 12.9 26.1 52.5 105.6 210.7 419.9<br />
of the QE by increasing the gain, the HV on the HRC-S may<br />
be permanently increased. A similar procedure eventually<br />
may be needed to increase the voltage on the HRC-I plates,<br />
but charge extraction monitoring shows a smaller gain loss<br />
in the imager to date.<br />
The HRC continues to be used for a wide range of<br />
scientific investigations. Junfeng Wang, Margarita Karovska,<br />
Pepi Fabbiano and collaborators used the HRC plus image<br />
deconvolution to resolve structures on sub-arcsecond<br />
scales near the nucleus in the Seyfert 2 AGN NGC 1068.<br />
As described in detail in Pepi Fabbiano’s contribution, the<br />
HRC is being used in a number of investigations to resolve<br />
sub-arcsecond structure in the vicinity of bright AGN. The<br />
HRC is particularly useful in these observations because<br />
the pixel scale closely matches the telescope PSF and the<br />
HRC does not suffer from pileup due to the bright AGN.<br />
Motivated by the HRC discovery of the jet-gas<br />
cloud interaction in the nuclear region of NGC 4151 (Wang<br />
et al. 2009ApJ 704,1195), the first HRC image of the prototype<br />
Compton-thick Seyfert 2 galaxy NGC 1068 (1”∼72 pc)<br />
was recently obtained (Fig. 1, 40 ks exposure, PI: Fabbiano).<br />
The HRC image clearly resolves the subarcsecond structures<br />
associated with the narrow line region clouds, which<br />
cannot be studied in previous ACIS imaging observations<br />
due to the overwhelming pileup of the bright X-ray nucleus.<br />
The PSF-deconvolved HRC image using the EMC2 algorithm<br />
(see Karovska et al. 2005, ApJL 623, 137 and references<br />
therein) provides an unprecedented morphological<br />
comparison between the X-ray emission and the radio jet<br />
in the innermost 100 pc of this galaxy (Fig. 2), allowing us<br />
to study in detail the disruption of the collimated inner radio<br />
jet (Wang, Fabbiano, Karovska et al. 2012 in prep.). The<br />
Fig. 2 - X-ray<br />
emission structure<br />
in the innermost<br />
100 pc<br />
region of NGC<br />
1068, revealed<br />
by the HRC image<br />
with EMC2<br />
deconvolution.<br />
Superposed are<br />
contours from 5<br />
GHz MERLIN<br />
radio image<br />
(courtesy of J.<br />
Gallimore).<br />
11<br />
overlay shows X-ray emission “blobs’’ at the locations where<br />
the radio jet (green contours) changes direction and where<br />
the highly collimated jet terminates, implying possible interactions<br />
with the gas clouds.<br />
HETGS Calibration Update<br />
Herman Marshall<br />
A new set of HETGS efficiencies was released as part of<br />
CalDB v4.4.7, which should reduce systematic differences<br />
between the HEG and MEG fluxes as well as improve overall<br />
model fits. Here, I’ll summarize the steps that went into<br />
the release and what is in store for the next update. Details<br />
will be available at the HETGS calibration web site http://<br />
space.mit.edu/ASC/calib/hetgcal.html and will be presented<br />
at the next meeting of the International Astronomical<br />
Consortium for High Energy Calibration (IACHEC) in<br />
March (see http://web.mit.edu/iachec/meetings/index.html).<br />
First, data were selected from the TGCat online catalog of<br />
HETGS spectra. See http://tgcat.mit.edu to obtain the data<br />
used here. I started with sources of all sorts but relied most<br />
on those with simple continua. Next, the +1 and −1 fluxes<br />
were compared for both MEG and HEG in order to verify<br />
that 1) the chip QEs are consistent and 2) that contamination<br />
correction of one grating “arm” is consistent with the<br />
other (because there is a spatial variation to the contaminant’s<br />
thickness). All fluxes came out to be consistent to<br />
within 1% on average except near 0.5 keV, where the two<br />
sides differ by 3–5% but generally within the statistical uncertainties.
12<br />
Fig. 1 - The ratio of the MEG and HEG fluxes as a function of<br />
wavelength, binned to have 1% uncertainties or bin widths less<br />
than 5% of the central wavelength. The sense of the correction<br />
is that the values shown should be applied to the MEG efficiencies<br />
to bring MEG fluxes into agreement with those derived from<br />
HEG data. The dashed line is a 9th order polynomial fit to the<br />
data.<br />
Fig. 1 shows the ratio of the MEG and HEG fluxes<br />
as a function of wavelength, binned to have 1% uncertainties<br />
so that small systematic errors may be found and<br />
corrected. Because the polynomial fit can correct only<br />
the ratio of the MEG and HEG efficiencies, I allocated the<br />
correction to either the HEG or MEG efficiencies: longer<br />
than a specified wavelength, all corrections are applied<br />
to the HEG, while for shorter wavelengths, the MEG is<br />
corrected. The simple reasoning behind the choice is that<br />
it was somewhat easier to determine HEG efficiencies on<br />
the ground at high energies due to the higher resolution<br />
while harder to measure them at low energies due<br />
to significantly lower effective area. Furthermore, the<br />
HEG part of the HETGS dominates observations at high<br />
energy while the MEG part dominates at low energy, so<br />
a “least harm” dictum suggests applying less correction<br />
where a grating part dominates. I tried several possible<br />
cross-over wavelengths and found that 10 Å minimized<br />
the reduced χ 2 in BL Lac fits (see below).<br />
For about 20 observations of AGN, I applied the<br />
new corrections to the HETGS spectra and fit them to<br />
a simple logarithmic parabola model with four parameters:<br />
Eq. 1<br />
n E =Ae -N Hs(E) E -G+blogE<br />
where N H was fixed for each AGN to an estimate based<br />
on 21 cm data (the results are robust against the exact<br />
choice), and the overall model is a power law with a curvature<br />
term, β. The model is the same as that used for BL<br />
<strong>CXC</strong> Newsletter<br />
Fig. 2 (above)- The curvature parameter β, as a function of reduced<br />
χ 2 for fits to HETGS spectra of AGN. See Eq. 1 for the model,<br />
which defines β.<br />
Fig. 3 (below)- The average residuals for curved power law fits to<br />
the HETGS data for 8 BL Lac objects. For most of the HETGS<br />
range, the systematic deviations are not significant or are less than<br />
3%. Deviations of 5–10% near 6 keV and 0.7 keV will be investigated<br />
further.<br />
Lac objects by Perlman et al. 1 . The curvature term is negative<br />
for spectra that are convex upward and positive for those with<br />
soft or hard excesses. Fig. 2 shows that the quality of the fit is<br />
related to the value of β: better fits are obtained for negative<br />
curvature. The fits with positive curvature were predominantly<br />
radio-loud AGN with emission lines, indicating that these<br />
spectra are actually more complex than a simply curving model<br />
provides. For the remaining analysis, the sources with β < 0.3<br />
were chosen; these were the BL Lac objects PKS 2155-304 and<br />
1H 1426-428. The curvature values are similar to those found<br />
for other BL Lac objects 1 .<br />
The spectral residuals for the BL Lac objects were
Spring, 2012<br />
combined in order to see if there were significant<br />
remaining residuals. Fig 3 shows the result. While<br />
there are possible systematic errors of up to 5% over<br />
the 0.5–7 keV range, most of the deviations are less<br />
than 3%. Residuals to simple fits to the other AGN<br />
(not shown) are also less than 3% over most of the<br />
0.5–7 range and only as large as 5% near 0.7 keV.<br />
Thus, an approximate limit to relative systematic errors<br />
is about 3–5% over the HETGS range. While<br />
these residual errors will be examined further to see<br />
if they can be eliminated, another area of investigation<br />
will be the cross-dispersion selection efficiency,<br />
which is currently applied in the grating RMFs.<br />
Recent HETGS Highlights<br />
The High Energy Transmission Grating<br />
Spectrometer continues to provide excellent spectra<br />
for detailed examination of source properties. Over<br />
the past year, papers have appeared on warm ionized<br />
winds in AGN 2, 3, 8 , the distance and dust to Cyg<br />
X-1 7 , O star winds 5,6 , and an accretion shock at the<br />
surface of V2129 Oph, a classical T Tauri star 4 .<br />
The T Tauri result is highlighted in Fig. 4,<br />
which shows the spatial distribution of the two X-ray emitting<br />
plasma components of V2129 Oph. Left and right cartoons<br />
correspond to the viewing angles of two <strong>Chandra</strong> observing<br />
segments, with observer in the rightward direction<br />
4 . Red region marks the post-shock high density plasma at<br />
3−4 MK, blue regions indicate low density coronal plasma<br />
with T ranging from 2 up to ∼30 MK. The emission measure<br />
(EM) distributions derived from HETGS spectra corresponding<br />
to the two observing segments. Red EM bins<br />
symbolize observed EM values ascribed to post-shock plasma,<br />
while blue bins represent those accounting for coronal<br />
plasma. During segment 1, the pre-shock material does not<br />
block the view of both post-shock and coronal plasma: the<br />
EM distribution is therefore the sum of the EM distributions<br />
of the two components. During segment 2, the preshock<br />
material almost completely absorbs the X-rays of<br />
the post-shock plasma emitted toward the observer, while<br />
coronal emission is mostly unaffected: in this case, all the<br />
X-rays detected are those produced by coronal plasma; the<br />
reconstructed EMD, being only those of coronal plasma,<br />
hence misses the high EM values at 3–4 MK.<br />
References<br />
[1] Perlman, E. S., et al. (2005). ApJ 625:727.<br />
[2] Zhang, S. N., Ji, L., Marshall, H. L., et al. (2011). MNRAS<br />
410:2274.<br />
[3] Mocz, P., Lee, J. C., Iwasawa, K., & Canizares, C. R. (2011).<br />
ApJ 729:30.<br />
Fig. 4 - The emission measure (EM) distributions (below) and schematics<br />
of the physical model (above) are shown for two observations of the<br />
classical T Tauri star V2129 Oph. Most of the emission is from coronal<br />
gas (blue). EM with T of 3–4 MK is attributed to the base of the accretion<br />
stream (right panel, in red), observable in segment 1 but obscured by the<br />
upper part of the accretion stream during the 2nd observation (dashed<br />
red line in lower right panel). See Argiroffi et al. [4] for details.<br />
13<br />
[4] Argiroffi, C., Flaccomio, E., Bouvier, J., et al. (2011). A&A<br />
530:A1.<br />
[5] Mitschang, A. W., Schulz, N. S., Huenemoerder, D. P., Nichols,<br />
J. S., & Testa, P. (2011). ApJ 734:14.<br />
[6] Cohen, D. H., Gagné, M., Leutenegger, M. A., et al. (2011).<br />
MNRAS 415:3354.<br />
[7] Xiang, J., Lee, J. C., Nowak, M. A., & Wilms, J. (2011). ApJ<br />
738:78.<br />
[8] Zhang, S.-N., Gu, Q.-S., Ji, L., & Peng, Z.-X. (2011). Research<br />
in Astronomy and Astrophysics 11:1171.<br />
LETG<br />
Jeremy J. Drake, for the LETG Team<br />
1. Ungainly Aging<br />
Its not unusual for the aging process to cause things to<br />
sag and droop. We will not know how many <strong>Chandra</strong> years<br />
makes one human year until the mission ends, but hopefully<br />
its only about 3 or 4. There is no getting around it<br />
though: after 12 years in orbit <strong>Chandra</strong> is firmly in middle<br />
age.<br />
The HRC-S was born a year or so before the <strong>Chandra</strong><br />
launch, and its aging process began much earlier than
14<br />
the rest of the spacecraft. On the ground it was subjected to<br />
subassembly calibration and “burn in” of the microchannel<br />
plates at count rates of thousands to tens of thousands<br />
of counts per second. Aging in orbit occurs when subjected<br />
to the 1700 V or so of tension between top and bottom<br />
microchannel plates during observations. This voltage<br />
serves to amplify the charge liberated by X-ray photon interactions<br />
with the top microchannel plate surface and its<br />
photoelectric effect-enhancing CsI coating. The resulting<br />
electron cascade within the pores of the plates is the signal<br />
that is detected and enhanced by amplifiers connected to<br />
a fine grid of wires situated beneath the plates. The magnitude<br />
of the signal for a given X-ray photon is referred<br />
to as the “pulse height” and is a measure of the gain of the<br />
instrument.<br />
After years of use and bombardment by the ambient<br />
particle background, the plates “age”, losing some<br />
of their photoelectic efficiency. This occurs primarily<br />
through chemical migration in the bottom plate where all<br />
the charge comes from. The net result is likely to be gain<br />
droop. Part of the routine monitoring of the HRC calls<br />
for regular observations of designated calibration sources<br />
whose behaviour is fairly constant and, if not, hopefully<br />
reasonable well-understood. For the HRC-S, the hot DA<br />
white dwarf HZ43 is the standard effective area monitoring<br />
source. It is thought constant and is the brightest source in<br />
the sky over much of the LETG+HRC-S wavelength range,<br />
providing useful signal from 50–170 Å in exposure times<br />
of 20 ks or so. We observe it every year and look<br />
at the count rates as a function of wavelength<br />
and detector position, and examine the pulse<br />
height distributions of the X-ray events.<br />
Since launch we have observed a slow<br />
secular decline in the LETG+HRC-S count<br />
rates from HZ43. This meant either the discovery<br />
of exciting new white dwarf physics in<br />
which HZ43 is cooling at rates orders of magnitude<br />
faster than theory predicts, with startling<br />
implications for both astrophysics and physics<br />
in general. . . or a change in detector performance.<br />
We discovered the QE decline was accompanied<br />
by a slow decline in the event pulse<br />
height distributions—a sure sign of gain droop.<br />
The gain change itself did not matter too much,<br />
other than making the background filter Brad<br />
Wargelin had painstakingly developed based on<br />
X-ray pulse heights entertainingly more com-<br />
plex to implement. The QE decline was slow—<br />
just a bit more than 1% per year—and so practically<br />
inconsequential considering the absolute<br />
precision of the LETG+HRC-S effective area of<br />
about 15%. After accumulating a decade’s worth<br />
<strong>CXC</strong> Newsletter<br />
of data we thought we had the QE decline well-characterized<br />
and included the effect in the <strong>Chandra</strong> calibration<br />
database by means of time-stamped detector quantum efficiency<br />
(QE) files: when generating effective areas for an<br />
observation in CIAO, the appropriate QE file for the time<br />
of the observation is incorporated automatically.<br />
Perhaps unlike human aging, for detector aging<br />
grey is good. We want to see grey changes—changes that<br />
are essentially uniform with wavelength so that complex<br />
secular energy-dependent calibration models do not have<br />
to be constructed. The HRC-S QE decline looked grey,<br />
though at one time one of us who shall remain nameless<br />
(JJD) foolishly lost his house and all its contents on a bet<br />
that it was non-grey. It did in fact look grey until about<br />
two or so years ago, when we noticed that the longer wavelengths<br />
of the latest observed HZ43 spectra seemed slightly<br />
depressed compared with earlier trends. To define the<br />
trend, more data were needed (Fig. 1), and the non-grey<br />
QE drop is now quite obvious.<br />
Why is the QE decline now non-grey? The bombardment<br />
by ambient particles produces photoelectrons<br />
and detectable signal, just as X-ray events do. The pulse<br />
height distribution for particles is quite different to that of<br />
X-ray photon events, and is essentially flat over the pulse<br />
height range of the former. However, most of the particle<br />
events have low pulse heights, and these events cause the<br />
full pulse height distribution to rise strongly at lower values.<br />
To avoid wasting valuable telemetry on these particle<br />
Fig. 1 - Gain droop on the HRC-S leads to loss of valid events in the longest<br />
wavelength channels. This mid-analysis figure made by “no gain without pain”<br />
expert Brad Wargelin shows trends in count rate for HZ43 in different wavelength<br />
regions. Note the relative decline at later times in the gold, red and<br />
magenta curves for λ > 140 Å.
Spring, 2012<br />
events, they are filtered out onboard. Gain droop though<br />
has meant that the pulse heights of the lowest energy photon<br />
events are now beginning to merge with the background<br />
signal and some some are not being telemetered.<br />
In order to remedy this, we need to raise the detector<br />
gain—a face lift for the sagging. The gain can be increased<br />
by raising the high voltage between the front and rear<br />
plates, enhancing the electron cascade. It is not a trivial<br />
exercise however: taken too far, the high voltage could result<br />
in breakdown and arcing, potentially destroying the<br />
instrument. How did it turn out? See the HRC article on<br />
page 10 to find out.<br />
2. Learning Curve<br />
The LETG+HRC-S effective area curve relies,<br />
more than any of <strong>Chandra</strong>’s other instruments, on inflight<br />
calibration using cosmic X-ray sources. <strong>Chandra</strong> was<br />
largely calibrated on the ground over many weeks through<br />
an extensive military-stye operation directed by Generals<br />
Weisskopf and Tananbaum at the MSFC X-ray Calibration<br />
Facility (XRCF). The best calibration data came from<br />
electron impact point sources (EIPS) in which an electron<br />
beam is accelerated onto an anode with sufficiently high<br />
voltage to excite “K-shell” transitions through removal of<br />
1 s electrons. The X-ray spectrum of such a source usually<br />
has a nice bright K-line on top of a weaker continuum—<br />
a reasonable approximation to a monochromatic X-ray<br />
source (though the full X-ray spectral energy distribution<br />
generally had to be taken into account in analysis).<br />
The problem is that the energy spacing of K lines is rather<br />
sparse—C K at 0.28 keV, B at 0.18, Be at 0.11—and the<br />
HRC-S QE was not necessarily so slowly varying with energy<br />
that we could just join up the dots between the sparse<br />
measurements with straight lines.<br />
XRCF was equipped with good monochromators<br />
that could be operated with continuum sources to select<br />
out nearly monochromatic X-rays of the desired energy.<br />
But the refections inside the monochromators tended to<br />
produce an X-ray beam that was not nearly as uniform as<br />
the beam from the EIPS alone. The calibration method, in<br />
essence, was to compare the detected signal in <strong>Chandra</strong>’s<br />
instruments with beam flux measured both at the telescope<br />
aperture and at some distance up-beam. The beam uniformity<br />
mattered because these beam measurements were<br />
spot measurements made by 4 flow proportional counters<br />
at the mirror entrance and one up-beam—again a problem<br />
of how to join the dots between the sparse measurements.<br />
In addition to these difficulties, the final in-flight high<br />
voltage settings of the HRC-S were optimized to slightly<br />
different values to those employed in ground calibration<br />
leading to expectations of different quantum efficiency between<br />
ground and flight conditions.<br />
15<br />
In Newsletter 13, I described some of the initial<br />
in-flight calibration of the LETGS based on hot white<br />
dwarf spectra (see Pease et al. (2000) for a more detailed<br />
description). <strong>Chandra</strong>’s low energy monitoring “standard<br />
candle” is the hot white dwarf HZ43. With a temperature<br />
of about 50,000 K, it is sufficiently hot to produce useful<br />
signal in the LETG+HRC-S down to about 50 Å or so. But<br />
as a single star, its surface gravity relied on spectral modelling<br />
in the UV-optical range. White dwarf X-ray fluxes are<br />
very sensitive to both the assumed effective temperature,<br />
and the surface gravity, and so a white dwarf with a better<br />
known mass was enlisted to help: Sirius B. The initial<br />
LETGS low energy in-flight calibration was, then, based<br />
on the spectra of HZ43 and Sirius B. Using the best models<br />
and stellar parameters of the day they did not quite agree<br />
where they overlapped though, and we had to do some<br />
guesswork to merge the two spectra and obtain what we<br />
thought was the best “average” effective area curve.<br />
Subsequent years saw some improvements in<br />
the atmospheric models and in understanding the stellar<br />
fundamental parameters, and defects in the effective area<br />
model became apparent. The shorter wavelengths were recalibrated<br />
using blazar spectra, taking advantage of overlap<br />
and cross-calibration with the HETG and ACIS-S detector—see<br />
Newsletters 16 and 17. Some foundations for<br />
a re-calibration at longer wavelengths using HZ43, Sirius<br />
B, and even assuming the spectrum of the isolated neutron<br />
star RXJ 1856 − 3754 might be a pure blackbody, were<br />
made by colleagues at LETG PI institutes MPE and SRON<br />
by Bauermann et al. (2006) and Kaastra et al. (2009). PhD<br />
student Benedikt Menz and long-time colleague Vadim<br />
Burwitz pioneered including another hot white dwarf,<br />
GD153, into the mix. With an effective temperature of<br />
39000 K the latter bridges the effective temperature gap<br />
between HZ43 and Sirius B.<br />
One result of all this work we took advantage of<br />
here was a growing confidence in parameters for HZ43<br />
and that its spectrum was well-represented by pure hydrogen<br />
atmospheric models. We found that by co-adding<br />
10 years’ worth of HZ43 calibration data obtained since<br />
launch enabled us to obtain useful signal down to the C K<br />
edge, meeting up with our earlier blazar calibration. This<br />
offered a promising approach: the much cooler Sirius B<br />
X-ray model fluxes always seemed worryingly sensitive<br />
to fine details of the model atmosphere calculations and<br />
a calibration based on a single reference source—HZ43—<br />
held immense Occam’s razor-like appeal. IT Specialist Nick<br />
Durham carefully accounted for the secular HRC-S QE decline,<br />
and reprocessed the data what must have seemed to<br />
him like several hundred times to account for small ∼1%<br />
level tweaks and perfections in things like higher order<br />
contributions, extraction efficiencies and HRC deadtime
16<br />
Fig. 2 - The before and after test of the new HRC-S QE model based on 10 years of accumulated HZ43 calibration data.<br />
correction uncertainties. Data showing the non-grey gain<br />
sag were carefully excluded. The most up-to-date non-LTE<br />
pure hydrogen atmospheres available were computed by<br />
Thomas Rauch at the Eberhard Karls Universität Tübingen.<br />
Curves, bumps and wiggles in the data/model residuals<br />
were liposuctioned out and the QE smoothed out and<br />
stitched back together. The before and after comparison of<br />
residuals for HZ43 are illustrated in Fig. 2. The largest correction<br />
is the smoothing out of the S-shaped chicane in the<br />
residuals in the 60–90 Å region—a legacy from the earlier<br />
Sirius B-HZ43 compromise.<br />
So, now that the HRC-S gain has been fixed, secular<br />
decline in QE is incorporated and it has been re-calibrated<br />
throughout its working range—covering a huge factor<br />
of 140 in energy—are we finished? Well, the problem is<br />
that the high voltage change to the detector will likely have<br />
an effect on the QE: once the optimum new settings have<br />
been established we will need to start over again. . .<br />
JJD thanks Ralph Kraft and the LETG team for<br />
useful comments and discussion.<br />
References<br />
Beuermann, K., Burwitz, V., & Rauch, T. (2006). A&A 458: 541.<br />
Kaastra, J. S., Lanz, T., Hubeny, I., & Paerels, F. B. S. (2009) A&A<br />
497: 311<br />
Pease, D. O., Drake, J. J., Johnson, C. O., et al. (2000). Proc. SPIE<br />
4012:700.<br />
<strong>CXC</strong> Newsletter<br />
<strong>Chandra</strong> Related Meetings<br />
Check our website for details:<br />
http://cxc.harvard.edu/<br />
50 Years of X-ray Binaries<br />
July 10–12, 2012<br />
DoubleTree Guest Suites, Boston, MA<br />
http://cxc.harvard.edu/cdo/xrb12/<br />
Einstein Fellows Symposium<br />
Fall 2012<br />
http://cxc.harvard.edu/fellows/
Spring, 2012<br />
17
18<br />
Recent Updates to<br />
<strong>Chandra</strong> Calibration<br />
Larry David<br />
There were seven updates to the <strong>Chandra</strong> calibration database<br />
(CALDB) during 2011. These releases contained the<br />
standard quarterly calibration of the ACIS-S and ACIS-I<br />
gains and the yearly calibration of the HRC-I and HRC-S<br />
gains. While the QE of the HRC-I has been very steady, the<br />
QE of the HRC-S along the dispersion direction of LETG<br />
spectra has declined by about 5% during the <strong>Chandra</strong> mission.<br />
The QE at the location of the zeroth order in LETG<br />
spectra has declined by about 8%. The HRC-S QE decline<br />
has been accounted for by producing a separate QE map for<br />
each year since launch. The new HRC-S QE maps apply a<br />
grey correction, i.e., wavelength independent, to all HRC-S<br />
data. Yearly LETG/HRC-S observations of the white dwarf<br />
HZ43 show that the QE loss is essentially grey up to about<br />
2009. More recent observations show that the HRC-S QE<br />
loss is more significant at longer wavelengths. This is discussed<br />
in more detail in the LETG artical on page 13.<br />
During the past year, there were also updates to the<br />
HEG and MEG first order transmission efficiencies and the<br />
LEG higher order transmission efficiencies (m=2–10). The<br />
LEG updates were derived from a deep observation of the<br />
Crab nebula. With the latest LEG transmission efficiencies,<br />
the higher order fluxes are consistent with the first order<br />
flux to within 5–10%. By examining HETG/ACIS-S observations<br />
of a sample of about 30 AGN, we have derived<br />
corrections for the first order transmission efficiencies of<br />
both the HEG and MEG. Using those updated first order<br />
transmission efficiencies, the derived first order HEG and<br />
MEG fluxes are consistent to within about 5%.<br />
The <strong>CXC</strong> calibration team has engaged in a number<br />
of internal cross-calibration studies over the past year.<br />
The supernova remnant G21.5-09 has been observed periodically<br />
by all four focal plane detectors over the course of<br />
the <strong>Chandra</strong> mission. Using the latest CALDB, the derived<br />
G21.5-09 fluxes for on-axis observations with the four focal<br />
plane detectors are consistent to within about 3%.<br />
The <strong>Chandra</strong> calibration team continues to support<br />
the efforts of the International Astronomical Consortium<br />
for High Energy Calibration (IACHEC). Several <strong>CXC</strong> calibration<br />
scientists attended the 4th annual IACHEC meeing<br />
in Villa Grazioli, Italy between April 11–14, 2011. These<br />
meetings bring together calibration scientists from all present<br />
and most future X-ray and g-ray missions. Collaborations<br />
among the calibration scientists have produced sev-<br />
<strong>CXC</strong> Newsletter<br />
eral papers that discuss the current cross-calibration status<br />
of the present fleet of X-ray telescopes. All of these papers<br />
have been published in Astronomy & Astrophysics and they<br />
contain a great deal of useful information for observers.<br />
Useful <strong>Chandra</strong> Web Addresses<br />
To Change Your Mailing Address:<br />
http://cxc.harvard.edu/cdo/udb/userdat.html<br />
<strong>CXC</strong>:<br />
http://chandra.harvard.edu/<br />
<strong>CXC</strong> Science Support:<br />
http://cxc.harvard.edu/<br />
<strong>CXC</strong> Education and Outreach:<br />
http://chandra.si.edu/<br />
ACIS: Penn State<br />
http://www.astro.psu.edu/xray/axaf/<br />
High Resolution Camera:<br />
http://hea-www.harvard.edu/HRC/HomePage.html<br />
HETG: MIT<br />
http://space.mit.edu/HETG/<br />
LETG: MPE<br />
http://www.mpe.mpg.de/xray/wave/axaf/index.php<br />
LETG: SRON<br />
http://www.sron.nl/divisions/hea/chandra/<br />
CIAO:<br />
http://cxc.harvard.edu/ciao/<br />
<strong>Chandra</strong> Calibration:<br />
http://cxc.harvard.edu/cal/<br />
MARX simulator<br />
http://space.mit.edu/ASC/MARX/<br />
MSFC: Project Science:<br />
http://wwwastro.msfc.nasa.gov/xray/axafps.html
Spring, 2012<br />
CIAO 4.4<br />
Improved tools, a new graphical user interface for<br />
plotting and advanced Sherpa functionality<br />
Antonella Fruscione, for the CIAO Team<br />
The newest versions of the <strong>Chandra</strong> Interactive Analysis<br />
of Observations software and the <strong>Chandra</strong> Calibration<br />
Database (<strong>Version</strong> 4.4 of CIAO and CALDB 4.4.7), were<br />
released in December 2011 (http://cxc.harvard.edu/ciao).<br />
These include numerous enhancements and bug fixes with<br />
respect to previous CIAO versions, all listed in detail in the<br />
software release notes. We will describe here some of the<br />
most notable changes and improvements.<br />
CIAO Tools<br />
• acis_find_afterglow is a new tool which improves<br />
over previous algorithms by identifying shorter afterglows<br />
as well as ones with larger gaps between the events comprising<br />
them.<br />
A cosmic-ray “afterglow” is produced when a large<br />
amount of charge is produced by interaction with a charged<br />
particle. Most of the charge is clocked off of the CCD in a<br />
single frame. However, a small amount can be captured in<br />
charge traps, which release the charge relatively slowly. As a<br />
result, a sequence of events can appear in a single pixel over<br />
a few to even a few dozen frames, and the events do not<br />
necessarily occur in consecutive frames; there can be gaps<br />
of several frames with no events for the pixel. In general,<br />
the amount of charge released per frame declines with time.<br />
However, the trend is not monotonic, especially near the<br />
end of an afterglow. More details on afterglows, afterglowidentification<br />
algorithms and how to display the afterglow<br />
events can be found in the “Why Topic” “Cosmic-<strong>Ray</strong> Afterglows”<br />
at http://cxc.harvard.edu/ciao/why/afterglow.html<br />
The tool acis_find_afterglow searches for<br />
afterglows using a short, sliding time window. If there is<br />
a statistically significant excess of events compared to the<br />
expected number of background events, then the excess is<br />
identified as an afterglow unless the excess seems to be associated<br />
with a source that is periodically dithered across the<br />
pixel. The algorithm used to estimate the nominal number<br />
of background events is designed to avoid contamination<br />
by bright sources. Essentially all of the afterglows that have<br />
four or more events are identified by acis_find_afterglow.<br />
The tool acis_find_afterglow also searches<br />
for hot pixels, using an algorithm that is similar to the afterglow-identification<br />
algorithm except that the time window<br />
used is the entire duration of an observation. Events<br />
19<br />
associated with afterglows are ignored during the search for<br />
hot pixels. The tool acis_find_afterglow supersedes<br />
the tools acis_classify_hotpix, acis_detect_<br />
afterglow, acis_find_hotpix, and acis_run_<br />
hotpix for all analyses.<br />
• The Mexican-Hat Wavelet source detection tool wavdetect<br />
now takes an observation-specific PSF map file<br />
(created for example with mkpsfmap) instead of using<br />
<strong>Chandra</strong> PSF table data from the CALDB. Data from other<br />
missions (e.g. ROSAT, XMM-Newton) can also be supported<br />
by providing a psfmap (see “ahelp wavdetect”<br />
for more details).<br />
• The addrsp tool adds together multiple imaging ARFs<br />
(auxiliary response files) and RMFs (response matrix files)<br />
to create a pair of merged ARF and RMF files weighted by<br />
ARFs and exposure. The tool may be run with just ARF files<br />
as input to create a merged ARF weighted by exposures.<br />
The addresp tool may now be used to combine grating<br />
ARFs, creating the same output as the dmarfadd tool. We<br />
have also added support for combining the ARF and RMF<br />
into an RSP file instead of making two separate files.<br />
• The asphist tool bins the aspect solution of an observation<br />
into a 3D histogram of duration vs x and y pointing<br />
offset and roll offset. The value in each bin is the time the<br />
pointing was within that offset bin during the observation,<br />
as modified by the good-time interval (GTI) and deadtime-correction<br />
factor (DTF). The updated algorithm uses<br />
the full tangent plane offset computations and the correct<br />
angle between pointing and North. Both of these changes<br />
improve the accuracy of data reprojected to different tangent<br />
points and/or combined from multi-obi observations<br />
with significantly different pointings.<br />
CIAO Scripts<br />
The CIAO contributed scripts package (http://cxc.<br />
harvard.edu/ciao/download/scripts/) is considered a required<br />
part of the software installation and contains analysis<br />
scripts and modules written by scientists at the <strong>CXC</strong>.<br />
The contributed scripts and modules automate repetitive<br />
tasks and extend the functionality of the CIAO software<br />
package by filling specific analysis needs. The package is<br />
updated about once a month and concurrently with major<br />
CIAO releases. For CIAO 4.4. all scripts were retested<br />
to ensure a smooth running within the new system. Some<br />
scripts, including specifically <strong>Chandra</strong>_repro, combine_spectra<br />
and specextract, were upgraded to<br />
use the new tools and features of CIAO 4.4. For example,<br />
<strong>Chandra</strong>_repro is using the new tool acis_find_<br />
afterglow in place of acis_run_hotpix to identify
20<br />
cosmic ray afterglows and bad pixels in ACIS observations.<br />
In combine_spectra, users can now specify whether<br />
the script should sum or average the PHA exposure times<br />
for the header of the combined spectrum and ARF files. In<br />
specextract, a binning of the sky2tdet WMAP (used<br />
as input to the tool mkwarf) can now be specified: this is<br />
useful for example when making a weighted ARF for a large<br />
region.<br />
The script package has been updated after CIAO<br />
4.4 with a new script splitroi, for splitting the source<br />
and background regions created by the roi (“region of interest”<br />
) tool, and a new module, crates_contrib.<br />
utils, with new routines helpful within CRATES (the<br />
software package developed by the <strong>CXC</strong> to provide a high<br />
level I/O interface for use by Python). Most likely by the<br />
Fig. 1 An example of a ChIPS plotting window (showing the ability to plot filled histograms with<br />
varying opacities) and the corresponding ChIPS GUI panel. Note the ChIPS/Python shell in the<br />
lower part of the GUI panel which allows access to ChIPS and other Python commands.<br />
<strong>CXC</strong> Newsletter<br />
time of printing, further updates to the script package will<br />
be available.<br />
CHIPS<br />
ChIPS (http://cxc.harvard.edu/chips/) is the imaging<br />
and plotting platform for CIAO which can be used during<br />
data analysis—e.g. to plot a lightcurve or a spectrum—<br />
and to create publication-quality figures. ChIPS is designed<br />
for use in a variety of modes: as a user-interactive application<br />
and in batch mode. ChIPS is an importable module for<br />
the Python scripting language and is available as a C/C++<br />
library for software developers. The major updates in the<br />
CIAO 4.4 release are the inclusion of a new ChIPS graphical<br />
user interface (the ChIPS GUI) and improvements to<br />
the <strong>PDF</strong> support (e.g. to support the alpha and opacity settings<br />
of images, regions, and histograms). The ChIPS GUI
Spring, 2012<br />
(Fig.1) allow users to adjust the layout of their plots and<br />
make edits to many of the plot properties. A Python terminal<br />
is built into the GUI, allowing access to ChIPS and other<br />
Python commands. The GUI is available to any process that<br />
creates a ChIPS plot, such as Sherpa and Prism. It can be<br />
launched by right-clicking on on an existing ChIPS window<br />
and selecting “Show GUI”, or by running the show_gui<br />
command from the ChIPS command line. Currently the<br />
GUI allows users to edit the properties of existing visualizations<br />
but does not provide the ability to add or create new<br />
objects.<br />
A large gallery of ChIPS examples is included in<br />
the ChIPS website at http://cxc.harvard.edu/chips/gallery/<br />
and there are a number of introductory threads to guide<br />
beginners.<br />
SHERPA<br />
Sherpa (http://cxc.harvard.edu/sherpa/) is the<br />
modeling and fitting application within CIAO that can be<br />
used for analysis of images, spectra and time series from<br />
many telescopes, including optical telescopes such as Hubble.<br />
Sherpa is flexible, modular and extensible. It has an<br />
IPython user interface and is also an importable Python<br />
module. Sherpa models, optimization and statistical functions<br />
are available via both C++ and Python for software<br />
developers wishing to link such functions directly to their<br />
own compiled code. Important changes and additions to<br />
the Sherpa functionality in the CIAO 4.4 release are described<br />
in a dedicated webpage at http://cxc.harvard.edu/<br />
sherpa/updates.html Among the several improvements to<br />
the software, we highlight two advanced features below.<br />
Bayesian Analysis with pyBLoCXS<br />
pyBLoCXS, a sophisticated Markov chain Monte<br />
Carlo based algorithm designed to carry out Bayesian Low-<br />
Count X-ray Spectral (BLoCXS, van Dyk, et al. 2001) analysis<br />
in the Sherpa environment, is available via several new<br />
Sherpa functions. The algorithm explores parameter space<br />
at a suspected minimum, using a predefined Sherpa model<br />
applied to high-energy X-ray spectral data. pyBLoCXS<br />
supports the ability to flexibly define priors and allows for<br />
variations in the calibration information. It can be used to<br />
compute posterior predictive p-values for the likelihood ratio<br />
test (Protassov et al. 2002) .<br />
Template Models<br />
Sherpa supports a new template model (an extension<br />
of the table model). Sherpa can now read in a collection<br />
of templates from a directory full of template files, and<br />
can compare a data set to all the templates in that collection.<br />
Sherpa finds the template that best matches the data,<br />
and reports back the parameter values associated with that<br />
21<br />
template. The gridsearch optimization method will select<br />
the best template model by trying all of the templates. This<br />
method evaluates the fit statistic for each point in the parameter<br />
space grid; the best match is the grid point with<br />
the lowest value of the fit statistic. Gridsearch reports back<br />
the parameter values associated with this point. The Sherpa<br />
template model supports nearest-neighbor and polynomial<br />
interpolation.<br />
Users interested in hands-on CIAO training should<br />
plan to attend a future CIAO workshop at the <strong>Chandra</strong> X-<br />
<strong>Ray</strong> Center. More information will be posted at http://cxc.<br />
harvard.edu/ciao/workshop/ when available.<br />
More information and updates on CIAO can always<br />
be found at http://cxc.harvard.edu/ciao/ or subscribe<br />
to the CIAO News RSS feed at http://cxc.harvard.edu/ciao/<br />
feed.xml<br />
To keep up-to-date with CIAO news and developments<br />
subscribe to chandra-users@head.cfa.harvard.edu<br />
(send e-mail to ‘majordomo@head.cfa.harvard.edu’, and<br />
put ‘subscribe chandra-users’ (without quotation marks)<br />
in the body of the message).<br />
References<br />
Protassov, R., van Dyk, D.A., Connors, A., Kashyap, V.L., Siemiginowska,<br />
A. (2002). ApJ 571:545.<br />
van Dyk, D.A., Connors, A., Kashyap, V.L., & Siemiginowska, A.<br />
(2001). ApJ 548:224.<br />
The Results of the<br />
Cycle 13 Peer Review<br />
Belinda Wilkes<br />
The observations approved for <strong>Chandra</strong>’s 13th observing<br />
cycle are now in full swing and the Cycle 14 Call for Proposals<br />
(CfP) was released on 15 December 2011. Cycle 12<br />
observations are close to completion.<br />
The Cycle 13 observing and research program was<br />
selected as usual, following the recommendations of the<br />
peer review panels. The peer review was held 21–24 June<br />
2011 at the Hilton Boston Logan Airport. More than 100<br />
reviewers from all over the world attended the review, sitting<br />
on 15 panels to discuss 664 submitted proposals (Fig.<br />
1). The Target Lists and Schedules area of our website provides<br />
lists of the various types of approved programs, including<br />
abstracts. The peer review panel organization is<br />
shown in Table 1.
22<br />
The Cycle 13 CfP included a call for X-ray Visionary<br />
Projects (XVPs) for the first time. XVPs are major, coherent<br />
science programs to address key, high-impact scientific<br />
questions in current astrophysics and requiring 1–6<br />
Ms of observing time. A larger amount of observing time<br />
available due to the lower fraction of an orbit spent within<br />
the radiation belts over the next 2–3 years as <strong>Chandra</strong>’s<br />
orbit evolves. As a result, the observing time available for<br />
GO proposals and Large Projects (LPs) was not impacted<br />
by the XVP allocation. The total amount of time allocated<br />
in Cycle 13 was close to 27 Ms, including 8 Ms awarded<br />
to 4 XVPs and 4.7 Ms to 11 LPs. The response to the new<br />
XVP opportunity was very positive. The over-subscription<br />
for LPs and XVPs was 7.4 and 7.1 respectively. The overall<br />
over-subscription in observing time was 5.4 (Fig. 2), typical<br />
of the past few cycles despite the much larger amount<br />
of time being allocated (Fig. 3). The continued evolution of<br />
the <strong>Chandra</strong> orbit has allowed us to again include XVPs in<br />
the Cycle 14 CfP.<br />
As is our standard procedure, all proposals were<br />
reviewed and graded by the topical panels, based primarily<br />
upon their scientific merit, across all proposal types.<br />
The topical panels produced a rank-ordered list along with<br />
detailed recommendations for individual proposals where<br />
relevant. A peer review report was drafted for each proposal<br />
by one/two members of a panel and edited by the Deputy<br />
panel chair before being delivered to the <strong>CXC</strong>. The topical<br />
panels were allotted <strong>Chandra</strong> time to cover the allocation of<br />
time for GO observing proposals based upon the demand<br />
for time in that panel. Other allocation limits for each panel<br />
were: joint time, TOOs with a < 30 day response, time<br />
constrained observations in each of 3 classes and money to<br />
fund archive and theory proposals. Many of these allocations<br />
are affected by small number statistics in individual<br />
panels so allocations were based on the full peer review<br />
Number<br />
900<br />
800<br />
700<br />
600<br />
500<br />
400<br />
300<br />
200<br />
100<br />
0<br />
Number of Proposals per Cycle<br />
1 2 3 4 5 6 7 8 9 10 11 12 13<br />
Cycle<br />
TOTAL<br />
GO/TOO<br />
LP<br />
VLP<br />
ARCHIVE<br />
THEORY<br />
XVP<br />
Number<br />
Table 1: Panel Organization<br />
Topical Panels:<br />
Galactic<br />
Panels 1,2<br />
Panels 3,4<br />
Panels 5,6,7<br />
Extragalactic<br />
Panels 8,9,10<br />
<strong>CXC</strong> Newsletter<br />
Normal Stars, WD, Planetary<br />
Systems and Misc<br />
SN, SNR + Isolated NS<br />
WD Binaries + CVs, BH<br />
and NS Binaries,<br />
Galaxies: Populations<br />
Galaxies: Diffuse Emission,<br />
Clusters of Galaxies<br />
Panels 11,12,13 AGN, Extragalactic<br />
Surveys<br />
XVP Panel XVP Panel X-ray<br />
Visionary Proposals<br />
Big Project Panel LP and XVP Proposals<br />
over-subscription ratio. Panel allocations were modified,<br />
either in realtime during the review or after its completion,<br />
to transfer unused allocations between panels as needed.<br />
LPs and XVPs were discussed by the topical panels<br />
and ranked along with the GO, archive and theory proposals.<br />
In addition, the XVPs were also discussed and ranked<br />
by a separate XVP/pundit panel. The topical and XVP panels’<br />
recommendations were recorded and passed to the Big<br />
Project Panel (BPP), which includes all topical panel chairs<br />
and members of the XVP panel. The BPP discussed the LPs<br />
and XVPs separately and generated two rank-ordered lists.<br />
Fig. 1: (Left) The number of proposals submitted by proposal type (e.g. GO, LP, Archive etc.) as a function of cycle. (Right): zoom<br />
on lower curves. Since more proposal types have become available in each cycle, the number classified as GO has decreased as other<br />
types increase. The total number of submitted proposals is remarkably constant.<br />
90<br />
80<br />
70<br />
60<br />
50<br />
40<br />
30<br />
20<br />
10<br />
0<br />
Number of Proposals per Cycle (zoom)<br />
1 2 3 4 5 6 7 8 9 10 11 12 13<br />
Cycle<br />
LP<br />
VLP<br />
ARCHIVE<br />
THEORY<br />
XVP
Spring, 2012<br />
Time (Ms)<br />
160<br />
140<br />
120<br />
100<br />
80<br />
60<br />
40<br />
20<br />
0<br />
Time per Cycle<br />
1 2 3 4 5 6 7 8 9 10 11 12 13<br />
Cycle<br />
Time Requested<br />
Time Awarded<br />
Fig. 2: The requested and approved time as a function of cycle in Msecs. This<br />
increased in the first few cycles, the largest effect being due to the introduction<br />
of Very Large Projects (VLPs) in Cycle 5. The increase in requested and awarded<br />
time in Cycle 13 is clear.<br />
BPP panelists updated review reports, as needed, at the review<br />
and remotely over the following 2 weeks. The schedule<br />
for the BPP at the review included time for reading and for<br />
meeting with appropriate panel members to allow coordination<br />
for each subject area. The BPP meeting extended<br />
into Friday afternoon to allow for additional discussion and<br />
a consensus on the final rank-ordered lists to be reached.<br />
The resulting observing and research program for<br />
Cycle 13 was posted on the <strong>CXC</strong> website on 15 July 2011,<br />
following detailed checks by <strong>CXC</strong> staff and approval by the<br />
Selection Official (<strong>CXC</strong> Director). All peer review reports<br />
were reviewed by <strong>CXC</strong> staff for clarity and consistency with<br />
the recommended target list. Formal e-letters informing<br />
the PIs of the results, budget information (when appropriate)<br />
and providing a report from the peer review, were e-<br />
Fig. 3: The final oversubscription<br />
in observing<br />
time based on requested<br />
and allocated<br />
time in each cycle. Again<br />
the numbers are remarkably<br />
constant. The decrease<br />
in Cycle 12 reflects<br />
the 16% larger amount<br />
of time awarded by the<br />
peer review in that cycle<br />
to offset the significantly<br />
increasing observing<br />
efficiency as the orbit<br />
evolved (see article in<br />
2011 Newsletter).<br />
Oversubscription Ratio<br />
8<br />
7<br />
6<br />
5<br />
4<br />
3<br />
2<br />
1<br />
0<br />
Total Oversubscription in Time<br />
mailed to each PI in early August.<br />
1 2 3 4 5 6 7 8 9 10 11 12 13<br />
Cycle<br />
Joint Time Allocation<br />
Constrained Observations<br />
23<br />
<strong>Chandra</strong> time was also allocated to<br />
several joint programs by the proposal review<br />
processes of XMM-Newton (4 proposals)<br />
and Spitzer (2 proposals).<br />
The <strong>Chandra</strong> review accepted joint<br />
proposals with time allocated on: Hubble<br />
(20), XMM-Newton (4), NRAO (12), and<br />
NOAO (2).<br />
As observers are aware, the biggest<br />
challenge to efficient scheduling of <strong>Chandra</strong><br />
observations is in regulating the temperature<br />
of the various satellite components (see<br />
POG Section 3.3.3). In Cycle 9 we instituted<br />
a classification scheme for constrained ob-<br />
servations which accounts for the difficulty<br />
of scheduling a given observation (CfP Section 5.2.8). Each<br />
constraint class was allocated an annual quota based on<br />
our experience in previous cycles. The same classification<br />
scheme was used in Cycles 10–13. In Cycle 13, the quotas<br />
were increased commensurate with the larger amount of<br />
observing time to be awarded. There was a large demand<br />
for constrained time so that not all proposals which requested<br />
time-constrained observations and had a passing<br />
rank (>3.5) could be approved. Effort was made to ensure<br />
that the limited number of constrained observations were<br />
allocated to the highest-ranked proposals review-wide. Detailed<br />
discussions with panel chairs enabled us to record the<br />
priorities of their panels in the event that more constrained<br />
observations could be allocated. Any remaining uncertainty<br />
concerning priorities during the final decision process
24<br />
Oversubscription Ratio<br />
10<br />
9<br />
8<br />
7<br />
6<br />
5<br />
4<br />
3<br />
2<br />
1<br />
0<br />
was discussed with the relevant panel chairs before the recommended<br />
target list was finalized.<br />
The same 3 constraint classes will be retained in Cycle<br />
14 so as to ensure a broad distribution in the requested<br />
contraints. We urge proposers to specify their constraints as<br />
needed by the science.<br />
Cycle 13 observations began<br />
early this year, in July/August, due<br />
to the continuing fall-out from the<br />
spacecraft “MUPS anomaly,” during<br />
the summer of 2009 (described in the<br />
2010 Newsletter) which resulted in<br />
many of the summer Cycle 11 targets<br />
being observed during the summer of<br />
2009. The resulting lack of Cycle 12<br />
summer targets in 2011 meant that<br />
Cycle 13 summer targets were needed<br />
to maintain an efficient schedule. An<br />
announcement was distributed in May<br />
2011 informing Cycle 13 proposers<br />
that they may be called upon for fast<br />
turnaround in checking and confirming<br />
their observation parameters to allow<br />
observation in the summer. Due<br />
to the excellent response of observers<br />
and the diligence of the User Interface<br />
Oversubscription by Category<br />
1 2 3 4 5 6 7 8 9 10 11 12 13<br />
Cycle<br />
GO<br />
LP<br />
VLP<br />
ARCHIVE<br />
THEORY<br />
Fig. 4: The effective over-subscription ratio in terms of observing time for each<br />
proposal type as a function of cycle. Archive and Theory proposal over-subscription<br />
is against available funding. Please note that some of the fluctuations are due<br />
to small number statistics (e.g. Theory proposals).<br />
Early Start for Cycle 13<br />
Observations<br />
NORMAL GALAXIES:<br />
DIFFUSE EMISSION<br />
4%<br />
XVP<br />
<strong>CXC</strong> Newsletter<br />
PIs of proposals with US collaborators<br />
were invited to submit a Cost Pro- posal,<br />
due in Sept 2011 at SAO. In Cycle 13 each<br />
project was allocated a budget based on the<br />
details of the observing program (see CfP<br />
Section 8.4). Awards were made at the allocated<br />
or requested budget levels, whichever<br />
was lower.<br />
Given the early start of observations,<br />
we modified our procedures to facilitate<br />
early award of cost proposals with<br />
observations made in July and August.<br />
Complete proposals submitted before the<br />
7th September deadline and for which observations<br />
had already been made were<br />
treated as high priority, processed and<br />
awarded in mid-October.<br />
The remainder of the award letters were emailed in<br />
late October and November, in good time for the official<br />
start of Cycle 13 on 1 Jan 2012.<br />
Statistics on the results of the peer review can be<br />
found on our website: under “Target Lists and Schedules:”<br />
ACTIVE GALAXIES AND<br />
QUASARS<br />
15%<br />
NORMAL GALAXIES: X-<br />
RAY POPULATIONS<br />
8%<br />
SN, SNR AND ISOLATED<br />
NS<br />
15%<br />
and Mission Planning teams, the updated<br />
procedures ran smoothly and an efficient<br />
schedule was maintained throughout the<br />
summer and beyond.<br />
Time Allocated by Science Category<br />
CLUSTERS OF GALAXIES<br />
17%<br />
BH AND NS BINARIES<br />
12%<br />
Cost Proposals<br />
Proposal Statistics<br />
STARS AND WD<br />
15%<br />
EXTRAGALACTIC<br />
DIFFUSE EMISSION<br />
AND SURVEYS<br />
8%<br />
GALACTIC DIFFUSE<br />
EMISSION AND<br />
SURVEYS<br />
2%<br />
SOLAR SYSTEM<br />
2%<br />
WD BINARIES AND CV<br />
2%<br />
Fig. 5: A pie chart indicating the percentage of <strong>Chandra</strong> time allocated in each science<br />
category. Note that the time available for each category is determined by the demand.
Spring, 2012<br />
select the “Statistics” link for a given cycle. We present a<br />
subset of those statistics here. Fig. 4 displays the effective<br />
over-subscription rate for each proposal type as a function<br />
of cycle. Figs. 5, 6 show the percentage of time allocated to<br />
each science category and to each instrument combination.<br />
Table 2 lists the numbers of proposals submitted and approved<br />
by country of origin.<br />
Table 2: Number of Requested and Approved Proposals<br />
by Country<br />
Country Requested Approved<br />
# Pro- Time # Pro- Time<br />
posals (ksec) posals (ksec)<br />
USA 493 112744.5 149 21591.0<br />
Foreign 171 29150.5 50 5178.0<br />
Country Requested Approved<br />
# Pro- Time # Pro- Time<br />
posals (ksec) posals (ksec)<br />
Argentina 2 200.0<br />
Australia 5 860.0 1 150.0<br />
Belgium 1 250.0<br />
Canada 10 887.0 3 111.0<br />
Chile 1 278.0<br />
China 2 464.0<br />
Denmark 1 160.0<br />
France 10 1085.0 5 345.0<br />
Germany 19 7343.0 5 405.0<br />
Hong Kong 1 10.0<br />
India 6 640.0 1 40.0<br />
Israel 1 180.0<br />
Italy 36 6144.0 9 849.0<br />
Japan 9 917.0 2 200.0<br />
Korea 1 262.0<br />
Netherlands 15 1470.0 4 630.0<br />
Russia 2 94.0<br />
S. Africa 2 1044.0<br />
Spain 9 1140.0 5 480.0<br />
Switzerland 1 50.0 1 50.0<br />
Taiwan 3 281.0 3 281.0<br />
Turkey 1 75.0<br />
U.K. 33 5316.5 11 1687.0<br />
* Note: Numbers quoted here do not allow for the probability<br />
of triggering TOOs<br />
ACIS-S<br />
39%<br />
ACIS-S/LETG<br />
26<br />
these updates will alleviate some of the uncertainty. We<br />
took a hard look at the Fellowship Terms and Conditions<br />
and decided that we could add wording allowing for up<br />
to 12 weeks of unpaid leave for family or medical reasons.<br />
This brings us in-line with the Family and Medical<br />
Leave Act. Since Fellows are not employees but receive a<br />
stipend, in practice this means that we “stop the clock”<br />
for up to 12 weeks and extend the Fellowship beyond the<br />
nominal stop date. We hope this will give some flexibility<br />
to deal with family issues.<br />
Einstein Fellows have had some notable successes<br />
over the past year. Eran Ofek (2009) has moved back to<br />
Israel to take up a faculty position at the Weizmann Institute<br />
of Science. Nico Yunes (2010) and Dovi Poznanski<br />
(2010) have accepted faculty positions at Montana State<br />
University and Tel Aviv University in Israel respectively.<br />
Tamara Bogdanovic (2010) has been offered a faculty<br />
position at Georgia Tech School of Physics upon completion<br />
of her fellowship. When I read the end of year<br />
reports I’m always astonished by the productivity of our<br />
Fellows, but two recent papers merit special mention.<br />
Matthew Kerr (2011), Robin Corbet, Teddy Cheung,<br />
and the Fermi LAT collaboration have a recent (January<br />
2012) paper in Science reporting on the discovery<br />
of periodic emission from the gamma-ray binary 1FGL<br />
J1018.6-5856. This object is one of only three gamma<br />
binaries known and the first to be discovered by the LAT<br />
by searching for a period. The work of Kevin Schawinski<br />
(2009) describing a “young” supermassive black hole was<br />
showcased in a recent press release from Yale University<br />
(http://news.yale.edu/2011/12/01/yale-discovery-youngsupermassive-black-holes-challenges-current-theory).<br />
Congratulations to all the Fellows on a great year, and<br />
we’re looking forward to 2012!<br />
Got Data—Will Publish!<br />
Arnold Rots, Sherry Winkelman,<br />
Glenn Becker<br />
The <strong>Chandra</strong> Data Archive’s bibliography database<br />
(http://cxc.harvard.edu/cgi-gen/cda/bibliography) provides<br />
its users not only with a powerful research tool, it<br />
also allows us to track what happens to all the valuable<br />
<strong>Chandra</strong> observations.<br />
Rather than asking how many papers were published<br />
on <strong>Chandra</strong> observations or how many citations<br />
they received, we started wondering how much of the<br />
<strong>Chandra</strong> data actually result in refereed journal articles<br />
and how often. After a fair bit of experimentation we<br />
<strong>CXC</strong> Newsletter<br />
constructed the graph in Fig. 1. It shows what fraction<br />
of the available <strong>Chandra</strong> exposure time was published—<br />
once, twice, thrice, or more often—as a function of the<br />
data’s age, in steps of one year.<br />
The figure represents the status on 1 August<br />
2011 and includes all non-calibration and non-engineering<br />
observations that were made prior to 1 August 2010.<br />
More precisely, it shows what percentage of exposure<br />
time that has been available for N years or more, was<br />
presented in a paper in a refereed journal, N years after<br />
the observation was first released to the PI.<br />
It turns out that this figure, notwithstanding its<br />
simplicity, yields a lot of information:<br />
• Second publications start about a year after the first,<br />
indicative of the common one-year proprietary period.<br />
• It takes about two and a half years for half the data to<br />
be published.<br />
• After four years the curve starts to flatten.<br />
• At seven years about 85% of the data have been published<br />
and we have nearly reached an equilibrium. This<br />
is a very high percentage.<br />
• Also at seven years, 50% of the data have been published<br />
more than twice, indicative both of the popularity<br />
of the archive, and the utility of the data.<br />
• Beyond ten years the percentage of data published exceeds<br />
90%. However, since that range pertains pretty<br />
much to the data from the early days of the mission, we<br />
are curious to see whether such a percentage will be sustained<br />
for the later years, too.<br />
Similar statistics are not available for other missions<br />
or observatories, but we are confident that the high<br />
percentage of data that gets published represents a high<br />
score, confirming that <strong>Chandra</strong> data are judged extremely<br />
valuable by its user community. Similarly, the statistics<br />
on multiple publications is indicative of the intensive use<br />
that the community makes of the <strong>Chandra</strong> Data Archive.<br />
A more extensive paper on the <strong>Chandra</strong> publication<br />
statistics will appear in the April 2012 issue of PASP<br />
(Volume 124, No. 914).<br />
This kind of information is available thanks to<br />
the extensive bibliographic database that the Archive<br />
Operations Team maintains. We are grateful for the help<br />
we receive from users who provide in their papers explicit<br />
information on which observations they use. We<br />
would like to encourage all <strong>Chandra</strong> Guest Observers<br />
and users of the <strong>Chandra</strong> Data Archive to follow their<br />
example or, even better, to embed Dataset Identifiers in<br />
their manuscripts (see http://cxc.cfa.harvard.edu/cda/<br />
datasetid.html).
Spring, 2012<br />
Percentage of Exposure Time Published<br />
100<br />
80<br />
60<br />
40<br />
20<br />
0<br />
0<br />
Publication Status of Data as a Function of Age<br />
1<br />
2<br />
3<br />
4 5 6 7<br />
Years in Archive<br />
8<br />
9<br />
10<br />
11<br />
No Publications<br />
1 Publication<br />
2 Publications<br />
3 Publications<br />
>3 Publications<br />
<strong>Chandra</strong> Users’ Committee Membership List<br />
The Users’ Committee represents the larger astronomical community for the <strong>Chandra</strong> X-ray Center.<br />
If you have concerns about <strong>Chandra</strong>, contact one of the members listed below.<br />
Name Organization Email<br />
Lee Armus<br />
Franz Bauer<br />
Tiziana DiMatteo<br />
Erica Ellingson<br />
Jimmy A. Irwin<br />
Tim Kallman<br />
Hironori Matsumoto<br />
Jon Miller (Chair)<br />
Pedro Rodriguez<br />
Massimo Stiavelli<br />
John Tomsick<br />
Joan Wrobel<br />
Jaya Bajpayee<br />
Wilt Sanders<br />
Allyn Tennant<br />
Martin Weisskopf<br />
Belinda Wilkes<br />
Fig. 1 - Percentage of the available <strong>Chandra</strong> time published as a function of<br />
the data’s age.<br />
SSC lee@ipac.caltech.edu<br />
SSI fbauer@spacescience.org<br />
CMU tiziana@lemo.phys.cmu.edu<br />
CASA-Colorado erica.ellingson@colorado.edu<br />
University of Alabama jairwin@ua.edu<br />
GSFC Timothy.R.Kallman@nasa.gov<br />
Nagoya University matumoto@u.phys.nagoya-u.ac.jp<br />
University of Michigan jonmm@umich.edu<br />
ESA prodrigu@sciops.esa.int<br />
STScI mstiavel@stsci.edu<br />
UC Berkeley jtomsick@ssl.berkeley.edu<br />
NRAO jwrobel@nrao.edu<br />
Ex Officio, Non-Voting<br />
NASA HQ jaya.bajpayee-1@nasa.gov<br />
NASA HQ wsanders@hq.nasa.gov<br />
NASA/MSFC, Project Science allyn.tennant@msfc.nasa.gov<br />
NASA/MSFC martin@smoker.msfc.nasa.gov<br />
<strong>CXC</strong> Coordinator<br />
<strong>CXC</strong> Director’s Office belinda@head.cfa.harvard.edu<br />
27
28<br />
<strong>CXC</strong> Newsletter<br />
<strong>CXC</strong> 2011 Press Releases Megan Watzke<br />
Date PI Objects Title<br />
10 January<br />
12 January<br />
23 February<br />
Amy Reines<br />
(University of Virginia)<br />
Joey Neilsen<br />
(Harvard)<br />
Dany Page<br />
(National Autonomous<br />
University, Mexico)<br />
Henize 2-10 Surprise: Dwarf Galaxy Harbors Supermassive<br />
Black Hole<br />
GRS 1915+105 Taking the Pulse of a Black Hole System<br />
Cas A<br />
NASA’s <strong>Chandra</strong> Finds Superfluid in Neutron<br />
Star’s Core<br />
29 March Einstein Fellows 2011 Einstein Fellows Chosen<br />
07 April<br />
26 April<br />
11 May<br />
24 May<br />
15 June<br />
26 July<br />
Andrew Levan<br />
(University of Warwick)<br />
Fangjun Lu<br />
(Chinese Academy of<br />
Sciences)<br />
Martin Weisskopf/<br />
Allyn Tennant (MSFC)<br />
Leisa Townsley<br />
(Penn State)<br />
Ezequiel Treister<br />
(University of Hawaii)<br />
Ka-Wah Wong<br />
(University of Alabama)<br />
GRB 110328A<br />
Tycho SNR<br />
Crab Nebula<br />
NASA Telescopes Join Forces to Observe<br />
Unprecedented Explosion<br />
NASA’s <strong>Chandra</strong> Finds Evidence on Origin of<br />
Supernovas<br />
NASA’s Fermi Spots ‘Superflares’ in the Crab<br />
Nebula<br />
Carina Nebula Nearby Supernova Factory Ramps Up<br />
CDFS<br />
NGC 3115<br />
31 August Pepi Fabbiano (CfA) NGC 3393<br />
13 September<br />
17 November<br />
Sebastian Schroeter<br />
(University of Hamburg)<br />
Jerome Orosz<br />
(San Diego State University)<br />
and Lijun Gou (CfA)<br />
NASA’s <strong>Chandra</strong> Finds Massive Black Holes<br />
Common in Early Universe<br />
NASA’s <strong>Chandra</strong> <strong>Observatory</strong> Images Gas<br />
Flowing Toward Black Hole<br />
NASA’s <strong>Chandra</strong> Finds Nearest Pair of<br />
Supermassive Black Holes<br />
CoRoT-2 Star Blasts Planet with X-rays<br />
Cygnus X-1<br />
NASA’s <strong>Chandra</strong> Adds to Black Hole Birth<br />
Announcement
Spring, 2012<br />
STOP for Science!<br />
Kim Arcand and Pat Slane<br />
Young students are often natural scientists. They love<br />
to poke and prod, and they live to compare and contrast.<br />
What is the fastest animal? Where is the tallest<br />
mountain on Earth (or in the Solar System)? Where do<br />
the colors in a rainbow come from? And why do baseball<br />
players choke up on their bats?<br />
Educators work hard to harness this energy and<br />
enthusiasm in the classroom, but particularly at an early<br />
age, exposure to science outside the formal classroom<br />
is crucial to help expand science awareness and hone<br />
science skills. Developed under a grant from <strong>Chandra</strong><br />
EPO with the <strong>CXC</strong>’s Pat Slane, “STOP for Science!”<br />
(STOP) is proving to be a simple but effective program<br />
that raises questions about science topics in such a way<br />
as to capture student interest.<br />
STOP consists of a series of five posters designed<br />
to engage any K–6 student in science through<br />
relatable and recognizable applications to the world in<br />
which we live. The posters can be placed anywhere on<br />
school grounds—from hallways to cafeterias—so that<br />
the program is not seen as only something for “science”<br />
students. The ultimate goal of STOP is to generate<br />
school-wide interest about science that can be sustained<br />
as the STOP displays are changed throughout the year.<br />
Accompanying each poster is a series of question<br />
sheets of increasing difficulty levels that students<br />
answer and submit at a designated location (collection<br />
box, office, etc.). Random prize drawings can be used<br />
to to recognize or celebrate student participation. Although<br />
the focus is building-wide, content can be linked<br />
to classrooms through use of accompanying teacher/facilitator<br />
resource guides.<br />
The following five topics are currently included<br />
in the STOP program:<br />
* How Tall is Tall? asks, “What is the tallest mountain<br />
on Earth?”<br />
* “When Stars Go Boom!” introduces several key ideas<br />
about stars, and focuses in particular on the supernova<br />
explosions that mark the ends of the lives of the most<br />
massive stars.<br />
* “Choke Up on That Bat!” explores the science behind<br />
this technique by introducing the concepts of inertia,<br />
force, and torque, though in somewhat more conceptual<br />
terminology.<br />
* “That’s Fast!” introduces the basic definition of speed,<br />
29<br />
giving simple examples in units that the students can<br />
relate to.<br />
* “Somewhere Over The Rainbow” introduces key ideas<br />
about light—and sunlight in particular—to explain its<br />
behavior when it travels through a raindrop, and how<br />
this results in the formation of rainbows.<br />
If you would like to help establish this program<br />
at a school near you, please visit the web site and request<br />
a copy of the materials at http://chandra.si.edu/<br />
edu/stop/ . If you are interested in helping develop the<br />
next generation of STOP materials, please contact cxcpub@cfa.harvard.edu.<br />
Year of the Solar System<br />
Kim Arcand<br />
The From Earth to the Solar System (FETTSS) is a<br />
project created by the <strong>Chandra</strong> EPO group, in collaboration<br />
with NASA’s Astrobiology Institute, as part<br />
of NASA’s Year of the Solar System that runs through<br />
2012. Building on the success of the <strong>Chandra</strong> EPO’s<br />
From Earth to the Universe project, FETTSS places images<br />
from across the Solar System in public venues such<br />
as parks, libraries and other free-access public venues.<br />
The goal of FETTSS is to show the breadth of<br />
NASA science—from heliophysics to planetary science,<br />
and, of course, multiwavelength astrophysics. The core<br />
of FETTSS is an online repository that encourages replication<br />
of exhibits suitable for local adaptation around<br />
Fig. 1. FETTSS visits Washington, D.C. from June–July, 2011.<br />
Photo Credit: NASA/<strong>CXC</strong>/SAO/J.DePasquale
30<br />
the world, as well as a NASA-funded traveling exhibit<br />
visiting over a dozen US locations from 2011–2012.<br />
Over 70 locations worldwide—from cafés in New Zealand<br />
to malls in Canada—have hosted or have signed<br />
up to host a FETTSS event using the online repository.<br />
For more information on this <strong>Chandra</strong>-led project, visit<br />
http://fettss.arc.nasa.gov/<br />
2011 X-ray Astronomy School<br />
Aneta Siemiginowska<br />
The <strong>Chandra</strong> X-ray Center hosted the 6th International<br />
X-ray Astronomy School at the Harvard-<br />
Smithsonian Center for Astrophysics in Cambridge,<br />
MA on August 1–5, 2011. The 2011 X-ray Astronomy<br />
School, organized jointly by HEASARC at NASA Goddard<br />
Space Flight Center and the <strong>Chandra</strong> X-ray Center,<br />
was designed to introduce graduate students and recent<br />
postdocs to the intricacies of X-ray astronomy. Thirtyone<br />
students from the US, Italy, Spain and Canada attended<br />
the school.<br />
The lectures delivered by experts in the field<br />
emphasized the foundations of X-ray astronomy, physics<br />
of X-ray emission processes, instrumentation and<br />
characteristics of detectors, and analysis methods to-<br />
Fig. 1 - 2011 X-ray Astronomy School Participants<br />
<strong>CXC</strong> Newsletter<br />
wards correct interpretation of the data. The school<br />
also included a hands-on component in which students<br />
analyzed an X-ray dataset of their choice using the standard<br />
software. Students attended lectures in the morning<br />
and practice sessions in the afternoon, and worked<br />
on a variety of projects during the week. On the last<br />
day, each student presented a short summary of their<br />
X-ray Astronomy School Project to the other students<br />
and scientists at the final Symposium. The school web<br />
page contains the program with posted lectures and<br />
links to the science projects: http://cxc.cfa.harvard.edu/<br />
xrayschool/<br />
The book based on the lectures delivered at several<br />
past X-ray astronomy schools was published last fall<br />
by Cambridge University Press as “Handbook of X-ray<br />
Astronomy” edited by Keith Arnaud, Randall Smith<br />
and Aneta Siemiginowska. The book has a web page at<br />
http://xrayastronomyhandbook.com with more information,<br />
tables, figures and errata.<br />
The 2011 X-ray Astronomy School was sponsored<br />
by NASA, the <strong>Chandra</strong> X-ray Center, and XMM-<br />
Newton.
Spring, 2012<br />
Listening to X-ray Data<br />
Wanda Diaz Merced, Matt Schnepps, Nancy<br />
S. Brickhouse, G. Juan M. Luna and Stephen<br />
Brewster<br />
Astronomy is thought of as a visual science, but<br />
astronomers have long since exceeded the wavelength<br />
range of the human eye. We find many ways to represent<br />
otherwise invisible data to our senses. If astronomical<br />
data can be represented in diverse ways, the audience for<br />
which the data are useful becomes more diverse, and our<br />
opportunities for conceptualizing the data expand as well.<br />
At Glasgow University we have developed a tool<br />
for rendering space physics data non-visually, through<br />
sonification. Sonification can open up the space physics<br />
data collection to a new community of researchers now<br />
excluded from space physics research, including the visually<br />
impaired. In addition, the sound of many types of astronomical<br />
data allows for a richer intuitive understanding<br />
of it by everyone.<br />
Sonification can benefit all students and researchers,<br />
allowing them to :<br />
• analyze complex or rapidly/temporally changing data.<br />
• explore large datasets (multi-dimensional datasets).<br />
• intuitively explore datasets in the frequency domain.<br />
• identify new phenomena that current display techniques<br />
miss.<br />
Fig. 1 - The xSonify user interface. Any 1-D data set (e.g., timeseries data, or a spectrum)<br />
can be imported into the application. The software will then sonify the data, converting the<br />
visible amplitudes (upper left), into auditory information that can be heard, augmenting the<br />
visual analysis of the data.<br />
31<br />
• find hidden correlations and patterns masked in visual<br />
displays.<br />
• monitor data while doing something else (background<br />
event-finding).<br />
For instance, when searching solar data for bow<br />
shock and magnetopause crossings, we expect that distinctive<br />
signatures will be especially apparent above the<br />
background noise. These boundary signatures appear<br />
as characteristic changes in the whole spectrum. Other<br />
emissions appear as tones at distinctive frequencies or<br />
time-frequency spectra (such as electron plasma oscillations,<br />
magnetic noise bursts in the magnetosheath, and<br />
whistler mode emissions marking regions of currents).<br />
The xSonify tool sonifies 1-dimensional data from<br />
text files and from CDAWeb heliophysics data holdings.<br />
xSonify is based on Java 1.5 with Java Sound, MIDI, JavaSpeech,<br />
WebStart and Web Services technology. xSonify<br />
features three different sonification modes (Pitch, Loudness,<br />
Rhythm) with various controls (Play, Stop, Loop,<br />
Speed, Time point). It includes capabilities for limited<br />
pre-processing of input data (Limits, Invert, Logarithm,<br />
Averaging). We will further enhance xSonify to handle<br />
all 1-dimensional (as well as multi-dimensional) data and<br />
add additional features. The source code is openly available<br />
at http://xsonify.sourceforge.net under the NASA<br />
Open Source Agreement (NOSA).<br />
The non-visual representation of data (sonification),<br />
made possible through this tool began with NASA<br />
support, starting from the Space Physics Data Faciliy<br />
(S<strong>PDF</strong>) requirement to improve access to heliophysics<br />
data. This project will also meet<br />
the goals of contributing to the<br />
development of the science,<br />
technology, engineering, and<br />
mathematics (STEM) workforce<br />
(especially in under-served and<br />
under-represented communities)<br />
[NASA Education Outcome ED-<br />
1] and attract students to STEM<br />
disciplines [NASA Education<br />
Outcome ED-2].<br />
Sonified X-ray Data<br />
EX Hydrae is a southern<br />
variable star classified as an<br />
eclipsing intermediate polar-type<br />
cataclysmic variable (CV) of the<br />
DQ Her type. As a binary with<br />
an orbital period of 98 minutes,<br />
EX Hya belongs to a small group<br />
of intermediate polars with ultrashort<br />
periods. The observed
32<br />
Fig. 2 - First page of a 29 page musical score corresponding to<br />
the sonification of the FFT of the <strong>Chandra</strong> X-ray lightcurve<br />
of EX-Hya.<br />
67-minute oscillation is believed to be the spin period<br />
of the white dwarf component. A long (~500 ks) <strong>Chandra</strong><br />
observation of EX Hya was obtained with HETG and<br />
ACIS-S. We sonified the EX Hydra X-ray light curve in<br />
pitch mode, normalized to a musical scale, to analyze its<br />
frequency content. Temporal fluctuation information is<br />
portrayed as simultaneously sounded clusters of pitches.<br />
Phase, frequency and time variations as a function of pitch<br />
can be grouped and then extracted from the data. Persistent<br />
or intermittent features in the data may map to interesting<br />
physical parameters of the EX Hya system. Given<br />
the human ability to transform the disturbance reaching<br />
our ears from the space domain to the frequency domain,<br />
this step may be compared to decomposing the data into<br />
different simple modes of oscillation.<br />
We listened to the FFT data, binned into segments<br />
of 10 min each. The frequency information was<br />
represented as musical notes readily familiar to the ear,<br />
and the spin period is easily recovered. A period search<br />
performed by extracting the harmonics showed several<br />
statistically significant periods in the range between 250<br />
and 800 sec.<br />
Perception Experiment<br />
We recently completed perception experiments to<br />
investigate the effectiveness of sonification together with<br />
visual display for compare event detection in the data as<br />
compared to visual display only. A second aim of these<br />
experiments was to investigate whether sonification enhances<br />
data analysis. These rigorous laboratory experiments<br />
on attention control, and human-computer interaction<br />
(HCI), will help identify how combining sonification<br />
<strong>CXC</strong> Newsletter<br />
with visualization can enhance scientific data analysis.<br />
If new efficiencies or new capabilities are identified, our<br />
study seeks to understand how to build on these through<br />
training.<br />
The perception experiments include empirical<br />
measurement of performance. Here, double-peaked radio-frequency<br />
spectra of water maser emission observed<br />
in the corners of active galactic nuclei were simulated by a<br />
pair of gaussians displayed on the screen, over which random<br />
noise was superimposed. Participants were presented<br />
simulated spectra and asked to identify the presence<br />
of a “signal” obscured by noise, at varying signal-to-noise<br />
ratios. Test volunteers experience astronomy data via audio<br />
cues, visual cues, both together, and also both cues<br />
with a sweep line. The volunteers responded to the cues<br />
using the keyboard, and their threshold for detection was<br />
estimated using an algorithm called QUEST (Quick Unbiased<br />
and Efficient Statistical Tree). We hope our results<br />
will bring a more diverse community into data analysis<br />
and will open up a multimodal approach to scientific data.<br />
Acknowledgments<br />
This work has been supported by the Smithsonian<br />
Women’s Committee, the George E. Burch Foundation<br />
Fellowship at the Smithsonian, and the Laboratory for Visual<br />
Learning at the Science Education Department at the<br />
Harvard-Smithsonian Center for Astrophysics .<br />
Fig. 3 - Our experiments simulated the double-peaked H 2 O<br />
emission profiles from active galactic nuclei, here from (a)<br />
NGC 3393 and (b) NGC 591. A double gaussian was used to<br />
simulate the emission peaks, and random noise was added. The<br />
experiments measured the signal-to-noise threshold at which<br />
participants were able to reliably detect the “signal” in the presence<br />
of noise. The experiment compared response sensitivity<br />
in visual presentations, auditory presentations, and combined<br />
visual and auditory presentations to gauge the efficacy of sonification<br />
for promoting detection.