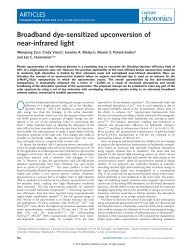
Optimization of the green gas supply chain. Identification of critical ...
Optimization of the green gas supply chain. Identification of critical ...
Optimization of the green gas supply chain. Identification of critical ...

Create successful ePaper yourself
Turn your PDF publications into a flip-book with our unique Google optimized e-Paper software.
PREFACE<br />
This master <strong>the</strong>sis report has been prepared in <strong>the</strong> final stage <strong>of</strong> <strong>the</strong> master program Energy & Envi-<br />
ronmental Sciences (MSc.). This program is <strong>of</strong>fered by <strong>the</strong> Centre for Energy and Environmental<br />
Studies (IVEM) at <strong>the</strong> Faculty <strong>of</strong> Ma<strong>the</strong>matics and Natural Sciences <strong>of</strong> <strong>the</strong> University <strong>of</strong> Groningen<br />
(NL). This research has been performed at KEMA Gas Consulting & Services in Groningen.<br />
To start with, I would like to express my gratitude to senior consultant Harm Vlap, who provided this<br />
research opportunity and who did perfect supervision at KEMA. Additionally I would like to thank<br />
J. Holstein, R. van Ommen, O. Florisson and K. Schlebusch at KEMA for <strong>the</strong>ir valuable input.<br />
Secondly, I would like to acknowledge pr<strong>of</strong>. dr. H.C. Moll and dr. ir. A.A. Bellekom at <strong>the</strong> University<br />
<strong>of</strong> Groningen for <strong>the</strong>ir supervision. They provided my work and process with sharp and useful re-<br />
marks. In addition I would like to thank pr<strong>of</strong>. dr. R.H. Teunter at <strong>the</strong> department for Operations Re-<br />
search (OR) <strong>of</strong> <strong>the</strong> University <strong>of</strong> Groningen for his expertise and assistance in <strong>the</strong> OR related methods<br />
conducted in this <strong>the</strong>sis.<br />
During <strong>the</strong> period at KEMA I have been accompanied by fellow student Anne S. Braaksma. Part <strong>of</strong><br />
<strong>the</strong> literature and data used in this research was analyzed and modeled in cooperation with<br />
A. Braaksma. His sharp view on energy analysis and <strong>the</strong> inspiring discussions we had were very help-<br />
ful and motivating for me. Consequently, I would like to express my gratitude to him. Additionally I<br />
would like to recommend his master <strong>the</strong>sis report, which focuses on <strong>the</strong> overall sustainability <strong>of</strong> <strong>green</strong><br />
<strong>gas</strong>. In that research, he focused on <strong>the</strong> environmental (emissions), economic and social (employment<br />
and competition with food) aspects <strong>of</strong> <strong>green</strong> <strong>gas</strong>.
Summary<br />
Global climate change and <strong>the</strong> need for security <strong>of</strong> energy <strong>supply</strong> drive <strong>the</strong> development <strong>of</strong> bio-energy<br />
production and utilization. Green <strong>gas</strong> is defined as bio-based <strong>gas</strong> that has been upgraded to natural <strong>gas</strong><br />
quality. Amongst o<strong>the</strong>r energy carriers, <strong>green</strong> <strong>gas</strong> can be applied in an existing infrastructure, <strong>of</strong>fering<br />
<strong>the</strong> possibility for a gradual transition to a more renewable energy system. Within <strong>the</strong> transition from<br />
<strong>the</strong> current energy system to a new, more sustainable one, an increasing demand emerges to dispose <strong>of</strong><br />
a generic model to determine <strong>the</strong> optimal pathway from bio<strong>gas</strong> production to <strong>green</strong> <strong>gas</strong> injection.<br />
Gaining knowledge about system integration is indispensable for fur<strong>the</strong>r developments <strong>of</strong> <strong>green</strong> <strong>gas</strong><br />
initiatives and is <strong>of</strong> great importance regarding <strong>the</strong> potential <strong>of</strong> <strong>green</strong> <strong>gas</strong> to contribute to <strong>the</strong> sustain-<br />
ability goals. Therefore this research has <strong>the</strong> following problem statement: Which system design <strong>of</strong> a<br />
<strong>green</strong> <strong>gas</strong> <strong>supply</strong> <strong>chain</strong> is most efficient from an energetic and an economic perspective, based on a<br />
generic model approach?<br />
This research focuses on <strong>the</strong> identification <strong>of</strong> <strong>critical</strong> choices, e.g. capacity scale or choice for tech-<br />
nologies or infrastructure, in designing an efficient (regarding energy requirements and total costs)<br />
<strong>green</strong> <strong>gas</strong> <strong>supply</strong> <strong>chain</strong> (GGSC) and <strong>the</strong>ir consequences. A generic model has been developed to<br />
model <strong>the</strong> possible pathways from biomass to <strong>green</strong> <strong>gas</strong> injection, including data to assess <strong>the</strong> energy<br />
requirements and economics <strong>of</strong> <strong>the</strong> total GGSC. The model focuses on <strong>the</strong> Dutch situation for <strong>green</strong><br />
<strong>gas</strong> from anaerobic digestion <strong>of</strong> biomass.<br />
The first important finding is that scale effects were mainly found in <strong>the</strong> economics <strong>of</strong> <strong>the</strong> GGSC,<br />
which is <strong>the</strong> result <strong>of</strong> depreciation in capital costs. With regard to <strong>the</strong> energy requirements, pipeline<br />
construction shows significant scale effects. Additionally, marginal scale effects were found for diges-<br />
tion. In <strong>the</strong> o<strong>the</strong>r process steps <strong>the</strong> energy requirements are linearly related to <strong>the</strong> output. Secondly, <strong>the</strong><br />
capacity scale determines <strong>the</strong> grid in which <strong>green</strong> <strong>gas</strong> will be injected, since <strong>the</strong> Distribution Grid<br />
(DG) is only limited susceptible for injection <strong>of</strong> <strong>green</strong> <strong>gas</strong> (max 150 Nm 3 /h <strong>green</strong> <strong>gas</strong>, depending on<br />
<strong>the</strong> exact location). Hence, <strong>the</strong> Regional Grid (RG) is <strong>the</strong> only option for injection <strong>of</strong> capacities ex-<br />
ceeding 150 Nm 3 /h. The grid choice also determines whe<strong>the</strong>r or not transportation (ei<strong>the</strong>r biomass or<br />
bio<strong>gas</strong>) is required. The most efficient transportation manner from both <strong>the</strong> energetic and economic<br />
perspectives depends on total distance and capacity scale.<br />
Fur<strong>the</strong>rmore, <strong>the</strong> choice for a certain upgrading technique is <strong>critical</strong> since it influences <strong>the</strong> energy de-<br />
mand for compression to grid pressure. Pressurized water scrubbing and chemical scrubbing were<br />
found to be most economical and efficient respectively.<br />
Concluding, a configuration <strong>of</strong> centralized digestion, upgrading and injection is found to be optimal,<br />
based on <strong>the</strong> developed model. The configuration in which decentralized digestion, upgrading and in-<br />
jection into <strong>the</strong> DG is performed was found to be more beneficial than <strong>the</strong> configuration that includes<br />
biomass (manure and maize silage) transport over more than 60 km. However, since injection into <strong>the</strong><br />
DG is limited to 150 Nm 3 /h <strong>green</strong> <strong>gas</strong>, <strong>the</strong> development <strong>of</strong> additional <strong>green</strong> <strong>gas</strong> initiatives in <strong>the</strong> same
DG area is hampered when applying this system configuration. In contrast, a configuration <strong>of</strong> decen-<br />
tralized digestion, centralized upgrading and injection in <strong>the</strong> RG or <strong>the</strong> configuration in which also <strong>the</strong><br />
digester is located centrally <strong>of</strong>fers <strong>the</strong> opportunity for o<strong>the</strong>r (maybe small) <strong>green</strong> <strong>gas</strong> initiatives to join.<br />
These conclusions were based on certain distances between <strong>the</strong> farms and/or to <strong>the</strong> specific <strong>gas</strong> grids.<br />
Changing <strong>the</strong>se distances will influence <strong>the</strong> absolute results. However, <strong>the</strong> overall conclusion remains<br />
<strong>the</strong> same, since <strong>the</strong> system configuration in which all process steps are performed decentralized is lim-<br />
ited to <strong>the</strong> injection capacity <strong>of</strong> <strong>the</strong> DG. Fur<strong>the</strong>rmore, it should be noted though that cryogenic separa-<br />
tion seems promising since <strong>the</strong> <strong>gas</strong> output pressure could potentially minimize <strong>the</strong> overall <strong>chain</strong> energy<br />
requirements and costs.<br />
Fur<strong>the</strong>r research is recommended on <strong>the</strong> possibilities to enable <strong>the</strong> DG for injection <strong>of</strong> capacities >150<br />
Nm 3 /h <strong>green</strong> <strong>gas</strong>. Additionally it should be noted that promising techniques for in-situ methane en-<br />
richment might result in substantial efficiency enhancement and are <strong>the</strong>reby potentially very important<br />
in fur<strong>the</strong>r developments with regard to optimization <strong>of</strong> <strong>the</strong> GGSC.
Samenvatting [NL]<br />
Wereldwijde klimaatverandering en de noodzaak om energievoorziening in de toekomst zeker te stel-<br />
len scheppen een voedingsbodem voor de ontwikkeling van bio-energieproductie en -toepassing.<br />
Groen<strong>gas</strong> is gedefinieerd als <strong>gas</strong> dat afkomstig is van biomassa, wat is opgewaardeerd naar <strong>gas</strong> van<br />
aard<strong>gas</strong>kwaliteit. Als een van de hernieuwbare-energiedragers kan groen<strong>gas</strong> toegepast worden in een<br />
huidige infrastructuur. Dit geeft mogelijkheden voor een geleidelijke transitie naar een duurzamere<br />
energievoorziening. In de transitie van de huidige energievoorziening naar een meer duurzame, zijn er<br />
in toenemende mate belangen bij een generiek model voor de bepaling van de optimale 'route' van bi-<br />
omassa naar groen<strong>gas</strong>. Systeem analyse zal onvermijdelijk zijn in verdere ontwikkelingen van groen-<br />
<strong>gas</strong> en is van groot belang voor het behalen van duurzaamheiddoelstellingen. In dit onderzoek zal de<br />
volgende onderzoeksvraag beantwoord worden: Bij welke groen<strong>gas</strong> keteninrichting zijn de totale kos-<br />
ten geminimaliseerd en is de ketenefficiëntie het hoogst, gebaseerd op een generiek <strong>gas</strong>keten model?<br />
Dit onderzoek heeft zich gericht op het identificeren van bepalende keuzes bij het ontwerpen van een<br />
optimale groen<strong>gas</strong> keten. Deze keuzes kunnen betrekking hebben op bijvoorbeeld de schaalgrootte,<br />
technologiekeuze <strong>of</strong> keuze van infrastructuur. Een generiek model is ontwikkeld voor de modellering<br />
van de mogelijke groen<strong>gas</strong> routes. Hiermee zijn de totale energiebehoeften en kosten in de keten be-<br />
paald. Het model is gericht op de Nederlandse situatie voor groen<strong>gas</strong> productie uit biomassa vergis-<br />
ting.<br />
Een van de meest belangrijke bevindingen van het onderzoek (i) is dat schaaleffecten vooral aanwezig<br />
zijn voor de economische kant van de groen<strong>gas</strong>productie en invoeding. Gekeken naar de energiebe-<br />
hoeften voor de productie van groen<strong>gas</strong> bleek dat vooral pijpleiding constructie schaaleffecten liet<br />
zien. Bovendien zijn er marginale schaaleffecten gevonden voor vergisting. In de andere processtap-<br />
pen bleek een lineair verband te liggen met betrekking tot schaalgrootte, hier werden dus geen schaal-<br />
voordelen voor de energiebehoefte waargenomen.<br />
Daarnaast (ii) is de keuze voor het <strong>gas</strong>net waarin <strong>gas</strong> ingevoed zal worden van belang omdat het dis-<br />
tributienet, afhankelijk van de exacte locatie, een maximale invoedingscapaciteit van 150 Nm 3 /uur<br />
groen<strong>gas</strong> heeft. Hierdoor is invoeding van grotere capaciteiten gebonden aan het regionale <strong>gas</strong>net. Het<br />
beschikbare type <strong>gas</strong>net bepaalt over het algemeen ook <strong>of</strong> er transport van biomassa <strong>of</strong> bio<strong>gas</strong> nodig<br />
is. Indien transport is vereist, is de keuze tussen biomassa transport (vrachtwagen) <strong>of</strong> bio<strong>gas</strong> transport<br />
(pijpleiding) sterk afhankelijk van de transport afstand en bio<strong>gas</strong> capaciteit.<br />
De keuze met betrekking tot de bio<strong>gas</strong> opwaardeertechniek is tevens van belang (iii). Pressurized wa-<br />
ter scrubbing (PWS) en 'chemical scrubbing' blijken respectievelijk het meest economisch en efficiënt.<br />
Concluderend, de optimale systeemconfiguratie voor groen <strong>gas</strong> is degene waarin biomassa van meer-<br />
dere boerderijen centraal wordt vergist en centraal wordt opgewaardeerd waarna het groen<strong>gas</strong> in het<br />
regionale <strong>gas</strong>net (4.0 MPa) ingevoed wordt. De configuratie waarin alles decentraal gebeurt en waarbij<br />
het <strong>gas</strong> op het distributienet wordt ingevoed, scoort beter dan de centrale verwerkingsoptie waarbij de
transportafstanden van mest en maïs silage groter zijn dan 60 km. Echter, vanwege de beperkte invoe-<br />
dingscapaciteit in het distributienet zal verdere ontwikkeling van groen<strong>gas</strong>projecten gehinderd worden<br />
bij deze configuratie. Invoeding in het regionale <strong>gas</strong>net heeft geen capaciteitsbeperkingen en zal juist<br />
meer mogelijkheden bieden voor groen<strong>gas</strong> ontwikkeling omdat andere (ook kleine) boerderijen zich<br />
zouden kunnen aansluiten bij de configuratie waarin alles centraal verwerkt wordt <strong>of</strong> waarin opwaar-<br />
dering en invoeding centraal gedaan wordt.<br />
Deze conclusies zijn gebaseerd op systeemconfiguraties bij bepaalde afstanden. Veranderingen in de<br />
onderlinge afstanden zal de (absolute) resultaten doen veranderen. Echter, omdat het distributienet (al-<br />
leen relevant voor de configuratie waar geen transport aan te pas komt) maar beperkte mogelijkheden<br />
biedt voor invoeding zal de uiteindelijke conclusie niet veranderen als functie van de bepaalde afstan-<br />
den.<br />
De mogelijkheden om het distributienet toegankelijk te maken voor invoeding van groen<strong>gas</strong> capacitei-<br />
ten >150 Nm 3 /uur zullen moeten worden onderzocht in vervolg studies. Daarnaast zal er meer onder-<br />
zoek (zowel fundamenteel als praktisch) gedaan moeten worden naar innovaties die zich richten op 'in-<br />
situ methaanverrijking'. Deze technieken zouden voor substantiële systeemoptimalisatie kunnen zor-<br />
gen.
Glossary<br />
Bio<strong>gas</strong> Biologically produced <strong>gas</strong> from anaerobic digestion, consisting <strong>of</strong> mainly CH4<br />
(50-75 vol%) and CO2 (25-45 vol%), also traces <strong>of</strong> a.o. H2O, H2S, NH3, O2 and H2<br />
can be found.<br />
CapEx Capital expenditures<br />
CH4<br />
Methane (main component <strong>of</strong> natural <strong>gas</strong>)<br />
CHP Combined Heat and Power unit; production <strong>of</strong> electricity (38%) and heat (50%)<br />
from bio<strong>gas</strong>.<br />
CO2<br />
Carbon dioxide<br />
CRF Capital Recovery Factor<br />
DG Distribution Grid<br />
GGSC Green Gas Supply Chain<br />
Green <strong>gas</strong> Bio<strong>gas</strong> that has been upgraded to natural <strong>gas</strong> quality.<br />
H2S Hydrogen sulfide<br />
HG High pressure Grid<br />
HDPE High-Density Polyethylene<br />
kWh KiloWattHours (1 kWh = 3.6 MJ)<br />
Manure-to-maize Refers to <strong>the</strong> substrate ratio (manure & maize silage) that is fed to <strong>the</strong> digester,<br />
based on weight percentages<br />
MJ Mega Joule (10 6 Joule); in this report MJ refers to '<strong>the</strong>rmal MJ' (in contrast to elec-<br />
trical MJ)<br />
Nm 3 A m 3 <strong>of</strong> <strong>gas</strong> at 'normal' conditions, being at a pressure <strong>of</strong> 0.1013 MPa and a tem-<br />
perature <strong>of</strong> 273.15 K.<br />
MPa Mega Pascal (10 6 Pascal) = 10 bar<br />
OpEx Operational expenditures<br />
PSA Pressure Swing Adsorption<br />
PWS Pressurized Water Scrubber<br />
RG Regional Grid<br />
TotEx Total expenditures<br />
Vol% Percentage <strong>of</strong> volume<br />
WACC Weighted Average Cost <strong>of</strong> Capital: <strong>the</strong> minimum return that should be earned to<br />
satisfy providers <strong>of</strong> <strong>the</strong> capital, or that might be earned by an investment else-<br />
where. In <strong>the</strong> Dutch situation it is assumed to consist <strong>of</strong> 80% liability at 6% inter-<br />
est and 20% equity at 15% interest.
Table <strong>of</strong> contents<br />
1 Introduction ................................................................................................................................. 11<br />
1.1 Relevance <strong>of</strong> this Research.................................................................................................................. 11<br />
1.2 Research Outline.................................................................................................................................. 12<br />
1.2.1 Research Aim .................................................................................................................................. 12<br />
1.2.2 Research Question........................................................................................................................... 12<br />
1.2.3 Sub Questions.................................................................................................................................. 12<br />
1.3 Structure <strong>of</strong> this Report........................................................................................................................ 13<br />
2 Green Gas Supply Chain ............................................................................................................ 15<br />
2.1 Basic Steps........................................................................................................................................... 15<br />
2.1.1 Anaerobic Digestion........................................................................................................................ 15<br />
2.1.2 Gas Upgrading................................................................................................................................ 16<br />
2.1.3 Compression & Injection ................................................................................................................ 18<br />
2.2 Relations within <strong>the</strong> GGSC ................................................................................................................. 20<br />
3 Methodology................................................................................................................................. 23<br />
3.1 System Design <strong>of</strong> this Research .......................................................................................................... 23<br />
3.2 A Generic Model Approach................................................................................................................. 24<br />
3.2.1 Pathways ......................................................................................................................................... 25<br />
3.2.2 Biomass and Bio<strong>gas</strong> Transport Distances....................................................................................... 27<br />
3.2.3 Gas Compression ............................................................................................................................ 27<br />
3.3 Economics <strong>of</strong> <strong>the</strong> GGSC...................................................................................................................... 28<br />
3.4 Energy Requirements <strong>of</strong> <strong>the</strong> GGSC..................................................................................................... 32<br />
3.5 Susceptibility for <strong>Optimization</strong>............................................................................................................ 36<br />
4 Results........................................................................................................................................... 39<br />
4.1 Scale effects......................................................................................................................................... 39<br />
4.1.1 Scale effects on <strong>the</strong> Economics in <strong>the</strong> GGSC .................................................................................. 39<br />
4.1.2 Scale effects on <strong>the</strong> Energy Requirements <strong>of</strong> <strong>the</strong> GGSC.................................................................. 44<br />
4.2 Transition Points <strong>of</strong> Transport Means ................................................................................................. 44<br />
4.3 Upgrading Techniques......................................................................................................................... 45<br />
4.4 Pathways.............................................................................................................................................. 47<br />
4.5 Sensitivity Analysis Transport............................................................................................................. 49<br />
5 Conclusions .................................................................................................................................. 53<br />
6 Discussion..................................................................................................................................... 55<br />
7 Recommendations for fur<strong>the</strong>r research .................................................................................... 57<br />
References ............................................................................................................................................ 61
List <strong>of</strong> figures<br />
Figure 2.1: Basic steps in a <strong>green</strong> <strong>gas</strong> <strong>supply</strong> <strong>chain</strong>. ............................................................................. 15<br />
Figure 2.2: Annual consumption pattern <strong>of</strong> natural <strong>gas</strong> from <strong>the</strong> Distribution Grid. ............................ 19<br />
Figure 3.1: System design <strong>of</strong> <strong>the</strong> generic GGSC model developed. ..................................................... 24<br />
Figure 3.2: Generic overview <strong>of</strong> possible pathways in <strong>green</strong> <strong>gas</strong> <strong>supply</strong> <strong>chain</strong>.................................... 25<br />
Figure 3.3: Generic model approach <strong>of</strong> <strong>the</strong> GGSC. .............................................................................. 26<br />
Figure 3.4: Overview <strong>of</strong> literature about <strong>the</strong> energy requirements in <strong>the</strong> <strong>green</strong> <strong>gas</strong> <strong>supply</strong> <strong>chain</strong>. ....... 33<br />
Figure 4.1: Scale effect on <strong>the</strong> total costs for digestion......................................................................... 40<br />
Figure 4.2: Scale effect on pipeline construction costs. ........................................................................ 40<br />
Figure 4.3: Scale effect on <strong>the</strong> total costs for upgrading techniques..................................................... 41<br />
Figure 4.4: Scale effect on <strong>the</strong> economics <strong>of</strong> compression. .................................................................. 42<br />
Figure 4.5: Total overview <strong>of</strong> scale effects on <strong>the</strong> economics <strong>of</strong> <strong>the</strong> GGSC......................................... 43<br />
Figure 4.6: Total overview <strong>of</strong> scale effect on <strong>the</strong> energy requirements in <strong>the</strong> GGSC........................... 44<br />
Figure 4.7: Transition lines <strong>of</strong> most efficient and economic transport means....................................... 45<br />
Figure 4.8: Energy requirements <strong>of</strong> system configurations with different upgrading techniques......... 46<br />
Figure 4.9: Total costs <strong>of</strong> system configurations with different upgrading techniques......................... 46<br />
Figure 4.10: Normalized results <strong>of</strong> upgrading techniques..................................................................... 47<br />
Figure 4.11: Total energy requirements <strong>of</strong> different pathways ............................................................. 48<br />
Figure 4.12: Total costs <strong>of</strong> different pathways...................................................................................... 48<br />
Figure 4.13: Normalized results <strong>of</strong> pathways........................................................................................ 49<br />
Figure 4.14: Sensitivity <strong>of</strong> transition points. ......................................................................................... 50<br />
Figure 4.15: Sensitivity <strong>of</strong> pathways to changes in total distance......................................................... 51<br />
Figure 4.16: Sensitivity <strong>of</strong> pathways to bio<strong>gas</strong> yield <strong>of</strong> maize silage. .................................................. 52<br />
List <strong>of</strong> tables<br />
Table 2.1: Bio<strong>gas</strong> production and methane content per substrate ......................................................... 15<br />
Table 2.2: Overview <strong>of</strong> Dutch <strong>gas</strong> grid taxonomy ................................................................................ 19<br />
Table 3.1: Main parameters used in <strong>the</strong> economic analysis <strong>of</strong> <strong>the</strong> generic model. ............................... 29<br />
Table 3.2: Specific economics <strong>of</strong> <strong>the</strong> <strong>green</strong> <strong>gas</strong> <strong>supply</strong> <strong>chain</strong>............................................................... 30<br />
Table 3.3: Energy requirements <strong>of</strong> <strong>the</strong> <strong>green</strong> <strong>gas</strong> <strong>supply</strong> <strong>chain</strong>............................................................. 33<br />
Table 3.4: System designs to identify <strong>the</strong> most efficient pathways....................................................... 37<br />
Table 4.1: Trendlines functions in economics <strong>of</strong> process steps in GGSC............................................. 43
1 INTRODUCTION<br />
Production, distribution and application <strong>of</strong> (natural) <strong>gas</strong> has been a big driver in <strong>the</strong> development <strong>of</strong><br />
<strong>the</strong> Dutch economy and resulted in an extended and sophisticated <strong>gas</strong> grid. This fact is now seen as a<br />
major opportunity for developments in renewable <strong>gas</strong> utilization in <strong>the</strong> Ne<strong>the</strong>rlands. Renewable <strong>gas</strong>ses<br />
can be applied in <strong>the</strong> existing <strong>gas</strong> grid, <strong>of</strong>fering <strong>the</strong> possibility for a gradual transition to a more sus-<br />
tainable energy system (Hagen et al., 2001). Within <strong>the</strong> transition from <strong>the</strong> current energy system to a<br />
new, more sustainable one, an increasing need emerges to develop and use a generic model to deter-<br />
mine <strong>the</strong> optimal pathway from bio<strong>gas</strong> production to <strong>green</strong> <strong>gas</strong> injection (Bekkering et al., 2010).<br />
Green <strong>gas</strong> is defined as bio-based <strong>gas</strong> that has been upgraded to natural <strong>gas</strong> quality. Several system<br />
configurations, including an extensive set <strong>of</strong> technologies, can be considered. The choice for a system<br />
design depends on a wide range <strong>of</strong> parameters that are characteristic for each specific case, lacking a<br />
generic framework (Carlos & Khang, 2009). Buchholz et al. (2009) address <strong>the</strong> need for tools that ap-<br />
ply system thinking in bio-energy systems and Pöschl et al. (2010) add <strong>the</strong> need for insight in <strong>the</strong> po-<br />
tential for integrated efficiency enhancement and minimization <strong>of</strong> costs.<br />
This research focuses on <strong>the</strong> identification <strong>of</strong> <strong>critical</strong> choices, e.g. capacity scale or choice for technol-<br />
ogy, in designing an efficient (focused on <strong>the</strong> energy requirements and total costs) <strong>green</strong> <strong>gas</strong> <strong>supply</strong><br />
<strong>chain</strong> and what <strong>the</strong>ir consequences could be. In order to determine <strong>the</strong> <strong>critical</strong> aspects and <strong>the</strong>ir conse-<br />
quences and to draw conclusions on <strong>the</strong> most efficient system design a generic model will be devel-<br />
oped, which includes data on energy requirements and costs <strong>of</strong> <strong>the</strong> processes in <strong>the</strong> <strong>green</strong> <strong>gas</strong> <strong>supply</strong><br />
<strong>chain</strong>. The model is considered to be 'generic' because <strong>the</strong> used methods are not fixed for a specific<br />
geographical area and can be applied to various <strong>green</strong> <strong>gas</strong> <strong>supply</strong> <strong>chain</strong> configurations. The generic<br />
model focuses on <strong>the</strong> Dutch situation for <strong>green</strong> <strong>gas</strong> <strong>supply</strong>.<br />
1.1 Relevance <strong>of</strong> this Research<br />
The Dutch government set <strong>the</strong> goal to realize a 20% sustainable energy share by 2020, relative to <strong>the</strong><br />
1990 level (VROM, 2007). According to Welink et al. (2007) about 10% <strong>of</strong> <strong>the</strong> natural <strong>gas</strong> in <strong>the</strong><br />
Ne<strong>the</strong>rlands can be replaced by <strong>green</strong> <strong>gas</strong> in <strong>the</strong> near future (2030). Bio-based <strong>gas</strong> (bio<strong>gas</strong>) is being<br />
produced mainly from <strong>the</strong> treatment <strong>of</strong> wet organic waste streams in <strong>the</strong> absence <strong>of</strong> oxygen, referred to<br />
as anaerobic digestion. Currently, practically all bio<strong>gas</strong> produced is utilized in combined heat and<br />
power (CHP) units to produce electricity and heat (Mann et al., 2009). Since this heat can barely be<br />
fully used (Gebrezgabher et al., 2010) <strong>the</strong> efficiency <strong>of</strong> bio<strong>gas</strong> when applied in a CHP is likely to be<br />
lower than bio<strong>gas</strong> that has been upgraded to <strong>green</strong> <strong>gas</strong> and injected into <strong>the</strong> <strong>gas</strong> grid (Gebrezgabher et<br />
al., 2010; Welink et al., 2007 & Bekkering et al., 2010).<br />
Bekkering et al. (2010) reviewed <strong>the</strong> possibilities for optimization in <strong>the</strong> <strong>green</strong> <strong>gas</strong> <strong>supply</strong> <strong>chain</strong>. They<br />
state that knowledge about this <strong>supply</strong> <strong>chain</strong> is available on three levels, being macro, meso and micro.<br />
Macro-level knowledge is e.g. about <strong>the</strong> biomass potential <strong>of</strong> a country or how this is related to gov-<br />
ernmental sustainability goals. On <strong>the</strong> opposite is <strong>the</strong> micro-level knowledge which focuses on e.g.<br />
technical and economical aspects <strong>of</strong> specific technologies. The level in between, <strong>the</strong> meso-level, in-<br />
volves system integration (Bekkering et al., 2010). This meso-level is relevant for <strong>the</strong> understanding <strong>of</strong><br />
11
energy systems and changes within energy systems (Schenk et al., 2007). According to Bekkering et<br />
al. (2010) <strong>the</strong> meso-level is important when designing or engineering systems. They found that <strong>the</strong>re is<br />
insufficient knowledge about this meso-level at this moment. Political dissonance in energy transition<br />
strategies partly results from a knowledge gap in energy systems' meso-level dynamics (Schenk et al.,<br />
2007).<br />
Bekkering et al. (2010) address <strong>the</strong> need for research on how different components <strong>of</strong> <strong>the</strong> <strong>green</strong> <strong>gas</strong><br />
<strong>supply</strong> <strong>chain</strong> can be combined in order to optimize <strong>the</strong> <strong>supply</strong> <strong>chain</strong> <strong>of</strong> <strong>green</strong> <strong>gas</strong>. Besides that <strong>the</strong>y<br />
address <strong>the</strong> need to gain insight in optimization measures related to capacity benefits or application<br />
properties. <strong>Optimization</strong> <strong>of</strong> <strong>the</strong> overall <strong>chain</strong> is essential for a feasible expansion <strong>of</strong> <strong>green</strong> <strong>gas</strong> produc-<br />
tion (Mann et al., 2009). Thus, gaining knowledge about system integration is indispensable for fur<strong>the</strong>r<br />
developments <strong>of</strong> <strong>green</strong> <strong>gas</strong> initiatives and is <strong>of</strong> great importance regarding <strong>the</strong> potential <strong>of</strong> <strong>green</strong> <strong>gas</strong> to<br />
contribute to <strong>the</strong> sustainability goals.<br />
1.2 Research Outline<br />
Within <strong>the</strong> transition from <strong>the</strong> current energy system to a new, more sustainable one, a lack emerges<br />
on <strong>the</strong> meso-level knowledge <strong>of</strong> <strong>the</strong> <strong>green</strong> <strong>gas</strong> <strong>supply</strong> <strong>chain</strong>. To fill this gap, relations between <strong>the</strong><br />
steps <strong>of</strong> <strong>the</strong> <strong>green</strong> <strong>gas</strong> <strong>supply</strong> <strong>chain</strong> (from an energetic and economic perspective) and to what extent<br />
<strong>the</strong>se relations could lead to <strong>chain</strong> optimization are identified.<br />
1.2.1 Research Aim<br />
The aim <strong>of</strong> this research is to identify which steps in <strong>the</strong> <strong>green</strong> <strong>gas</strong> <strong>supply</strong> <strong>chain</strong> are susceptible for<br />
optimization (being minimization <strong>of</strong> <strong>the</strong> energy requirements and costs) and which measures could<br />
result in optimization throughout <strong>the</strong> <strong>chain</strong>. A generic model will be developed to determine <strong>the</strong> criti-<br />
cal aspects in <strong>the</strong> <strong>supply</strong> <strong>chain</strong> and <strong>the</strong>ir consequences and to draw conclusions on <strong>the</strong> most efficient<br />
system configuration. The model will include data on energy requirements and costs <strong>of</strong> all processes<br />
(incl. different capacity ranges) in <strong>the</strong> <strong>green</strong> <strong>gas</strong> <strong>supply</strong> <strong>chain</strong> and focuses on <strong>the</strong> Dutch situation.<br />
1.2.2 Research Question<br />
Which system design <strong>of</strong> a <strong>green</strong> <strong>gas</strong> <strong>supply</strong> <strong>chain</strong> is most efficient from <strong>the</strong> energetic and economic<br />
perspective, based on a generic model approach?<br />
1.2.3 Sub Questions<br />
1 Which routes can be considered in <strong>the</strong> <strong>green</strong> <strong>gas</strong> <strong>chain</strong>, and how are <strong>the</strong> steps interrelated?<br />
2 How can a <strong>green</strong> <strong>gas</strong> <strong>supply</strong> <strong>chain</strong> be generically modeled?<br />
3 What are <strong>critical</strong> choices when designing a <strong>green</strong> <strong>gas</strong> <strong>supply</strong> <strong>chain</strong> and what are <strong>the</strong>ir conse-<br />
12<br />
quences?<br />
4 What is <strong>the</strong> effect <strong>of</strong> increasing scale to <strong>the</strong> costs and energy requirements in each process step?<br />
5 What are <strong>the</strong> effects <strong>of</strong> different system configurations on <strong>the</strong> total energy requirements and costs<br />
<strong>of</strong> <strong>the</strong> <strong>green</strong> <strong>gas</strong> <strong>supply</strong> <strong>chain</strong>, according to model calculations?<br />
6 Can transition points in <strong>the</strong> system configuration be identified with regard to energy requirements<br />
and costs?
1.3 Structure <strong>of</strong> this Report<br />
In chapter 2 <strong>the</strong> process steps <strong>of</strong> <strong>the</strong> <strong>green</strong> <strong>gas</strong> <strong>supply</strong> <strong>chain</strong> and <strong>the</strong>ir reciprocal relations are dis-<br />
cussed. In chapter 3 <strong>the</strong> methodology used in this research is explained. Section 3.1 describes <strong>the</strong> sys-<br />
tem design and research boundaries <strong>of</strong> this research, section 3.2 focuses on <strong>the</strong> generic model ap-<br />
proach. In section 3.3. <strong>the</strong> approach to <strong>the</strong> economics in <strong>the</strong> <strong>green</strong> <strong>gas</strong> <strong>supply</strong> <strong>chain</strong> (GGSC) are dis-<br />
cussed, followed by <strong>the</strong> approach to <strong>the</strong> energy requirements (in Section 3.4). In section 3.5 methods<br />
are discussed to find <strong>the</strong> susceptibility within <strong>the</strong> GGSC for optimization. In chapter 4 <strong>the</strong> results are<br />
presented, followed by <strong>the</strong> conclusion in chapter 5. At last, <strong>the</strong> results and conclusions <strong>of</strong> this re-<br />
search are discussed (chapter 6), where after some recommendations for fur<strong>the</strong>r research are given<br />
(chapter 7).<br />
13
2 GREEN GAS SUPPLY CHAIN<br />
The aim <strong>of</strong> this chapter is to give an overview <strong>of</strong> <strong>the</strong> basic steps in a <strong>green</strong> <strong>gas</strong> <strong>supply</strong> <strong>chain</strong>. In general<br />
a complete bio-energy system includes feedstock production, conversion and conditioning technolo-<br />
gies and energy allocation (Buchholz et al., 2009). Considering <strong>the</strong> <strong>green</strong> <strong>gas</strong> <strong>supply</strong> <strong>chain</strong> (GGSC)<br />
four basic steps can be identified, being (i) feedstock <strong>supply</strong>, (ii) anaerobic digestion, (iii) upgrading <strong>of</strong><br />
bio<strong>gas</strong> and (iv) compression and injection <strong>of</strong> upgraded bio<strong>gas</strong> (<strong>green</strong> <strong>gas</strong>) into <strong>the</strong> natural <strong>gas</strong> grid,<br />
presented in Figure 2.1. These process steps are discussed in this chapter. Feedstock <strong>supply</strong> (cultiva-<br />
tion and harvesting) has not been included in this research.<br />
Feedstock<br />
<strong>supply</strong><br />
Transport<br />
<strong>of</strong> Biomass<br />
Figure 2.1: Basic steps in a <strong>green</strong> <strong>gas</strong> <strong>supply</strong> <strong>chain</strong>.<br />
2.1 Basic Steps<br />
2.1.1 Anaerobic Digestion<br />
The process <strong>of</strong> biologically decomposing <strong>of</strong> organic material, in <strong>the</strong> absence <strong>of</strong> oxygen, is called an-<br />
aerobic digestion and produces bio<strong>gas</strong> and digestate (digested residue). Bio<strong>gas</strong> is a mixture consisting<br />
<strong>of</strong> mainly methane (50 – 75 vol% A ) and carbon dioxide (25 – 45 vol%), fur<strong>the</strong>rmore traces <strong>of</strong> a.o. wa-<br />
ter, hydrogen sulfide, ammonia, oxygen and hydrogen can be found (Poeschl et al., 2010; FNR, 2009).<br />
An overview <strong>of</strong> all components present in bio<strong>gas</strong> is presented in Appendix I.<br />
The amount <strong>of</strong> bio<strong>gas</strong> produced and its quality is highly dependent on <strong>the</strong> feedstock digested. Since all<br />
biomass is composed <strong>of</strong> carbohydrates, proteins and fats <strong>the</strong> bio<strong>gas</strong> and methane production per sub-<br />
strate can be expressed as a function <strong>of</strong> <strong>the</strong> composition in <strong>the</strong>se compounds, see Table 2.1. Anaerobic<br />
digestion is common practice at landfills, wastewater treatment plants, composting plants and food and<br />
agricultural residue processing (Abatzoglou et al., 2009).<br />
Table 2.1: Bio<strong>gas</strong> production and methane content per substrate (FNR, 2009).<br />
Bio<strong>gas</strong> production (m 3 / tonne o.d.m. a ) Methane content (vol%) A<br />
Carbohydrates 700 – 800 50 – 55<br />
Proteins 600 – 700 70 – 75<br />
Fats 1,000 – 1,250 68 – 73<br />
a Organic dry matter (o.d.m.)<br />
Anaerobic<br />
Digestion<br />
When processing agricultural products by anaerobic digestion, a distinction can be made between cen-<br />
tralized and decentralized digestion. In <strong>the</strong> Ne<strong>the</strong>rlands 37% <strong>of</strong> all bio<strong>gas</strong> was produced at farms (de-<br />
A Percentage <strong>of</strong> total <strong>gas</strong> volume (vol%)<br />
Bio<strong>gas</strong> pipeline<br />
& compression<br />
Gas Upgrading<br />
Green <strong>gas</strong> pipeline<br />
& compression<br />
Compression &<br />
Injection<br />
15
centralized) in 2008 (CBS, 2009). Small-scale digesters process typically 10,000 tonne per annum<br />
(Pöschl et al., 2010; Gebrezgabher et al., 2010), which is 36,000 tonne per annum<br />
(>500 Nm 3 /h bio<strong>gas</strong>). In <strong>the</strong> Ne<strong>the</strong>rlands <strong>the</strong> average farm-scale bio<strong>gas</strong> production is approximately<br />
300 Nm 3 /h bio<strong>gas</strong> (Bekkering et al., 2010). According to Jingura & Matengaifa (2009) centralized<br />
(large scale) anaerobic digestion is standard technology in Europe.<br />
The abovementioned 50:50 manure-to-maize ratio is considered to be common practice in Europe,<br />
which is related to European regulations (EC 1774/2002 & EC 208/2006) prescribing that a maximum<br />
<strong>of</strong> 50% (weight percentage) <strong>of</strong> co-products (products o<strong>the</strong>r than manure) is allowed to be digested<br />
when <strong>the</strong> digestate will be used as fertilizer on agricultural land (Gebrezgabher et al., 2009). Pöschl et<br />
al. (2010) report that 75% - 80% <strong>of</strong> <strong>the</strong> bio<strong>gas</strong> plants operate with co-digestion <strong>of</strong> cattle manure and<br />
maize silage.<br />
2.1.2 Gas Upgrading<br />
Raw (bio)<strong>gas</strong> derived from anaerobic digestion has to be upgraded in order to comply with natural <strong>gas</strong><br />
quality for transmission by <strong>the</strong> Dutch natural <strong>gas</strong> grid. In this research upgrading is defined as <strong>the</strong> re-<br />
moval <strong>of</strong> CO2, H2S, H2O, NH3 (and some trace components) from bio<strong>gas</strong> in order to realize a methane<br />
content <strong>of</strong> >95% (Reppich et al., 2009; Electrigaz, 2008). The product <strong>gas</strong> is referred to as '<strong>green</strong> <strong>gas</strong>'.<br />
Upgrading techniques can basically be divided into three categories, being biological, physical and<br />
chemical upgrading, or a combination <strong>of</strong> <strong>the</strong> latter two. Biological processes are currently applied<br />
solely for <strong>the</strong> removal <strong>of</strong> H2S from raw bio<strong>gas</strong> (Petersson & Wellinger, 2009; Lems, 2010), not yet for<br />
complete bio<strong>gas</strong> upgrading. Physical upgrading techniques use pressure and/or temperature effects for<br />
methane purification, where chemical processes use chemicals to realize specific absorption properties<br />
in order to dissolve <strong>the</strong> contaminants.<br />
In this section <strong>the</strong> following upgrading techniques will be discussed: pressurized water scrubbing<br />
(PWS), pressure swing adsorption (PSA), chemical scrubbing, membrane separation and cryogenic<br />
separation.<br />
Pressurized Water Scrubbing (PWS)<br />
This technology is based on purely physical properties <strong>of</strong> <strong>gas</strong>es. The difference in solubility character-<br />
istics <strong>of</strong> carbon dioxide (CO2), hydrogen sulfide (H2S) and ammonia (NH3) compared to methane<br />
(CH4) is used by this technology for <strong>gas</strong> separation. Using water as scrubbing agent, carbon dioxide,<br />
hydrogen sulfide and ammonia are washed out counter-currently in a pressurized (
clean water or energy for regeneration (Wellinger & Lindberg, 1999; Reppich et al., 2009). In this case<br />
regeneration is <strong>of</strong>ten realized by stripping <strong>the</strong> solvent with air or by slight heating <strong>of</strong> <strong>the</strong> solvent, for<br />
<strong>the</strong> controlled release <strong>of</strong> CO2, H2S and NH3 (DENA, 2009). This energy or water requirement is <strong>the</strong><br />
main reason that this technology is <strong>of</strong>ten to be found at sewage water treatment plants, which are able<br />
to <strong>supply</strong> water at low costs (Bruinsma, 2007). According to Petersson & Wellinger (2009) PWS is <strong>the</strong><br />
most applied bio<strong>gas</strong> upgrading technique.<br />
Pressure Swing Adsorption (PSA)<br />
With pressure swing adsorption carbon dioxide is separated from <strong>the</strong> (bio)<strong>gas</strong> stream by specific ad-<br />
sorption characteristics on a certain adsorbing material, which generally is activated carbon or molecu-<br />
lar sieves (zoelites) (Petersson & Wellinger, 2009). Compressed bio<strong>gas</strong> (0.5 – 1.4 MPa) is cooled to <<br />
40 °C and enters <strong>the</strong> PSA column where carbon dioxide will be adsorbed by <strong>the</strong> adsorbing material<br />
(Reppich et al., 2009). After <strong>the</strong> methane rich <strong>gas</strong> has left <strong>the</strong> column, <strong>the</strong> pressure inside is decreased<br />
to atmospheric pressure in order to regenerate <strong>the</strong> absorbing material (CO2 is being released again)<br />
(Klinski, 2006). In order to realize high regeneration <strong>of</strong> <strong>the</strong> adsorbent, <strong>the</strong> last step generally involves<br />
vacuum pressure. Therefore, this technology is also referred to as Vacuum Pressure Swing Adsorption,<br />
VPSA (DENA, 2009; Reppich et al., 2009). In practice four, six or nine vessels are being used to op-<br />
erate <strong>the</strong>se processes <strong>of</strong> adsorption and desorption <strong>of</strong> CO2. Since H2S is adsorbed irreversibly, <strong>the</strong> ad-<br />
sorbing material will get heavily damaged when adsorbed H2S is brought into contact with water or<br />
moisture (Persson, 2009). Therefore hydrogen sulfide removal and <strong>gas</strong> conditioning are required be-<br />
fore PSA is applied. However, <strong>the</strong>se steps are generally included in full scale PSA units.<br />
Chemical scrubbing<br />
Just as water scrubbing, chemical scrubbing uses solubility characteristics <strong>of</strong> <strong>gas</strong>es in some agent.<br />
However, with chemical scrubbing <strong>the</strong> solubility characteristics are enforced by addition <strong>of</strong> specific<br />
chemicals to <strong>the</strong> scrubbing agent in order to realize high dissolving rates, at atmospheric pressure<br />
(DENA, 2009; Persson, 2003). The chemical binding forces are stronger than <strong>the</strong> purely physical<br />
forces, meaning that a much larger loading <strong>of</strong> <strong>the</strong> scrubbing agent can be achieved (Urban et al.,<br />
2009). The chemicals that are <strong>of</strong>ten used are mainly Monoethanolamine (MEA) or Diethanolamine<br />
(DEA). Therefore this technique is also known as Amine wash (Reppich et al., 2009). A drawback <strong>of</strong><br />
<strong>the</strong>se technologies is that regeneration <strong>of</strong> <strong>the</strong> scrubbing agent has high energy requirements. Generally<br />
<strong>the</strong> chemical sorbents are regenerated by a high <strong>the</strong>rmal energy input, e.g. by boiling <strong>of</strong> <strong>the</strong> scrubbing<br />
agent or by addition <strong>of</strong> steam (DENA, 2009; Persson, 2003).<br />
Membrane separation<br />
By using a membrane <strong>gas</strong> separation takes place through a mutual difference in transport rates <strong>of</strong><br />
components through a membrane. Whe<strong>the</strong>r or not <strong>gas</strong> is transported through <strong>the</strong> membrane depends<br />
on particle size or <strong>the</strong> affinity (de Hullu et al., 2008). The rate <strong>of</strong> permeation is determined by <strong>the</strong> dif-<br />
fusion characteristics (difference in partial pressure) <strong>of</strong> <strong>the</strong> components (Kapdi et al., 2005). Accord-<br />
ing to Reppich et al. (2009) and Kapdi et al. (2005) <strong>the</strong> permeability <strong>of</strong> CO2 and H2S are 20 and 60<br />
17
times, respectively, higher than <strong>the</strong> permeability <strong>of</strong> methane. Generally, 2.5 – 4.0 MPa is needed to<br />
operate <strong>the</strong> process (Hagen et al., 2001). Depending on <strong>the</strong> exact membrane used and <strong>the</strong> exact bio<strong>gas</strong><br />
composition, pre treatment <strong>of</strong> bio<strong>gas</strong> might be required in order to avoid damage or fouling <strong>of</strong> <strong>the</strong><br />
membrane (Wellinger & Lindberg, 1999; de Hullu, 2008). Usually bio<strong>gas</strong> passes through a filter in<br />
order to capture aerosols, water or oil droplets before entering <strong>the</strong> membrane (Petersson & Wellinger,<br />
2009).<br />
Cryogenic separation<br />
Cryogenic separation (or low temperature condensation and distillation) involves separation based on<br />
physical <strong>gas</strong> properties (Kapdi et al., 2005). By a combination <strong>of</strong> compression and cooling, <strong>gas</strong>es are<br />
liquefied at <strong>the</strong>ir specific dew point (Reppich et al., 2009). Bio<strong>gas</strong> is compressed to approximately 8.0<br />
MPa and cooled to – 45 °C in order to produce liquefied CO2 (Kapdi et al., 2005). However, <strong>the</strong>se op-<br />
erating conditions vary per supplier. De Hullu et al. (2008) report information <strong>of</strong> <strong>the</strong> cryogenic tech-<br />
nology <strong>of</strong> DMT (a Dutch supplier <strong>of</strong> bio<strong>gas</strong> upgrading facilities) that operates at –90 °C and 4.0 MPa.<br />
Low temperature distillation is a very effective technology to separate different compounds from bio-<br />
<strong>gas</strong>. Although <strong>the</strong> energy requirements <strong>of</strong> <strong>the</strong> cryogenic technology are substantial (Zwart, 2009), it<br />
has two major advantages. The product <strong>gas</strong> (98% methane) becomes available at operating pressure.<br />
Besides, <strong>the</strong> waste stream from cryogenic upgrading, being liquid CO2, has a significant market value<br />
(Janssen et al., 2010).<br />
2.1.3 Compression & Injection<br />
Utilizing bio<strong>gas</strong> in <strong>the</strong> national <strong>gas</strong> grid requires <strong>gas</strong> conditioning and upgrading (see section 2.2) to<br />
specific grid specifications, addition <strong>of</strong> THT (Tetrahydrothi<strong>of</strong>een) for odorization, compression to grid<br />
pressure and continuous measurements <strong>of</strong> <strong>gas</strong> quality and specifications. Since <strong>the</strong> Ne<strong>the</strong>rlands con-<br />
sists <strong>of</strong> different grid types, <strong>gas</strong> specifications can vary. In this section <strong>the</strong> different Dutch <strong>gas</strong> grids<br />
are discussed. This part is based on previous IVEM research done by Braaksma (2010) on <strong>the</strong> techni-<br />
cal potential for <strong>green</strong> <strong>gas</strong> utilization, documentation from Gas Transport Services (GTS, 2009) and<br />
interviews with experts from KEMA (Vlap, 2010; Holstein, 2010)<br />
Grid Taxonomy<br />
Green <strong>gas</strong> is currently only injected in <strong>the</strong> Groningen quality natural <strong>gas</strong> (G-<strong>gas</strong>) network. G-<strong>gas</strong><br />
transport in <strong>the</strong> Ne<strong>the</strong>rlands is done on three levels. Upstream <strong>the</strong> High Pressure Grid (HG) operates at<br />
a pressure <strong>of</strong> 6.7 MPa (ranging from 6.0 – 8.0 MPa). The HG is connected to large storage facilities<br />
resulting in a great ability to handle seasonal fluctuations caused by varying demand. Fur<strong>the</strong>rmore <strong>the</strong><br />
HG is connected to <strong>the</strong> downstream Regional Grid (RG), large industry and border connections with<br />
neighboring countries. Downstream, <strong>gas</strong> is transmitted by <strong>the</strong> RG, operating at a pressure <strong>of</strong> 4.0 MPa.<br />
This RG is connected to industry and to <strong>gas</strong> reduction stations for pressure reduction to <strong>the</strong> distribution<br />
network. The distribution network operates at pressures
Ne<strong>the</strong>rlands (Tilburg et al., 2008a; Vlap, 2010). In Table 2.2 <strong>the</strong> main characteristics <strong>of</strong> <strong>the</strong> different<br />
grid types are presented.<br />
Table 2.2: Overview <strong>of</strong> Dutch <strong>gas</strong> grid taxonomy (Braaksma, 2010; GTS, 2009; Vlap, 2010).<br />
Characteristics High Pressure Grid<br />
(HG)<br />
Regional Grid (RG) Distribution Grid<br />
(DG)<br />
Pressure 6.7 MPa 4.0 MPa
Gas specifications and interchangeability<br />
Raw bio-based <strong>gas</strong>es cannot be directly injected into <strong>the</strong> natural <strong>gas</strong> infrastructure, <strong>gas</strong> upgrading is<br />
needed to comply with <strong>the</strong> specifications <strong>of</strong> <strong>the</strong> specific infrastructure. The exact specifications to<br />
which <strong>green</strong> <strong>gas</strong> should comply in order to be injected in <strong>the</strong> natural <strong>gas</strong> grid in <strong>the</strong> Ne<strong>the</strong>rlands are<br />
presented in Appendix I. Changes in <strong>the</strong> <strong>gas</strong> composition might have negative downstream effects on<br />
<strong>the</strong> <strong>gas</strong> infrastructure and/or end use appliances. Significant concentrations <strong>of</strong> CO2 in <strong>the</strong> high pressure<br />
natural <strong>gas</strong> infrastructure might result in pipeline corrosion, particularly when coming in contact with<br />
water or water vapor (Levinsky, 2009). Similar effects on pipeline integrity occur when H2S is present.<br />
Ammonia corrodes copper and some rubbers (present in domestic equipment) and siloxanes present in<br />
<strong>gas</strong> might deposit as sand in equipment when combusted (Levinsky, 2009).<br />
Fur<strong>the</strong>rmore, hydrogen, carbon monoxide and carbon dioxide radically change combustion behavior<br />
(Levinsky, 2009). E.g. <strong>the</strong> concentration in which hydrogen is present in <strong>gas</strong> determines <strong>the</strong> burning<br />
velocity, resulting in higher burning velocity when higher concentrations <strong>of</strong> hydrogen are present and<br />
vice versa (Levinsky, 2009; Gersen et al., 2008). Since <strong>the</strong> <strong>gas</strong> infrastructure and downstream appli-<br />
ances are designed for a very specific <strong>gas</strong> composition, small changes might have major safety conse-<br />
quences. Hence, bio<strong>gas</strong> upgrading is required for injection in <strong>the</strong> natural <strong>gas</strong> network.<br />
2.2 Relations within <strong>the</strong> GGSC<br />
A <strong>supply</strong> <strong>chain</strong> in which biomass is converted and finally utilized as an energy source is a complex<br />
system in which numerous logistic options are available (Diekema et al., 2005). Locating a facility is<br />
seen as a <strong>critical</strong> aspect <strong>of</strong> strategic system design in a wide range <strong>of</strong> sectors (Rentizelas & Tatsiopou-<br />
los, 2010). The decision on a certain location might have great effects on <strong>the</strong> system design and will<br />
also affect investment and operational costs since both upstream and downstream consequences have<br />
to be taken into account (Rentizelas & Tatsiopoulos, 2010). Besides, <strong>the</strong> location <strong>of</strong> a bio-energy facil-<br />
ity affects <strong>the</strong> optimal scale <strong>of</strong> <strong>the</strong> plant (Polman et al., 2007). According to Amigun & Blottnitz<br />
(2010) <strong>the</strong> consideration whe<strong>the</strong>r to build small/medium scale decentralized bio<strong>gas</strong> plants or large<br />
scale centralized bio<strong>gas</strong> plants is <strong>of</strong> great importance.<br />
Scale effects vs. transport<br />
When considering <strong>the</strong> economic relations within <strong>the</strong> <strong>green</strong> <strong>gas</strong> <strong>supply</strong> <strong>chain</strong>, economies <strong>of</strong> scale might<br />
have influence on <strong>the</strong> total costs for <strong>green</strong> <strong>gas</strong>. For both digestion and upgrading <strong>the</strong> capacity scale<br />
influences <strong>the</strong> specific costs (Welink et al., 2007). Taking advantage <strong>of</strong> economies <strong>of</strong> scale for diges-<br />
tion would <strong>of</strong>ten require centralized anaerobic digestion (cD), meaning that transport <strong>of</strong> biomass from<br />
numerous sources to <strong>the</strong> cD plant is needed (Ghafoori & Flynn, 2007). In this case <strong>the</strong> upgrading tech-<br />
nology would also benefit from economies <strong>of</strong> scale since large amounts <strong>of</strong> bio<strong>gas</strong> are produced. An-<br />
o<strong>the</strong>r option to benefit from economies <strong>of</strong> scale in <strong>the</strong> upgrading step is to operate decentralized diges-<br />
tion (dD) at various locations and transport <strong>of</strong> raw bio<strong>gas</strong> to a centralized upgrading (cU) plant, in this<br />
way biomass transport is avoided. Such a system design is referred to as a "Bio<strong>gas</strong> Hub" or "Green<br />
Gas Hub" and is gaining popularity in The Ne<strong>the</strong>rlands. The first project to realize such a hub in <strong>the</strong><br />
Ne<strong>the</strong>rlands has started since February 2010 and more projects are planned (PNG, 2010).<br />
20
Combining technologies<br />
According to Ooka & Komamura (2009) <strong>the</strong> optimal design <strong>of</strong> an energy system is, amongst o<strong>the</strong>rs,<br />
dependent on <strong>the</strong> choice for certain technologies within <strong>the</strong> system. Application <strong>of</strong> bio<strong>gas</strong> in <strong>the</strong> natu-<br />
ral <strong>gas</strong> grid requires upgrading and <strong>gas</strong> conditioning, after which it must be compressed to grid pres-<br />
sure to be injected. The choice for a certain upgrading technique can influence downstream costs (en-<br />
ergetic and economic) for compression (van Tilburg et al., 2008b). This might have major conse-<br />
quences for both <strong>the</strong> energetic and economic efficiency <strong>of</strong> <strong>the</strong> <strong>green</strong> <strong>gas</strong> <strong>supply</strong> <strong>chain</strong>.<br />
21
3 METHODOLOGY<br />
In this research a generic model approach to <strong>the</strong> <strong>green</strong> <strong>gas</strong> <strong>supply</strong> <strong>chain</strong> (GGSC) is presented. Section<br />
3.1 deals with <strong>the</strong> system design <strong>of</strong> this research and describes <strong>the</strong> system boundaries. In section 3.2<br />
<strong>the</strong> generic model approach is discussed. In section 3.3. <strong>the</strong> approach to <strong>the</strong> economics in <strong>the</strong> GGSC is<br />
discussed, followed by <strong>the</strong> approach to <strong>the</strong> energy requirements (in Section 3.4). Section 3.5 deals<br />
with <strong>the</strong> methods used to find <strong>the</strong> susceptibility for optimization within <strong>the</strong> GGSC.<br />
3.1 System Design <strong>of</strong> this Research<br />
The focus <strong>of</strong> this research is on <strong>the</strong> energy requirements and costs <strong>of</strong> <strong>green</strong> <strong>gas</strong> production. Revenues<br />
<strong>of</strong> <strong>green</strong> <strong>gas</strong> are excluded since <strong>the</strong>se are highly dependent on subsidy regulations, which may vary<br />
over time. The system boundaries <strong>of</strong> this research are presented in Figure 3.1. This figure is specified<br />
for <strong>the</strong> system design <strong>of</strong> <strong>the</strong> assessment <strong>of</strong> <strong>the</strong> energy requirements considered in this research. Con-<br />
cerning <strong>the</strong> economics <strong>of</strong> <strong>the</strong> GGSC <strong>the</strong> figure is similar, except for <strong>the</strong> fact that 'Indirect' effects (such<br />
as costs embedded in <strong>the</strong> capital needed to produce <strong>the</strong> digestion or upgrading facility) are excluded.<br />
Fur<strong>the</strong>rmore, <strong>the</strong> focus is on <strong>the</strong> Dutch situation for <strong>green</strong> <strong>gas</strong>.<br />
Feedstock <strong>supply</strong> has not been included, since feedstock <strong>supply</strong> is needed for all <strong>supply</strong> <strong>chain</strong> configu-<br />
rations. Therefore, this will not be a <strong>critical</strong> factor in <strong>the</strong> identification <strong>of</strong> <strong>the</strong> susceptibility to optimi-<br />
zation <strong>of</strong> <strong>the</strong> <strong>supply</strong> <strong>chain</strong>.<br />
Transport <strong>of</strong> substrates (manure and maize silage) and digestate is included since that is assumed to be<br />
inevitable when performing centralized anaerobic digestion, besides, strong indications exist that<br />
transport is a <strong>critical</strong> factor in <strong>the</strong> GGSC (Ghafoori et al., 2007 and Caputo et al., 2005). Transporta-<br />
tion <strong>of</strong> <strong>gas</strong> is assumed to be done only by HDPE pipelines. These pipelines are assumed to transport<br />
ei<strong>the</strong>r bio<strong>gas</strong> or <strong>green</strong> <strong>gas</strong> (dependent on <strong>the</strong> system configuration) at a pressure <strong>of</strong> 0.5 MPa. Digestion<br />
<strong>of</strong> substrates is in this research restricted to a manure-to-maize ratio <strong>of</strong> 50:50 (as in Pöschl et al.,<br />
2010), with a capacity range <strong>of</strong> 100 – 2000 Nm 3 /h bio<strong>gas</strong>. Injection into <strong>the</strong> HG (6.7 MPa) is excluded<br />
from this research since <strong>the</strong> grid operator (Gas Transport Services) does not allow for injection into<br />
this grid (Vlap, 2010).<br />
23
Figure 3.1: System design <strong>of</strong> <strong>the</strong> generic GGSC model developed.<br />
Direct energy requirements considered in this research are translated through <strong>the</strong> direct fossil fuel use,<br />
electricity use and heat consumption. The indirect energy requirements considered are <strong>the</strong> energy re-<br />
quirements embodied in <strong>the</strong> vehicle, maintenance <strong>of</strong> <strong>the</strong> road, production <strong>of</strong> <strong>the</strong> materials for pipelines<br />
and <strong>the</strong> conversion <strong>of</strong> electricity to primary energy at centralized power plants. Primary energy em-<br />
bodied in <strong>the</strong> vehicles represents <strong>the</strong> energy needed to produce <strong>the</strong> vehicle materials and for <strong>the</strong> pro-<br />
duction <strong>of</strong> <strong>the</strong> spare parts that will be applied over its useful life.<br />
The energy requirements for injection are reflected through compression to grid pressure. In <strong>the</strong> eco-<br />
nomic assessment costs for injection are composed <strong>of</strong> both compression costs and costs for <strong>the</strong> physi-<br />
cal connection to <strong>the</strong> grid (including measurement and control equipment). Energy requirements and<br />
costs for odorization <strong>of</strong> <strong>green</strong> <strong>gas</strong> are not included in this research since this is still in an experimental<br />
phase for <strong>the</strong> relatively low flow rates <strong>of</strong> <strong>green</strong> <strong>gas</strong> (Vlap, 2010). Also digestate processing is not in-<br />
cluded, however it is assumed that manure transport to e.g. a centralized digester inevitably results in<br />
digestate transport back to <strong>the</strong> farms. It is assumed that 90% <strong>of</strong> <strong>the</strong> total substrate input will become<br />
digestate (Bermejo & Ellmer, 2010).<br />
3.2 A Generic Model Approach<br />
A generic GGSC model is in this report defined as a model that can be applied to various GGSC con-<br />
figurations and is not fixed to a specific geographical area within <strong>the</strong> Ne<strong>the</strong>rlands.<br />
24<br />
Manure<br />
Maize<br />
silage<br />
Refinery<br />
Indirect Energy Requirements<br />
Transport <strong>of</strong><br />
Biomass<br />
Embodied<br />
in vehicle<br />
Materials road<br />
Anaerobic<br />
Digestion<br />
- Manure<br />
- Maize silage<br />
Direct Energy Requirements<br />
Maintenance<br />
road<br />
Disposal<br />
Bio<strong>gas</strong> pipeline<br />
& compression<br />
Digestate<br />
processing<br />
Materials<br />
pipeline<br />
Capital goods<br />
Gas Upgrading<br />
- PWS<br />
- Membrane<br />
- PSA<br />
- Cryogenic<br />
- Chemical<br />
scrubbing<br />
Electricity production<br />
(Efficiency: 40%)<br />
Green <strong>gas</strong> pipeline<br />
& compression<br />
System Boundary<br />
Compression &<br />
Injection<br />
- DG (
3.2.1 Pathways<br />
Numerous pathways from biomass to <strong>green</strong> <strong>gas</strong> injection can be considered. An overview <strong>of</strong> <strong>the</strong> possi-<br />
ble pathways is given in Figure 3.2.<br />
Feedstock<br />
Transportation <strong>of</strong> Biomass<br />
Anaerobic Digestion<br />
Bio<strong>gas</strong> pipeline & compression<br />
Gas Upgrading<br />
Green <strong>gas</strong> pipeline & compression<br />
Gas Compression & Injection<br />
National <strong>gas</strong> grid<br />
D = Digestion<br />
U = Upgrading<br />
I = Injection<br />
d = decentralized<br />
c = centralized<br />
b = bio<strong>gas</strong> transport<br />
g = <strong>green</strong> <strong>gas</strong> transport<br />
t = truck transport Pathway: 1 2 3 4 5 6 7 8<br />
dD-dU-dI<br />
Figure 3.2: Generic overview <strong>of</strong> possible pathways in <strong>green</strong> <strong>gas</strong> <strong>supply</strong> <strong>chain</strong>.<br />
dD-dU-g-cI<br />
The figure shows an overview <strong>of</strong> <strong>the</strong> possible pathways from a starting point to a destination. When<br />
starting, biomass can ei<strong>the</strong>r be digested on <strong>the</strong> spot (decentralized) or transported by truck to a central-<br />
ized digestion plant, where after <strong>the</strong> bio<strong>gas</strong> is upgraded. When upgraded, <strong>green</strong> <strong>gas</strong> can be injected in<br />
<strong>the</strong> DG or in <strong>the</strong> RG. Approaching this figure from a system-analysis point <strong>of</strong> view it can be stated that<br />
transportation is a <strong>critical</strong> choice in designing a <strong>green</strong> <strong>gas</strong> <strong>supply</strong> <strong>chain</strong>, since digestion, upgrading and<br />
injection are inevitable (also reported by Ghafoori et al., 2007). In practice transportation <strong>of</strong> biomass<br />
or bio<strong>gas</strong> means that larger capacities are being digested or upgraded, respectively. The size <strong>of</strong> <strong>the</strong><br />
dots in Figure 3.2 represent <strong>the</strong> capacity processed, indicated as 'large' or 'small'. It is likely that <strong>the</strong><br />
large dots can benefit from economies <strong>of</strong> scale.<br />
dD-b-cU-cI<br />
The methodology to model <strong>the</strong>se pathways generically is derived from a method used in <strong>the</strong> field <strong>of</strong><br />
Operations Research to find <strong>the</strong> shortest path in transportation networks. This method is known as <strong>the</strong><br />
Shortest Path method, aiming at finding <strong>the</strong> shortest path P from a source-node s to a destination-node<br />
d in a graph G, where <strong>the</strong> accumulated costs <strong>of</strong> <strong>the</strong> edges (flows) and nodes have to be minimized<br />
(Post, 2004). The first and most classical Shortest Path procedure was described by Edsger Dijkstra in<br />
dD-b-cU-g-cI<br />
t-cD-b-cU-g-cI<br />
t-cD-cU-g-cI<br />
t-cD-b-cU-cI<br />
t-cD-cU-cI<br />
25
1959 and is widely used in, amongst o<strong>the</strong>rs, network routing protocols (Campos & Ricardo, 2008;<br />
Dreyfus, 1968).<br />
Figure 3.3 presents a methodological approach to <strong>the</strong> possible pathways from biomass to bio<strong>gas</strong> utili-<br />
zation in an existing infrastructure. In Figure 3.2 all possible pathways are presented. However, not all<br />
<strong>of</strong> those pathways will be assessed in this research since some are only realistic for very specific geo-<br />
graphical areas. Figure 3.3 is derived from Figure 3.2 and represents an overview <strong>of</strong> <strong>the</strong> pathways that<br />
can be modeled generically.<br />
Figure 3.3: Generic model approach <strong>of</strong> <strong>the</strong> GGSC.<br />
The upper part <strong>of</strong> <strong>the</strong> graph represents decentralized treatment (<strong>gas</strong> production, upgrading and injec-<br />
tion), where <strong>the</strong> bottom represents centralized treatment. Node 'dI' and 'cI' represent injection into <strong>the</strong><br />
distribution network and in <strong>the</strong> RG respectively. The characters t, b and g on <strong>the</strong> edges in <strong>the</strong> graph<br />
represent transport (t = truck, b = bio<strong>gas</strong>, g = <strong>green</strong> <strong>gas</strong>). In order to use this generic model for model<br />
calculations, <strong>the</strong> edges and nodes will be assigned values representing <strong>the</strong> associated energy require-<br />
ments or costs. The generic model developed in this research is based on <strong>the</strong> following ma<strong>the</strong>matic<br />
formulation, derived (where after slightly adapted to fit <strong>the</strong> GGSC) from <strong>the</strong> generic equation for<br />
shortest path methods (after Festa, 2006):<br />
26<br />
∑<br />
( e − + N ) + N<br />
[1]<br />
Minimize: ( j 1,<br />
j)<br />
( j)<br />
0<br />
j∈[<br />
1,...<br />
n]<br />
Where: j = node; e = edge flow costs; N = node costs; N0 = starting point; n = number <strong>of</strong> nodes in <strong>the</strong> pathway.<br />
However, in this research it is assumed that feedstock <strong>supply</strong> (node N0 in <strong>the</strong> equation) is excluded,<br />
meaning that N0 can be set to 0. This results in following equation:<br />
∑<br />
Anaerobic Digestion Gas Upgrading Compression & Injection<br />
dD dU dI<br />
Decentralized Decentralized<br />
s d<br />
b g g<br />
Centralized t Centralized<br />
cD cU cI<br />
Anaerobic Digestion Gas Upgrading Compression & Injection<br />
Minimize: e + N )<br />
[2]<br />
( ( j−<br />
1,<br />
j)<br />
j∈[<br />
1,...<br />
n]<br />
( j)
3.2.2 Biomass and Bio<strong>gas</strong> Transport Distances<br />
The net costs for transportation <strong>of</strong> biomass to <strong>the</strong> digester are reported as a <strong>critical</strong> factor when design-<br />
ing a bio<strong>gas</strong> system (Ghafoori et al., 2007, Caputo et al., 2005; Hiremath et al., 2007). Changes in <strong>the</strong><br />
costs for transportation influence <strong>the</strong> optimal system design (Ghafoori et al., 2007). In order to deter-<br />
mine <strong>the</strong> energy requirements and costs <strong>of</strong> transportation <strong>of</strong> biomass or bio<strong>gas</strong> from farms to <strong>gas</strong> grids,<br />
information about <strong>the</strong> distances is in this model determined by a simple heuristic method, being <strong>the</strong><br />
"Centre <strong>of</strong> Gravity" method D . Based on Euclidean distances <strong>the</strong> method is used to determine <strong>the</strong> best<br />
location for a facility from an infinite number <strong>of</strong> potential locations with a fixed amount <strong>of</strong> demanders<br />
(or farms to be suppliers in case <strong>of</strong> this research). The method requires <strong>the</strong> input <strong>of</strong> coordinates (x, y)<br />
and flows. Within <strong>the</strong> GGSC <strong>the</strong> facility to be located is referred to as 'centre', representing a location<br />
where all flows are bundled. Following equations determine <strong>the</strong> x and y-coordinates <strong>of</strong> <strong>the</strong> 'centre' (af-<br />
ter Teunter, 2010):<br />
( ∑ f j x j ) /( ∑ f j<br />
c ∑ f j y j ) /( ∑<br />
x )<br />
= c<br />
j j<br />
y ( f )<br />
[3]<br />
= j j<br />
Where: xc = x-coordinate <strong>of</strong> centre; yc = y-coordinate <strong>of</strong> centre; j = farm; fj = flow <strong>of</strong> farm j; xj = x-coordinate <strong>of</strong><br />
farm j; yj = y-coordinate <strong>of</strong> farm j.<br />
Subsequently <strong>the</strong> associated Euclidean distances can be derived as following (after Rentizelas &<br />
Tatsiopoulos, 2010; Valezquez-Marti & Fernandez-Gonzalez, 2010):<br />
Distance to centre (m):<br />
Distance from centre to grid (m):<br />
d ∆<br />
j<br />
2<br />
2<br />
j,<br />
c = ( ∆x<br />
j,<br />
c ) + ( y j,<br />
c )<br />
[4]<br />
d ∆<br />
2<br />
2<br />
c,<br />
g = ( ∆xc,<br />
g ) + ( yc,<br />
g )<br />
[5]<br />
Total distance from farms to grid: ( ∑ d + d<br />
[6]<br />
= d t<br />
j,<br />
c c,<br />
g<br />
j<br />
)<br />
Where: d = distance (m); c = centre; j = farm; g = <strong>gas</strong> grid; t = total.<br />
The coordinates used in this research originate from <strong>the</strong> RD-coordinates (Rijksdriehoeks-coordinaten)<br />
system, which is a system that is extensively used in <strong>the</strong> Ne<strong>the</strong>rlands.<br />
In this research eight farm locations and one <strong>gas</strong> grid location were assumed, in an area nearby Gron-<br />
ingen (NL). Appendix V includes <strong>the</strong> x- and y-coordinates <strong>of</strong> that specific area. The distances found<br />
with <strong>the</strong> Centre <strong>of</strong> Gravity method are in this research used for determination <strong>of</strong> energy requirements<br />
and costs <strong>of</strong> transportation. It is assumed that <strong>the</strong> transport distances are equal for both pipeline trans-<br />
port <strong>of</strong> <strong>gas</strong> and truck transport <strong>of</strong> biomass.<br />
3.2.3 Gas Compression<br />
Compression <strong>of</strong> <strong>gas</strong> is required for transport <strong>of</strong> <strong>gas</strong> and for injection into <strong>the</strong> <strong>gas</strong> grid. The type <strong>of</strong> <strong>gas</strong><br />
to be compressed determines, amongst o<strong>the</strong>rs, <strong>the</strong> electricity demand <strong>of</strong> <strong>the</strong> compressor. This is caused<br />
by <strong>the</strong> difference in characteristics between <strong>gas</strong>es. Bio<strong>gas</strong> consist <strong>of</strong> about 40% CO2, resulting in a<br />
D The Centre <strong>of</strong> Gravity method is used in <strong>the</strong> field <strong>of</strong> Operations Research for <strong>the</strong> warehouse location problem.<br />
27
higher specific electricity demand for compression compared to compression <strong>of</strong> <strong>green</strong> <strong>gas</strong> (>95 CH4).<br />
Therefore, <strong>the</strong> distinction between compression <strong>of</strong> <strong>green</strong> <strong>gas</strong> and bio<strong>gas</strong> is important. In this research<br />
<strong>gas</strong> injection is done by compression <strong>of</strong> <strong>green</strong> <strong>gas</strong> and transportation is done by compression <strong>of</strong> both<br />
bio<strong>gas</strong> and <strong>green</strong> <strong>gas</strong> (depending on <strong>the</strong> system configuration). So, <strong>the</strong> exact energy requirements and<br />
costs for compression are dependent on <strong>the</strong> type <strong>of</strong> <strong>gas</strong> compressed, <strong>the</strong> <strong>gas</strong> compression capacity and<br />
<strong>the</strong> pressure lift required. Compression for transportation purposes was assumed to be done to 0.5<br />
MPa, compression for injection in DG and RG is done to 0.8 MPa and 4.0 MPa respectively.<br />
A ma<strong>the</strong>matical approach is used to determine <strong>the</strong> electricity demand, and hence <strong>the</strong> costs and primary<br />
energy requirements, <strong>of</strong> compression. This methodology was presented in Damen (2007) and cited in<br />
Koornneef et al. (2008). Following equation shows <strong>the</strong> generic method to determine <strong>the</strong> specific work<br />
for compression <strong>of</strong> <strong>gas</strong> to a certain pressure:<br />
28<br />
C2<br />
⎡⎛<br />
p ⎞ ⎤<br />
2 = C ⎢<br />
⎜<br />
⎟<br />
1 * −1⎥<br />
⎢⎣<br />
⎝ p1<br />
⎠ ⎥⎦<br />
W [7]<br />
Where: W = specific work (kJ/kg <strong>gas</strong>); C1,2 = constants; p1 = suction pressure; p2 = final pressure.<br />
In this report p1 and p2 can be considered as variables, since p1 depends on <strong>the</strong> technology used for<br />
upgrading bio<strong>gas</strong> to <strong>green</strong> <strong>gas</strong> (see section 2.2) and p2 depends on <strong>the</strong> purpose (transport or injection)<br />
for compression. After determining <strong>the</strong> specific work needed for compression, <strong>the</strong> value is converted<br />
to primary energy requirements. In Appendix II <strong>the</strong> methodology is specified, also <strong>the</strong> constants and<br />
variable used for <strong>the</strong> determination <strong>of</strong> <strong>the</strong> energy demand for compression <strong>of</strong> both bio<strong>gas</strong> and <strong>green</strong><br />
<strong>gas</strong> (methane) are given in this appendix.<br />
3.3 Economics <strong>of</strong> <strong>the</strong> GGSC<br />
Calculations on <strong>the</strong> costs <strong>of</strong> digestion are based on information given mainly by Fraunh<strong>of</strong>er (Urban et<br />
al., 2009), which is a German scientific research institute on technical innovation. Additional to <strong>the</strong><br />
Fraunh<strong>of</strong>er report (Urban et al., 2009), data from DENA (2009) was used, which is an extension <strong>of</strong><br />
Urban et al. (2009). These reports were also used to gain part <strong>of</strong> <strong>the</strong> information about costs for bio<strong>gas</strong><br />
upgrading. According to Poeschl (2010) Germany is at this moment leading in bio<strong>gas</strong> technology and<br />
<strong>the</strong>refore Urban et al. (2009) is in this research seen as valuable literature. Little information is avail-<br />
able on <strong>the</strong> total costs for bio<strong>gas</strong> upgrading for different <strong>gas</strong> capacities, numerous studies (a.o. Tilburg<br />
et al., 2008a & 2008b; Petersson & Wellinger, 2009; Reppich et al., 2009;) performed on <strong>the</strong> econom-<br />
ics <strong>of</strong> upgrading based <strong>the</strong>ir conclusions on Urban et al. (2009).<br />
In <strong>the</strong> generic model all costs are calculated to ct€/MJ produced. Basically <strong>the</strong> total costs are composed<br />
<strong>of</strong> investment costs and variable costs. A capital recovery factor (CRF) is used to determine <strong>the</strong> annual
capital costs based on an annuity, resulting from <strong>the</strong> investment, by including <strong>the</strong> depreciation period<br />
and interest rates (or WACC E ).<br />
CRF<br />
Where: CRF = Capital Recovery Factor (-), i = Interest rate (%), n = depreciation period (yrs)<br />
The depreciation period (n) was set to 12 years since Dutch subsidy regulations are fixed for this pe-<br />
riod <strong>of</strong> time (Lensink et al., 2010). In practice <strong>the</strong> period for which an initiative is granted subsidy de-<br />
termines <strong>the</strong> acceptable depreciation period (Vlap, 2010). Similar effects <strong>of</strong> legislation on <strong>the</strong> effective<br />
lifetime <strong>of</strong> a bio<strong>gas</strong> installation were reported by Walla & Schneeberger (2008). Solely pipeline con-<br />
struction costs are based on a depreciation period <strong>of</strong> 30 years (Koornneef et al., 2008). The interest<br />
rate is included in <strong>the</strong> WACC and is set to 7.8% which was reported by Lensink et al. (2010).<br />
Table 3.1 gives an overview <strong>of</strong> <strong>the</strong> main parameters concerning <strong>the</strong> economic analysis.<br />
Table 3.1: Main parameters used in <strong>the</strong> economic analysis <strong>of</strong> <strong>the</strong> generic model.<br />
Parameter Value Unit Reference<br />
Depreciation period 12 Years Lensink et al., 2010<br />
WACC a 7.8 % Lensink et al., 2010<br />
Operational hours 8000 Hours / year Vlap, 2010<br />
Electricity price 0.10 € / kWh Janssen & Bogaard, 2009; de Hullu, 2008<br />
Caloric value Bio<strong>gas</strong> 21.5 MJ / Nm 3<br />
Bio<strong>gas</strong> yield:<br />
- Manure<br />
- Maize<br />
n<br />
i(<br />
1+<br />
i)<br />
( 1+<br />
i)<br />
−1<br />
= n<br />
23<br />
200<br />
m 3 / tonne<br />
m 3 / tonne<br />
[8]<br />
Noyola et al., 2006; Wellinger & Lindberg, 1999;<br />
Murphy et al., 2004<br />
Bruinsma, 2007; Pöschl et al., 2010; Walla & Sch-<br />
neeberger, 2008<br />
a WACC (Weighted Average Cost <strong>of</strong> Capital) is <strong>the</strong> minimum return that should be earned to satisfy providers <strong>of</strong> <strong>the</strong> capital,<br />
or that might be earned by an investment elsewhere. In <strong>the</strong> Dutch situation it is assumed to consist <strong>of</strong> 80% liability at 6%<br />
interest and 20% equity at 15% interest.<br />
More specific information was found about every step in <strong>the</strong> <strong>green</strong> <strong>gas</strong> <strong>supply</strong> <strong>chain</strong>. This data is pre-<br />
sented in Table 3.2.<br />
E Weighted Average Cost <strong>of</strong> Capital (WACC)<br />
29
Table 3.2: Specific economics <strong>of</strong> <strong>the</strong> <strong>green</strong> <strong>gas</strong> <strong>supply</strong> <strong>chain</strong>.<br />
Process Value Unit Reference<br />
Transportation <strong>of</strong> Biomass<br />
(manure ; maize)<br />
- Fixed<br />
- Variable<br />
(1.5 a ; 0.35)<br />
(0.04 ; 0.05)<br />
€ / tonne<br />
€ / tonne.km<br />
Luesink, 2010; Walla & Schnee-<br />
berger, 2008<br />
Walla & Schneeberger, 2008<br />
Anaerobic Digestion (avg.) b 0.65 ct€ / MJ Urban et al., 2009<br />
Bio<strong>gas</strong> Pipeline (construction) c<br />
- 110 mm (avg.)<br />
- 310 mm<br />
90<br />
190<br />
silage. The specific costs for transportation are composed <strong>of</strong> fixed costs and variable costs (derived<br />
30<br />
€ / m<br />
€ / m<br />
KEMA; Enexis, 2009 d<br />
KEMA<br />
Gas Upgrading (avg.) e 0.35 ct€ / MJ Urban et al., 2009<br />
Gas Compression<br />
0.8 MPa<br />
0.8 – 4.0 MPa<br />
Green <strong>gas</strong> injection facility<br />
(
from Walla & Schneeberger, 2008). Manure is assumed to be transported at 0.04 €/tonne.km and<br />
loaded and unloaded (fixed costs) at 1.5 €/tonne. For maize <strong>the</strong>se values are 0.05 €/tonne.km and 0.35<br />
€/tonne respectively. The large difference between loading/unloading costs <strong>of</strong> <strong>the</strong> substrates can be<br />
explained by <strong>the</strong> legal obligation, according to Dutch law, to sample manure before transportation,<br />
accounting for approximately 1.0 €/tonne (Luesink, 2010). The same costs for loading/unloading hold<br />
for transportation <strong>of</strong> digestate. These values and <strong>the</strong>ir reference can be found in Table 3.2. The specific<br />
costs are subsequently multiplied by <strong>the</strong> distance and converted to ct€/MJ. In this calculation <strong>the</strong> costs<br />
for return trips with digestate (being 90% <strong>of</strong> <strong>the</strong> total substrate input, after Bermejo & Ellmer, 2010)<br />
are included.<br />
Anaerobic Digestion<br />
As mentioned in section 3.3 <strong>the</strong> economics <strong>of</strong> digestion were derived from Urban et al. (2009). In that<br />
report all specific costs that are involved in <strong>the</strong> construction and operation <strong>of</strong> a digester were specified<br />
in detail. The authors discuss two types <strong>of</strong> digesters: a vessel for digestion <strong>of</strong> a biomass input with a<br />
manure-to-maize ratio <strong>of</strong> 90:10 and one with a manure-to-maize ratio <strong>of</strong> 10:90. Since <strong>the</strong> largest share<br />
<strong>of</strong> digesters process biomass with a manure-to-maize ratio <strong>of</strong> approximately 50:50 (Pöschl et al., 2010)<br />
all costs accompanying digestion <strong>of</strong> 50:50 (manure-to-maize) were calculated based on <strong>the</strong> costs for<br />
<strong>the</strong> plants given by Urban et al. (2009). The costs <strong>of</strong> a 50:50 plant were assumed to be directly propor-<br />
tional to <strong>the</strong> average costs <strong>of</strong> <strong>the</strong> 90:10 and 10:90 plants. The investment costs were multiplied by <strong>the</strong><br />
CRF to gain annual capital costs. Both <strong>the</strong> annual capital and operational costs were subsequently cal-<br />
culated to specific costs, expressed in ct€/MJ, based on <strong>the</strong> parameters given in Table 3.1.<br />
Bio<strong>gas</strong> Pipeline Construction<br />
The 'Centre <strong>of</strong> Gravity' method (explained in section 3.2.1) was used to calculate transport distances.<br />
The material <strong>of</strong> <strong>the</strong> bio<strong>gas</strong> pipeline is assumed to be high-density polyethylene (HDPE). Two diame-<br />
ters were used: 110mm for transportation <strong>of</strong> a single bio<strong>gas</strong> flow from a digester to a 'centre' (see<br />
3.2.1) and 310mm for a bundled flow <strong>of</strong> bio<strong>gas</strong> from <strong>the</strong> 'centre' to <strong>the</strong> <strong>gas</strong> grid. These pipelines were<br />
assumed to have specific costs <strong>of</strong> 90 €/m and 190 €/m respectively for <strong>the</strong> total construction (see Table<br />
3.2). These costs are indicative and derived as rounded values. Total construction costs are composed<br />
<strong>of</strong> costs for materials, construction, right <strong>of</strong> way, labor and miscellaneous and are assumed to be 40%<br />
'difficult' and 60% 'easy'. The difficulty is determined by <strong>the</strong> obstacles that might hinder <strong>the</strong> construc-<br />
tion (e.g. if <strong>the</strong> pipeline will cross road-, rail- or water ways). The investment costs are calculated to<br />
annual capital costs with <strong>the</strong> CRF method. For pipeline construction a depreciation period <strong>of</strong> 30 years<br />
is assumed (after Koornneef et al., 2008).<br />
Gas Upgrading<br />
Information about <strong>the</strong> costs for upgrading were found in Urban et al., 2009 & DENA, 2009 (PWS,<br />
PSA, chemical scrubbing); de Hullu et al., 2008 (membrane, cryogenic); Dirkse, 2007 (PWS); Jensen<br />
& Jensen, 2000 (membrane); Janssen & Bogaard, 2009 (cryogenic); Colsen, 2009 (cryogenic) and<br />
KEMA (cryogenic). A comparison <strong>of</strong> specific costs <strong>of</strong> <strong>the</strong> upgrading techniques is presented in Ap-<br />
31
pendix III. However, it should be noted that information about <strong>the</strong> economics <strong>of</strong> cryogenic and mem-<br />
brane separation was directly or indirectly derived from quotations from suppliers <strong>of</strong> upgrading tech-<br />
niques. Since bio<strong>gas</strong> upgrading has not been done very extensively yet it is likely to assume that com-<br />
mercial interests are translated through <strong>the</strong>se quotations, meaning that given costs cannot be inter-<br />
preted as reliable. From literature study it can be stated that reliable information on <strong>the</strong> economics <strong>of</strong><br />
upgrading techniques, especially about cryogenic separation and membrane separation, is difficult to<br />
find.<br />
The data given by Urban et al. (2009), DENA (2009) and Dirkse (2007) was specified in detail, giving<br />
a clear overview <strong>of</strong> how total costs are composed. The o<strong>the</strong>r references mostly specified investment<br />
costs and energy costs. The investment costs were multiplied by <strong>the</strong> CRF (equation [8]) to gain annual<br />
capital costs. Both <strong>the</strong> annual capital and operational costs were calculated to specific costs, expressed<br />
in ct€/MJ, based on <strong>the</strong> parameters given in Table 3.1.In <strong>the</strong> generic model <strong>the</strong> average <strong>of</strong> each tech-<br />
niques per capacity was taken to generate data in which commercial interest is reflected least possible.<br />
Gas Compression<br />
The methodology used to determine <strong>the</strong> electricity demand for compression <strong>of</strong> bio<strong>gas</strong> or <strong>green</strong> <strong>gas</strong> is<br />
explained section 3.2.2. An electricity price <strong>of</strong> 0.10 €/kWh (see Table 3.1) is assumed in this research<br />
to determine <strong>the</strong> operational costs. The capital costs for compression (investment and maintenance <strong>of</strong><br />
compressor) were derived from information from KEMA. A (confidential) data analysis, combined<br />
with <strong>the</strong> CRF methodology (equation [8]) is used to gain data on <strong>the</strong> specific costs, which is confirmed<br />
by KEMA employees.<br />
Green Gas Injection Facility<br />
Injection <strong>of</strong> <strong>gas</strong> is done in an injection facility and requires compression. However, this section only<br />
describes <strong>the</strong> costs for <strong>the</strong> injection facility. Compression <strong>of</strong> <strong>gas</strong> is discussed in section 3.2.2 and in<br />
Appendix II.<br />
Costs for an injection facility are solely composed <strong>of</strong> capital costs for <strong>the</strong> physical connection to a <strong>gas</strong><br />
grid and <strong>the</strong> costs for measurements and control equipment. The costs for <strong>the</strong> physical grid connection<br />
are highly depending on <strong>the</strong> <strong>gas</strong> grid <strong>of</strong> choice. A connection to a DG requires an investment <strong>of</strong> ap-<br />
proximately 25*10 3 € (KEMA; Vlap, 2010). Connection to a RG involves more sophisticated labor<br />
(welding <strong>of</strong> a pipeline at high pressure) and materials. Consequently, a connection to a RG requires an<br />
investment <strong>of</strong> approximately 250*10 3 € (KEMA; Vlap, 2010). Measurement and control equipment<br />
accounts for approximately 100*10 3 €. These figures are also presented in Table 3.2. A CRF (equation<br />
[8]) was used to calculate <strong>the</strong> investment to annual and subsequently specific costs (ct€/MJ).<br />
3.4 Energy Requirements <strong>of</strong> <strong>the</strong> GGSC<br />
In this section <strong>the</strong> energy requirements for <strong>the</strong> different process steps in <strong>the</strong> GGSC are discussed. The<br />
system boundaries are presented in Figure 3.1. The energy requirements are expressed in this report as<br />
primary energy requirements (MJpe/MJ).<br />
32
The energy requirements <strong>of</strong> <strong>the</strong> different processes within <strong>the</strong> <strong>green</strong> <strong>gas</strong> <strong>supply</strong> <strong>chain</strong> have been re-<br />
ported in literature, see Figure 3.4. Pöschl et al. (2010) address <strong>the</strong> need for an overall study on <strong>the</strong><br />
energy requirements <strong>of</strong> <strong>the</strong> total bio<strong>gas</strong> production and utilization <strong>chain</strong>.<br />
Bekkering et al. (2010)<br />
Berglund & Borjesson (2006)<br />
Borjesson (1996, 2008)<br />
Braaksma (2010)<br />
Damen (2007)<br />
Gerin et al. (2008)<br />
Koornneef et al. (2008)<br />
Polsch et al. (2010)<br />
Welink et al. (2007)<br />
Zwart (2006)<br />
Figure 3.4: Overview <strong>of</strong> literature about <strong>the</strong> energy requirements in <strong>the</strong> <strong>green</strong> <strong>gas</strong> <strong>supply</strong> <strong>chain</strong>.<br />
The information presented by Braaksma (2010) was largely based on Bekkering et al. (2010), Damen<br />
(2007), Welink et al. (2007) and Zwart (2006). Pöschl et al. (2010) used Berglund & Borjesson<br />
(2006), Borjesson (2008), Gerin et al. (2008) and o<strong>the</strong>r specific references.<br />
The data found in literature, with regard to <strong>the</strong> energy requirements <strong>of</strong> <strong>the</strong> process steps in <strong>the</strong> <strong>green</strong><br />
<strong>gas</strong> <strong>supply</strong> <strong>chain</strong>, are given in Table 3.3. The <strong>green</strong> <strong>gas</strong> injection facility is not included in this table, it<br />
is assumed in this research that no energy requirements are involved.<br />
Table 3.3: Energy requirements <strong>of</strong> <strong>the</strong> <strong>green</strong> <strong>gas</strong> <strong>supply</strong> <strong>chain</strong> (given in MJ primary energy per MJ <strong>gas</strong>).<br />
Process Value Unit Reference<br />
Transportation <strong>of</strong> Biomass a<br />
-Manure<br />
-Maize silage<br />
1.73<br />
4.55<br />
MJpe / tonne.km<br />
MJpe / tonne.km<br />
Anaerobic Digestion (avg.) b 0.17 MJpe / MJ<br />
Bio<strong>gas</strong> Pipeline c<br />
(grid construction)<br />
3922 GJpe / km<br />
Gas Upgrading (avg.) 0.09 MJpe / MJ<br />
Gas Compression<br />
- 0.8 MPa<br />
- 4.0 MPa<br />
Feedstock<br />
<strong>supply</strong><br />
0.024<br />
0.057<br />
Transport<br />
<strong>of</strong> Biomass<br />
MJpe / MJ<br />
Anaerobic<br />
Digestion<br />
Pöschl et al., 2010; Berglund & Borjesson, 2006; Bor-<br />
jesson, 1996<br />
Urban et al., 2009; Pöschl et al., 2010; Braaksma, 2010;<br />
Berglund & Borjesson, 2006<br />
Koornneef et al., 2008; Sakai et al., 2004; Worrell et al.,<br />
1993<br />
Bekkering et al., 2010; Zwart, 2009; Urban et al.,<br />
2009 d ; Braaksma, 2010<br />
Koornneef et al., 2008; Damen, 2007; Pöschl et al.,<br />
2010 e ; Braaksma, 2010<br />
a Based on 2.8 MJpe / tonne.km for manure and 7.5 MJ pe / tonne.km (incl. empty returns) for maize silage, transported over<br />
mid-range distance (2 < 20 km). Energy requirements for fossil fuel use and deterioration <strong>of</strong> infrastructure are included. Also<br />
primary energy embodied in <strong>the</strong> vehicle (materials, maintenance) is included, accounting for 0.04 MJ/tonne.km (Borjesson,<br />
1996). A factor <strong>of</strong> 0.6 is used to correct for <strong>the</strong> empty returns.<br />
b Berglund & Borjesson (2006) give 24 MJpe/MJ, Pöschl et al. (2010) give avg. 13 MJ pe/MJ, Braaksma (2010) reports 17.5<br />
MJ pe/MJ and <strong>the</strong> values from Urban et al. (2008) are calculated from energy use (heat & electricity), where <strong>the</strong> direct electric-<br />
ity use is multiplied by 2.5 to determine <strong>the</strong> primary energy use.<br />
Bio<strong>gas</strong> pipeline<br />
& compression<br />
Gas Upgrading<br />
Green <strong>gas</strong> pipeline<br />
& compression<br />
Compression &<br />
Injection<br />
33
c Based on a pipeline <strong>of</strong> HDPE<br />
d Calculated from energy use (heat & electricity), where <strong>the</strong> direct electricity use is multiplied by 2.5 to determine <strong>the</strong> pri-<br />
mary energy use.<br />
e Pöschl et al. (2010) reports 0.18 MJ/Nm 3 bio<strong>gas</strong> for compression to 1.6 MPa (note: authors did not encounter conversion to<br />
primary energy)<br />
In a study <strong>of</strong> Koornneef et al. (2008) life cycle inventory data was given for an onshore CO2 pipeline<br />
infrastructure. However, since that study was based on data about natural <strong>gas</strong> pipelines it was consid-<br />
ered to be useful data in <strong>the</strong> case <strong>of</strong> <strong>green</strong> <strong>gas</strong>. This data informs about <strong>the</strong> materials and quantities<br />
needed for such an infrastructure. Subsequently <strong>the</strong> energy requirements were found (figures on en-<br />
ergy requirements for <strong>the</strong> materials were found in Sakai et al., 2004; Worrell et al., 1993 and Bu-<br />
chanan & Honey, 1994). In <strong>the</strong> same study <strong>of</strong> Koornneef et al. (2008) <strong>the</strong> authors present an equation<br />
for <strong>the</strong> calculation <strong>of</strong> energy requirements for compression, which <strong>the</strong>y derived from Damen (2007),<br />
see Appendix II. Calculating with <strong>the</strong>se equations <strong>the</strong> results correspond to those given by Pöschl et al.<br />
(2010).<br />
Transport <strong>of</strong> biomass<br />
The primary energy requirements for road transport <strong>of</strong> biomass are derived from Pöschl et al. (2010).<br />
Energy requirements embodied in vehicle and infrastructure are given by Borjesson (1996). The article<br />
by Berglund & Borjesson (2006) was used to determine a correction factor for <strong>the</strong> difference between<br />
<strong>the</strong> energy requirements for empty or fully loaded return trips. In <strong>the</strong> article by Pöschl et al. (2010)<br />
truck transport <strong>of</strong> different substrates (including cattle manure and maize silage specifically) was re-<br />
ported in three distance ranges and <strong>the</strong> authors assumed empty returns. Since in this research it is as-<br />
sumed that 90% (after Bermejo & Ellmer, 2010) <strong>of</strong> <strong>the</strong> biomass will become digestate and hence has<br />
to be returned to <strong>the</strong> farms, it was not possible to use <strong>the</strong> values given by Pöschl et al. (2010) directly.<br />
To correct for digestate returns a factor was used that was found by simple calculations on <strong>the</strong> energy<br />
requirements for transportation <strong>of</strong> biomass given by Berglund & Borjesson (2006). The authors re-<br />
ported different values for transportation including and excluding empty returns. It was found that <strong>the</strong><br />
difference was a factor 0.6 (MJ/tonne.km excl. empty returns divided by MJ/tonne.km incl. empty re-<br />
turns). Consequently, <strong>the</strong> values used to express <strong>the</strong> energy requirements for transportation <strong>of</strong> biomass<br />
in this research are 1.73 MJpe/tonne.km and 4.55 MJpe/tonne.km for transport <strong>of</strong> cattle ma-<br />
nure/digestate and maize silage respectively. Determination <strong>of</strong> transport distances is done by <strong>the</strong> 'Cen-<br />
tre <strong>of</strong> Gravity' method, described in section 3.2.1.<br />
34
Anaerobic Digestion<br />
Urban et al. (2009) reported in detail <strong>the</strong> costs for digestion <strong>of</strong> different substrate ratios, composed <strong>of</strong>,<br />
amongst o<strong>the</strong>rs, <strong>the</strong> costs for <strong>the</strong>rmal and electrical energy <strong>supply</strong> to <strong>the</strong> digester. The authors supple-<br />
mented detailed information on <strong>the</strong> price for heat and electricity <strong>the</strong>y assumed. With that information<br />
<strong>the</strong> costs were calculated to amounts <strong>of</strong> heat (kWth) and electricity (kWe) that is needed to operate <strong>the</strong><br />
specific digester (depending on capacity and substrate ratio <strong>of</strong> input). A conversion factor <strong>of</strong> 40% (ηe)<br />
for <strong>the</strong> calculation <strong>of</strong> <strong>the</strong> primary energy input for <strong>the</strong> electricity production in a power plant is in-<br />
cluded (see Figure 3.1). The average <strong>of</strong> <strong>the</strong> resulting energy requirements is in line with <strong>the</strong> general<br />
values given in Berglund & Borjesson (2006), Braaksma (2010) and Pöschl et al. (2010). Appendix IV<br />
shows <strong>the</strong> effect <strong>of</strong> substrate input ratio on <strong>the</strong> energy requirements <strong>of</strong> <strong>the</strong> digester heat demand.<br />
Gas Pipeline Construction<br />
The materials needed for a natural <strong>gas</strong> pipeline were reported in detail by Koornneef et al. (2008).<br />
However, <strong>the</strong> authors supplied information about steel pipelines only. To add HDPE to <strong>the</strong> generic<br />
model it is assumed that <strong>the</strong> same volume <strong>of</strong> material (steel or HDPE) is needed for <strong>the</strong> construction <strong>of</strong><br />
<strong>the</strong> particular pipeline. Therefore <strong>the</strong> values <strong>of</strong> <strong>the</strong> amount <strong>of</strong> steel needed (given by Koornneef et al.,<br />
2008) were calculated to HDPE on basis <strong>of</strong> <strong>the</strong> specific material densities, which are 7750 kg/m 3 and<br />
941 kg/m 3 respectively. All <strong>the</strong> materials and diesel needed for <strong>the</strong> construction were based on a 50<br />
km pipeline in Koornneef et al. (2008), which is corrected in this research to values per meter. The<br />
energy requirements for <strong>the</strong> construction <strong>of</strong> <strong>the</strong> pipeline materials were derived from Worrell et al.<br />
(1993), Sakai et al. (2004) and Buchanan & Honey (1994). The distance was determined by <strong>the</strong> ‘Cen-<br />
tre <strong>of</strong> Gravity' method, explained in section 3.2.1. It is assumed that <strong>the</strong> energy requirements for pipe-<br />
line construction are written <strong>of</strong>f in 30 years.<br />
Gas Upgrading<br />
In <strong>the</strong> report by Urban et al. (2009) and Dirkse (2007) <strong>the</strong> costs (€) for different upgrading techniques<br />
(PWS, PSA, chemical scrubber), except for membrane and cryogenic separation, were specified in<br />
detail. The costs for electricity and/or <strong>the</strong>rmal energy use <strong>of</strong> <strong>the</strong> different upgrading techniques and<br />
<strong>the</strong>ir capacities were used in this research to find <strong>the</strong> electricity (kWe) and heat (kWth) demands since<br />
both references supplemented information about <strong>the</strong>ir assumptions on <strong>the</strong> electricity and heat price<br />
(€/kWh). A conversion factor <strong>of</strong> 40% (ηe) for <strong>the</strong> calculation <strong>of</strong> <strong>the</strong> primary energy input for <strong>the</strong> elec-<br />
tricity production in a power plant is included (see Figure 3.1). An average was calculated based on<br />
<strong>the</strong> values resulting from <strong>the</strong> abovementioned methodology and <strong>the</strong> energy requirements given by<br />
Bekkering et al. (2010) and Zwart (2009). Information about <strong>the</strong> primary energy requirements <strong>of</strong><br />
membrane and cryogenic separation were derived from Bekkering et al. (2010) & Zwart (2009).<br />
Gas Compression<br />
The method to determine <strong>the</strong> energy requirements for compression <strong>of</strong> <strong>gas</strong> for both transportation and<br />
injection purposes is stated in section 3.2.2.<br />
35
Green Gas Injection Facility<br />
It is assumed that no energy requirements are involved in <strong>the</strong> <strong>green</strong> <strong>gas</strong> injection facility. The energy<br />
requirements for injection <strong>of</strong> <strong>green</strong> <strong>gas</strong> into <strong>the</strong> <strong>gas</strong> grid consider solely electricity demand for com-<br />
pression. The method to determine <strong>the</strong> energy requirements for compression for injection purposes is<br />
discussed in section 3.2.2.<br />
3.5 Susceptibility for <strong>Optimization</strong><br />
As stated in section 2.2 system integration might result in scale benefits, transportation <strong>of</strong> bio<strong>gas</strong> or<br />
biomass and efficiency enhancement as a result <strong>of</strong> <strong>the</strong> choice for certain technologies. These aspects<br />
determine <strong>the</strong> total <strong>chain</strong> energy requirements and costs <strong>of</strong> a certain <strong>green</strong> <strong>gas</strong> production pathway.<br />
The generic model developed in this research is used to identify <strong>the</strong> effects <strong>of</strong> <strong>the</strong>se aspects on <strong>the</strong> total<br />
energy requirements and costs <strong>of</strong> <strong>the</strong> process steps in <strong>the</strong> GGSC. This section describes <strong>the</strong> methods<br />
used for identification <strong>of</strong> possibilities for optimization. First, <strong>the</strong> method to identify scale effects is<br />
described. Since scale effects are related to transportation in <strong>the</strong> GGSC, this aspect follows after de-<br />
scription <strong>of</strong> <strong>the</strong> methods for scale effects identification. Then, <strong>the</strong> method to assess <strong>the</strong> effects <strong>of</strong> ap-<br />
plication <strong>of</strong> a certain upgrading techniques is explained. Following, process for <strong>the</strong> assessment <strong>of</strong> <strong>the</strong><br />
effect <strong>of</strong> certain transport means and <strong>the</strong> optimal pathway is described.<br />
Scale Effects<br />
Sensitivity <strong>of</strong> <strong>the</strong> energy requirements and costs as a function <strong>of</strong> <strong>the</strong> capacity will be identified for<br />
every process step in <strong>the</strong> GGSC. The data will be plotted to identify what kind <strong>of</strong> relation exists be-<br />
tween capacity scale and <strong>the</strong> total energy requirements and costs <strong>of</strong> each step in <strong>the</strong> GGSC. A trend<br />
line will be added to quantify <strong>the</strong> effects. The trend line with <strong>the</strong> highest correlation to <strong>the</strong> data (indi-<br />
cated by <strong>the</strong> R-squared) will be plotted. Comparing <strong>the</strong> accompanying trend line function gives infor-<br />
mation about which process step is most sensitive to scale effects.<br />
Transition Points <strong>of</strong> Transport Means<br />
Transportation is reported as a <strong>critical</strong> factor in a bio-energy <strong>chain</strong>. Within <strong>the</strong> GGSC truck transport<br />
<strong>of</strong> biomass and pipeline transport <strong>of</strong> bio<strong>gas</strong> can be considered. When biomass is transported by trucks<br />
in order to be digested centralized, it is likely that scale effects will occur for digestion. This is in con-<br />
trast with transportation <strong>of</strong> bio<strong>gas</strong> by pipelines from decentralized digesters to a centralized upgrading<br />
and injection plant. Consequently, transportation <strong>of</strong> ei<strong>the</strong>r biomass or bio<strong>gas</strong> cannot be considered<br />
solely, digestion has to be included.<br />
In this research a transition point, indicating <strong>the</strong> effect <strong>of</strong> capacity and distance on <strong>the</strong> energy require-<br />
ments and costs, is identified. This is done by modeling <strong>the</strong> two means <strong>of</strong> transport for several dis-<br />
tances for both <strong>the</strong> energy requirements and costs as a function <strong>of</strong> capacity, and subsequently obtain-<br />
ing <strong>the</strong> break-even points <strong>of</strong> <strong>the</strong> lines. Plotting <strong>the</strong> break-even points in one graph gives an overview <strong>of</strong><br />
<strong>the</strong> optimal means transport at a certain distance and capacity.<br />
For biomass truck transport it was assumed that digestate is transported back over <strong>the</strong> same distance as<br />
substrates were supplied. Pipeline transport includes pipeline construction and compression <strong>of</strong> bio<strong>gas</strong><br />
to 0.5 MPa.<br />
36
Upgrading Techniques<br />
Within <strong>the</strong> different pathways (section 3.2) <strong>the</strong>re are five upgrading technique. One system configura-<br />
tion is used to assess <strong>the</strong> different upgrading techniques. Pathway 3 (hub configuration) is chosen to<br />
assess <strong>the</strong> effect <strong>of</strong> application <strong>of</strong> PWS, PSA, chemical scrubber, membrane separation and cryogenic<br />
separation. The effect <strong>of</strong> different upgrading techniques on <strong>the</strong> total costs and energy requirements in<br />
<strong>the</strong> GGSC is identified. Take into consideration that <strong>the</strong> data used to assess <strong>the</strong> economics <strong>of</strong> mem-<br />
brane and cryogenic separation is uncertain. Data about <strong>the</strong>se costs were reported very modest and<br />
considered to be highly influenced by commercial interests.<br />
Optimal Pathway<br />
By modeling different system configurations with <strong>the</strong> generic model, possible effects <strong>of</strong> <strong>the</strong> choice for<br />
certain pathways on <strong>the</strong> economics and energy requirements can be identified. The system configura-<br />
tions that are chosen are presented in Table 3.4. According to section 3.2.1 five pathways can be con-<br />
sidered. However, since <strong>the</strong> DG is limited to a <strong>green</strong> <strong>gas</strong> injection <strong>of</strong> max 150 Nm 3 /h, only four path-<br />
ways are assessed. The pathways are expressed according to Figure 3.3. In all <strong>the</strong> pathways PWS is<br />
used for bio<strong>gas</strong> upgrading since this is <strong>the</strong> most applied upgrading technique.<br />
Table 3.4: System designs to identify <strong>the</strong> most efficient pathways.<br />
Fig 3.2<br />
Pathway<br />
Fig. 3.2 & 3.3<br />
1 dD-dU-dI<br />
2 dD-dU-g-cI<br />
3 dD-b-cU-cI<br />
8 t-cD-cU-cI<br />
Description<br />
Decentralized digestion <strong>of</strong> 50:50 (manure-to-maize) at 250 Nm 3 /h bio<strong>gas</strong>; upgrading<br />
(PWS) at <strong>the</strong> farm and injection in DG at farm. Pipeline <strong>of</strong> 200 m to DG assumed.<br />
Decentralized digestion <strong>of</strong> 50:50 (manure-to-maize) at 250 Nm 3 /h bio<strong>gas</strong>; upgrading<br />
(PWS) at <strong>the</strong> farm; transport <strong>of</strong> <strong>green</strong> <strong>gas</strong> by pipelines (HDPE) over a distance <strong>of</strong> 12<br />
km and injection in <strong>the</strong> RG (4.0 MPa).<br />
Decentralized digestion <strong>of</strong> 50:50 (manure-to-maize) at totally 2000 Nm 3 /h bio<strong>gas</strong> (=<br />
8 farms <strong>of</strong> 250 m 3 /h); centralized (bundled) upgrading (PWS); bio<strong>gas</strong> transport by<br />
pipelines (HDPE) over a total distance <strong>of</strong> 50 km and injection in <strong>the</strong> RG (4.0 MPa).<br />
Transportation <strong>of</strong> biomass (50 km totally); centralized digestion <strong>of</strong> 50:50 (manure-to-<br />
maize) at 2000 Nm 3 /h bio<strong>gas</strong>; centralized upgrading (PWS) and injection in <strong>the</strong> RG<br />
(4.0 MPa). Digestate is transported back to <strong>the</strong> farms.<br />
With regard to pathways 3 and 8 <strong>the</strong> Centre <strong>of</strong> Gravity method was used to determine <strong>the</strong> transporta-<br />
tion distances (explained in section 3.2.1). For <strong>the</strong> locations assumed in this research a total distance <strong>of</strong><br />
50 km was found for transportation <strong>of</strong> both biomass and bio<strong>gas</strong>. In pathway 2 it is assumed that diges-<br />
tion and upgrading is done decentralized and that <strong>green</strong> <strong>gas</strong> is transported to <strong>the</strong> RG. The distance <strong>of</strong><br />
12 km is <strong>the</strong> average distance from all farms to <strong>the</strong> centre (bundle point) plus <strong>the</strong> distance from centre<br />
to <strong>the</strong> <strong>gas</strong> grid. For decentralized digestion, upgrading and injection (pathway 1) it is assumed that a<br />
pipeline is constructed over a distance <strong>of</strong> 200 m for injection in <strong>the</strong> Distribution Grid.<br />
37
Interpretation <strong>of</strong> results<br />
In order to draw conclusions on which system configuration is <strong>the</strong> optimal one, normalization is used<br />
to combine <strong>the</strong> results <strong>of</strong> <strong>the</strong> energetic and economic assessment <strong>of</strong> <strong>the</strong> pathways. The results with re-<br />
gard to <strong>the</strong> energy requirements and costs are considered equally important. Normalization is done by<br />
dividing <strong>the</strong> total expenditure (energy requirements or economics) per pathway by <strong>the</strong> maximum <strong>of</strong> all<br />
considered pathways. If this is done for all pathways in both <strong>the</strong> energetic and economic assessment,<br />
<strong>the</strong> normalized values can be summed up and plotted in one single graph, where <strong>the</strong> pathway with <strong>the</strong><br />
lowest total expenditures is <strong>the</strong> optimal pathway.<br />
38
4 RESULTS<br />
In literature <strong>the</strong> existence <strong>of</strong> scale effects on <strong>the</strong> total <strong>chain</strong> expenditures was indicated. It was also<br />
indicated that transportation is a <strong>critical</strong> factor. Transport <strong>of</strong> biomass or bio<strong>gas</strong> is directly related to <strong>the</strong><br />
location (centralized or decentralized) and capacity <strong>of</strong> digestion and upgrading. Therefore, <strong>the</strong>se as-<br />
pects are discussed in each o<strong>the</strong>r’s follow-up. Fur<strong>the</strong>rmore, it was indicated that <strong>the</strong> choice for a cer-<br />
tain upgrading technique might have influence on <strong>the</strong> total <strong>chain</strong> expenditures.<br />
In this chapter <strong>the</strong> results are presented. Section 4.1 describes <strong>the</strong> effects <strong>of</strong> capacity scale on <strong>the</strong> eco-<br />
nomics <strong>of</strong> every step in <strong>the</strong> GGSC. Section 4.2 focuses on scale effects regarding <strong>the</strong> energy require-<br />
ments. Where after section 4.3 presents transition points between <strong>the</strong> bio<strong>gas</strong> capacity and <strong>the</strong> most<br />
efficient means <strong>of</strong> transportation. In section 4.4 <strong>the</strong> effect <strong>of</strong> <strong>the</strong> choice for a certain upgrading tech-<br />
nique is shown. In section 4.5 an overview <strong>of</strong> <strong>the</strong> total costs and energy requirements <strong>of</strong> different sys-<br />
tem configurations is given.<br />
4.1 Scale effects<br />
This section handles with <strong>the</strong> effects <strong>of</strong> scale on <strong>the</strong> economics and energy requirements in <strong>the</strong> <strong>green</strong><br />
<strong>gas</strong> <strong>supply</strong> <strong>chain</strong>.<br />
4.1.1 Scale effects on <strong>the</strong> Economics in <strong>the</strong> GGSC<br />
The total specific costs for <strong>green</strong> <strong>gas</strong> consist <strong>of</strong> capital costs and operational costs. This distinction is<br />
<strong>of</strong> significance when identifying scale effects. Economies <strong>of</strong> scale are mainly <strong>the</strong> result <strong>of</strong> scale effects<br />
in <strong>the</strong> capital costs (investment) <strong>of</strong> <strong>the</strong> installations. The operational costs are mainly determined by<br />
<strong>the</strong> energy requirements, which are directly proportional to <strong>the</strong> output capacity <strong>of</strong> <strong>the</strong> installation.<br />
Transport <strong>of</strong> Biomass<br />
Truck transportation <strong>of</strong> biomass was found to be linear in relation to increasing capacity. Namely, <strong>the</strong><br />
bio<strong>gas</strong> production capacity requires delivery <strong>of</strong> a substrate load that is directly related to that capacity.<br />
Anaerobic Digestion<br />
For digestion an exponentially decaying curve is found, which shows <strong>the</strong> existence <strong>of</strong> economies <strong>of</strong><br />
scale (Figure 4.1). Such scale effects on <strong>the</strong> costs for digestion were also reported by Amigun & Blott-<br />
nitz (2010), Hornbachner et al. (2005), Ghafoori & Flynn (2007) and Welink et al. (2007). The graph<br />
presents <strong>the</strong> total expenditure (TotEx) <strong>of</strong> anaerobic digestion, where <strong>the</strong> different digester types are<br />
specified for <strong>the</strong> specific manure-to-maize ratios (costs for <strong>the</strong> substrates are excluded). The trend in<br />
<strong>the</strong> cost function clearly shows <strong>the</strong> benefit <strong>of</strong> large scale operation. The exponent in <strong>the</strong> equation <strong>of</strong> <strong>the</strong><br />
line in <strong>the</strong> graph is -0.18.<br />
39
ct€ / MJ<br />
40<br />
0.90<br />
0.80<br />
0.70<br />
0.60<br />
0.50<br />
0.40<br />
Scale effect on economics <strong>of</strong> digestion<br />
Total expenditure (ct€/MJ)<br />
y = 1.98x -0.18<br />
R 2 = 0.99<br />
0 500 1000 1500 2000<br />
Nm 3 /h bio<strong>gas</strong><br />
Figure 4.1: Scale effect on <strong>the</strong> total costs for digestion.<br />
Gas Pipeline Construction<br />
A strong capacity scale effect on <strong>the</strong> specific costs for pipeline construction was found, see Figure 4.2.<br />
The exponent in <strong>the</strong> trend line equation is found to be -1, which indicates very strong scale effects.<br />
ct€ / MJ<br />
4<br />
3.5<br />
3<br />
2.5<br />
2<br />
1.5<br />
1<br />
0.5<br />
0<br />
Scale effect on economics <strong>of</strong> pipeline construction<br />
Capital Expenditure (ct€ / MJ)<br />
y = 342.94x -1.00<br />
R 2 = 1.00<br />
0 500 1000 1500 2000<br />
Nm 3 /h bio<strong>gas</strong><br />
Figure 4.2: Scale effect on pipeline construction costs.<br />
HDPE pipeline<br />
(50 km)<br />
This strong scale effect is <strong>the</strong> result <strong>of</strong> <strong>the</strong> fact that in pipeline construction costs only capital costs ex-<br />
ist. When using a pipeline for higher capacities <strong>of</strong> <strong>gas</strong>, <strong>the</strong> investment can be written <strong>of</strong>f much faster<br />
compared to low capacities since more MJ’s are transported over its lifetime.<br />
Gas Upgrading<br />
When considering different upgrading techniques, it appears that in general <strong>the</strong> upgrading techniques<br />
show a specific cost (TotEx) function that is exponentially decaying. Similar scale effects were also
eported by Welink et al. (2007), Hornbachner et al. (2005) and Persson (2003), <strong>of</strong> which <strong>the</strong> latter<br />
two, however, showed a stronger exponential function. The results by Hornbachner et al. (2005) and<br />
Persson (2003) can be explained by <strong>the</strong> fact that only investment costs were included in <strong>the</strong>se studies.<br />
Since a large part <strong>of</strong> <strong>the</strong> TotEx consists <strong>of</strong> operational costs, <strong>the</strong> scale effect showed in Figure 4.3 was<br />
weaker than reported by Hornbachner et al. (2005) and Persson (2003).<br />
ct€ / MJ<br />
0.60<br />
0.55<br />
0.50<br />
0.45<br />
0.40<br />
0.35<br />
0.30<br />
0.25<br />
0.20<br />
0.15<br />
Scele effect on economics <strong>of</strong> upgrading techniques<br />
Total expenditure (ct€/MJ)<br />
y = 2.92x -0.31<br />
R 2 = 0.98<br />
y = 2.41x -0.28<br />
R 2 = 0.91<br />
y = 6.78x -0.46<br />
R 2 = 0.99<br />
0 500 1000 1500 2000 2500<br />
Nm 3 /h bio<strong>gas</strong><br />
Figure 4.3: Scale effect on <strong>the</strong> total costs for upgrading techniques.<br />
PWS<br />
PSA<br />
Chemical<br />
scrubber<br />
The exponents in <strong>the</strong> equations <strong>of</strong> <strong>the</strong> lines <strong>of</strong> <strong>the</strong> upgrading techniques are -0.46 for PWS, -0.28 for<br />
PSA and -0.31 for <strong>the</strong> chemical scrubber, meaning that PWS shows <strong>the</strong> strongest reciprocal scale ef-<br />
fect on <strong>the</strong> total costs. A graph in which all <strong>the</strong> upgrading techniques are presented can be found in<br />
Appendix III.<br />
Gas Compression<br />
Compression is applied for both transportation <strong>of</strong> <strong>gas</strong> in pipelines as for injection <strong>of</strong> <strong>gas</strong> into <strong>the</strong> <strong>gas</strong><br />
grid. Some scale effects can be found in <strong>the</strong> costs for compression, see Figure 4.4. This is related to<br />
<strong>the</strong> investment costs <strong>of</strong> <strong>the</strong> compressor. The operational expenditures are found to be linear with re-<br />
gard to <strong>the</strong> capacity <strong>of</strong> <strong>the</strong> installation since <strong>the</strong> energy requirements <strong>of</strong> compression are directly pro-<br />
portional to <strong>the</strong> output.<br />
41
ct€ / MJ<br />
42<br />
0.140<br />
0.130<br />
0.120<br />
0.110<br />
0.100<br />
0.090<br />
0.080<br />
0.070<br />
Scale effect on economics <strong>of</strong> compression<br />
Total expenditure (ct€/MJ)<br />
y = 0.25x -0.12<br />
R 2 = 0.93<br />
y = 0.25x -0.12<br />
R 2 = 0.93<br />
y = 0.18x -0.10<br />
R 2 = 0.93<br />
0 500 1000 1500 2000 2500<br />
Nm 3 /h <strong>gas</strong>*<br />
Figure 4.4: Scale effect on <strong>the</strong> economics <strong>of</strong> compression.<br />
0.1 - 0.5 MPa (bio<strong>gas</strong>*)<br />
0.1 - 0.8 MPa (<strong>green</strong> <strong>gas</strong>*)<br />
0.8 - 4.0 MPa (<strong>green</strong> <strong>gas</strong>*)<br />
The share <strong>of</strong> compression in <strong>the</strong> total costs <strong>of</strong> <strong>the</strong> GGSC strongly depends on <strong>the</strong> pressure lift and on<br />
<strong>the</strong> type <strong>of</strong> <strong>gas</strong> compressed. As <strong>the</strong> graph shows, compression <strong>of</strong> bio<strong>gas</strong> to 0.5 MPa (for <strong>gas</strong> transport<br />
purposes) has <strong>the</strong> highest costs. This is <strong>the</strong> result <strong>of</strong> <strong>the</strong> bio<strong>gas</strong> characteristics (density and molar<br />
mass), which are specified in Appendix II. Fur<strong>the</strong>rmore, <strong>the</strong> graph shows higher costs for compression<br />
from 0.1 MPa to 0.8 MPa than for compression from 0.8 to 4.0 MPa. This can be explained by <strong>the</strong> fact<br />
that compression from 0.1 MPa to 0.8 MPa requires compression by a factor 8, where compression<br />
from 0.8 to 4.0 MPa requires compression by only a factor 5.<br />
Green Gas Injection Facility<br />
The injection facility for <strong>green</strong> <strong>gas</strong> consists solely <strong>of</strong> capital (investment) costs. The total investment<br />
strongly depends on <strong>the</strong> <strong>gas</strong> grid, see section 3.4. A very strong scale effect was found for <strong>the</strong> costs <strong>of</strong><br />
an injection facility. The exponent in <strong>the</strong> trend line function is -1, meaning that this step is extremely<br />
sensitive to scale effects. However, <strong>the</strong> share <strong>of</strong> <strong>the</strong> injection facility in <strong>the</strong> total costs for a GGSC is<br />
marginal.<br />
Summary <strong>of</strong> scale effect on Economics<br />
This section summarizes <strong>the</strong> results with regard to <strong>the</strong> scale effects on <strong>the</strong> economics <strong>of</strong> <strong>the</strong> GGSC.<br />
Figure 4.5 shows <strong>the</strong> results regarding <strong>the</strong> economics <strong>of</strong> <strong>the</strong> steps in a GGSC. This figure does not rep-<br />
resent a specific system configuration but summarizes all possible process steps in one graph. When a<br />
specific system configuration is considered, <strong>the</strong> total sum <strong>of</strong> that <strong>chain</strong> will <strong>the</strong>refore be lower than <strong>the</strong><br />
total sum <strong>of</strong> <strong>the</strong> steps in Figure 4.5. Table 4.1 gives an overview <strong>of</strong> <strong>the</strong> scale effects <strong>of</strong> all steps.
ct€ / MJ<br />
5.00<br />
4.50<br />
4.00<br />
3.50<br />
3.00<br />
2.50<br />
2.00<br />
1.50<br />
1.00<br />
0.50<br />
0.00<br />
Scale effect on economics <strong>of</strong> steps in <strong>the</strong> GGSC<br />
100 250 500 1000 1500 2000<br />
Nm 3 /h bio<strong>gas</strong><br />
Figure 4.5: Total overview <strong>of</strong> scale effects on <strong>the</strong> economics <strong>of</strong> <strong>the</strong> GGSC F .<br />
Injection facility<br />
Gas compression (0.8-4.0 MPa)<br />
Green <strong>gas</strong> transport<br />
Gas Upgrading (PWS)<br />
Bio<strong>gas</strong> transport<br />
Pipeline construction (50 km)<br />
Anaerobic Digestion (50:50)<br />
Biomass transport (50 km)<br />
Remarkable is <strong>the</strong> share <strong>of</strong> pipeline construction as a function <strong>of</strong> capacity scale. At low capacities<br />
pipeline construction determine a large proportion <strong>of</strong> <strong>the</strong> total <strong>chain</strong> expenditures, however, this pro-<br />
portion strongly decreases as capacity increases. At high capacities, digestion and upgrading contrib-<br />
ute <strong>the</strong> larger proportion.<br />
Table 4.1: Trend lines functions in economics <strong>of</strong> process steps in GGSC<br />
Process Trend line function Exponent Remark<br />
Transportation <strong>of</strong> Biomass (50 km) y = 0.28 x<br />
Anaerobic Digestion y = 1.98x -0.18 -0.18<br />
Bio<strong>gas</strong> Transport See 'Compression' - -<br />
Pipeline Construction y = 342.94x -1.00 -1<br />
Gas Upgrading:<br />
PWS<br />
PSA<br />
Chemical scrubbing<br />
Membrane<br />
Cryogenic<br />
y = 6.78x -0.46<br />
y = 2.41x -0.30<br />
y = 2.92x -0.31<br />
y = 18.58x -0.65<br />
y = 31.58x -0.62<br />
-0.46<br />
-0.28<br />
-0.31<br />
-0.65<br />
-0.65<br />
Green <strong>gas</strong> Transport See 'Compression' - -<br />
Gas Compression (MPa):<br />
0.1-0.5 (Bio<strong>gas</strong>)<br />
0.1-0.8 (Green <strong>gas</strong>)<br />
0.8-4.0 (Green <strong>gas</strong>)<br />
y = 0.25x -0.12<br />
y = 0.25x -0.12<br />
y = 0.18x -0.10<br />
Green <strong>gas</strong> injection facility y = 0.16x -1 -1<br />
-0.12<br />
-0.12<br />
-0.10<br />
No exponential<br />
function<br />
Unreliable<br />
Unreliable<br />
F <strong>the</strong> value with regard to bio<strong>gas</strong> upgrading with PWS at 100 Nm 3 /h was extrapolated based on <strong>the</strong> trend line<br />
function given in Table 4.1.<br />
43
The strongest scale effect is found for pipeline construction and <strong>the</strong> <strong>green</strong> <strong>gas</strong> injection facility. Up-<br />
grading and digestion show weaker scale effects but contribute a larger proportion at higher capacities.<br />
Since data about membrane and cryogenic separation was very modestly found in literature and con-<br />
sidered to be uncertain, <strong>the</strong> results with regard to <strong>the</strong>se upgrading techniques were found to be unreli-<br />
able.<br />
4.1.2 Scale effects on <strong>the</strong> Energy Requirements <strong>of</strong> <strong>the</strong> GGSC<br />
In general solely <strong>the</strong> energy requirements for pipeline construction and digestion show scale effects.<br />
The strong scale effects (exponent = -1) found for pipeline construction are <strong>the</strong> result <strong>of</strong> <strong>the</strong> ‘capital’<br />
energy requirements. A limited scale effect is found for <strong>the</strong> energy requirements <strong>of</strong> digestion (expo-<br />
nent = -0.12). This is mainly <strong>the</strong> result <strong>of</strong> <strong>the</strong> relative decrease in surface area (heat losses) per unit <strong>of</strong><br />
water (containing heat energy) in <strong>the</strong> digester as total volume increases.<br />
The o<strong>the</strong>r process steps in <strong>the</strong> GGSC show linearity in relation to increasing capacity scale. This is <strong>the</strong><br />
result <strong>of</strong> <strong>the</strong> fact that <strong>the</strong> energy requirements in <strong>the</strong> <strong>supply</strong> <strong>chain</strong> <strong>of</strong> <strong>green</strong> <strong>gas</strong> are mainly determined<br />
by <strong>the</strong> operational (direct) energy requirements. This finding was also reported in a more general con-<br />
text by Moll (1993), who studied <strong>the</strong> direct and indirect contribution <strong>of</strong> energy and materials to <strong>the</strong><br />
lifecycle effects <strong>of</strong> products. Figure 4.6 summarizes <strong>the</strong> energy requirements and <strong>the</strong>ir susceptibility<br />
for scale effects, for <strong>the</strong> process steps in <strong>the</strong> GGSC, not specified for a certain system configuration.<br />
Since this figure includes all possible steps in a <strong>supply</strong> <strong>chain</strong>, <strong>the</strong> total energy requirements in a spe-<br />
cific system configuration are lower than <strong>the</strong> sum <strong>of</strong> <strong>the</strong> steps presented here.<br />
MJ pe / MJ<br />
44<br />
0.90<br />
0.80<br />
0.70<br />
0.60<br />
0.50<br />
0.40<br />
0.30<br />
0.20<br />
0.10<br />
0.00<br />
Energy requirements <strong>of</strong> steps in <strong>the</strong> GGSC<br />
100 250 500 1000 1500 2000<br />
Nm 3 /h bio<strong>gas</strong><br />
Gas Compression (4.0 MPa)<br />
Green <strong>gas</strong> transport<br />
Gas Upgrading (avg.)<br />
Bio<strong>gas</strong> transport<br />
Figure 4.6: Total overview <strong>of</strong> scale effect on <strong>the</strong> energy requirements in <strong>the</strong> GGSC.<br />
Pipeline construction (50 km)<br />
Anaerobic Digestion (50:50)<br />
Biomass transport (50 km)<br />
4.2 Transition Points <strong>of</strong> Transport Means<br />
Transportation <strong>of</strong> biomass to a centralized digestion plant results in scale effects, which is in contrast<br />
with bio<strong>gas</strong> transportation from decentralized digesters to a centralized upgrading and injection plant.<br />
This is <strong>of</strong> great importance when assessing <strong>the</strong> total <strong>chain</strong> effects <strong>of</strong> <strong>the</strong> transport means. Intersections
etween biomass truck transport and bio<strong>gas</strong> pipeline transport, as a function <strong>of</strong> distance and capacity<br />
scale, are identified. The results are presented in Figure 4.7. The left side <strong>of</strong> each line represents <strong>the</strong><br />
area in which truck transport <strong>of</strong> biomass (1) is optimal and <strong>the</strong> area to <strong>the</strong> right <strong>of</strong> each line represents<br />
that pipeline transport <strong>of</strong> bio<strong>gas</strong> (2) is optimal. In <strong>the</strong> area between <strong>the</strong> lines (1 or 2) it depends on ones<br />
preferences which means <strong>of</strong> transport is considered to be optimal.<br />
Biomass truck transport was found to be more economical than bio<strong>gas</strong> transport for distances up to<br />
200 km at 1750 Nm 3 /h bio<strong>gas</strong> or 150 km at 2000 Nm 3 /h bio<strong>gas</strong>. With regard to <strong>the</strong> energy require-<br />
ments transport is more efficiently done by biomass trucks than bio<strong>gas</strong> pipelines at distances up to 200<br />
km at 480 Nm 3 /h bio<strong>gas</strong> or 40 km at 2000 Nm 3 /h bio<strong>gas</strong>.<br />
Exceeding <strong>the</strong>se break-even points means that pipeline transportation <strong>of</strong> bio<strong>gas</strong> is more economical or<br />
efficient than transportation <strong>of</strong> biomass to a centralized digester.<br />
km<br />
200<br />
150<br />
100<br />
50<br />
0<br />
Transition <strong>of</strong> transport means<br />
0 500 1000 1500 2000<br />
Nm 3 /h Bio<strong>gas</strong><br />
Figure 4.7: Transition lines <strong>of</strong> most efficient and economic transport means.<br />
Capacities exceeding 2000 Nm 3 /h were not assessed since data about digestion was not considered for<br />
larger scales. With regard to <strong>the</strong> distance evaluated, it was assumed that distances up to 200 km are<br />
relevant for <strong>the</strong> Dutch situation since system configurations in which a coalition <strong>of</strong> farms or digesters<br />
is used, might cover 200 km. Longer distances were considered to be unrealistic for <strong>green</strong> <strong>gas</strong> system<br />
configurations.<br />
1<br />
1 or 2<br />
4.3 Upgrading Techniques<br />
In order to assess <strong>the</strong> performances <strong>of</strong> different upgrading techniques, <strong>the</strong> results <strong>of</strong> five scenarios as<br />
described in section 3.3 are presented here (Figure 4.8 and Figure 4.9). It should be noted though that<br />
<strong>the</strong> results <strong>of</strong> <strong>the</strong> economic assessment with regard to membrane and cryogenic separation are consid-<br />
ered to be unreliable. Data about <strong>the</strong> economics <strong>of</strong> <strong>the</strong>se two upgrading techniques was reported very<br />
modest and with high uncertainty. Therefore, <strong>the</strong>se upgrading techniques are indicated with '*'.<br />
2<br />
MJ<br />
€<br />
45
MJpe / MJ<br />
46<br />
0.35<br />
0.30<br />
0.25<br />
0.20<br />
0.15<br />
0.10<br />
0.05<br />
0.00<br />
Scenarios upgrading techniques<br />
Energy requirements<br />
PWS PSA Chemical<br />
srubbing<br />
Membrane* Cryogenic*<br />
Anaerobic Digestion Pipeline construction Bio<strong>gas</strong> transport<br />
Gas Upgrading Gas compression<br />
Figure 4.8: Energy requirements <strong>of</strong> system configurations with different upgrading techniques.<br />
ct€ / MJ<br />
1.60<br />
1.40<br />
1.20<br />
1.00<br />
0.80<br />
0.60<br />
0.40<br />
0.20<br />
0.00<br />
Scenarios upgrading techniques<br />
Economics<br />
PWS PSA Chemical srubbing Membrane* Cryogenic*<br />
Anaerobic Digestion Pipeline construction Bio<strong>gas</strong> transport<br />
Gas Upgrading Gas compression Injection facility<br />
Figure 4.9: Total costs <strong>of</strong> system configurations with different upgrading techniques.
Index<br />
2.00<br />
1.80<br />
1.60<br />
1.40<br />
1.20<br />
1.00<br />
0.80<br />
0.60<br />
0.40<br />
0.20<br />
0.00<br />
Total normalized score upgrading<br />
1.00 0.93 0.88<br />
0.87<br />
0.84<br />
0.88 0.94 1.00 0.90 0.86<br />
PWS PSA Chemical<br />
srubbing<br />
Membrane* Cryogenic*<br />
Normalized economics Normalized energy requirements<br />
Figure 4.10: Normalized results <strong>of</strong> upgrading techniques.<br />
PWS, PSA and chemical scrubbing were found to <strong>the</strong> similar overall index numbers, meaning that<br />
<strong>the</strong>re is no 'optimal' upgrading technique when considering <strong>the</strong> energy requirements and costs equally<br />
important. PWS is <strong>the</strong> most economical upgrading technique and chemical scrubbing <strong>the</strong> most effi-<br />
cient one. Including cryogenic and membrane separation, <strong>the</strong> cryogenic technology is <strong>the</strong> optimal one.<br />
This is mainly <strong>the</strong> result <strong>of</strong> <strong>the</strong> integrated compression to 4.0 MPa which makes separate compression<br />
to RG pressure redundant. This effect <strong>of</strong> <strong>the</strong> choice for a specific upgrading technique was also indi-<br />
cated by Tilburg et al. (2008b) and Vlap (2010).<br />
4.4 Pathways<br />
The pathways assessed in this research (defined in section 3.5.1) show significant differences in both<br />
<strong>the</strong> energy requirements and <strong>the</strong> total costs. The results for <strong>the</strong> assessment <strong>of</strong> both energy requirements<br />
and costs are shown in Figure 4.11 and Figure 4.12.<br />
47
48<br />
MJ pe / MJ<br />
0.4<br />
0.35<br />
0.3<br />
0.25<br />
0.2<br />
0.15<br />
0.1<br />
0.05<br />
0<br />
Energy requirements <strong>of</strong> pathways<br />
1 2 3 8<br />
Biomass transport Anaerobic Digestion Pipeline construction<br />
Bio<strong>gas</strong>/Green <strong>gas</strong> transport Gas Upgrading Gas compression<br />
Figure 4.11: Total energy requirements <strong>of</strong> different pathways (defined in section 3.3).<br />
ct€ / MJ<br />
2<br />
1.8<br />
1.6<br />
1.4<br />
1.2<br />
1<br />
0.8<br />
0.6<br />
0.4<br />
0.2<br />
0<br />
Economics <strong>of</strong> pathways<br />
1 2 3 8<br />
Biomass transport Anaerobic Digestion Pipeline construction<br />
Bio<strong>gas</strong>/Green <strong>gas</strong> transport Gas Upgrading Gas compression<br />
Injection facility<br />
Figure 4.12: Total costs <strong>of</strong> different pathways (defined in section 3.3).<br />
In <strong>the</strong> graphs it is clearly visible that digestion has, on average, <strong>the</strong> largest share in <strong>the</strong> total energy<br />
requirements and costs <strong>of</strong> <strong>the</strong> pathways in which bio<strong>gas</strong> is upgraded to <strong>green</strong> <strong>gas</strong>. The share <strong>of</strong> upgrad-<br />
ing in <strong>the</strong> energy requirements (Figure 4.11) is large, but in <strong>the</strong> total costs (Figure 4.12) <strong>the</strong> proportion<br />
is highly dependant on <strong>the</strong> capacity scale. Bio<strong>gas</strong> transport, compression and injection contribute to a<br />
smaller fraction <strong>of</strong> total. The scenario in which biomass is transported by truck to a centralized diges-<br />
tion plant is found to be <strong>the</strong> most economic and efficient scenario. This is mainly <strong>the</strong> result <strong>of</strong> <strong>the</strong> large<br />
impact <strong>of</strong> <strong>the</strong> scale effects in digestion.<br />
The net best pathway for both <strong>the</strong> energy requirements and costs is found by plotting <strong>the</strong> sum <strong>of</strong> <strong>the</strong><br />
normalized values <strong>of</strong> <strong>the</strong> pathways in one graph, presented in Figure 4.13.
Index<br />
2.50<br />
2.00<br />
1.50<br />
1.00<br />
0.50<br />
0.00<br />
0.82<br />
0.73<br />
Total normalized score pathways<br />
1.00<br />
1.00<br />
0.89<br />
0.71<br />
1 2 3 8<br />
Figure 4.13: Normalized results <strong>of</strong> pathways.<br />
Normalized economics Normalized energy requirements<br />
The main result from this figure is that pathway 8 (t-cD-cU-cI) is <strong>the</strong> net best pathway, based on <strong>the</strong><br />
system configurations described in Table 3.4. Pathway 8 represents <strong>the</strong> system configuration in which<br />
biomass is transported by truck from farms to a centralized digester where after bio<strong>gas</strong> is upgraded<br />
centralized and <strong>green</strong> <strong>gas</strong> injected in <strong>the</strong> RG.<br />
4.5 Sensitivity Analysis Transport<br />
Transportation is found to be a <strong>critical</strong> aspect within <strong>the</strong> <strong>green</strong> <strong>gas</strong> <strong>supply</strong> <strong>chain</strong>. A sensitivity analysis<br />
is performed to gain insight in <strong>the</strong> effects <strong>of</strong> changes in certain parameters on <strong>the</strong> results with regard to<br />
transportation.<br />
First <strong>the</strong> sensitivity <strong>of</strong> <strong>the</strong> transition points in section 4.3 is identified, followed by <strong>the</strong> sensitivity with<br />
regard to <strong>the</strong> results <strong>of</strong> <strong>the</strong> optimal pathway (section 4.5).<br />
Transition Points <strong>of</strong> Transport Means<br />
Following graph (Figure 4.14) shows <strong>the</strong> sensitivity <strong>of</strong> <strong>the</strong> transition points at 150 km in Figure 4.7 to<br />
<strong>the</strong> change <strong>of</strong> some relevant parameters. The transition points at this distance is chosen for <strong>the</strong><br />
assessment <strong>of</strong> <strong>the</strong> sensitivity because no transition point regarding <strong>the</strong> economics was found for<br />
distances shorter than 150 km.<br />
The y-axis represents <strong>the</strong> change (%) <strong>of</strong> <strong>the</strong> parameter and <strong>the</strong> x-axis <strong>the</strong> effect <strong>of</strong> that change on <strong>the</strong><br />
transition point.<br />
0.92<br />
0.59<br />
49
50<br />
Change to parameter (%)<br />
60%<br />
40%<br />
20%<br />
0%<br />
-20%<br />
-40%<br />
-60%<br />
Sensitivity <strong>of</strong> transition point 150 km<br />
0 500 1000 1500 2000<br />
Figure 4.14: Sensitivity <strong>of</strong> transition points.<br />
Nm 3 /h Bio<strong>gas</strong><br />
MJ Bio<strong>gas</strong> yield Manure<br />
MJ Bio<strong>gas</strong> yield Maize silage<br />
MJ Transport Manure<br />
MJ Transport Maize silage<br />
MJ Pipeline + Compression<br />
€ Bio<strong>gas</strong> yield Manure<br />
€ Bio<strong>gas</strong> yield Maize silage<br />
€ Transport Manure<br />
€ Transport Maize silage<br />
€ Pipeline + Compression<br />
Changes in <strong>the</strong> bio<strong>gas</strong> yield from maize silage show significant effects. This means that <strong>the</strong> actual<br />
realistic bio<strong>gas</strong> production from maize silage (dependant on different process parameters in digestion)<br />
or <strong>the</strong> assumption on <strong>the</strong> bio<strong>gas</strong> yield in calculations should carefully be considered. Also <strong>the</strong> changes<br />
in <strong>the</strong> expenditures (energy requirements and costs) for bio<strong>gas</strong> transport (pipeline + compression) have<br />
significant effects on <strong>the</strong> transition points. Fur<strong>the</strong>r more, <strong>the</strong> changes in <strong>the</strong> expenditures for biomass<br />
truck transport show significant effects. This can be explained by <strong>the</strong> fact that more transport is<br />
required when <strong>the</strong> bio<strong>gas</strong> yields decrease. This results in increasing expenditures for truck transport,<br />
meaning that <strong>the</strong> transition point at which pipeline transport becomes more interesting shifts to <strong>the</strong> left<br />
(at lower capacities).<br />
The reason that no shifts occur to higher capacities (exceeding 2000 Nm 3 /h bio<strong>gas</strong>) is that no data was<br />
considered for digestion <strong>of</strong> larger capacities.<br />
Optimal Pathway<br />
The results in Figure 4.13 show that pathway 8 is <strong>the</strong> optimal pathway within <strong>the</strong> system configura-<br />
tions as defined in Table 3.4. Before concluding on this result it is relevant to identify <strong>the</strong> effect <strong>of</strong> <strong>the</strong><br />
total distance on <strong>the</strong> results, since transportation is found to be a <strong>critical</strong> factor. Fur<strong>the</strong>rmore, <strong>the</strong> bio-<br />
<strong>gas</strong> yield from maize silage was found to have great influence on <strong>the</strong> expenditures for transportation<br />
(see Figure 4.14).<br />
Figure 4.15 and Figure 4.16 show <strong>the</strong> effects <strong>of</strong> changes in distance and bio<strong>gas</strong> yield from maize si-<br />
lage, respectively, to <strong>the</strong> energy requirements, economics and normalized values <strong>of</strong> <strong>the</strong> pathways. On<br />
<strong>the</strong> x-axis <strong>the</strong> pathways are presented. The y-axis presents <strong>the</strong> values corresponding to ei<strong>the</strong>r <strong>the</strong> en-<br />
ergy requirements, economics or normalized values. In <strong>the</strong> legend <strong>the</strong> effects on <strong>the</strong> normalized values<br />
are indicated with an 'N', <strong>the</strong> effects on <strong>the</strong> economics with a '€'-sign and <strong>the</strong> energy requirements with
'MJ'. The percentages in Figure 4.15 are <strong>the</strong> percentages change to <strong>the</strong> distance <strong>of</strong> 50 km (reference<br />
situation) and in Figure 4.16 to <strong>the</strong> bio<strong>gas</strong> yield from maize silage (200 Nm 3 /tonne).<br />
(MJpe/MJ) - (ct€/MJ) - (Normalized)<br />
2<br />
1.5<br />
1<br />
0.5<br />
0<br />
Sensitivity to Distance<br />
1 2 3 8<br />
Pathways<br />
Figure 4.15: Sensitivity <strong>of</strong> pathways to changes in total distance.<br />
Normalized (-)<br />
Economics (ct€/MJ)<br />
Energy Requirements (MJpe/MJ)<br />
Figure 4.15 shows that at a total distance exceeding 60 km (is +25%) pathway 3 and 8 have <strong>the</strong> same<br />
normalized value. It also shows that from that distance pathway 1 (dD-dU-dI) becomes <strong>the</strong> optimal<br />
pathway, since it is not dependant on distance. The increase in <strong>the</strong> economics <strong>of</strong> pathway 2 as a func-<br />
tion <strong>of</strong> distance can be explained by <strong>the</strong> fact that <strong>the</strong> costs for a single pipeline to <strong>the</strong> RG has to be<br />
written <strong>of</strong>f over only 250 Nm 3 /h, which is in contrast with pathway 3 where it can be written <strong>of</strong>f over<br />
2000 Nm 3 /h.<br />
The effect <strong>of</strong> bio<strong>gas</strong> yield from maize silage is also important to consider, see Figure 4.16. If maize<br />
silage has a lower bio<strong>gas</strong> yield, more truck transport is needed to maintain <strong>the</strong> production capacity.<br />
This is <strong>the</strong> reason that <strong>the</strong> effect <strong>of</strong> bio<strong>gas</strong> yield from maize silage is only visible through pathway 8.<br />
In <strong>the</strong> o<strong>the</strong>r pathways it is assumed that <strong>the</strong> substrates are available at <strong>the</strong> farm location. Thus, changes<br />
to <strong>the</strong> bio<strong>gas</strong> yield from maize silage have significant effects on <strong>the</strong> conclusion about <strong>the</strong> optimal<br />
pathway.<br />
N -50%<br />
N -25%<br />
N +25%<br />
N +50%<br />
€ -50%<br />
€ -25%<br />
€ +25%<br />
€ +50%<br />
MJ -50%<br />
MJ -25%<br />
MJ +25%<br />
MJ +50%<br />
51
52<br />
(MJpe/MJ) - (ct€/MJ) - (Normalized)<br />
2<br />
1.5<br />
1<br />
0.5<br />
0<br />
Sensitivity to Bio<strong>gas</strong> yield Maize silage<br />
Normalized (-)<br />
Economics (ct€/MJ)<br />
1 2 3 8<br />
Pathways<br />
Figure 4.16: Sensitivity <strong>of</strong> pathways to bio<strong>gas</strong> yield <strong>of</strong> maize silage.<br />
Energy Requirements (MJpe/MJ)<br />
N -50%<br />
N -25%<br />
N +25%<br />
N +50%<br />
€ -50%<br />
€ -25€<br />
€ +25%<br />
€ +50%<br />
MJ -50%<br />
MJ -25%<br />
MJ +25%<br />
MJ +50%
5 CONCLUSIONS<br />
In this chapter <strong>the</strong> final conclusions about optimization <strong>of</strong> <strong>the</strong> GGSC are presented. Firstly <strong>the</strong> <strong>critical</strong><br />
choices are described, followed by <strong>the</strong> effect <strong>of</strong> capacity scale or <strong>the</strong> choice for a certain upgrading<br />
technique on <strong>the</strong> different process steps. Finally <strong>the</strong> most optimal system configuration is presented.<br />
Critical Choices<br />
Firstly, determination <strong>of</strong> <strong>the</strong> potential bio<strong>gas</strong> production in an area is <strong>of</strong> importance since it determines<br />
<strong>the</strong> grid in which injection is possible. Injection in <strong>the</strong> Distribution Grid has <strong>the</strong> lowest energy re-<br />
quirements and costs because it operates at low pressures and is widely available. However, <strong>the</strong> Dis-<br />
tribution Grid is only limited susceptible for injection <strong>of</strong> <strong>green</strong> <strong>gas</strong> (max 150 Nm 3 /h <strong>green</strong> <strong>gas</strong>, depend-<br />
ing on <strong>the</strong> exact location), hampering large scale <strong>green</strong> <strong>gas</strong> injection and <strong>the</strong>reby causing meso-level<br />
problems. System configurations <strong>of</strong> centralized, upgrading and injection in Regional Grid <strong>of</strong>fer oppor-<br />
tunities for more <strong>green</strong> <strong>gas</strong> initiatives, since nearby farms can decide to 'join' <strong>the</strong> infrastructure. There<br />
exists no maximum injection capacity for <strong>the</strong> Regional Grid.<br />
The choices with regard to <strong>the</strong> <strong>gas</strong> grid subsequently determine whe<strong>the</strong>r or not transportation (ei<strong>the</strong>r<br />
biomass or bio<strong>gas</strong>) is required. If transportation is required it depends on <strong>the</strong> total distance and produc-<br />
tion capacity which means <strong>of</strong> transport is preferred. Fur<strong>the</strong>rmore, <strong>the</strong> choice for a certain upgrading<br />
technique is <strong>critical</strong> since it influences <strong>the</strong> energy demand for compression to grid pressure.<br />
Consequences <strong>of</strong> <strong>Optimization</strong><br />
It was found that optimization by increasing <strong>the</strong> capacity scale mainly occurs in <strong>the</strong> economics <strong>of</strong> a<br />
<strong>green</strong> <strong>gas</strong> <strong>supply</strong> <strong>chain</strong>. <strong>Optimization</strong> in <strong>the</strong> economics <strong>of</strong> a total <strong>green</strong> <strong>gas</strong> <strong>supply</strong> <strong>chain</strong> can be real-<br />
ized by <strong>the</strong> installation <strong>of</strong> a large scale (great capacity) upgrading facility. Additionally, <strong>the</strong> effect <strong>of</strong><br />
scale on <strong>the</strong> costs for digestion is significant. It can be concluded that large scale upgrading and diges-<br />
tion (within boundaries) is beneficial. With regard to <strong>the</strong> choice for an upgrading technique it can be<br />
concluded that integration <strong>of</strong> <strong>the</strong> Pressurized Water Scrubbing technology results in minimization <strong>of</strong><br />
<strong>the</strong> total <strong>chain</strong> costs. However, integration <strong>of</strong> Chemical Scrubbing for bio<strong>gas</strong> upgrading results in<br />
minimization <strong>of</strong> <strong>the</strong> total <strong>chain</strong> energy requirements. The Regional Grid should be used for injection <strong>of</strong><br />
<strong>green</strong> <strong>gas</strong> since it is not limited by a maximum injection capacity and will, consequently, not hamper<br />
<strong>the</strong> development <strong>of</strong> more <strong>green</strong> <strong>gas</strong> initiatives in a certain area.<br />
Optimal System Configuration<br />
The optimal system configuration, based on <strong>the</strong> generic model, is a configuration in which bio<strong>gas</strong> up-<br />
grading is done centralized where after <strong>green</strong> <strong>gas</strong> is injected in <strong>the</strong> Regional Grid. Whe<strong>the</strong>r biomass<br />
has to be digested centralized or decentralized depends on <strong>the</strong> total distances and <strong>gas</strong> capacities con-<br />
sidered. Centralized digestion, upgrading and injection into <strong>the</strong> Regional Grid is beneficial from both<br />
<strong>the</strong> energetic and economic perspective within <strong>the</strong> condition that a total bio<strong>gas</strong> capacity up to 2000<br />
Nm 3 /h at a maximum total distance <strong>of</strong> 150 km is available. Exceeding <strong>the</strong>se conditions would favor<br />
<strong>the</strong> system configuration in which decentralized digestion, upgrading and injection into <strong>the</strong> Regional<br />
Grid is done. However, based on <strong>the</strong> normalized values this transition point exists at 65 km’s.<br />
53
With regard to large scale upgrading installations Pressurized Water Scrubbing, Pressure Swing Ad-<br />
sorption and Chemical Scrubbing scored similar on <strong>the</strong> normalized scale. When <strong>the</strong> choice is driven by<br />
economics, Pressurized Water Scrubbing is better and when driven by energy requirements, Chemical<br />
Scrubbing is better.<br />
Sensitivity analyses showed that especially <strong>the</strong> bio<strong>gas</strong> yield from maize silage, transportation distances<br />
and transportation costs/energy requirements have great influence on <strong>the</strong> overall results and conclu-<br />
sions. The results and conclusions reported here are based on a generic model approach, in specific<br />
situations results and conclusions can be different.<br />
54
6 DISCUSSION<br />
In this chapter some results and conclusions are discussed. Additionally, some aspects that need some<br />
extra attention or aspects that were excluded from this study are discussed in this chapter.<br />
Centre <strong>of</strong> Gravity method<br />
The methodology used in this research for <strong>the</strong> determination <strong>of</strong> distances in <strong>the</strong> generic model, is<br />
based on Euclidian distances. It is likely to assume that in reality no point-to-point connections will be<br />
constructed, meaning that <strong>the</strong> distances for road transport will probably be larger in reality than those<br />
calculated with this method. Additionally, <strong>the</strong> Centre <strong>of</strong> Gravity method is not able to design grid<br />
structures. The bio<strong>gas</strong> pipeline structure applied in this research is likely to be suboptimal. Both <strong>the</strong>se<br />
aspects will have effects on <strong>the</strong> results and thus on <strong>the</strong> final conclusions.<br />
Availability <strong>of</strong> data<br />
A large part <strong>of</strong> <strong>the</strong> data in <strong>the</strong> generic model was based on data from Fraunh<strong>of</strong>er (Urban et al., 2009;<br />
DENA, 2009). This data was based on <strong>the</strong> German situation. According to Vlap (2010) and Ommen<br />
(2010) German data on <strong>the</strong> economics <strong>of</strong> digestion and upgrading might be relatively high compared<br />
to <strong>the</strong> Dutch situation.<br />
Data about cryogenic and membrane separation was very modestly found in literature. The data that<br />
was obtained was derived directly or indirectly from quotations. This means that it is likely to assume<br />
that commercial interests are translated through <strong>the</strong>se data. Results were <strong>the</strong>refore considered unreli-<br />
able, and consequently, no conclusions were drawn with regard to <strong>the</strong>se techniques. However, espe-<br />
cially cryogenic separation seems promising (also reported by Olajire, 2010). Since <strong>the</strong> output <strong>gas</strong><br />
pressure becomes available at about 4.0 MPa, it is likely that application <strong>of</strong> cryogenic upgrading<br />
avoids fur<strong>the</strong>r compression (with accompanying costs and energy requirements).<br />
Methane slip<br />
In this research <strong>the</strong> loss <strong>of</strong> methane (methane-slip) in all steps <strong>of</strong> <strong>the</strong> <strong>green</strong> <strong>gas</strong> <strong>chain</strong> has not been con-<br />
sidered. These losses are on average in <strong>the</strong> range <strong>of</strong> a few percentages in <strong>the</strong> overall <strong>chain</strong>, where <strong>the</strong><br />
upgrading step contributes <strong>the</strong> largest share. Especially membrane separation has high methane losses,<br />
typically >20%. However, <strong>the</strong>re are indications that membrane’s <strong>of</strong>f <strong>gas</strong> has sufficient energetic value<br />
to fulfill digesters heat demand. This would mean that bio<strong>gas</strong> can be utilized for 100% when mem-<br />
brane separation is applied near <strong>the</strong> digester. Since this research did not include this aspect, conclu-<br />
sions on <strong>the</strong> optimal system configuration might change when taking this aspect into consideration.<br />
Pre-desulphurization<br />
Application <strong>of</strong> membrane separation for bio<strong>gas</strong> upgrading does require pre-desulphurization in prac-<br />
tice. This has not been included in this study. This means that <strong>the</strong> total costs and energy requirements<br />
in a system configuration in which membrane separation is applied will be higher than reported in this<br />
study.<br />
55
Gas-overflow<br />
In <strong>the</strong> developments <strong>of</strong> <strong>the</strong> <strong>green</strong> <strong>gas</strong> market and injection <strong>of</strong> <strong>green</strong> <strong>gas</strong> to <strong>the</strong> natural <strong>gas</strong> system, some<br />
<strong>gas</strong> grid operators are studying <strong>the</strong> possibilities to enable <strong>gas</strong> transmission in two directions (up-<br />
stream-downstream and <strong>the</strong> o<strong>the</strong>r way around). This would mean that it might become possible to in-<br />
ject large capacities <strong>of</strong> <strong>gas</strong> into <strong>the</strong> low-pressure grids without over pressurizing <strong>the</strong> network. Gas is<br />
than transmitted from low pressure grids to grids with higher operating pressures (e.g. from Distribu-<br />
tion Grid to RG). This principle is called '<strong>gas</strong> overflow' and is in practice not yet applicable. Enabling<br />
this possibility would <strong>of</strong>fer full scale decentralized injection <strong>of</strong> <strong>gas</strong> and might consequently lower<br />
overall <strong>supply</strong> <strong>chain</strong> costs and energy requirements. The '<strong>gas</strong> overflow' technology is a promising<br />
meso-level solution for <strong>green</strong> <strong>gas</strong> <strong>supply</strong> <strong>chain</strong> optimization. However, since <strong>the</strong> developments in this<br />
issue are just commencing, this option was excluded in this study.<br />
Compressor waste heat<br />
With regard to decentralized compression for transportation and injection purposes, <strong>the</strong> possibility to<br />
utilize waste heat from compression has been left out <strong>of</strong> scope. Thermal energy generated in <strong>the</strong> com-<br />
pressor might be applied for heating <strong>the</strong> digester, which would lower <strong>the</strong> demand for external energy.<br />
However, since <strong>the</strong> specific heat capacity <strong>of</strong> water is larger than that <strong>of</strong> <strong>gas</strong>ses, expectations are that<br />
<strong>the</strong> generated heat from bio<strong>gas</strong> compression could only <strong>supply</strong> a fraction <strong>of</strong> <strong>the</strong> total heat demand <strong>of</strong><br />
<strong>the</strong> digester.<br />
Combined Heat and Power (CHP)<br />
In practice a <strong>critical</strong> choice for initiators <strong>of</strong> a bio<strong>gas</strong> project is to apply ei<strong>the</strong>r a <strong>green</strong> <strong>gas</strong> <strong>chain</strong> or a<br />
bio<strong>gas</strong> CHP unit. In <strong>the</strong> generic model <strong>the</strong> CHP option was included in all assessments since KEMA<br />
was highly interested in such a comparison. The assessment showed that a total bio<strong>gas</strong> utilization sys-<br />
tem in which a CHP unit is applied, is <strong>the</strong> cheapest option, however, since a large part <strong>of</strong> <strong>the</strong> waste<br />
heat is emitted to <strong>the</strong> atmosphere <strong>the</strong> CHP has very high 'energy requirements'. The overall normalized<br />
results showed that application <strong>of</strong> a CHP unit for bio<strong>gas</strong> utilization has <strong>the</strong> highest overall score. This<br />
means that <strong>the</strong> production <strong>of</strong> <strong>green</strong> <strong>gas</strong> from bio<strong>gas</strong> is a better option than utilization in a CHP when<br />
<strong>the</strong> energy requirements and economics are considered to be equally important.<br />
56
7 RECOMMENDATIONS FOR FURTHER RESEARCH<br />
This chapter discusses <strong>the</strong> subjects that need more research in <strong>the</strong> future. Firstly some novel technolo-<br />
gies are mentioned that might lower overall <strong>chain</strong> energy requirements and costs. Thereafter, briefly<br />
<strong>the</strong> availability <strong>of</strong> information, sustainability <strong>of</strong> <strong>green</strong> <strong>gas</strong> and <strong>the</strong> need for operations research tech-<br />
niques are discussed.<br />
Innovative upgrading techniques<br />
In <strong>the</strong> GGSC <strong>the</strong> largest share <strong>of</strong> <strong>the</strong> total costs and energy requirements is composed <strong>of</strong> digestion and<br />
upgrading. In literature some interesting innovative technologies can be found that could drastically<br />
increase <strong>the</strong> <strong>chain</strong> efficiency and lower <strong>the</strong> total costs. Biological bio<strong>gas</strong> upgrading and/or in-situ<br />
methane enrichment are such technologies. According to Bekkering et al. (2010) <strong>the</strong> total costs for in-<br />
situ methane enrichment are estimated to be significantly lower than <strong>the</strong> costs for conventional post-<br />
upgrading <strong>of</strong> bio<strong>gas</strong>. Since <strong>the</strong>se techniques are still in an experimental phase, no accurate data is<br />
available on <strong>the</strong> energy requirements and costs. Never<strong>the</strong>less, <strong>the</strong>se promising technologies might<br />
have great positive influence on <strong>the</strong> total <strong>chain</strong> efficiency <strong>of</strong> <strong>green</strong> <strong>gas</strong>.<br />
Biological bio<strong>gas</strong> upgrading<br />
Mann et al. (2009) presented results from laboratory experiments <strong>of</strong> bio<strong>gas</strong> upgrading with micro al-<br />
gae (Chlorella vulgaris.), on a scale <strong>of</strong> 0.45 liter <strong>of</strong> culture volume. The authors reported removal effi-<br />
ciencies <strong>of</strong> 97% for CO2 and 100% for H2S. Parallel to <strong>gas</strong> upgrading, micro algae allow for <strong>the</strong> pro-<br />
duction <strong>of</strong> marketable products like proteins, feedstock, and pharmaceutical valuable substances. A<br />
drawback <strong>of</strong> this method for bio<strong>gas</strong> upgrading is that <strong>the</strong> algae produce significant amounts <strong>of</strong> oxygen<br />
(>23 vol%). Besides <strong>the</strong> effect <strong>of</strong> higher concentrations <strong>of</strong> oxygen on <strong>the</strong> flammability <strong>of</strong> <strong>the</strong> methane<br />
<strong>gas</strong> mixture, <strong>gas</strong> grid specifications do not allow for such concentrations <strong>of</strong> oxygen. Removal <strong>of</strong> oxy-<br />
gen is not possible with current bio<strong>gas</strong> upgrading techniques, so realization <strong>of</strong> high methane contents<br />
will probably be even more difficult when algae are applied than when conventional bio<strong>gas</strong> upgrading<br />
is applied (Vlap, 2010).<br />
In-situ methane enrichment<br />
Concepts for in-situ methane enrichment were proposed by Hayes et al. (1990), Jewell et al. (1993),<br />
Richards et al. (1994), Lindberg & Rasmuson (2006a, 2006b) and Lindeboom et al. (2009). Lindberg<br />
& Rasmuson (2006a, 2006b) proposed selective desorption <strong>of</strong> CO2 from a circulating liquid stream<br />
from <strong>the</strong> digester. A bubble column was installed to treat <strong>the</strong> liquid stream with air for CO2 desorption.<br />
The lowest methane loss reported was 2%. With regard to H2S <strong>the</strong> authors reported successful desorp-<br />
tion but mentioned uncertainties. Similar to this technology are those <strong>of</strong> Hayes et al. (1990), Jewell et<br />
al. (1993) and Richards et al. (1994), where leachate recirculation enabled <strong>gas</strong> stripping outside <strong>the</strong><br />
digester. All authors reported methane concentrations <strong>of</strong> >90% in <strong>the</strong> <strong>gas</strong>eous phase <strong>of</strong> <strong>the</strong> digester.<br />
When in-situ methane enrichment is performed, bio<strong>gas</strong> transportation (compression) costs and energy<br />
requirements will decrease significantly as a result <strong>of</strong> lower CO2 concentrations in bio<strong>gas</strong> (decreasing<br />
total <strong>gas</strong> volume and changing bio<strong>gas</strong> characteristics).<br />
57
Lindeboom et al. (2009) proposed a new process for anaerobic digestion (‘Autogenerative High Pres-<br />
sure Digestion’; AHPD) in which biologically produced pressure resulted in increasing methane con-<br />
tents (>90%). Since <strong>the</strong> solubility <strong>of</strong> <strong>gas</strong>ses is directly proportional to <strong>the</strong> prevailing pressure, CO2 and<br />
H2S dissolve at increasing pressure. Additionally, <strong>the</strong> authors mentioned <strong>the</strong> value <strong>of</strong> bio-pressure to<br />
drive pumps or to force media through membranes. Pressures <strong>of</strong> 9.0 MPa were reported without de-<br />
creasing biological activity. This bio-pressure might be valuable when <strong>green</strong> <strong>gas</strong> injection into <strong>the</strong> <strong>gas</strong><br />
grid is part <strong>of</strong> <strong>the</strong> <strong>supply</strong> <strong>chain</strong>. It is expected that <strong>the</strong> costs for digestion will increase since stronger<br />
materials are required to sustain <strong>the</strong> high pressures. However, this technology might replace conven-<br />
tional post-upgrading and compression, resulting in substantially improved <strong>chain</strong> efficiency.<br />
Gas overflow<br />
As explained in <strong>the</strong> discussion, distribution grids may be enabled in <strong>the</strong> future for injection <strong>of</strong> capaci-<br />
ties exceeding 150 Nm 3 /h <strong>green</strong> <strong>gas</strong>. This should be achieved by enabling <strong>the</strong> grid for two directions<br />
<strong>of</strong> <strong>gas</strong> transmission (upstream-downstream and <strong>the</strong> o<strong>the</strong>r way around). More research should be done<br />
to <strong>the</strong> possibilities <strong>of</strong> such a system for fur<strong>the</strong>r GGSC optimization. A variant to <strong>the</strong> <strong>gas</strong> overflow<br />
could be an overflow in which a CHP unit is applied. This would mean that excess <strong>green</strong> <strong>gas</strong> would be<br />
utilized in a CHP for <strong>the</strong> period <strong>of</strong> time that <strong>the</strong> <strong>gas</strong> <strong>supply</strong> to <strong>the</strong> DG exceeds <strong>the</strong> demand. In this case<br />
a large proportion <strong>of</strong> <strong>the</strong> energy will be lost by <strong>the</strong>rmal emissions to <strong>the</strong> atmosphere, however, it<br />
would save on compression from DG pressure (
Operations Research<br />
The generic model developed in this research is based on two methodologies originating from <strong>the</strong> field<br />
<strong>of</strong> operations research (OR). In bio-energy system designing, optimization, planning and logistics, op-<br />
erations research techniques combined with system analysis on meso-level could significantly<br />
streng<strong>the</strong>n <strong>the</strong> developments <strong>of</strong> <strong>green</strong> <strong>gas</strong> production and utilization. OR expertise could contribute to<br />
improvement in GGSC system designing and logistics planning.<br />
59
REFERENCES<br />
Abatzoglou, N. & Boivin, S. (2008). A review <strong>of</strong> bio<strong>gas</strong> purification processes. Bi<strong>of</strong>uels, Bioprod.<br />
Bioref., 3, 42-71.<br />
Amigun, B. & Blottnitz, von H. (2010). Capacity-cost and location-cost analyses for bio<strong>gas</strong> plants in<br />
Africa. Resource, Conservation and Recycling, doi: 10.1016/j.resconrec.2010.07.004.<br />
Appels, L., Baeyens, J., Degrève, J., Dewil, R. (2008). Principles and potential <strong>of</strong> anaerobic digestion<br />
<strong>of</strong> waste-activated sludge. Progress in Energy and Combustion Science, 34, 755-781.<br />
Bekkering, J., Broekhuis, A.A. & Gemert, van W.J.T. (2010). Optimisation <strong>of</strong> a <strong>green</strong> <strong>gas</strong> <strong>supply</strong><br />
<strong>chain</strong> – A review. Bioresource Technology, 101, 450-456.<br />
Berglund, M. & Borjesson, P. (2006). Assessment <strong>of</strong> energy performance in <strong>the</strong> lifecycle <strong>of</strong> bio<strong>gas</strong><br />
production. Biomass & Bioenergy, 30, 245-266.<br />
Bermejo, G. & Ellmer, F. (2010). Use <strong>of</strong> dry and wet digestates from bio<strong>gas</strong> plants as fertilizer in <strong>the</strong><br />
agriculture. University <strong>of</strong> Berlin, Faculty <strong>of</strong> Agriculture and Horticulture. Available at:<br />
www.mace-events.org/<strong>green</strong>week2010/6364-MACE/version/default/part/AttachmentData/data/Bermejo_feb.pdf (last<br />
viewed on 23.07.2010)<br />
Borjesson, P.I.I. (1996). Energy analysis <strong>of</strong> biomass production and transportation. Biomass and Bio-<br />
energy, vol. 11, 4, 305-318.<br />
Braaksma, A. (2010). G-<strong>gas</strong>: From Groningen <strong>gas</strong> to Green <strong>gas</strong>? An assessment <strong>of</strong> <strong>the</strong> Dutch <strong>green</strong><br />
<strong>gas</strong> potential and its delivery to <strong>the</strong> natural <strong>gas</strong> system, based on Groningen <strong>gas</strong> quality. Universi-<br />
ty <strong>of</strong> Groningen, EES 2010-96 T, IVEM training <strong>the</strong>sis.<br />
Bruinsma, B. (2007). Groen <strong>gas</strong> op het aard<strong>gas</strong>net. Naar een energieneutrale zuivelketen. Courage.<br />
Buchanan, A.H. & Honey, B.G. (1994). Energy and carbon dioxide implications <strong>of</strong> building construc-<br />
tion. Energy & Buildings, 20, 205-217.<br />
Buchholz, T., Rametsteiner, E., Volk, T.A. & Luzadis, V.A. (2009). Multi Criteria Analysis for bio-<br />
energy systems assessment. Energy Policy, 37, 484-495.<br />
Campos, R. & Ricardo, M. (2008). A fast algorithm for computing minimum routing cost spanning<br />
trees. Computer Networks, 52, 3229-3247.<br />
61
Caputo, A.C., Palumbo, M., Pelagagge, P.M. & Scacchia, F. (2005). Economics <strong>of</strong> biomass energy<br />
62<br />
utilization in combustion and <strong>gas</strong>ification plants: effects <strong>of</strong> logistic variables. Biomass and Bio-<br />
energy, 28, 35-51.<br />
Carlos, R.M. & Kang, D.B. (2009). A life-cycle based success framework for grid connected biomass<br />
energy projects. Renewable Energy, 34, 1195-1203.<br />
CBS (2009). Dutch Central Bureau for Statistics. Statline database. Last viewed on 16.10.2009.<br />
Colsen (2009). Adviesbureau Colsen b.v. Haalbaarheidsstudie Groen Gas Rilland. SenterNovem pub-<br />
lication. Available at:<br />
http://www.senternovem.nl/mmfiles/haalbaarheidsstudie%20Groen%20Gas%20Rilland_tcm24-298509.pdf (last<br />
viewed on 31.08.2010)<br />
Damen, K. (2007). Reforming fossil fuel use. The merits, costs and risks <strong>of</strong> carbon dioxide capture<br />
and storage. University <strong>of</strong> Utrecht, PhD <strong>the</strong>sis. ISBN 978-90-8672-020-0.<br />
DENA, Deutsche Energie-Agentur GmbH (2009). The German Market for Biomethane. Technologies<br />
and Costs <strong>of</strong> Conditioning Bio<strong>gas</strong> and Feed-in into <strong>the</strong> Natural Gas Network.<br />
Diekema, W.H., de Mol, R.M., Annevelink, E. & Elbersen, H.W. (2005). Combining goals in <strong>the</strong> lo-<br />
gistics bio-energy <strong>chain</strong>s. Wageningen University – Agrotechnology and Food Innovations.<br />
Available at: http://www.biomassandbioenergy.nl/ParisConf/Paper%20W794.pdf (last viewed on<br />
14.07.2010).<br />
Dirkse, E.H.M. (2007). Bio<strong>gas</strong> upgrading using <strong>the</strong> DMT TS-PWS technology. Dirkse MilieuTech-<br />
niek, Joure. Available at: www.dirkse-milieutechniek.com/dmt/do/download/_/true/203088 (last viewed on<br />
23.07.2010).<br />
Dreyfus, S.E. (1968). An appraisal <strong>of</strong> some shortest-path algorithms. Operations Research, vol. 17, 3,<br />
395-412.<br />
Electrigaz Technologies Inc (2008). Bio<strong>gas</strong> upgrading and grid injection in <strong>the</strong> Fraser Valley, British<br />
Columbia – Feasibility Study.<br />
Enexis (2009). Kwaliteits- en Capaciteitsdocument Gas 2010-2016. Available at:<br />
http://www.enexis.nl/site/Images/KCD%20Gas_DEF.pdf (last viewed on 29.07.2010).
Festa, P. (2006). Shortest Path Algorithms (p. 185-210). In: Resende, M.G.C. & Pardalos, M.P.<br />
(2006). Handbook <strong>of</strong> optimization in telecommunications. Springer-Science, ISBN-13: 978-<br />
0387-30662-9.<br />
FNR (2009). Handreichung Bio<strong>gas</strong>gewinnung und –nutzung. Institut fur Energietechnik und Umwelt<br />
gGmbH. Fachagentur Nachwachsende Rohst<strong>of</strong>fe e.V. ISBN: 3-00-014333-5<br />
Gebrezgabher, A.S., Meuwissen, M.P.M., Prins, B.A.M. & Oude Lansink, A.G.J.M. (2009). Economic<br />
analysis <strong>of</strong> anaerobic digestion – A case <strong>of</strong> Green power bio<strong>gas</strong> plant in The Ne<strong>the</strong>rlands. NJAS<br />
– Wageningen Journal <strong>of</strong> Life Science. Doi: 10.1016/j.njas.2009.07.006.<br />
Gebrezgabher, A.S., Meuwissen, M.P.M. & Oude Lansink, A.G.J.M. (2010). Costs <strong>of</strong> producing bio-<br />
<strong>gas</strong> at dairy farms in <strong>the</strong> Ne<strong>the</strong>rlands. International Journal <strong>of</strong> Food System Dynamics, 1, 26-35.<br />
Gerin, P.A., Vliegen, F., Jossart, J.-M. (2008). Energy and CO2 balance <strong>of</strong> maize and grass as energy<br />
crops for anaerobic digestion. Bioresource Technology, 99, 2620–2627.<br />
Gersen, S., Anikin, N.B., Mokhov, A.V. & Levinksy, H.B. (2008). Ignition properties <strong>of</strong> meth-<br />
ane/hydrogen mixtures in a rapid compression machine. International Journal <strong>of</strong> Hydrogen En-<br />
ergy, 33, 1957-1964.<br />
Ghafoori, E. & Flynn, P.C. (2007). Optimizing <strong>the</strong> Logistics <strong>of</strong> AD <strong>of</strong> manure. Applied Biochemistry<br />
and Biotechnology, vol. 136-140, 625-637.<br />
Ghafoori, E., Flynn, P.C. & Feddes, J.J. (2007). Pipeline vs. truck transport <strong>of</strong> beef cattle manure. Bi-<br />
omass and Bioenergy, 31, 168-175.<br />
GTS, Gas Transport Services (2009). Beschrijving Gaskwaliteitsysteem. Kenmerk LNM 09.0297.<br />
Available at: http://www.<strong>gas</strong>transportservices.nl/uploads/bestanden/cad9d7d3-2bdd-4589-9641-6254718a468b (last<br />
viewed on 31.08.2010).<br />
Hagen, M., Polman, E., Myken, A., Jensen, J., Jonsson, O. & Dahl, A. (2001). Adding <strong>gas</strong> from bio-<br />
mass to <strong>the</strong> <strong>gas</strong> grid. Report SCG 118. Available at: http://www.dgc.eu/pdf/altener.pdf (last viewed on<br />
16.08.2010).<br />
Hayes, T.D., Isaacson, H.R., Pfeffer, J.T. & Liu, Y.M. (1990). In-situ methane enrichment in anaero-<br />
bic digestion. Biotechnology & Bioengeneering, 35, 73-86.<br />
Hiremath, R.B., Shikha, S. & Ravindranath, N.H. (2007). Decentralized energy planning; modeling<br />
and application – A Review. Renewable & Sustainable Energy Reviews, 11, 729-752.<br />
63
Holstein, J. (2010) Discussion about <strong>green</strong> <strong>gas</strong>, <strong>gas</strong> grids and injection. KEMA Gas Consulting & Ser-<br />
64<br />
vices. Personal conversation, Juni 14th 2010, Groningen (NL)<br />
Hornbachner, D., Hutter, G. & Moor, D. (2005). Bio<strong>gas</strong>-Netzeinspeisung. Rechtliche, wirtschaftliche<br />
und technische Voraussetzungen in Osterreich. HEI Hornbachner Energie Innovation. Available<br />
at: http://www.energiesystemederzukunft.at/nw_pdf/0519_bio<strong>gas</strong>netzeinspeisung.pdf (last viewed on<br />
23.07.2010)<br />
de Hullu, J., Maassen, J.I.W., van Meel, P.A., Shazad, S., Vaessen, J.M.P. (2008). Comparing differ-<br />
ent upgrading techniques. Eindhoven University <strong>of</strong> Technology in cooperation with Dirkse Mi-<br />
lieutechniek. Report available: http://students.chem.tue.nl/ifp24/Bio<strong>gas</strong>Public.pdf (last viewed on<br />
22.07.2010)<br />
Janssen, P.P.C.J. & van den Bogaard, R. (2009). Haalbaarheidsstudie naar mogelijkheden Groen Gas<br />
op het Nieuw Gemengd Bedrijf Horst aan de Maas. SenterNovem publication, ref.nr.<br />
DENB086710. Available at:<br />
http://www.senternovem.nl/mmfiles/Haalbaarheidsstudie%20Groen%20Gas%20NGB%20Horst%20aan%20de%20Ma<br />
as_tcm24-297625.pdf (last viewed on 23.07.2010)<br />
Janssen, M., Verbruggen, V., Hegaret, C., Keyrrooz, S., Madhani, S., Swinkels, M. & Trampe, J.<br />
(2010). Liquefaction <strong>of</strong> carbon dioxide from bio<strong>gas</strong> upgrading. Eindhoven University <strong>of</strong> Tech-<br />
nology.<br />
Jensen, J.K. & Jensen, A.B. (2000). Bio<strong>gas</strong> and natural <strong>gas</strong> fuel mixture for <strong>the</strong> future. 1ts World Con-<br />
ference and Exhibition on Biomass for Energy and Industry, Sevilla.<br />
Jewell, W.J., Cummings, R.J. & Richards, B.K. (1993). Methane fermentation <strong>of</strong> energy crops: Maxi-<br />
mum conversion kinetics and in-situ bio<strong>gas</strong> purification. Biomass & Bioenergy, vol. 5, no. 3-4,<br />
261-278.<br />
Jingura, R.M. & Matengaifa, R. (2009). <strong>Optimization</strong> <strong>of</strong> bio<strong>gas</strong> production by anaerobic digestion for<br />
sustainable energy development in Zimbabwe. Renewable & Sustainable Energy Reviews, 13,<br />
1116-1120.<br />
Kapdi, S.S., Vijay, V.K., Rajesh, S.K. & Prasad, R. (2005). Bio<strong>gas</strong> scrubbing, compression and stor-<br />
age: perspective and prospectus in Indian context. Renewable Energy, 30, 1095-1202.<br />
KEMA. Information from KEMA Gas Consulting & Services in Groningen and KEMA Arnhem.
Klinski, S., Diesel, K., Urban, W. & Burmeister, F. (2006). Einspeisung von Bio<strong>gas</strong> in das Erd<strong>gas</strong>netz.<br />
Institut fur Energietechnik und Umwelt gGmbH. Fachagentur Nachwachsende Rohst<strong>of</strong>fe e.V.<br />
Koornneef, J., van Keulen, T., Faaij, A., Turkenburg, W. (2008). Life cycle assessment on a pulver-<br />
ized coal-fired power plant with post combustion capture, transport and storage <strong>of</strong> CO2. Interna-<br />
tional Journal <strong>of</strong> Greenhouse Gas Control, 2, 448-467.<br />
Lems, R. (2010). Discussion about Bio<strong>gas</strong> Upgrading Techniques. Dirkse Environmental Technology.<br />
Personal conversation, March 5th 2010, Joure (NL).<br />
Levinsky, H.B. (2009). Are sustainable <strong>gas</strong>es and natural <strong>gas</strong>es interchangeable? Energy Delta Con-<br />
vention 2009, 18-11-2009. Presentation available:<br />
http://www.rug.nl/energyconvention/edc/archive/edc2009/presentations/levinsky2.pdf (last viewed on<br />
09.07.2010).<br />
Lensink, S.M., Wassenaar, J.A., Mozaffarian, M., Pfeiffer, A.E., Luxembourg, S.L. & Cleijne, J.W.<br />
(2010). Conceptadvies basisbedragen 2011 voor elektriciteit en groen <strong>gas</strong> in het kader van de<br />
SDE-regeling. ECN-E—10-053. Available on: http://www.ecn.nl/docs/library/report/2010/e10053.pdf (last<br />
viewed on 19.07.2010).<br />
Lensink, S.M., Cleijne, J.W., Mozaffarian, M., Pfeiffer, A.E., Luxembourg, S.L. & Stienstra, G.J.<br />
(2009). Eindadvies basisbedragen 2010 voor elektriciteit en groen <strong>gas</strong> in het kader van de SDE-<br />
regeling. ECN-E—09-058. Available on:<br />
http://www.senternovem.nl/mmfiles/Eindadvies%20basisbedragen%20SDE%202010_tcm24-329874.pdf (last<br />
viewed on 19.07.2010).<br />
Lindberg, A. & Rasmuson, Å.C. (2006a). Selective desorption <strong>of</strong> carbon dioxide from sewage sludge<br />
for in-situ methane enrichment – Part I: Pilot plant experiments. Biotechnology & Bioengeneer-<br />
ing, 95, 5, 794-803.<br />
Lindberg, A. & Rasmuson, Å.C. (2006b). Selective desorption <strong>of</strong> carbon dioxide from sewage sludge<br />
for in-situ methane enrichment – Part II: Modelling and evaluation <strong>of</strong> experiments. Biotechnolo-<br />
gy & Bioengeneering, 97, 1039-1052.<br />
Lindeboom, R.E.F., Fermoso, F., Hamelers, H.V.M., van Lier, J.B. & Zagt, C.E. (2009). Schone ho-<br />
gedruk methaan voor decentrale energievoorziening. Wageningen University & Bareau Duurza-<br />
me Technologie. Available at:<br />
http://www.bareau.nl/images/stories/projecten/neo_eindrapportage_ahpd_april_2009.pdf (last viewed on<br />
13.08.2010)<br />
65
Luesink, H. (2010). Transportation <strong>of</strong> manure in <strong>the</strong> Ne<strong>the</strong>rlands. Wageningen University. Mail corre-<br />
66<br />
spondence on 17.06.2010.<br />
Mann, G., Schlegel, M., Schumann, R. & Sakalauskas, A. (2009). Bio<strong>gas</strong>-conditioning with microal-<br />
gae. Agronomy Research 7, 1, 33-38.<br />
Moll, H.C. (1993), p. 40-41. Energy counts and materials matter in models for sustainable develop-<br />
ment: Dynamic lifecycle modelling as a tool for design and evaluation <strong>of</strong> longterm environmental<br />
strategies. PhD Thesis, University <strong>of</strong> Groningen.<br />
NMa (2006). Nederlandse Mededingings Authoriteit, Dienst Toezicht Energie (DTe). Aansluit- en<br />
transportvoorwaarden <strong>gas</strong> – RNB.<br />
Noyola, A., Morgan-Sa<strong>gas</strong>tume, J.M. & Lopez-Hernandez, J.E. (2006). Treatment <strong>of</strong> bio<strong>gas</strong> produced<br />
in anaerobic reactors for domestic wastewater: odor control and energy/resource recovery. Re-<br />
views in Environmental Science and Bio/Technology, 5, 93-114.<br />
Olajire, A.A. (2010). CO2 capture and separation technologies for end <strong>of</strong> pipe applications – A Re-<br />
view. Energy, 35, 2610-2628.<br />
Ommen, van R. (2010). Discussion about available data on <strong>the</strong> economics <strong>of</strong> <strong>the</strong> <strong>green</strong> <strong>gas</strong> <strong>supply</strong><br />
<strong>chain</strong>. KEMA Arnhem. Personal conversation, July 28th 2010, Arnhem (NL)<br />
Ooka, R. & Komamura, K. (2009). Optimal design method for building energy systems using genetic<br />
algorithms. Building and Environment, 44, 1538-1544.<br />
Ort, J.E., (1976). High quality methane <strong>gas</strong> through modified anaerobic digestion. United States Patent<br />
39,81,800. Digital version available at: http://www.freepatentsonline.com/3981800.html (last<br />
viewed on 05.02.2010)<br />
Petersson, A. & Wellinger, A. (2009). IEA Bioenergy, task 37. Energy from bio<strong>gas</strong> and landfill<strong>gas</strong>,<br />
Bio<strong>gas</strong> upgrading technologies – developments and innovations.<br />
Persson, M. (2003). Evaluation <strong>of</strong> upgrading techniques for bio<strong>gas</strong>. Lund University.<br />
PNG, Platform Nieuw Gas (2010). Op weg naar een volwassen Groen Gas markt. SenterNovem publi-<br />
cation. Available at: http://www.senternovem.nl/mmfiles/58509080%20Groen%20Gas%20Excursie_O3_tcm24-<br />
325201.pdf (last viewed on 09.08.2010).
Poeschl, M., Ward, S., Owende, P. (2010). Prospects for expanded utilization <strong>of</strong> bio<strong>gas</strong> in Germany.<br />
Renewable & Sustainable Energy Reviews, 14, 1782-1797.<br />
Polman, E.A., Eekelen, van R.N., Huijzer, E., Jager, S., Goorix, L., Theelen, M., Florisson, O.,<br />
Tiekstra, G.C., Wingerden, van J., Ommen, van R. & Wingerder, van T. (2007). State-<strong>of</strong>-<strong>the</strong>-Art<br />
waterst<strong>of</strong>- en bio<strong>gas</strong>invoeding. Report.<br />
Post, H.N. (2004). Transport, Routing- en Schedulingproblemen. Delft University <strong>of</strong> Technology.<br />
Available at: http://www.isa.ewi.tudelft.nl/~roos/courses/wi487tu/main.pdf (last viewed on 05.07.2010)<br />
Pöschl, M., Ward, S. & Owende, P. (2010). Evaluation <strong>of</strong> energy efficiency <strong>of</strong> various bio<strong>gas</strong> produc-<br />
tion and utilization pathways. Applied Energy (2010), doi:10.1016/j.apenergy.2010.05.011, Arti-<br />
cle in press.<br />
Rasi, S. Veijanen, A., Rintala, J. (2007). Trace compounds <strong>of</strong> bio<strong>gas</strong> from different bio<strong>gas</strong> production<br />
plants, Energy, 32, 1375-1380.<br />
Rasi, S. (2009). Bio<strong>gas</strong> composition and upgrading to biomethane. PhD Thesis, Studies in Biological<br />
& Environmental Science, University <strong>of</strong> Jyväskylä, Finland. ISBN: 978-951-39-3607-5.<br />
Rentizelas, A. & Tatsiopoulos, I. (2010). Locating a bioenergy facility using a hybrid optimization<br />
method. Int. J. Production Economics, 123, 196-209.<br />
Reppich, M., Datzmann, S., Li, X., Rosenbauer, S., Schlecht, C. & Tschepur, S. (2009). Vergleich ver-<br />
schiedener Aufbereitungsverfahren von Bio<strong>gas</strong> zur Einspeisung in das Erd<strong>gas</strong>netz. Chemie In-<br />
genieur Technik, 81, No 3, 211-223.<br />
Richards, B.K., Herndon, F.G., Jewell, W.J., Cummings, R.J. & White, T.E. (1994). In-situ methane<br />
enrichment in methanogenic energy crop digesters. Biomass & Bioenergy, vol. 6, 4, 275-282.<br />
Sakai, K., Taniguchi, M., Miura, S., Ohara, H., Matsumoto, T. & Shirai, Y. (2004). Making plastics<br />
from garbage. A novel process for Poly-L-Lactate production from municipal food waste. Journal<br />
<strong>of</strong> Industrial Ecology, vol. 7, no. 3-4, 63-74.<br />
Schenk, N.J., Moll, H.C. & Schoot Uiterkamp, A.J.M. (2007). Meso-level analysis, <strong>the</strong> missing link in<br />
energy strategies. Energy Policy, 35, 1505-1516.<br />
Schoots, K., Rivera-Tinoco, R., Verbond, G.P.J., van der Zwaan, B.C.C. (2010). The Costs <strong>of</strong> Pipelin-<br />
ing Climate Change Mitigation: an overview <strong>of</strong> <strong>the</strong> economies <strong>of</strong> CH4, CO2, and H2 transporta-<br />
67
68<br />
tion. Social Science Research Network. Available at: http://ssrn.com/abstract=1548328 (last viewed on<br />
17.06.2010).<br />
Teunter, R.H. (2010). Pr<strong>of</strong>essor <strong>of</strong> Operations Research. Course information: Introduction to Logistics<br />
Systems Planning and Control. Lecture: Facility Location (03.06.2010). Faculty <strong>of</strong> Economics<br />
and Businesses, University <strong>of</strong> Groningen.<br />
Tilburg, van X., Londo, H.M., Mozaffarian, M. & Pfeiffer, E.A. (2008a). Technisch-economische pa-<br />
rameters van groen<strong>gas</strong>productie 2008-2009. Eindadvies basisbedragen voor de SDE regeling.<br />
ECN-E—08-004.<br />
Tilburg, van X., Lensink, S.M., Londo, H.M., Cleijne, J.W., Pfeiffer, A.E., Mozaffarian, M. & Wak-<br />
ker, A. (2008b). Technisch-economische parameters van duurzame energieopties in 2009-2010.<br />
Eindadvies basisbedragen voor de SDE-regeling. ECN-E—08-066.<br />
Urban, W., Lohmann, H. & Girod, K. (2009). Technologien und Kosten der Bio<strong>gas</strong>aufbereitung und<br />
Einspeisung in das Erd<strong>gas</strong>netz. Ergebnisse der Markterhebung 2007-2008. Fraunh<strong>of</strong>er Institut fur<br />
Umwelt-, Sicherheits-, und Energietechnik UMSICHT.<br />
Valezquez-Marti, B. & Fernandez-Gonzalez, E. (2010). Ma<strong>the</strong>matical algorithms to locate factories to<br />
transform biomass in bioenergy focused on logistic network construction. Renewable Energy.<br />
Dio: 10.1016/jrenene.2010.02.011.<br />
Veth, de J.R.M.M. & Uenk, J.H. (2008). Haalbaarheid Groen Gas - Casus Sint Oedenrode. SenterNo-<br />
vem Report.<br />
Vlap, H. (2010). Discussion about Bio<strong>gas</strong> Upgrading Techniques. KEMA Gas Consulting & Services.<br />
Personal conversation, April 21th 2010, Groningen (NL)<br />
VROM (Ministry <strong>of</strong> Housing, Spatial Planning and Environment), (2007). Nieuwe energie voor het<br />
klimaat, Werkprogramma Schoon en Zuinig. Available at:<br />
http://www.vrom.nl/pagina.html?id=2706&sp=2&dn=7421 (lasted viewed on 30.07.2010)<br />
Walla, C. and Schneeberger, W. (2008). The optimal size for bio<strong>gas</strong> plants. Biomass and Bioenergy,<br />
32, 551-557.<br />
Welink, J.H., Dumont, M. & Kwant, K. (2007). Groen Gas – Gas van aard<strong>gas</strong>kwaliteit uit biomassa.<br />
Update <strong>of</strong> a study from 2004. Report by SenterNovem.
Wellinger, A. & Lindberg, A. (1999), IEA Bioenergy, task 24. Energy from biological conversion <strong>of</strong><br />
organic waste, Bio<strong>gas</strong> upgrading and utilization.<br />
Worrell, E., Heijningen, van R.J.J., Castro, de J.F.M., Hazewinkel, H.J.O., Beer, de J.G., Faaij, A.P.C.<br />
& Vringer, K. (1993). New Gross Energy-Requirement figures for materials production. Energy,<br />
vol. 19, 6, 627-640.<br />
Zwart. (2009). Gas cleaning, downstream biomass <strong>gas</strong>ification. Status report 2009. Energy Research<br />
Centre <strong>of</strong> <strong>the</strong> Ne<strong>the</strong>rlands (ECN) / Senternovem. ECN-E--08-078<br />
69
Appendix I – Gas composition<br />
This appendix presents <strong>the</strong> typical <strong>gas</strong> quality <strong>of</strong> raw bio<strong>gas</strong> and <strong>the</strong> quality to which upgraded bio<strong>gas</strong><br />
should comply in order to be injected in <strong>the</strong> Dutch natural <strong>gas</strong> grid. The <strong>gas</strong> grids considered here are<br />
RG and Distribution Grid, which distribute Groningen-<strong>gas</strong> (G-<strong>gas</strong>) quality. The composition <strong>of</strong> Gron-<br />
ingen-<strong>gas</strong> is given NMa (2006). Since bio<strong>gas</strong> has varying compositions, three sources <strong>of</strong> bio<strong>gas</strong> are<br />
considered here; anaerobic digestion (AD), landfill <strong>gas</strong> and bio<strong>gas</strong> from sewage water treatment plants<br />
(SWTP). The composition <strong>of</strong> bio<strong>gas</strong> produced by anaerobic digestion is derived from Rasi (2009). The<br />
composition for landfill <strong>gas</strong> is derived from Rasi et al. (2007). The list is completed with values given<br />
in <strong>the</strong> article <strong>of</strong> Appels et al. (2008).<br />
Component Unit<br />
I<br />
BIOGAS NATURAL GAS<br />
AD Landfill SWTP G-<strong>gas</strong><br />
Caloric value MJ/Nm 3 21.5 16 20 31.67<br />
Wobbe index MJ/Nm 3 20 20 20 43.46-44.41<br />
Methane nr. >130 >135 >135 (>80)<br />
Methane % 60 (50-75) 54 55<br />
Carbon dioxide % 40<br />
(25-50)<br />
33<br />
(15-40)<br />
37<br />
(34-38)<br />
Sulphur (total) mg/Nm 3 0.9<br />
H2S mg/Nm 3
Appendix II – Gas compression<br />
The equation given in section 3.2.3 to calculate <strong>the</strong> energy demand for compression (for ei<strong>the</strong>r trans-<br />
portation <strong>of</strong> <strong>gas</strong> or injection <strong>of</strong> <strong>gas</strong> into a grid), is based on following ma<strong>the</strong>matical formulations, de-<br />
veloped by Damen (2007) and cited in Koornneef et al. (2008). In <strong>the</strong> second equation <strong>the</strong> calculation<br />
from electricity requirement to primary energy requirement is integrated.<br />
ZRT ⎡⎛<br />
⎞<br />
1 Nγ<br />
p2<br />
W = * * ⎢<br />
⎜<br />
⎟<br />
M γ −1<br />
⎢<br />
⎣⎝<br />
p1<br />
⎠<br />
E<br />
primary<br />
γ −1/<br />
Nγ<br />
⎛ W ⎞ ⎛ 1 ⎞<br />
⎜<br />
⎟ * ρ *<br />
⎜<br />
⎟<br />
⎝η<br />
isη<br />
m ⎠ ⎝η<br />
el<br />
=<br />
⎠<br />
LHV<br />
⎤<br />
− 1⎥<br />
⎥<br />
⎦<br />
Where: W = specific work (kJ/kg <strong>gas</strong>); Z = compressibility factor (-); R = <strong>gas</strong> constant (J/mole.K); T1 = suction<br />
temperature (K); M = molar mass (g/mole); N = number <strong>of</strong> compressor stages; γ = specific heat ratio (-); p =<br />
pressure (MPa) E = specific electricity requirement (kWh); ρ = density (kg/Nm 3 ); η = efficiency (-); LHV =<br />
lower heating value (MJ/Nm 3 ).<br />
Following tables presents <strong>the</strong> constants and variables used in <strong>the</strong> calculations for <strong>the</strong> energy require-<br />
ments for compression <strong>of</strong> <strong>green</strong> <strong>gas</strong> and bio<strong>gas</strong>. In <strong>the</strong> calculation with regard to <strong>green</strong> <strong>gas</strong>, <strong>the</strong> <strong>gas</strong><br />
characteristics <strong>of</strong> methane are considered. The variables are depending on <strong>the</strong> system design that is<br />
chosen in <strong>the</strong> <strong>green</strong> <strong>gas</strong> <strong>supply</strong> <strong>chain</strong>.<br />
Constants used in calculations for energy requirements <strong>of</strong> compression.<br />
Constants Value Unit<br />
Z 0.9942 -<br />
R 8.3145 J/mole.K<br />
T1 288.15 K<br />
M (methane) 16.043 g/mole<br />
M (bio<strong>gas</strong>) 32.9 g/mole<br />
N 2 Stages<br />
γ 1.293759 -<br />
η (isentropic ; mechanical ; electrical) (80 ; 99 ; 40) %<br />
ρ (methane) 0.717 kg/Nm 3<br />
ρ (bio<strong>gas</strong>) 1.222 kg/Nm 3<br />
LHV (methane) 35.9 MJ/Nm 3<br />
LHV (bio<strong>gas</strong>) 21.5 MJ/Nm 3<br />
II
Variables used in calculations for energy requirements <strong>of</strong> compression.<br />
Variable Value Unit<br />
P1 (PWS) 1.0 MPa<br />
P1 (PSA) 1.0 MPa<br />
P1 (Chemical scrubbing) 0.101325 MPa<br />
P1 (Membrane separation) 0.101325 MPa<br />
P1 (Cryogenic separation) 4.0 MPa<br />
P2 (pipeline transport bio<strong>gas</strong>) 0.5 MPa<br />
P2 (Distribution Grid) 0.8 MPa<br />
P2 (Regional Grid) 4.0 MPa<br />
III
Appendix III – Upgrading techniques<br />
This appendix presents a graph in which <strong>the</strong> upgrading techniques are included. Note that <strong>the</strong> informa-<br />
tion about <strong>the</strong> economics was derived, directly or indirectly, from quotations from suppliers <strong>of</strong> upgrad-<br />
ing techniques. Since bio<strong>gas</strong> upgrading has not been done very extensively yet it is likely to assume<br />
that commercial interests are translated through <strong>the</strong>se quotations, meaning that given costs cannot be<br />
interpreted as reliable data. At this moment however, given information is <strong>the</strong> best that is available.<br />
During extensive literature study it can be stated that reliable information on <strong>the</strong> economics <strong>of</strong> upgrad-<br />
ing techniques, especially about cryogenic separation and membrane separation, is difficult to find.<br />
ct€ / MJ<br />
1.20<br />
1.00<br />
0.80<br />
0.60<br />
0.40<br />
0.20<br />
0.00<br />
y = 2.92x -0.31<br />
y = 31.58x -0.62<br />
Economics <strong>of</strong> Upgrading techniques<br />
Total expenditure (ct€/MJ)<br />
y = 18.58x -0.65<br />
y = 2.41x -0.28<br />
y = 6.78x -0.46<br />
0 500 1000 1500 2000 2500<br />
Nm 3 /h bio<strong>gas</strong><br />
P WS<br />
P SA<br />
Chemical scrubber<br />
Membrane<br />
Cryogenic<br />
IV
Appendix IV – Energy requirements digestion<br />
The energy requirements for anaerobic digestion are presented in this graph. The energy requirements<br />
were calculated from <strong>the</strong> costs for heating and electricity given by Urban et al. (2009) and DENA<br />
(2009). The difference can be explained by <strong>the</strong> difference in heating demand for digestion <strong>of</strong> varying<br />
substrate ratios (manure-to-maize), which is directly related to substrate’s water content. Manure has a<br />
water content <strong>of</strong> >90% where maize silage consists for approximately 65% <strong>of</strong> water.<br />
V<br />
MJpe / MJ<br />
0.30<br />
0.25<br />
0.20<br />
0.15<br />
0.10<br />
0.05<br />
-<br />
Energy Requirements Digestion<br />
MJ pe / MJ bio<strong>gas</strong><br />
y = 0.30x -0.12<br />
0 500 1000 1500 2000<br />
Nm 3 /h bio<strong>gas</strong><br />
Manure-to-Maize (90:10)<br />
Manure-to-Maize (50:50)<br />
Manure-to-Maize (10:90)
Appendix V – Centre <strong>of</strong> Gravity method<br />
This appendix presents <strong>the</strong> specific area that is used to determine transport distances in this research.<br />
The table with <strong>the</strong> coordinates shows <strong>the</strong> specific villages and fictitious locations <strong>of</strong> farms/digesters.<br />
Using <strong>the</strong> Centre <strong>of</strong> Gravity method <strong>the</strong> distances as presented in <strong>the</strong> figure are determined.<br />
Input RD-system<br />
Anaerobic Digestion RD Coordinates Distance to centre<br />
Village nr X Y km<br />
Oldehove 1 223547 590866 6.056<br />
Feerwerd 2 225879 594095 7.654<br />
Sauwerd 3 230783 590655 4.825<br />
Den Horn 4 225653 583012 4.385<br />
Garnwerd 5 229440 591639 5.121<br />
Niehoeve 6 220866 589412 7.596<br />
Noordhorn 7 222890 587110 5.097<br />
Adorp 8 231494 587696 3.650<br />
Gas Grid Gas Grid (Regional Grid) 231282 581577 6.126<br />
X Y ∑ meters<br />
Centre point Centre Location 227973 586733 50.510<br />
596000<br />
594000<br />
592000<br />
590000<br />
588000<br />
586000<br />
584000<br />
582000<br />
580000<br />
6<br />
7<br />
1<br />
4<br />
2<br />
220000 222000 224000 226000 228000 230000 232000 234000<br />
5<br />
3<br />
8<br />
Anaerobic Digestion<br />
Centre Location<br />
Gas Grid<br />
VI