systems research - the IDRC Digital Library - International ...
systems research - the IDRC Digital Library - International ... systems research - the IDRC Digital Library - International ...
Table 9. Extent of adoption and comparison of yield differences at two rainfed sites, Bangladesh (1989-90). Extent of Kamalganj Sitakund adop tionl comparison Aus Aman Total Aus Aman Total Between low and medium Between medium and high Between low and high Between low and medium Between medium and high Between low and high **significant at < 1 % level. "significant at 5 % level. ns=not significant.
Table 10. Resource use and productivity according to extent of adoption in two rainfed sites, Bangladesh, aus + aman (1989). Resource use/ Kamalganj Sitakund productivity measure Low Medium High Low Medium High Labor (h) 1,330 1,417 2,072 1,285 1,980 2,207 Family 1,048 1,139 1,748 1,041 1,642 1,625 Hired 282 278 3 24 244 338 582 Animal (h) 538 525 623 193 306 292 Family 524 504 606 136 3 65 189 Hired 14 2 1 17 5 7 4 1 103 Fertilizer (kg) N 29 54 76 38 72 94 P2°5 14 23 3 1 4 6 9 Yield (kg) 4,410 4,882 5,537 1,814 2,627 3,254 Gross return (taka) 25,018 27,692 31,206 13,269 18,209 20,548 Total cost (taka) Full cost 10,671 12,000 15,572 10,477 16,201 18,114 Cash cost 2,287 3,281 3,196 2,688 3,552 6,152 Production cost (takalkg) Full cost 2.41 2.45 2.81 5.77 6.16 5.56 Cash cost 0.5 1 0.67 0.57 1.48 1.35 0.89 Net return (taka) Full cost 14,347 15,692 15,634 2,792 2,008 2,134 Cash cost 22,731 24,411 28,010 10,581 14,647 14,096 Returns to (taka) Family labor 3.74 3.75 2.79 1.70 1.67 1.5: Hired labor 11.18 12.29 10.65 5 .OO 3.24 2.2: Animal draft labor 5.44 5.98 5.18 21.79 16.35 3.2 Material inputs 19.09 9.89 11.60 11.08 6.14 4.3
- Page 1 and 2: IRRl DISCUSSION PAPER SERIES NO. 15
- Page 3 and 4: RECEIVED I RECU .- r b :'.i!~atlon
- Page 5 and 6: Welcome address S .P.R. Weerasinghe
- Page 7 and 8: Welcome Address S. P. R. Weerasingh
- Page 9 and 10: Opening Comments After 15 yr of far
- Page 11 and 12: increased as well, but only nlargin
- Page 13 and 14: esult in high incomes for farmers,
- Page 15 and 16: Investor concerns Usually investors
- Page 17 and 18: WORKSHOP OBJECTIVES This workshop i
- Page 19 and 20: Rice is the major food crop and die
- Page 21 and 22: esource use and productivity varies
- Page 23 and 24: Determination of ado,)tion factors
- Page 25 and 26: number of active family members per
- Page 27 and 28: At both sites, more than 73% of the
- Page 29 and 30: Hossain A M, Nur-E-Elahi, Nazrul I
- Page 31 and 32: Table 2. Crop varietal sequence sco
- Page 33 and 34: Table 4. Correlation illatsix used
- Page 35 and 36: - Table 6. Socioeconomic characteri
- Page 37: Table 8. Extent of adoption and ave
- Page 41 and 42: Table 12. Extent of adoption and di
- Page 43 and 44: Table 14. Summary of per hectare ca
- Page 45 and 46: IRlPACT OF FARMING SYSTEMS RESEARCH
- Page 47 and 48: new information collected during FS
- Page 49 and 50: average family owns seven heads of
- Page 51 and 52: H Horticulture. To have a more regu
- Page 53 and 54: improved varieties require higher l
- Page 55 and 56: The types of the training provided
- Page 57 and 58: extension agency in the district, t
- Page 59 and 60: m Extension and other production-su
- Page 61 and 62: Table 3. Farm characteristics of th
- Page 63 and 64: Table 6. Farm practices and product
- Page 65 and 66: Table 8. Major crops, crop varietie
- Page 67 and 68: Table 10. Production and use of mil
- Page 69 and 70: Table 13. Major problems and constr
- Page 71 and 72: Table 15. Training undergone by the
- Page 73 and 74: Table 17. Links between farmers and
- Page 75 and 76: ----l CROP SUBSYSlLM rnurt L OTT tb
- Page 77 and 78: West Java provincial le~el BACKGROU
- Page 79 and 80: OBJECTIVES The specific objectives
- Page 81 and 82: Labor requirement Labor requirement
- Page 83 and 84: system models. This indicated that
- Page 85 and 86: Unit prices for all items were obta
- Page 87 and 88: Price elasticity. The demand for al
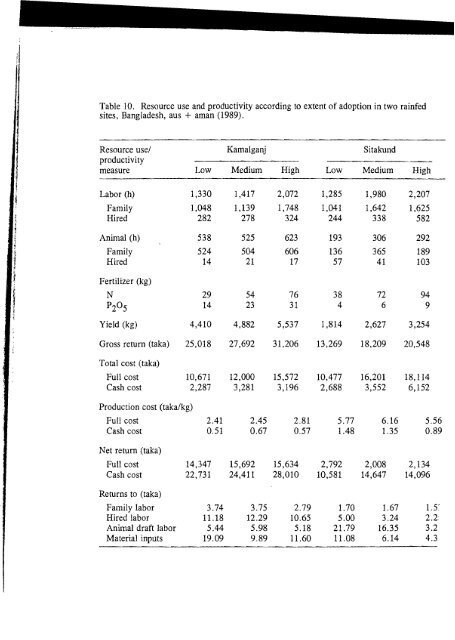
Table 10. Resource use and productivity according to extent of adoption in two rainfed<br />
sites, Bangladesh, aus + aman (1989).<br />
Resource use/ Kamalganj Sitakund<br />
productivity<br />
measure Low Medium High Low Medium High<br />
Labor (h) 1,330 1,417 2,072 1,285 1,980 2,207<br />
Family 1,048 1,139 1,748 1,041 1,642 1,625<br />
Hired 282 278 3 24 244 338 582<br />
Animal (h) 538 525 623 193 306 292<br />
Family 524 504 606 136 3 65 189<br />
Hired 14 2 1 17 5 7 4 1 103<br />
Fertilizer (kg)<br />
N 29 54 76 38 72 94<br />
P2°5 14 23 3 1 4 6 9<br />
Yield (kg) 4,410 4,882 5,537 1,814 2,627 3,254<br />
Gross return (taka) 25,018 27,692 31,206 13,269 18,209 20,548<br />
Total cost (taka)<br />
Full cost 10,671 12,000 15,572 10,477 16,201 18,114<br />
Cash cost 2,287 3,281 3,196 2,688 3,552 6,152<br />
Production cost (takalkg)<br />
Full cost 2.41 2.45 2.81 5.77 6.16 5.56<br />
Cash cost 0.5 1 0.67 0.57 1.48 1.35 0.89<br />
Net return (taka)<br />
Full cost 14,347 15,692 15,634 2,792 2,008 2,134<br />
Cash cost 22,731 24,411 28,010 10,581 14,647 14,096<br />
Returns to (taka)<br />
Family labor 3.74 3.75 2.79 1.70 1.67 1.5:<br />
Hired labor 11.18 12.29 10.65 5 .OO 3.24 2.2:<br />
Animal draft labor 5.44 5.98 5.18 21.79 16.35 3.2<br />
Material inputs 19.09 9.89 11.60 11.08 6.14 4.3


