systems research - the IDRC Digital Library - International ...
systems research - the IDRC Digital Library - International ... systems research - the IDRC Digital Library - International ...
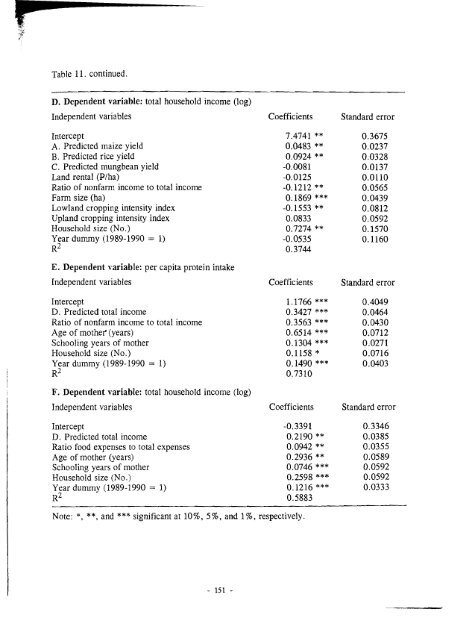
, ! Table 11, continued. D. Dependent variable: total household income (log) Independent variables Coefficients Intercept A. Predicted maize yield B. Predicted rice yield C. Predicted mungbean yield Land rental (Plha) Ratio of ilonfarm income to total income Farm size (ha) Lowland cropping intensity index Upland cropping intensity index Household size (No.) Year dummy (1989-1990 = 1) E. Dependent variable: per capita protein intake Independent variables Coefficients Intercept D. Predicted total income Ratio of nonfarm income to total income Age of mother' (years) Schooling years of mother Household size (No.) Year dummy (1989-1990 = 1) F. Dependent variable: total household income (log) Independent variables Intercept D. Predicted total income Ratio food expenses to total expenses Age of mother (years) Schooling years of mother Household size (No.) Year dummy (1989-1990 = 1) Coefficients Note: *, **, and *** significant at 10%, 5%, and l%, respectively. Standard error Standard error Standard error
INSTITUTIONALIZING THE FARILIIIVG SYSTEhlS RESEARCH APPROACH IN INDOCHINA A. hl. iIlandac1 Farming systems research (FSR) is a coordinated and integrated effort to develop tschnolop that will enable farmers to increase production. FSR addresses itself to each farm enterprise and to the interrelationships among them and between the farm and its environment. The research uses information about the various production and consumption systems, the animal production system, the cropping system, and the secondary production activities that add value to the primary product, to identify ways to increase the efficiency with which the farm uses its resources. The research is carried out by a coordinated group of scientists from various disciplines: At least si~ distinct research and implementation phases characterize the FSR methodology: site selection and description; economic and biological component studies; design and testing of the farming systems; multilocation testing; implementation of pilot production programs; and full production programs. The broad objective of this paper is to describe farming systems research in Indochina (Cambodia, Lao PDR, and Vietnam). Basic data for the Indochinese countries are given in Table 1. Cambodia has an area of 181,000 km2 comprising a large central plain, has one of the largest freshwater lakes in Asia (Lake Tonle Sap), and mountains in the northeast and southwest. The population is estimated at 7.2 million with an annual growth rate of about 37~. The average population density is 40 people/km2, with no more than 100 people/km2 in the more densely populated central plain and Tonle Sap provinces. The majority of the population is of Khmer origin. with minority ethnic groups making up less than 5%. The birth rate is high (about 6%), however, the infant mortality is also hi~h (about 2%) because of poor sanitation, scarce medical services, and malnutrition. Lao PDR is a predominantly mountainous country coverifig 236,800 km2. There are plains bordering the Mekong River near Vientiane ancl Snvannakhet where most of the lowland rice is grown. The population is about 3.7 mil!ion. Lao PDR has one of the lowest population density in Asia (16 pe~ple/km2). Average '~nternational Programs Management Office, International Rice Research Institute, P.O. Box 933, Manila, Philippines.
- Page 117 and 118: Land preparation for rice. The reac
- Page 119 and 120: price of mungbean was high, some fa
- Page 121 and 122: manufacturers. The earlier models (
- Page 123 and 124: Net farm income per household The a
- Page 125 and 126: that although adopters were better
- Page 127 and 128: W It produced a good stand of rice
- Page 129 and 130: Table l. The promising technologies
- Page 131 and 132: Table 3. Mungbean before rice areas
- Page 133 and 134: Table 5. Number of farm households
- Page 135 and 136: Table 7. Area planted to mungbean,
- Page 137 and 138: Table 9. Area planted to mungbean,
- Page 139 and 140: Table 11. Area under dry seeded ric
- Page 141 and 142: continued.. . Table 12. Socioeconom
- Page 143 and 144: continued.. . Table 12. Socioeconom
- Page 145 and 146: l~ndicative figures only. '~ature t
- Page 147 and 148: composition, increases in income ca
- Page 149 and 150: not be captured if the criteria for
- Page 151 and 152: crops (rice, maize, and mungbean) a
- Page 153 and 154: The explanatory Lwiable, nitrogen (
- Page 155 and 156: of the ratio of actual intake and r
- Page 157 and 158: Farming Systems Research and Extens
- Page 159 and 160: Table 3. Input levels and productiv
- Page 161 and 162: Table 5. Comparison of annual house
- Page 163 and 164: Table 7. Comparison of annual nonfo
- Page 165 and 166: Table 9. Comparison of percentage p
- Page 167: Table 11. Log-linear models of impa
- Page 171 and 172: agricultural production system by i
- Page 173 and 174: In the midwest plain, where there a
- Page 175 and 176: Varietal irnprovernent. This compon
- Page 177 and 178: solutions to problems under the bas
- Page 179 and 180: Table 2. Rice farming systems in Ca
- Page 181 and 182: Table 5. Component-technology studi
- Page 183 and 184: Wangwacharachul (1984) examined the
- Page 185 and 186: household basis on an income and ex
- Page 187 and 188: first crop. In 1989-90, the adopter
- Page 189 and 190: Nonfarm expenses constituted the bu
- Page 191 and 192: Herbicide is essential for DSR. How
- Page 193 and 194: o The classification of farmers on
- Page 195 and 196: Table 1. List of \,ariables idc~l~l
- Page 197 and 198: Table 3. Conlparison of cash flow o
- Page 199 and 200: Table 5. Level of input use for the
- Page 201 and 202: Table 7. Production elasticities of
- Page 203 and 204: FROXl GREEN REVOLUTION TO FARhlING
- Page 205 and 206: ainfed areas. The RIARS project app
- Page 207 and 208: stability and sustainability. 1nsti
- Page 209 and 210: o Limited feedback at all levels. A
- Page 211 and 212: Table l. Chronological sequcnce of
- Page 213 and 214: Table l. Chronological sequence of
- Page 215 and 216: Impact studies A number of studies
- Page 217 and 218: some simple statistical tests to as
,<br />
!<br />
Table 11, continued.<br />
D. Dependent variable: total household income (log)<br />
Independent variables Coefficients<br />
Intercept<br />
A. Predicted maize yield<br />
B. Predicted rice yield<br />
C. Predicted mungbean yield<br />
Land rental (Plha)<br />
Ratio of ilonfarm income to total income<br />
Farm size (ha)<br />
Lowland cropping intensity index<br />
Upland cropping intensity index<br />
Household size (No.)<br />
Year dummy (1989-1990 = 1)<br />
E. Dependent variable: per capita protein intake<br />
Independent variables Coefficients<br />
Intercept<br />
D. Predicted total income<br />
Ratio of nonfarm income to total income<br />
Age of mo<strong>the</strong>r' (years)<br />
Schooling years of mo<strong>the</strong>r<br />
Household size (No.)<br />
Year dummy (1989-1990 = 1)<br />
F. Dependent variable: total household income (log)<br />
Independent variables<br />
Intercept<br />
D. Predicted total income<br />
Ratio food expenses to total expenses<br />
Age of mo<strong>the</strong>r (years)<br />
Schooling years of mo<strong>the</strong>r<br />
Household size (No.)<br />
Year dummy (1989-1990 = 1)<br />
Coefficients<br />
Note: *, **, and *** significant at 10%, 5%, and l%, respectively.<br />
Standard error<br />
Standard error<br />
Standard error


