systems research - the IDRC Digital Library - International ...
systems research - the IDRC Digital Library - International ... systems research - the IDRC Digital Library - International ...
Table 6. Comparison of annual farm expenses (P) across degrees of adoption. Labor wages Fertilizer Pesticide Seed Implements Others Total Degree of adoption Year Low Medium High Note: Means followed by the same letter or its absence are not significantly different.
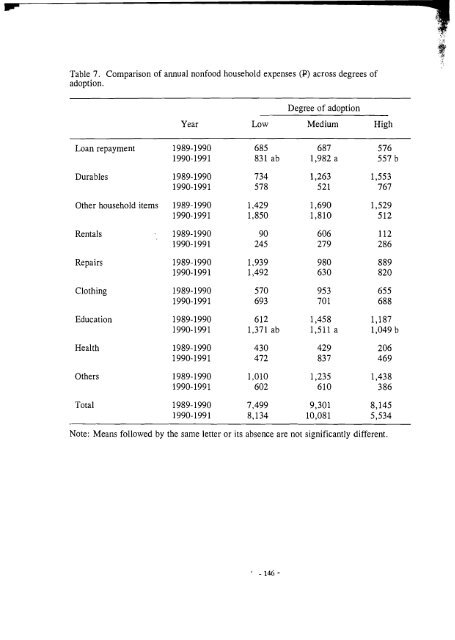
Table 7. Comparison of annual nonfood household expenses (P) across degrees of adoption. Loan repayment Durables Other household items Rentals Repairs Clothing Education Health Others Total Degree of adoption Year Low Medium High Note: Means followed by the same letter or its absence are not significantly different.
- Page 111 and 112: THE 1'\VO ;MATURE TECHNOLOGIES Dire
- Page 113 and 114: Conceptual framework STUDY METHODS
- Page 115 and 116: Tai. Mungbean was introduced in Dok
- Page 117 and 118: Land preparation for rice. The reac
- Page 119 and 120: price of mungbean was high, some fa
- Page 121 and 122: manufacturers. The earlier models (
- Page 123 and 124: Net farm income per household The a
- Page 125 and 126: that although adopters were better
- Page 127 and 128: W It produced a good stand of rice
- Page 129 and 130: Table l. The promising technologies
- Page 131 and 132: Table 3. Mungbean before rice areas
- Page 133 and 134: Table 5. Number of farm households
- Page 135 and 136: Table 7. Area planted to mungbean,
- Page 137 and 138: Table 9. Area planted to mungbean,
- Page 139 and 140: Table 11. Area under dry seeded ric
- Page 141 and 142: continued.. . Table 12. Socioeconom
- Page 143 and 144: continued.. . Table 12. Socioeconom
- Page 145 and 146: l~ndicative figures only. '~ature t
- Page 147 and 148: composition, increases in income ca
- Page 149 and 150: not be captured if the criteria for
- Page 151 and 152: crops (rice, maize, and mungbean) a
- Page 153 and 154: The explanatory Lwiable, nitrogen (
- Page 155 and 156: of the ratio of actual intake and r
- Page 157 and 158: Farming Systems Research and Extens
- Page 159 and 160: Table 3. Input levels and productiv
- Page 161: Table 5. Comparison of annual house
- Page 165 and 166: Table 9. Comparison of percentage p
- Page 167 and 168: Table 11. Log-linear models of impa
- Page 169 and 170: INSTITUTIONALIZING THE FARILIIIVG S
- Page 171 and 172: agricultural production system by i
- Page 173 and 174: In the midwest plain, where there a
- Page 175 and 176: Varietal irnprovernent. This compon
- Page 177 and 178: solutions to problems under the bas
- Page 179 and 180: Table 2. Rice farming systems in Ca
- Page 181 and 182: Table 5. Component-technology studi
- Page 183 and 184: Wangwacharachul (1984) examined the
- Page 185 and 186: household basis on an income and ex
- Page 187 and 188: first crop. In 1989-90, the adopter
- Page 189 and 190: Nonfarm expenses constituted the bu
- Page 191 and 192: Herbicide is essential for DSR. How
- Page 193 and 194: o The classification of farmers on
- Page 195 and 196: Table 1. List of \,ariables idc~l~l
- Page 197 and 198: Table 3. Conlparison of cash flow o
- Page 199 and 200: Table 5. Level of input use for the
- Page 201 and 202: Table 7. Production elasticities of
- Page 203 and 204: FROXl GREEN REVOLUTION TO FARhlING
- Page 205 and 206: ainfed areas. The RIARS project app
- Page 207 and 208: stability and sustainability. 1nsti
- Page 209 and 210: o Limited feedback at all levels. A
- Page 211 and 212: Table l. Chronological sequcnce of
Table 7. Comparison of annual nonfood household expenses (P) across degrees of<br />
adoption.<br />
Loan repayment<br />
Durables<br />
O<strong>the</strong>r household items<br />
Rentals<br />
Repairs<br />
Clothing<br />
Education<br />
Health<br />
O<strong>the</strong>rs<br />
Total<br />
Degree of adoption<br />
Year Low Medium High<br />
Note: Means followed by <strong>the</strong> same letter or its absence are not significantly different.


