observational overview of state transitions in x-ray binaries
observational overview of state transitions in x-ray binaries
observational overview of state transitions in x-ray binaries

You also want an ePaper? Increase the reach of your titles
YUMPU automatically turns print PDFs into web optimized ePapers that Google loves.
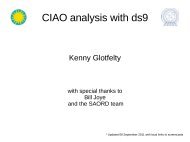
COLOR EVOLUTION<br />
hard s<strong>of</strong>t<br />
hardest = power-law com<strong>in</strong>ated (<strong>in</strong>dex 1.5)<br />
s<strong>of</strong>test = accretion disk dom<strong>in</strong>ated (1 keV)<br />
GX 339-4<br />
hard<br />
hardness = 10.0-20.0 keV / 3.0-5.0 keV<br />
The next panel I’m add<strong>in</strong>g shows the evolution <strong>of</strong> the spectral hardness, which is a simple<br />
ratio <strong>of</strong> count rates <strong>in</strong> two energy bands, <strong>in</strong> this case the 10-20 keV and 3.0/5.0 keV. It<br />
shows that the outburst starts with the source hav<strong>in</strong>g a hard spectrum, switch<strong>in</strong>g to a s<strong>of</strong>t<br />
spectrum, and at the end back to a hard spectrum. In this case the hardest spectra<br />
correspond to power-law dom<strong>in</strong>ated spectra, with an <strong>in</strong>dex <strong>of</strong> around 1.5, while the s<strong>of</strong>test<br />
ones are accretion disk dom<strong>in</strong>ated, with a typical temperature <strong>of</strong> 1 keV. Note that the<br />
behavior seen <strong>in</strong> other black hole transients is mostly consistent with this, i.e. go<strong>in</strong>g from<br />
hard to s<strong>of</strong>t and back to hard. By comb<strong>in</strong><strong>in</strong>g these two curves <strong>in</strong>to a hardness-<strong>in</strong>tensity<br />
diagram, we can see how this spectral evolution occurs as a function <strong>of</strong> the overall <strong>in</strong>tensity<br />
level.