A new yield function for geomaterials. - Ingegneria - Università degli ...
A new yield function for geomaterials. - Ingegneria - Università degli ...
A new yield function for geomaterials. - Ingegneria - Università degli ...

Create successful ePaper yourself
Turn your PDF publications into a flip-book with our unique Google optimized e-Paper software.
278 Davide Bigoni, Andrea Piccolroaz<br />
Table 3. Correspondence between parameters of (6)-(9) and Deshpande and Fleck (2002) <strong>yield</strong><br />
<strong>function</strong>s —the latter shortened as ‘DF model’— to describe the behaviour of metallic foams.<br />
DF model<br />
Y ,α 2α<br />
Model (6)-(9) DF model<br />
M c pc Y α<br />
<br />
Y<br />
1+<br />
α<br />
<br />
α<br />
<br />
<br />
2 Y<br />
1+<br />
3 α<br />
Model (6)-(9)<br />
M,pc,c — — —<br />
<br />
α<br />
2 3<br />
<br />
2<br />
— —<br />
cM<br />
1+ M<br />
6<br />
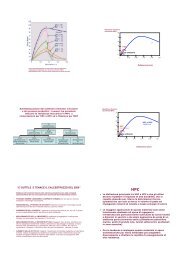
where f is the void volume fraction (taking the values {0.01, 0.1, 0.3, 0.6 } in Fig. 10),<br />
σM is the equivalent flow stress in the matrix material and q1 =1.5, q2 =1and<br />
q3 = q 2 1 are the parameters introduced by Tvergaard (1981, 1982). A good agreement<br />
between the two models can be appreciated from Fig. 10, increasing when the void<br />
volume fraction f increases.<br />
q/ M<br />
1<br />
0.8<br />
0.6<br />
0.4<br />
0.2<br />
0.6<br />
0.3<br />
0.1<br />
0.5 1 1.5 2 2.5 3 3.5<br />
p/ <br />
Present model<br />
Gurson model<br />
f = 0.01<br />
Figure 10. Comparison with the Gurson model at different values of void volume fraction f.<br />
As far as the deviatoric section is regarded, we limit to two examples —reported<br />
in Fig. 11— concerning sandstone and dense sand, where the experimental data have<br />
been taken from Lade (1997, their Figs. 2 and 9a).<br />
Experimental data referred to the biaxial plane σ 3 =0<strong>for</strong> grey cast iron and concrete<br />
(taken respectively from Coffin and Schenectady, 1950, their Fig. 5 and Tasuji et<br />
al. 1978, their Figs. 1 and 2) are reported in Fig. 12.<br />
2<br />
M<br />
2