A new yield function for geomaterials. - Ingegneria - Università degli ...
A new yield function for geomaterials. - Ingegneria - Università degli ...
A new yield function for geomaterials. - Ingegneria - Università degli ...

Create successful ePaper yourself
Turn your PDF publications into a flip-book with our unique Google optimized e-Paper software.
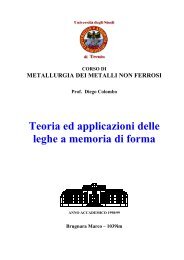
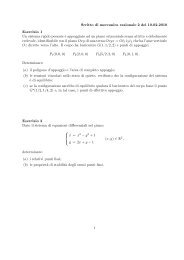
On a <strong>yield</strong> <strong>function</strong> 275<br />
q (MPa)<br />
0.8<br />
0.6<br />
0.4<br />
0.2<br />
0.2<br />
0.4<br />
(a) (b)<br />
0.2 0.4 0.6 0.8 1<br />
= <br />
= <br />
p (MPa)<br />
q/p e<br />
0.6<br />
0.4<br />
0.2<br />
- 0.2<br />
- 0.4<br />
0.2 0.4 0.6 0.8 1<br />
p/p e<br />
=0 =0<br />
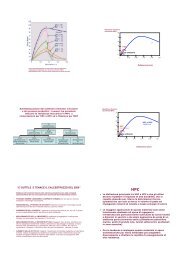
Figure 5. Comparison with experimental results relative to sand (Yasufuku et al. 1991) (a)<br />
and clay (Parry, reported by Wood, 1990) (b).<br />
and Fleck (2000) —their Figs. 5(b) and 9(c)— relative to ductile powders is reported<br />
in Fig. 6. In particular, Fig. 6(a) is relative to an aluminum powder (Al D 0=0.67,<br />
D=0.81 in Sridhar and Fleck, their Fig. 5b), Fig. 6(b) to an aluminum powder rein<strong>for</strong>ced<br />
by 40 vol.%SiC (Al-40%Sic D0=0.66, D=0.82 in Sridhar and Fleck, their<br />
Fig. 5b), Fig. 6(c) to a lead powder (0% steel in Sridhar and Fleck, their Fig. 9c), and<br />
Fig. 6(d) to a lead shot-steel composite powder (20% steel in Sridhar and Fleck, their<br />
Fig. 9c). Beside the fairly good agreement between experiments and proposed <strong>yield</strong><br />
<strong>function</strong>, we note that the aluminium powder has a behaviour —different from soils<br />
and lead-based powders— resulting in a meridian section of the <strong>yield</strong> surface similar<br />
to the early version of the Cam-clay model (Roscoe and Schofield, 1963).<br />
Regarding concrete, among the many experimental results currently available, we<br />
have referred to Sfer et al. (2002, their Fig. 6) and to the Newman and Newman (1971)<br />
empirical relationship<br />
σ1<br />
fc<br />
=1+3.7<br />
σ3<br />
fc<br />
0.86<br />
, (16)<br />
where σ1 and σ3 are the maximum and minimum principal stresses at failure and f c<br />
is the value of the ultimate uniaxial compressive strength. Small circles in Fig. 7 represents<br />
results obtained using relationship (16) in figure (a) and experimental results<br />
by Sfer et al. (2002) in figure (b); the approximation provided by the criterion (7)-(8)<br />
is also reported as a continuous line.<br />
As far as rocks are concerned, we limit to a few examples. However, we believe<br />
that due to the fact that our criterion approaches Coulomb-Mohr, it should be particularly<br />
suited <strong>for</strong> these materials. In particular, data taken from Hoek and Brown (1980,<br />
their pages 143 and 144) are reported in Fig. 8 as small circles <strong>for</strong> two rocks, chert<br />
(Fig. 8a) and dolomite (Fig. 8b).<br />
A few data on polymers are reported in Fig. 9 —together with the fitting provided<br />
by our model— concerning polymethil methacrylate (Fig. 9a) and an epoxy binder